The U.S. dollar paused on Wednesday as softer crude oil prices helped revive some risk appetite ahead of a series of major central bank decisions.
The yen remained fragile near levels that have previously raised concerns about possible intervention by Tokyo, especially with Japanese Prime Minister Sanae Takaichi set to meet U.S. President Donald Trump in Washington. Meanwhile, the euro slipped slightly after two sessions of gains, as the European Central Bank prepared to kick off its two-day policy meeting.
Amid the ongoing Middle East crisis, now in its third week, the dollar has strengthened as the primary safe-haven currency. However, oil prices edged lower after data from the American Petroleum Institute indicated a rise in U.S. crude inventories.
According to Hirofumi Suzuki, chief FX strategist at Sumitomo Mitsui Banking Corporation, while the pause in oil’s rally hasn’t dramatically improved conditions, markets are showing signs of stabilization. He noted that USD/JPY has moved modestly in favor of yen strength.
The dollar index rose slightly by 0.06% to 99.61 following a two-day decline, while the euro dipped 0.05% to $1.1532. The yen weakened marginally to 159 per dollar, and sterling remained steady at $1.3355.
The greenback had surged to a 10-month high late last week, driven by geopolitical tensions and rising oil prices that pushed investors toward safer U.S. assets.
Highlighting the broader impact of the crisis, Trump announced he would delay a planned trip to Beijing to meet Chinese President Xi Jinping. Takaichi is expected to leave for Washington later Wednesday.
Analysts at Mizuho Securities noted that even if the conflict drags on, equities could rebound, supporting commodity-linked currencies like the Australian dollar, as well as currencies of oil-importing nations such as the yen and euro. However, they expect limited downside for USD/JPY, partly due to the Japanese government’s preference for a weaker yen.
Attention now turns to central banks, with the Federal Reserve set to announce its decision Wednesday, followed by the ECB, Bank of England, and Bank of Japan a day later. All are widely expected to hold rates steady, though markets will closely watch their outlooks on inflation and growth amid geopolitical uncertainty.
Expectations for Fed rate cuts have been trimmed to around 25 basis points this year. Meanwhile, traders are now pricing in more than one ECB rate hike in 2026—a notable shift from earlier expectations of potential cuts.
Elsewhere, the Australian dollar gained 0.1% to $0.7109, and the New Zealand dollar rose 0.05% to $0.586. In crypto markets, bitcoin slipped 0.40% to $74,257.80, while Ethereum edged up 0.22% to $2,333.60.
For investors aiming to build reliable passive income and long-term wealth, dividend stocks continue to stand out as some of the most dependable assets. Among the most consistently favored names are The Coca-Cola Company and Walmart Inc..
Both companies belong to the elite group known as Dividend Kings — firms that have increased their dividends for at least 50 consecutive years. Their proven resilience and steady growth make them particularly attractive for long-term investors. Whether constructing a retirement portfolio or seeking stable income-generating holdings, these two consumer giants remain strong candidates.
Coca-Cola and Walmart: Enduring Dividend Leaders
Coca-Cola has delivered 63 straight years of dividend increases, reinforcing its reputation as a cornerstone income stock. It currently offers a yield of around 2.65%, supported by solid price performance, with shares up more than 10% year-to-date and over 77% in the past five years.
Its strength lies beyond dividends. With a portfolio of 32 billion-dollar brands, a deeply loyal global customer base, and a localized production strategy that helps mitigate tariff pressures, Coca-Cola continues to maintain a competitive edge that investors value.
Walmart, on the other hand, has raised its dividend for 53 consecutive years and operates the world’s largest retail network, spanning over 5,000 stores in the U.S. and nearly 11,000 globally. While its dividend yield is lower at roughly 0.79%, its total return profile is exceptional — the stock has surged more than 200% over five years, far outpacing the S&P 500.
Importantly, Walmart’s growth is no longer tied solely to its physical stores. Its e-commerce division expanded 24% year-over-year in fiscal Q4 2026, while its Walmart+ subscription service continues to grow, adding a high-margin recurring revenue stream.
Both companies operate within the consumer defensive sector, meaning demand for their products remains stable regardless of economic conditions. Essentials like food, beverages, and household goods are always needed, making these businesses naturally resilient. Combined with decades of disciplined dividend growth, this stability underpins their role as long-term portfolio anchors.
Stock Snapshot: Performance and Market Outlook
As of mid-March 2026, Coca-Cola trades at $77.49 with a market capitalization of roughly $333 billion. It has a trailing P/E ratio of 25.49 and generated $3.04 in earnings per share over the past year, consistently exceeding analyst expectations. The company also boasts a strong return on equity of over 43%, alongside annual revenue nearing $48 billion and profit margins above 27%.
Analyst sentiment remains positive, with an average price target of $83.36. Notably, Barclays recently raised its target to $83 while maintaining an overweight rating.
Walmart trades around $126.07, with a market value exceeding $1 trillion. Its higher P/E ratio of 46.17 reflects the premium investors are willing to pay for its consistent growth and execution.
Over the past 12 months, Walmart generated more than $713 billion in revenue and nearly $22 billion in net income, along with strong free cash flow of $7.77 billion — supporting both dividend increases and ongoing investments.
Analysts remain optimistic. Mizuho Financial Group rates the stock as outperform, while Tigress Financial Partners recently lifted its price target to $150.
Overall, both stocks demonstrate not only dependable income potential but also strong capital appreciation. Coca-Cola has outperformed the broader market so far in 2026, while Walmart’s nearly 202% five-year gain highlights its ability to generate superior long-term returns. Investors holding these names benefit from a powerful combination of rising dividends and sustained growth that often matches or exceeds market benchmarks.
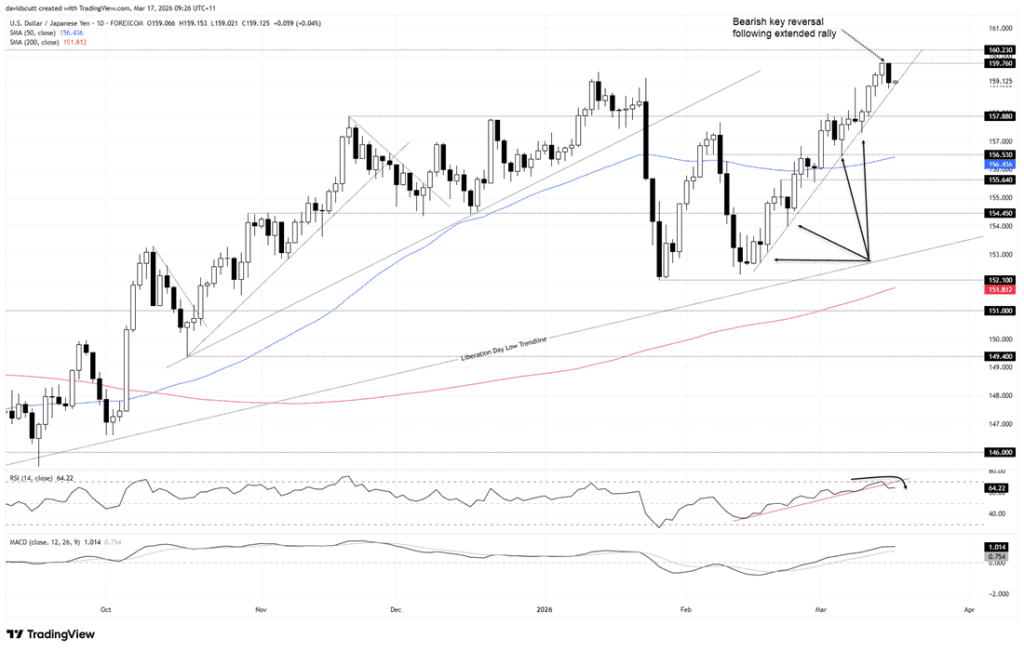
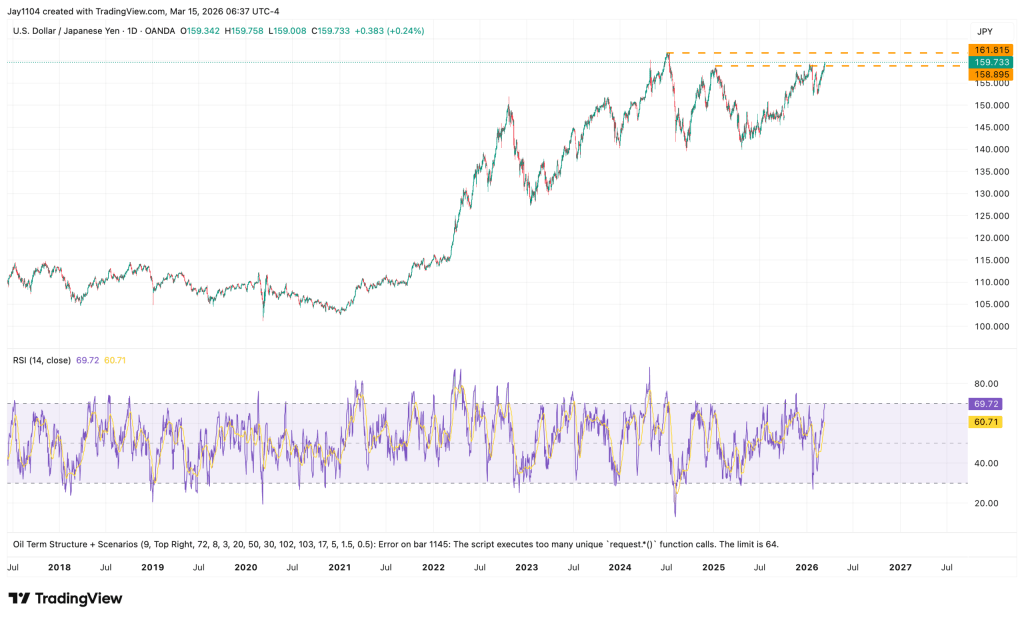
USD/JPY’s recent dip has left it caught between firm uptrend support and growing concerns about potential intervention as it approaches the 160 mark. Traders now face a key question: does this bearish signal point to a deeper correction, or is it merely a temporary pause in the broader rally?
Pullback brings USD/JPY toward key support around 159
Intervention fears resurface near the 160 threshold
Attention shifts to the RBA decision and upcoming JGB auction
Reversal Highlights Tension Within the Uptrend
USD/JPY fell sharply on Monday, though the drivers behind the move were not particularly compelling.
The decline coincided with a sudden pullback in the US dollar and a drop in Treasury yields, despite a lack of meaningful new macro developments. At the same time, crude oil prices reversed earlier gains even as no additional countries committed to joining the United States in protecting tanker routes through the Strait of Hormuz. Given how energy supply concerns have recently underpinned the dollar, this suggests the move was more about positioning adjustments than a shift in the broader macro outlook.
For USD/JPY, the timing stands out. Japan’s finance minister, Satsuki Katayama, signaled readiness to take “decisive action” to curb excessive currency volatility as the pair neared 160. Considering Japan’s track record of intervening or conducting rate checks around this level, such remarks likely prompted traders to scale back long positions, accelerating the pullback.
A single bearish reversal candle is rarely enough to shift the narrative—especially when it appears without a clear fundamental catalyst. Without follow-through selling, Monday’s move in USD/JPY is more likely to be seen as a pause rather than confirmation of a broader trend reversal.
Technically, the pair is at a crossroads.
USD/JPY is now testing uptrend support drawn from the January lows, while hovering just above the 159.00 zone—a level that previously acted as strong resistance before being broken last week.
At the same time, momentum is starting to fade. The RSI (14) has broken its upward trajectory, and the MACD is flattening and drifting back toward its signal line after a prolonged climb. When this kind of momentum deterioration shows up at key support, it typically forces a decisive move.
So the setup boils down to two scenarios:
A continuation of selling that breaks trend support, opening the door for a deeper pullback toward 157.88
Or a defense of the uptrend, despite rising risks of Japanese intervention as price nears the psychologically important 160 level
Recent price action has largely been driven by sentiment around energy supply disruptions. The United States benefits from relative energy independence, while Japan—heavily reliant on imports—tends to see its currency weaken when oil prices surge. However, Monday’s reversal in crude oil hints that this geopolitical tailwind for the dollar may be fading.
Macro catalysts could now take the lead.
The upcoming policy decision from the Reserve Bank of Australia (RBA) may influence broader G10 currency flows. Markets are pricing only about a 62% chance of a 25bps hike, but if delivered, it would reinforce the divergence between a potentially easing Federal Reserve and other central banks that may still tighten—potentially pressuring the US dollar.
On the flip side, if the RBA holds rates steady, it could signal broader caution among central banks, which may end up supporting the dollar instead.
Bond markets also matter here.
20-year government bond auctions in both Japan and the US could offer additional clues. Demand for Japanese government bonds is particularly important—weak demand may reignite yen weakness, while strong bidding could stabilize sentiment and lend support to the currency.
In short, USD/JPY is no longer just a technical story. It’s sitting at the intersection of fading momentum, intervention risk, and shifting macro drivers—making the next move especially pivotal.
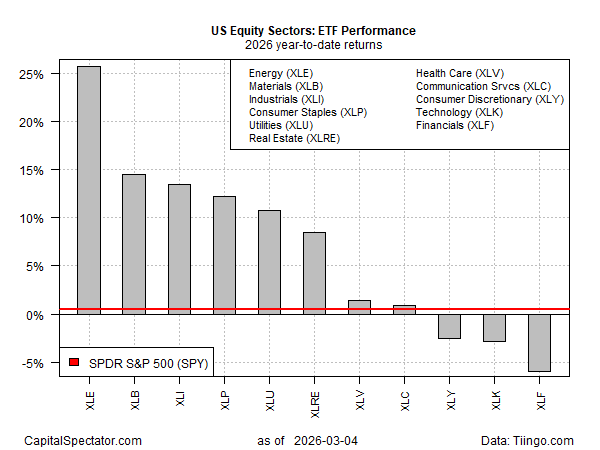
Utilities are outperforming the S&P 500, signaling growing investor demand for defensive positioning.
Consumer Staples and Health Care present mixed signals as traders evaluate potential rotation into risk-off sectors.
Tracking both absolute and relative sector strength can offer insight into broader market risk.
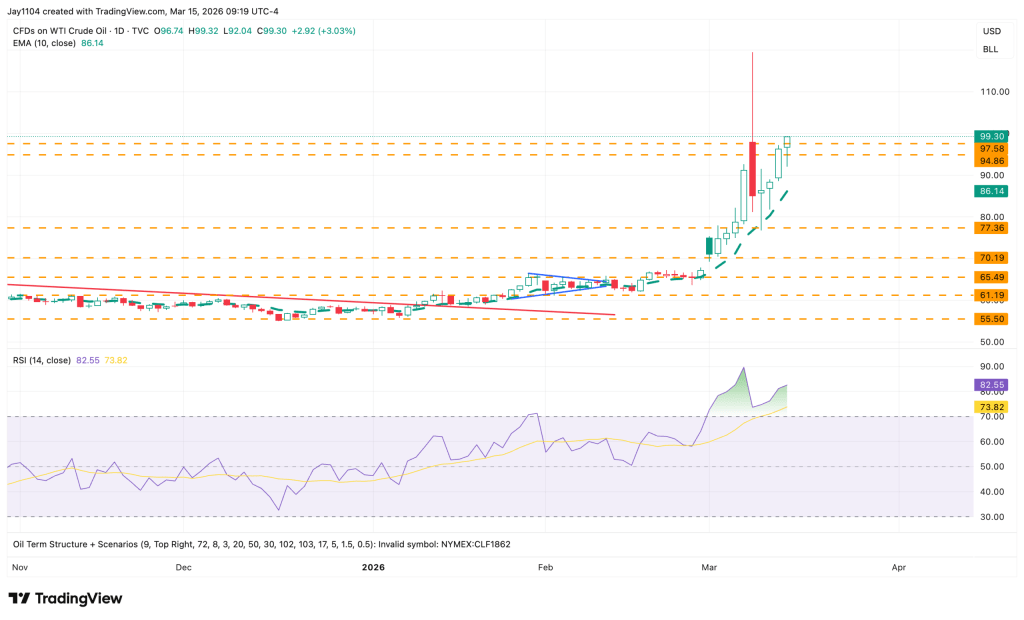
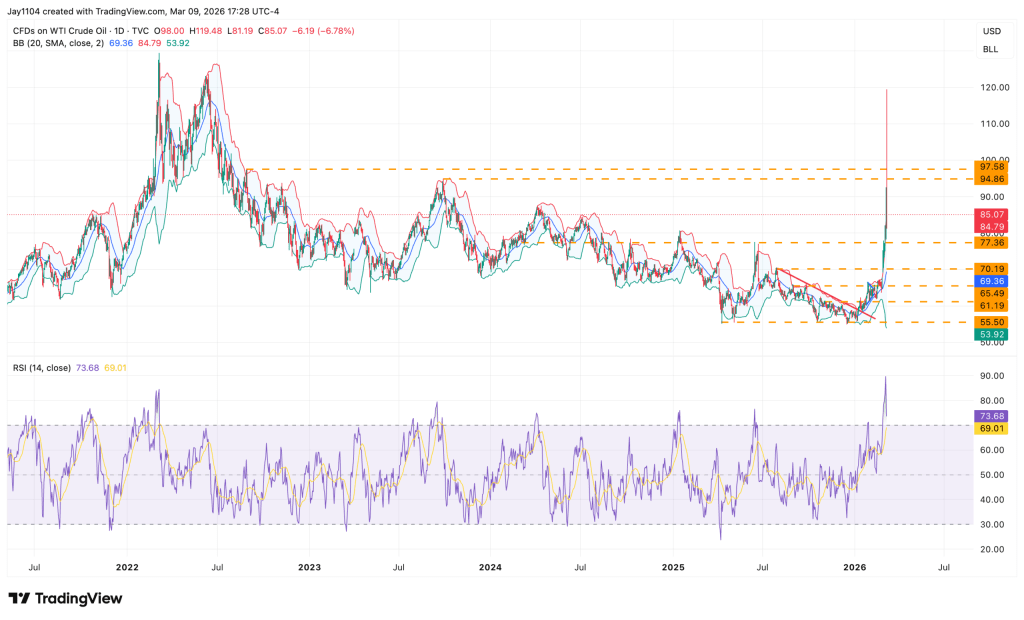
It’s March Madness on Wall Street: the VIX remains in the mid-20s, WTI crude oil has climbed back to $100, and bearish momentum continues to build. With “defense wins championships” in mind, traders may be weighing whether bracing for further downside is the prudent strategy.
In that context, sector analysis deserves a spot in your playbook. Within the 11 S&P 500 sectors, Utilities, Consumer Staples, Health Care, and Real Estate are typically viewed as less cyclical, lower-growth, defensive areas. Together, they account for about 18.5% of the index (under 10% excluding Health Care). From a portfolio standpoint, shifting heavily into these sectors represents a meaningful active bet. If sentiment flips and bulls regain control, a sharp rebound could quickly punish defensive positioning.
Even so, opportunities may lie beyond the high-growth “headline” sectors. Let’s take a closer look.
Utilities Gaining Momentum
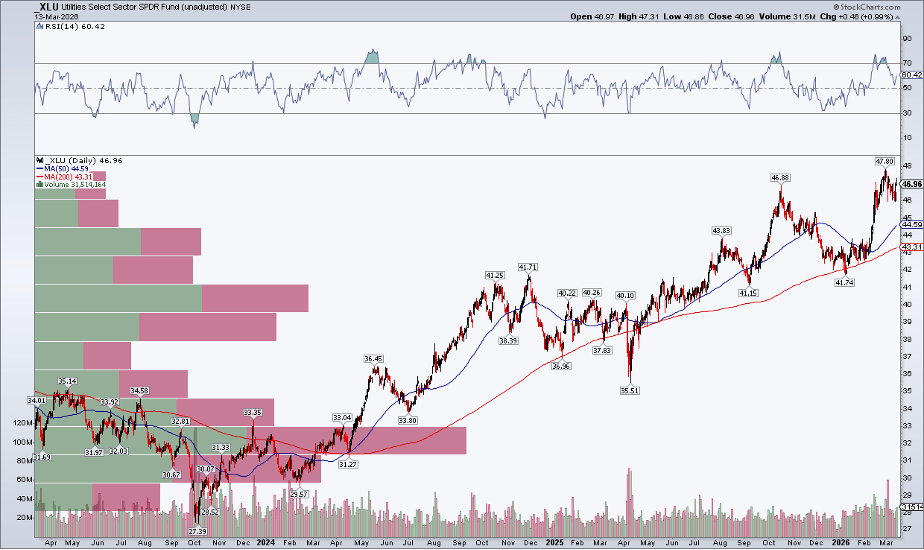
Starting with Utilities (XLU), it’s useful to assess both absolute and relative price action. The sector ETF remains firmly in an uptrend.
As shown in the chart, a pattern of higher highs and higher lows has persisted since September 2023. The upward-sloping 200-day moving average indicates that bulls still dominate the primary trend. Meanwhile, the RSI momentum indicator has frequently reached overbought territory—often a sign of strength rather than weakness. In short, XLU continues to show strong upside momentum.
XLU remains in a strong uptrend and is trading near record highs.
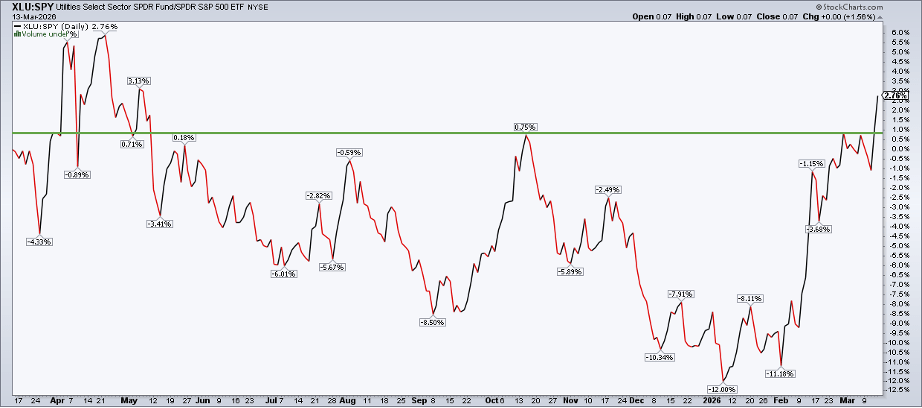
But how does it compare to the S&P 500 ETF (SPY)?
To check, enter “XLU:SPY” in the SharpCharts symbol box (or “_XLU:_SPY” for a price-only view). As of last Friday, the ratio hit its highest level since May 2025, breaking above key resistance.
In short, relative strength is shifting toward Utilities, which implies a more bearish tilt for the broader S&P 500.
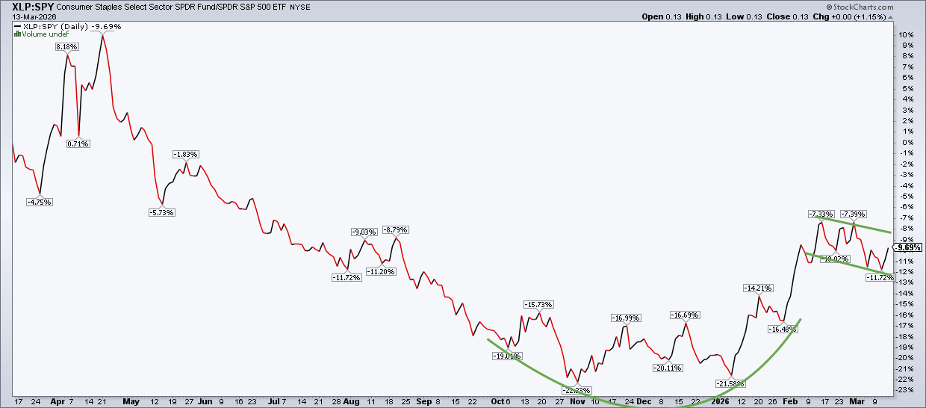
Staples Near a Crucial Support Zone
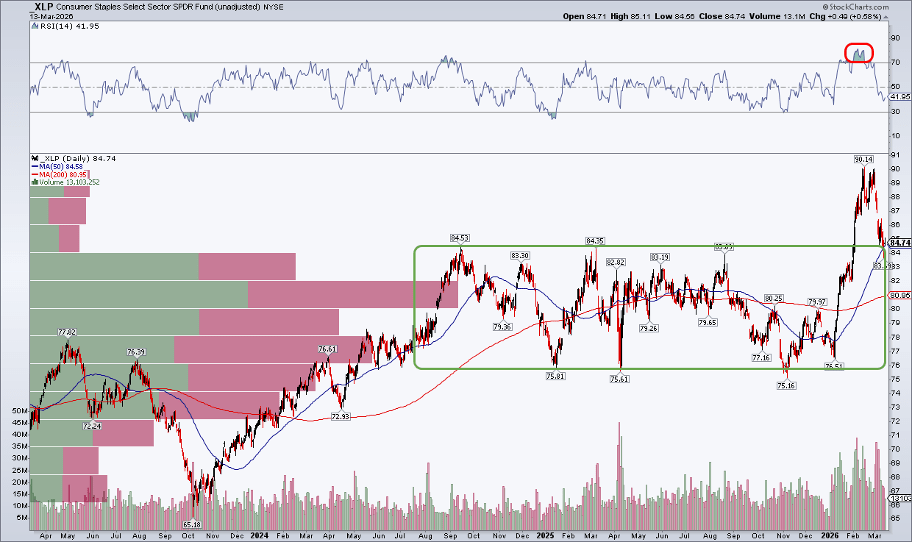
Looking at Consumer Staples (XLP), the price trend is less decisive. The ETF is edging closer to correction territory, pulling back toward key support around $84 and its 50-day moving average. Given the strong volume-by-price concentration in the mid-$80s, there’s an expectation buyers may step in at this level. The coming weeks will be pivotal.
Similarly, the XLP:SPY ratio is not as well-defined as XLU:SPY. It formed a rounded bottom around the start of the year and has since moved into a consolidation phase—potentially a bull flag.
From a technical perspective, consolidations typically break in the direction of the broader trend—which is upward here. That suggests XLP could maintain support near $84 and resume outperforming the S&P 500 in the weeks and months ahead.
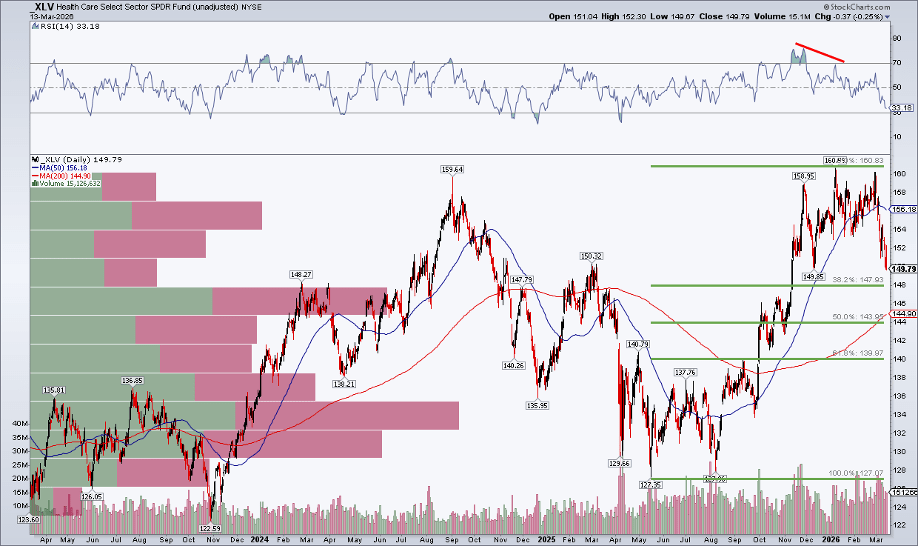
Health Care Still on the Sidelines
Turning to Health Care (XLV), the chart shows a clear bearish double top, with sellers stepping in twice around the $160 level—first in Q3 2024 and again more recently over an extended period.
The sector, which includes defensive pharmaceutical firms, somewhat cyclical medical device makers, and higher-risk biotech names, has seen its RSI drop to its weakest level since just after Liberation Day. Meanwhile, the rising 200-day moving average sits only a few percentage points below the current price. In addition, after breaking below an upward trendline, the next key level to watch is the 38.2% Fibonacci retracement near $148.
Overall, XLV looks better left on the sidelines for now.
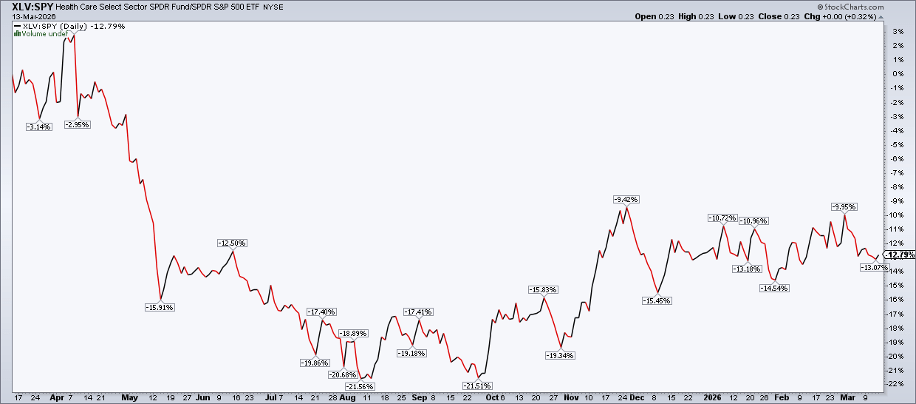
XLV:SPY lacks a compelling setup. The sector found a bottom last August, showed some strength in November, but has largely moved sideways since December.
Much like how Walmart and Costco lead the Staples space, Health Care performance is heavily driven by Eli Lilly, Johnson & Johnson, and UnitedHealth Group.
Don’t Overcomplicate the Defensive Trade
At a high level, it’s easy to get lost comparing relative strength across defensive, cyclical, and growth sectors. But the reality is simple: risk-off areas like Utilities, Staples, and Health Care can rally—and have done so multiple times during this bull market. In fact, companies such as Walmart, Costco, and Eli Lilly often behave more like growth stocks than traditional defensive names.
The takeaway: sector analysis—including relative strength—is just one tool within a broader top-down and intermarket framework.
When Defensive Strength Signals Trouble
So when does outperformance in defensive sectors shift from a caution sign to a real warning? If Utilities, Staples, Health Care (and possibly Real Estate) start showing relative strength while declining in absolute terms, it’s usually a sign the S&P 500 is under pressure.
There have been early hints of this dynamic alongside the index’s bearish rounded top, but so far it’s been inconsistent rather than decisive. While it’s not ideal for defensive sectors to lead, such phases can persist longer than expected.
Bottom Line
While attention is centered on Energy and Technology—with $100 oil and NVIDIA grabbing headlines—along with Financials facing stress from private credit concerns, traders shouldn’t ignore the defensive sectors. Monitoring both absolute and relative trends in these areas can provide clarity and help filter out noise during volatile market conditions.
Oil jumps more than 2% as markets assess supply threats from the Iran conflict.
Oil prices rebounded over 2% early Tuesday, recovering part of the previous session’s losses as supply concerns intensified amid major disruptions in the Strait of Hormuz.
Brent crude climbed to around $102.69 a barrel, while WTI rose to about $95.92. The gains follow a sharp selloff in the prior session, when prices dropped after some tankers managed to pass through the key shipping route.
The Strait of Hormuz—responsible for roughly 20% of global oil and LNG trade—has been largely disrupted by the ongoing US-Israel conflict with Iran, now in its third week, heightening fears of supply shortages, rising energy costs, and persistent inflation.
Tensions remain elevated as several US allies declined calls to deploy naval escorts for tankers, while risks of further attacks on shipping continue to threaten stability in the region. Iran has also sought the release of seized Indian tankers as part of efforts to secure safe passage through the Gulf.
The disruption has already forced the UAE to cut oil output by more than half, tightening global supply. In response to rising energy costs, the International Energy Agency is considering additional releases from strategic reserves beyond the 400 million barrels already planned.
Meanwhile, major banks have raised their oil price forecasts, reflecting the risk of prolonged supply disruptions. Scenarios range from a quick resolution that pushes prices back toward $70 to an extended conflict that could drive Brent toward $85 or higher.
Security sources report that drones and rockets were launched at the US embassy in Baghdad.
Several rockets and at least five drones targeted the US embassy in Baghdad early Tuesday, in what Iraqi security sources described as the most severe attack since the US–Israel conflict with Iran began.
Witnesses saw multiple drones heading toward the compound, with air defenses intercepting some, while at least one hit inside the embassy, sparking fire and smoke. Blasts were also reported across the city.
The strike reflects escalating retaliation by Iran-backed militias against US interests in Iraq following the war that started on February 28.
In response, Iraqi forces have increased security across Baghdad, shutting down the fortified Green Zone that houses key government buildings and diplomatic missions.
The US Dollar Index holds onto Monday’s pullback around the 100.00 mark as attention turns to the Fed’s policy decision.
Iran has permitted multiple countries to move their energy tankers through the Strait of Hormuz.
The Fed is widely anticipated to leave interest rates unchanged on Wednesday.
The US Dollar (USD) is holding onto Monday’s corrective move, which was triggered by a sharp pullback in oil prices that helped ease concerns about unanchored consumer inflation.
At the time of writing, the US Dollar Index (DXY), which measures the Greenback against a basket of six major currencies, is edging slightly higher near 99.90.
The index retreated notably from Friday’s more-than-nine-month high of 100.54 as oil prices dropped after Iran permitted several countries to transport oil and Liquefied Petroleum Gas (LPG) shipments through the Strait of Hormuz, potentially reducing worries over energy supply disruptions.
In recent weeks, the USD has rallied strongly, supported by its safe-haven appeal amid escalating tensions involving Iran, the United States, and Israel. Additionally, elevated oil prices have dampened expectations for near-term interest rate cuts by the Federal Reserve (Fed).
Data from the CME FedWatch tool suggests that markets are largely convinced the Fed will keep rates unchanged until at least the September meeting, with the probability of a rate cut at that time standing at around 50%.
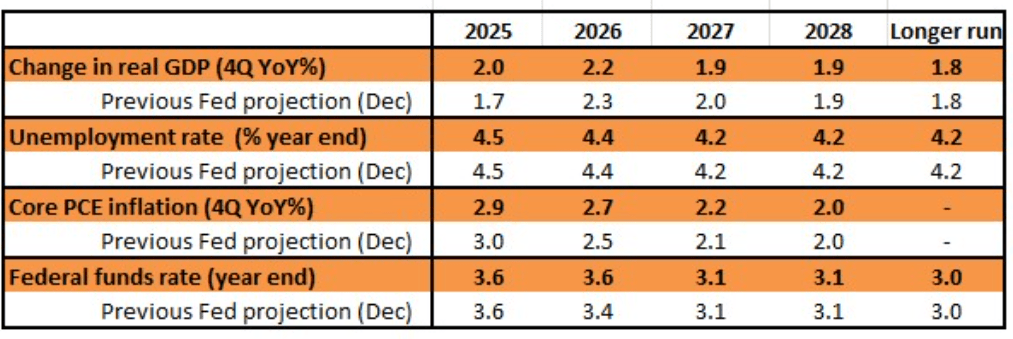
Looking ahead, investors will closely watch Wednesday’s Fed policy decision for further guidance. Attention will also be on the FOMC’s Economic Projections report, which will provide updated forecasts for interest rates, inflation, and economic growth.
WTI
WTI prices advance to around $94.20 during early Tuesday trading in Asia.
Rising geopolitical tensions in the Middle East continue to support crude prices.
The IEA is considering releasing additional oil reserves to mitigate the economic fallout from the US–Israel conflict with Iran.
West Texas Intermediate (WTI), the US crude benchmark, is hovering near $94.20 during early Tuesday trading in Asia, supported by ongoing tensions surrounding Iran, with no clear signs of de-escalation. Market participants are also awaiting the American Petroleum Institute (API) report due later in the day.
On Tuesday, the Israeli military reported detecting missiles launched from Iran toward Israeli territory, urging residents in impacted areas to seek shelter immediately. Meanwhile, the United Arab Emirates (UAE) announced a temporary full closure of its airspace as a precautionary step, with its defense ministry confirming responses to incoming missile and drone threats from Iran.
Fears of retaliatory Iranian strikes targeting ships, infrastructure, and key transit ports for oil shipments have raised concerns that the conflict could evolve into a prolonged regional war. Such risks may continue to provide near-term support for WTI prices.
However, on the supply side, the International Energy Agency (IEA) is considering releasing additional oil reserves into the global market to ease upward pressure on prices. The agency indicated a potential release of up to 400 million barrels, which, if coordinated among member countries, could temporarily boost supply and help limit sharp price spikes.
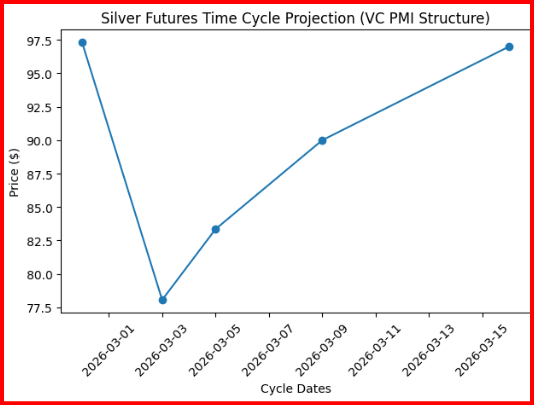
Silver (XAG/USD)
Silver declines as traders adjust positions ahead of Wednesday’s Federal Reserve policy decision.
Higher oil prices, driven by escalating tensions in the Middle East, are fueling inflation concerns and dampening expectations for near-term Fed rate cuts.
At the same time, geopolitical risks involving the United States, Iran, and Israel are helping to cap deeper losses by maintaining demand for safe-haven assets like silver.
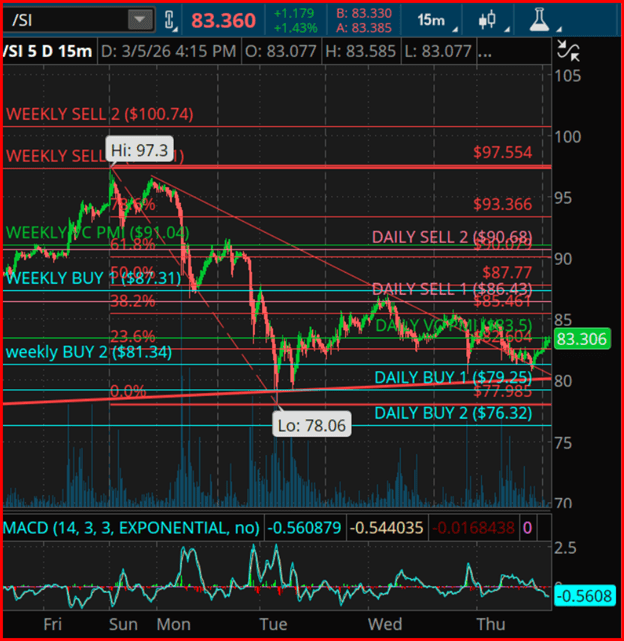
Silver (XAG/USD) is trading near $80.50 on Tuesday, down about 0.60% on the day. The metal remains under pressure as fading expectations for near-term US rate cuts—amid rising inflation concerns tied to Middle East tensions—continue to weigh on sentiment.
Markets broadly expect the Federal Reserve to keep its benchmark rate unchanged within the 3.50%–3.75% range at Wednesday’s meeting, according to the CME FedWatch tool. If confirmed, this would mark a second straight pause following the prior easing cycle. Prolonged higher rates tend to pressure non-yielding assets like Silver, as they raise the opportunity cost of holding them.
Escalating geopolitical tensions in the Middle East have driven Oil prices higher, fueling fears of persistent inflation. Rising gasoline costs in the US are adding strain on households and may keep inflation expectations elevated, reinforcing the case for the Fed to maintain restrictive policy for longer.
Geopolitical developments continue to influence the precious metals market. Recent US strikes on Iran’s key export hub on Kharg Island have intensified concerns over global energy supply disruptions. While Washington has indicated the conflict could be resolved within weeks and is exploring an international effort to secure shipping routes through the Strait of Hormuz, uncertainty remains high.
This fragile geopolitical backdrop may help limit further downside in Silver. As a safe-haven asset, it tends to attract demand during periods of heightened risk, which could cushion losses even as higher interest rate expectations dampen overall investor appetite.
Sources: Ghiles Guezout, Lallalit Srijandorn and Sagar Dua
Gold draws safe-haven demand as tensions in the Middle East escalate further.
Inflation concerns dampen expectations of Fed rate cuts, supporting the USD and limiting the metal’s upside.
Traders remain cautious, avoiding aggressive positions ahead of this week’s major central bank events.
Gold (XAU/USD) ticks modestly higher in Tuesday’s Asian session but struggles to build momentum, hovering near a three-week low reached the day before. Ongoing tensions in the Middle East continue to provide some support, as the conflict shows little sign of easing. Israel has expanded its ground operations in southern Lebanon—an area where Hezbollah maintains a strong presence—keeping geopolitical risks elevated and sustaining demand for the safe-haven metal.
Now in its third week, the conflict has seen Iran target civilian infrastructure across six Gulf nations, including airports, ports, oil facilities, and commercial centers, using missiles and drones. Disruptions in the Strait of Hormuz—a critical route for about one-fifth of global oil supply—have also kept crude prices elevated. This adds to inflation concerns, potentially pushing the Federal Reserve to maintain higher interest rates for longer or even consider further tightening, which in turn limits upside for non-yielding assets like gold.
At the same time, rising geopolitical tensions have revived demand for the US Dollar following a pullback from its highest level since May 2025, further capping gains in XAU/USD. However, USD bulls remain cautious ahead of the outcome of the Federal Open Market Committee (FOMC) meeting on Wednesday. Policy decisions from other major central banks, including the ECB, BoJ, and BoE, are also expected later in the week and could drive fresh volatility in gold prices.
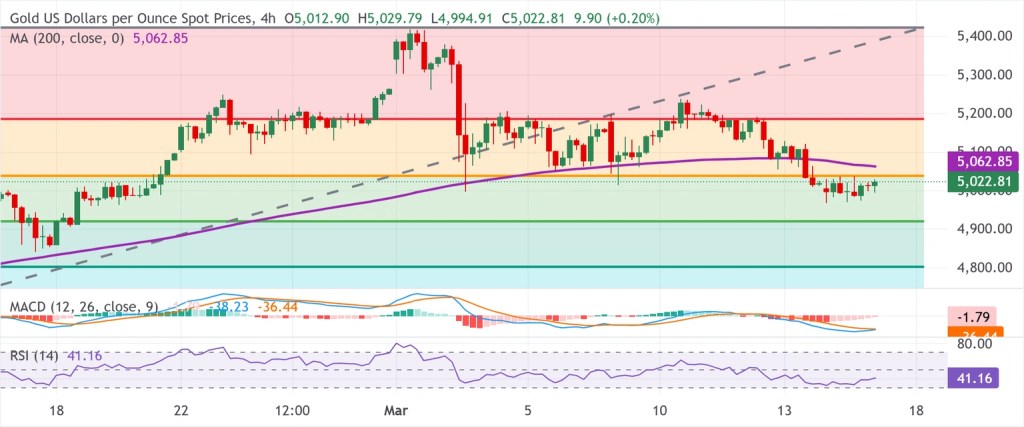
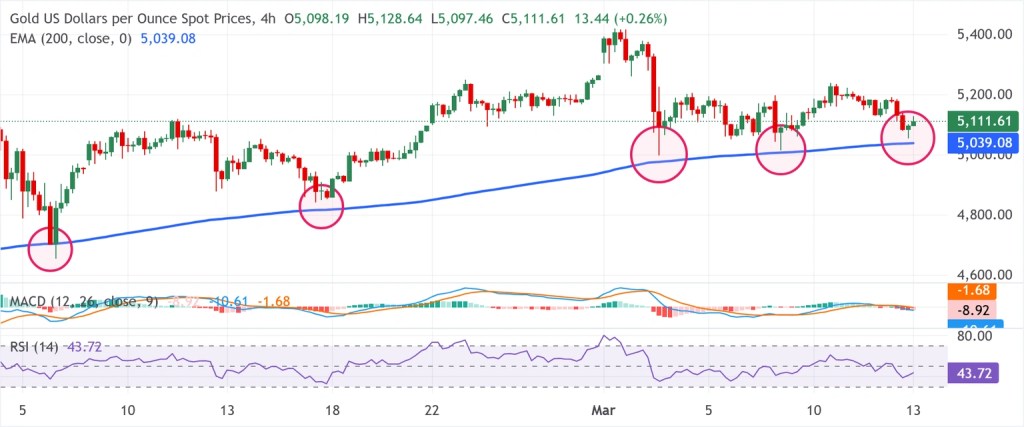
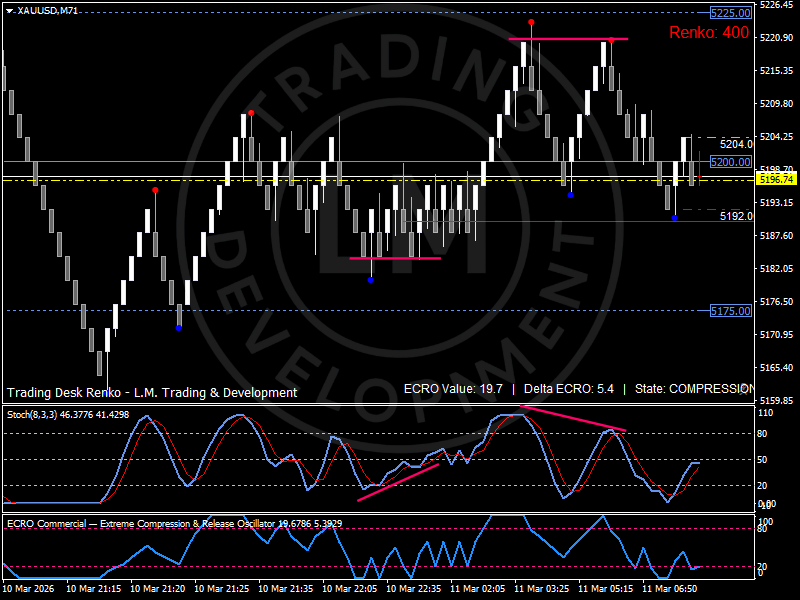
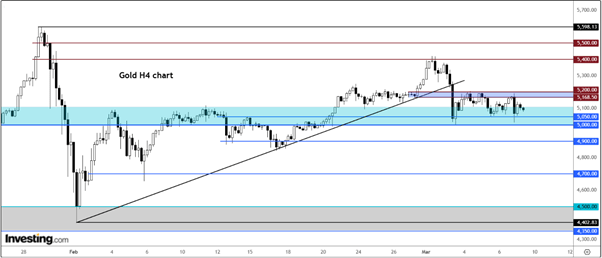
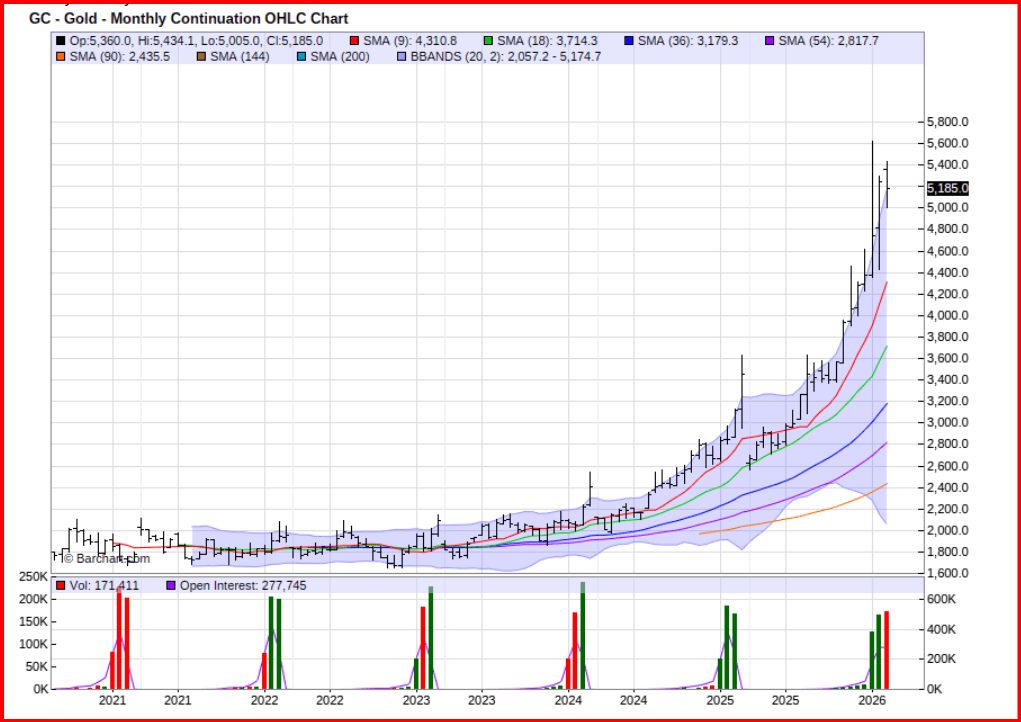
Gold (XAU/USD) on the 4-hour timeframe chart
Gold appears at risk, with a break below the 200-period SMA and the 38.2% Fibonacci level still in effect
Gold’s recent drop below the 200-period Simple Moving Average (SMA) on the 4-hour chart, along with sustained trading beneath the 38.2% Fibonacci retracement of the February–March rally, continues to favor bearish momentum in XAU/USD. The Moving Average Convergence Divergence (MACD, 12, 26, 9) remains in negative territory, with the MACD line below its signal line and a bearish histogram, pointing to ongoing downside pressure. Meanwhile, the Relative Strength Index (RSI) sits around 41, tilting toward the weaker side of neutral and suggesting sellers are still in control.
On the upside, initial resistance is seen near the 38.2% Fibonacci level around $5,040, followed by the 200-period SMA close to $5,063. A decisive move above this zone would help reduce bearish pressure and potentially pave the way toward the 23.6% retracement near $5,186. On the downside, immediate support lies at the key psychological level of $5,000, with further support around the recent lows between $4,995 and $4,985. A break below this area could open the door to a deeper pullback toward the 50.0% retracement at $4,921.41. A sustained move back above the 200-period SMA would weaken the bearish outlook, while continued rejection below $5,040 keeps the focus on further declines.
U.S. Strategy I: Roaring 2020s vs. Stagflating 1970s Redux
In last Tuesday’s QuickTakes, reacting to the latest Middle East conflict, we noted that although markets were already due for a pullback because of excessive bullish sentiment, the escalation increased the likelihood of a deeper correction. We suggested the market could fall around 10% from its peak, potentially reaching 15% if Iran’s Islamic Revolutionary Guard Corps (IRGC) succeeded in sustaining a blockade of the Strait of Hormuz using drones and fast boats.
Since then, much of Iran’s conventional naval capability has reportedly been destroyed. However, as long as the IRGC retains drone capabilities, the strategic waterway could remain effectively constrained. Donald Trump has authorized the United States Navy to escort vessels through the Strait, though the operation may take time to deploy and may not fully eliminate the threat of Iranian drone attacks.
Media reports over the weekend underscored those risks. According to the New York Post, an Iranian suicide drone struck a commercial oil tanker in the Strait, setting it ablaze while U.S. naval protection efforts for shipping lanes could still be weeks away.
Limits of Air Power
Military historians have long debated whether air power alone can decisively win wars. Most conclude it rarely achieves lasting victory by itself. While air strikes can destroy infrastructure, supply chains, and concentrated forces, they cannot control territory, conduct searches, or administer local governance. Nor can they fully eliminate dispersed threats such as drones.
Over the weekend, President Trump declined to rule out deploying ground forces, though he dismissed the idea of using Kurdish fighters as proxies for an invasion of Tehran, saying the conflict was already “complicated enough.” He indicated ground operations would only occur if the adversary were sufficiently weakened.
Domestic Economic Backdrop
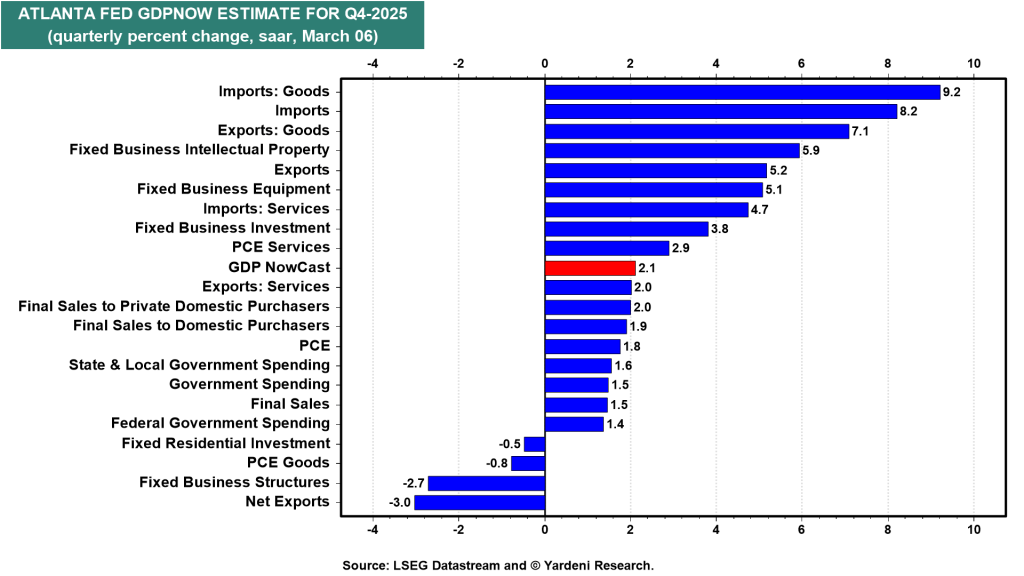
At home, economic data has also softened. February’s U.S. employment report came in much weaker than expected, while January retail sales disappointed. As a result, the Federal Reserve Bank of Atlanta’s GDPNow model lowered its estimate for Q1 real GDP growth to 2.1% (annualized), down from 3.0%.
This leaves both the U.S. economy and equity markets caught between geopolitical shocks and slowing domestic momentum. The Federal Reserve faces a similar dilemma: if higher oil prices persist, its dual mandate could be squeezed between rising inflation and weakening employment.
Implications for the Economic and Market Outlook
Rapidly Changing Conditions
Given the speed of developments, scenario probabilities are being adjusted. The base case remains the “Roaring 2020s” with a 60% probability. However, the “Meltup” scenario has been cut from 20% to 5%, while the “Meltdown” scenario—now including the risk of 1970s-style stagflation—has been raised from 20% to 35%.
Looking beyond this year to the rest of the decade, the outlook narrows to two primary possibilities:
Roaring 2020s: 85% probability
Stagflating 1970s Redux: 15% probability
Oil Prices and Market Risk
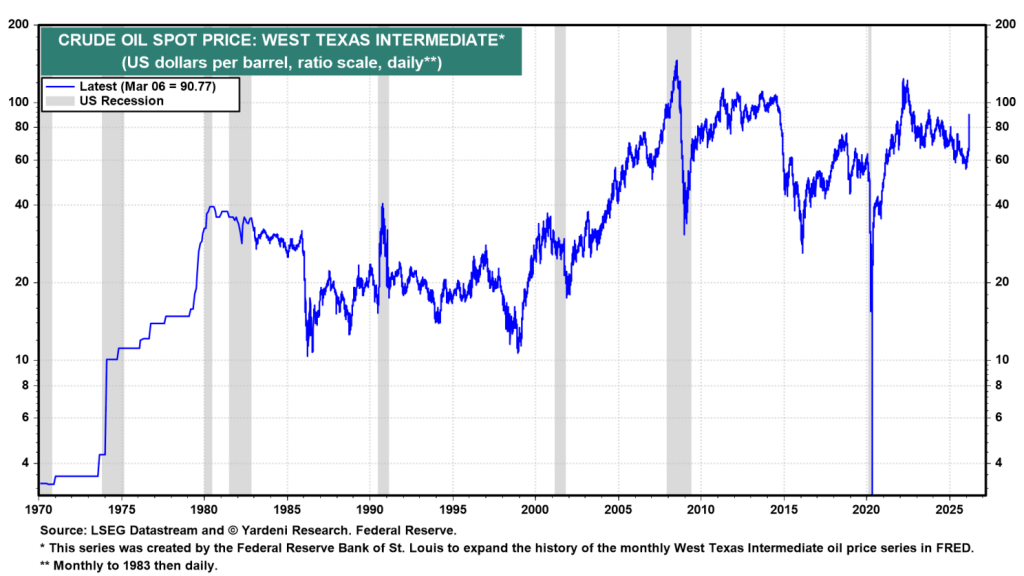
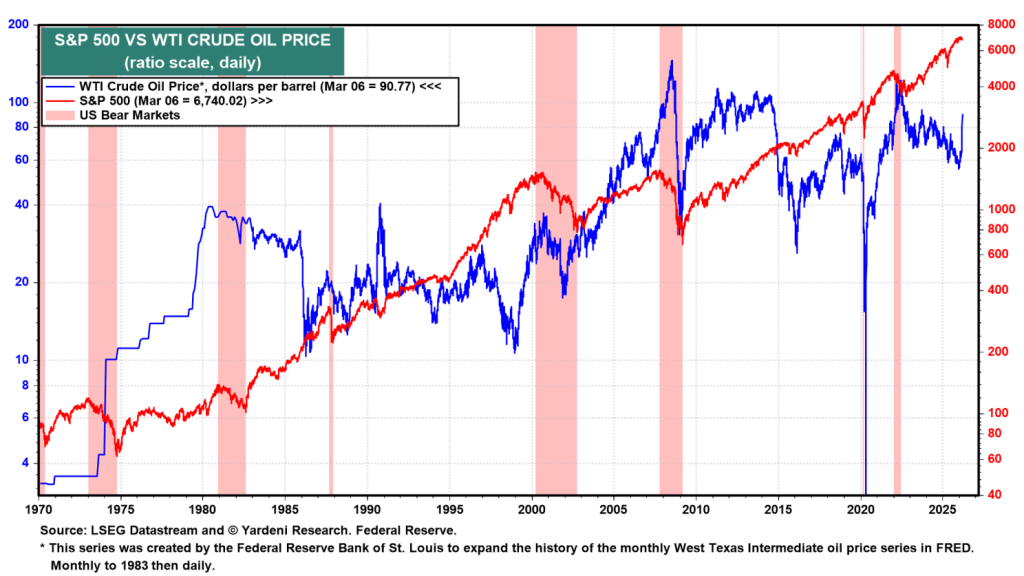
Historically, sharp oil price spikes have often coincided with recessions and bear markets. One recent exception was the 2022 surge following Russia’s invasion of Ukraine, which produced a bear market but not a recession—highlighting the resilience of the U.S. economy.
A similar pattern could play out today. While the economy may absorb higher energy costs, the current oil shock still increases the likelihood of a 10%–15% correction in equities, even if a full bear market ultimately proves avoidable under current conditions.
War Likely to Continue for Several More Weeks
Our relatively optimistic scenario assumes the conflict will persist for a few more weeks, while the U.S. economy and corporate earnings remain resilient, as they have during previous shocks.
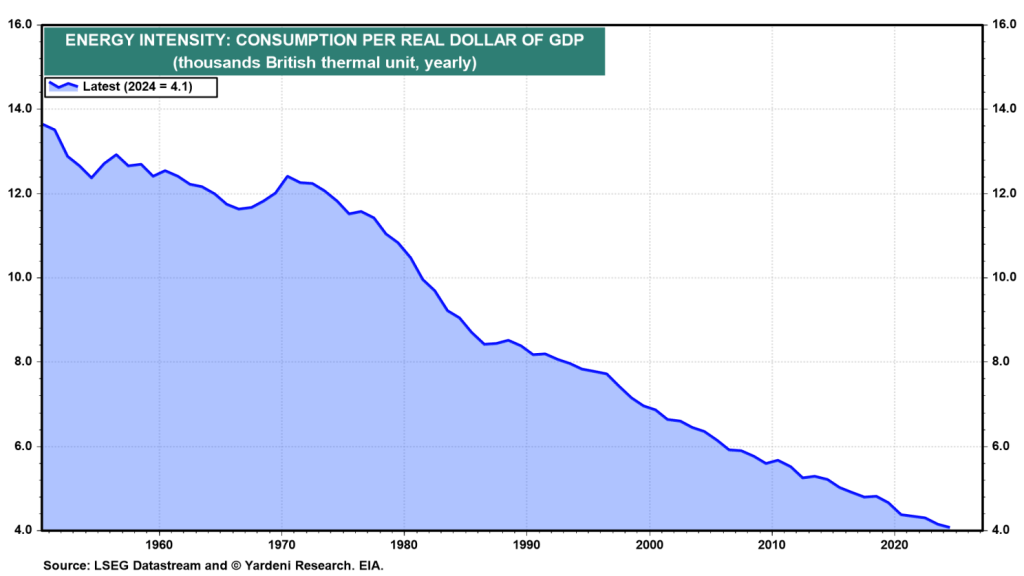
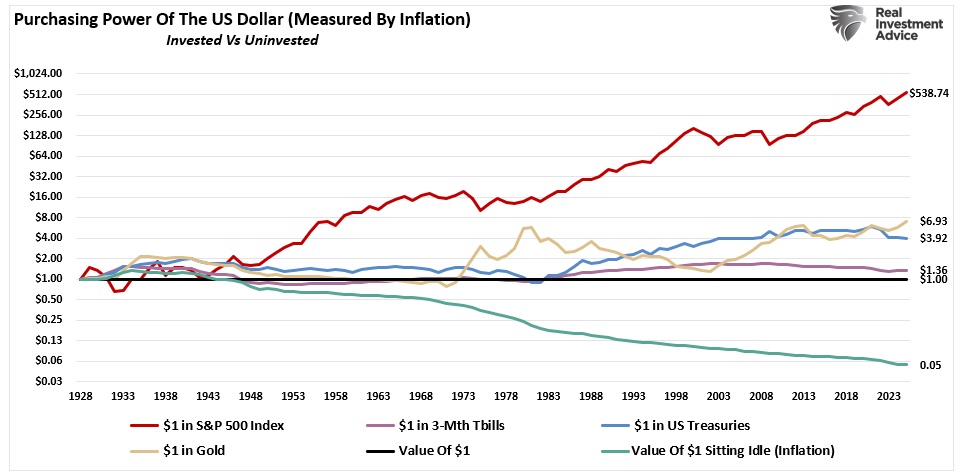
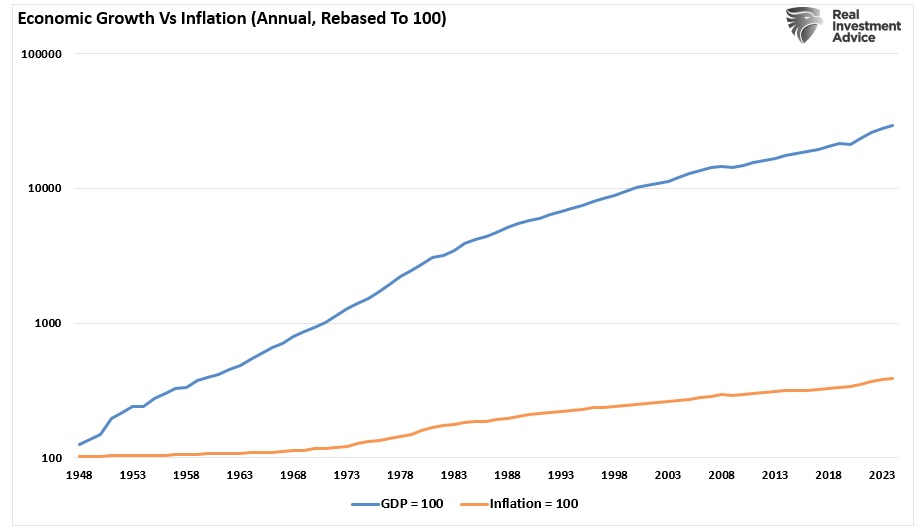
One reason for this resilience is the sharp decline in the economy’s energy intensity—measured as total energy consumption per unit of real GDP. In the United States, energy intensity has fallen dramatically over the past several decades, dropping about 70% between 1950 and 2024 and roughly 62% since 1979.
This structural shift means the U.S. economy is far less sensitive to oil-price shocks than in earlier decades, particularly compared with the 1970s oil crisis period when energy costs had a much larger impact on growth and inflation.
The United States economy has gradually shifted from heavy reliance on energy-intensive manufacturing toward a more service-oriented structure, which has helped reduce overall energy consumption relative to economic output.
Additional factors behind the decline in energy intensity include the introduction of Corporate Average Fuel Economy (CAFE) standards and ongoing technological improvements in internal combustion engines, both of which have improved fuel efficiency across the transportation sector.
At the same time, the expansion of the digital economy—including data centers, cloud computing, and artificial intelligence—has been driving stronger electricity demand. Even so, the growing use of natural gas and renewable energy sources in power generation, as well as their increasing adoption in industrial processes that previously relied on oil, should continue to moderate the economy’s direct dependence on crude oil.
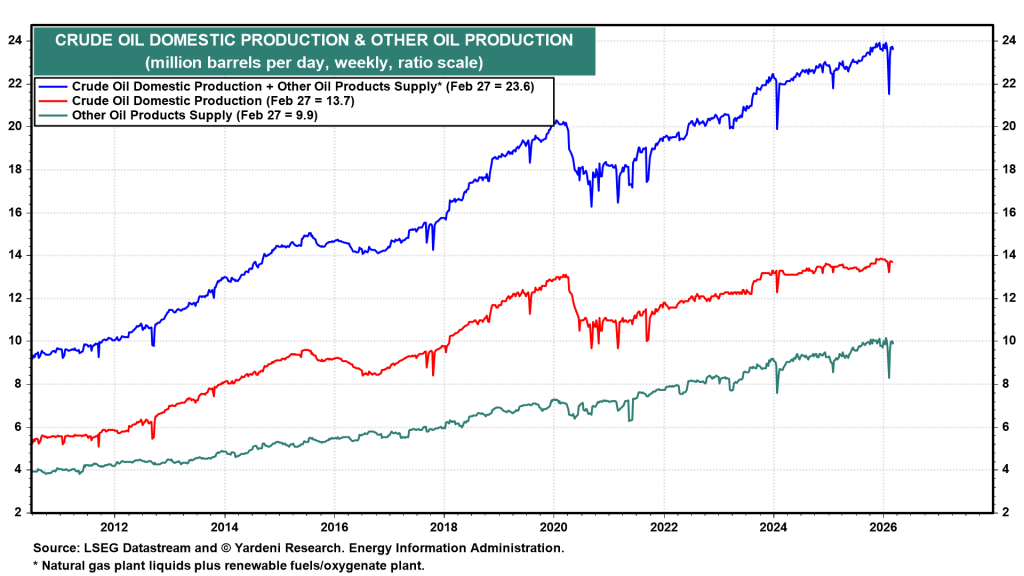
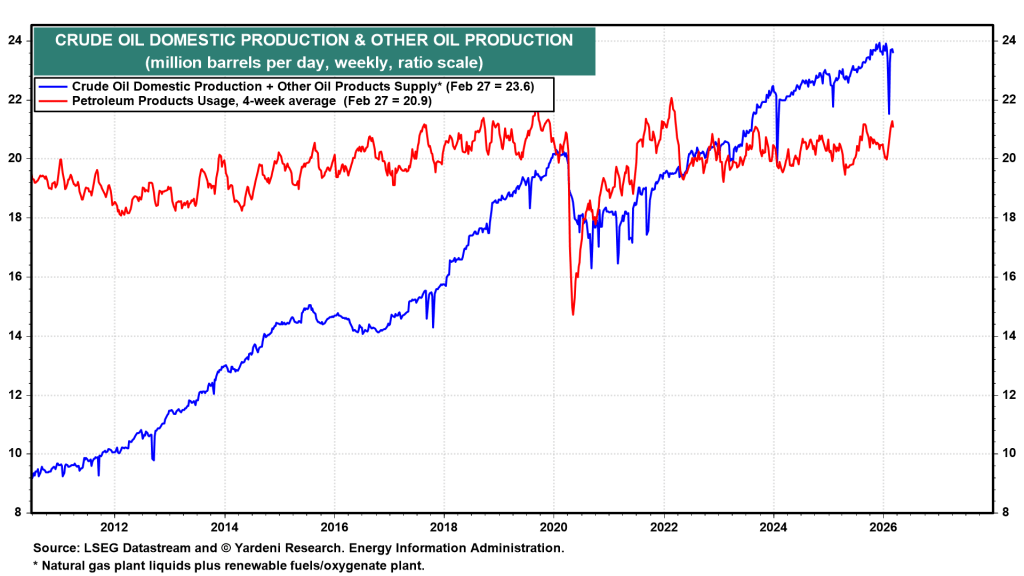
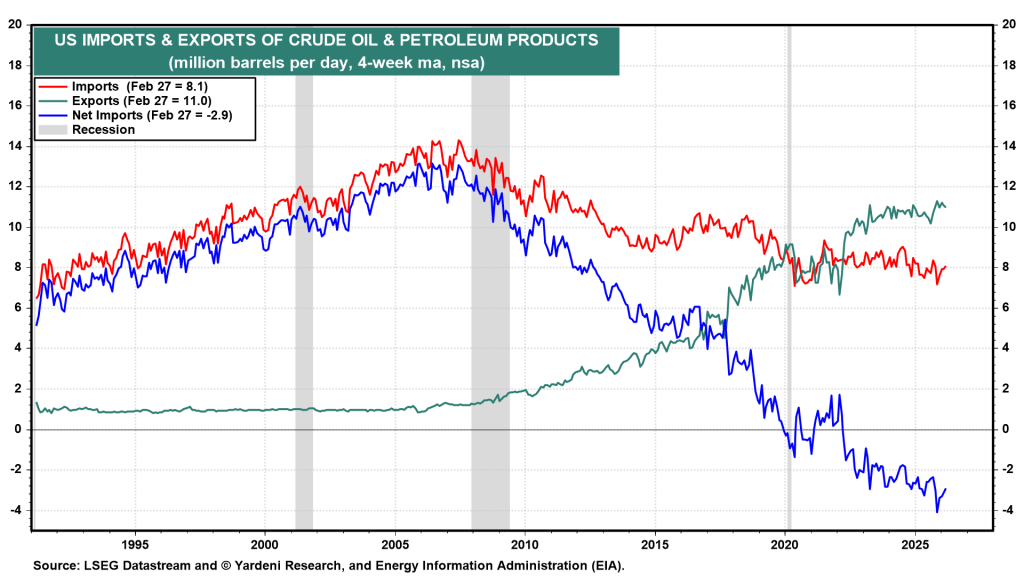
Oil production
U.S. oil production, which includes natural gas plant liquids and renewable fuels/oxygenates, has reached a record level of 24 million barrels per day (mbd), significantly exceeding domestic consumption of 21 mbd (Fig. 7 and Fig. 8). As a result, the United States has become a net exporter of roughly 3.0 mbd (Fig. 9). This represents a dramatic shift compared with 2007, when the country was a net importer of approximately 12 mbd.
A potential return of 1970s-style stagflation
A bear market cannot be ruled out if investors begin to expect a repeat of the stagflationary conditions seen in the 1970s. At that time, the global economy was hit by two major oil shocks. In October 1973, Arab members of Organization of the Petroleum Exporting Countries (OPEC) imposed an oil embargo on the United States and other countries that supported Israel during the Yom Kippur War.
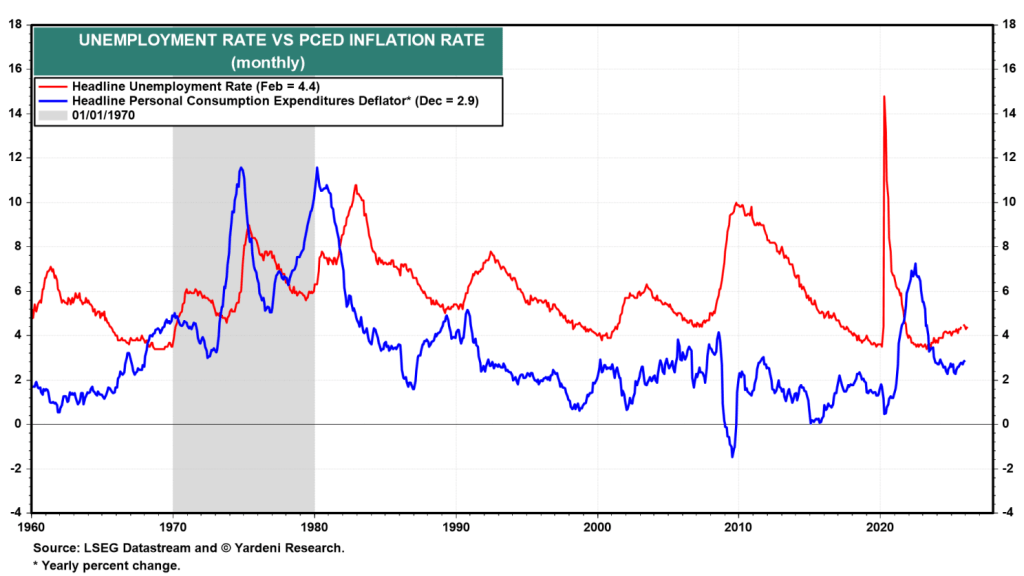
Oil prices surged dramatically, rising about fourfold from roughly $3 to nearly $12 per barrel within only a few months. This led to stagflation—an unusual and painful economic condition characterized by slow economic growth, high unemployment, and accelerating inflation (Fig. 10). The crisis resulted in long queues at gasoline stations, fuel rationing, and a heightened awareness of the United States’ dependence on foreign energy supplies.
The second oil crisis occurred after the Iranian Revolution, which significantly disrupted global oil supplies. As a result, oil prices surged, rising to more than twice their previous level. This shock further weakened an already fragile economy and deepened the stagflationary pressures. Together, the two oil crises contributed to two recessions during the 1970s.
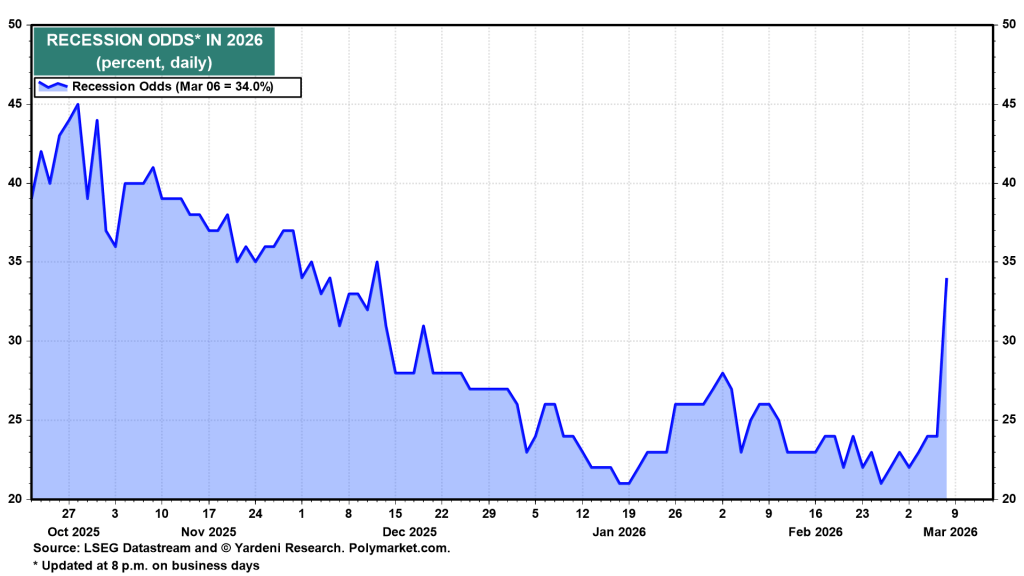
According to Polymarket, the probability of a recession this year rose to a three-month high of 34% on Friday, up from 21% on Wednesday, February 25, just before the conflict began (Fig. 11).
U.S. Strategy II: A Direct Confrontation with the IRGC
When the conflict began on Saturday, February 28, the initial assumption was that it would end quickly. However, by the following Tuesday, that view changed, prompting further analysis in that day’s QuickTakes. A key concern is that by eliminating the leadership of the Iranian regime in the opening hour of the war, the United States and Israel effectively unleashed the regime’s most powerful force—the Islamic Revolutionary Guard Corps (IRGC). Often described as a “state within a state,” the IRGC is believed to control 20–40% of Iran’s economy, including large construction companies, telecommunications networks, and oil engineering firms. This financial base allows it to sustain operations even under severe sanctions.
In April 2019, the United States officially designated the IRGC as a Foreign Terrorist Organization—the first time Washington had applied such a label to a branch of another government. Because of their decentralized structure and access to weapons such as suicide drones, the group would be difficult to eliminate through air power alone.
Donald Trump first publicly demanded Iran’s “unconditional surrender” on Friday, March 6. The following day, he clarified that the phrase meant a situation where Iran could no longer continue fighting. On Sunday morning, he also warned that any new Supreme Leader selected by Iran’s Assembly of Experts “would not last long” without his approval, implying a U.S. veto over the succession process following the death of Ali Khamenei.
Without a central leader, Iran lacks a figure capable of formally accepting unconditional surrender. For example, on Saturday, Iranian President Masoud Pezeshkian issued a public apology for Iran’s “fire-at-will” attacks on neighboring countries. Yet only hours later, the IRGC launched another wave of strikes, highlighting a severe breakdown in command and control after Khamenei’s death on February 28. Even without the regime’s top leader, the IRGC’s decentralized design allows regional commanders to operate independently, already carrying out retaliatory drone and missile attacks against U.S. assets and allies in the Gulf.
One objective of the ongoing air campaign is to weaken the IRGC’s ability to suppress domestic opposition. By striking the Basij—the IRGC’s paramilitary force used for internal control—the United States hopes to open the door for a possible uprising inside Iran. However, from the perspective of financial markets, the war will not truly end until commercial ships can move through the Strait of Hormuz without the threat of IRGC attacks. Once that happens, the stock market’s bullish trend could resume.
U.S. Economy: Domestic Impact
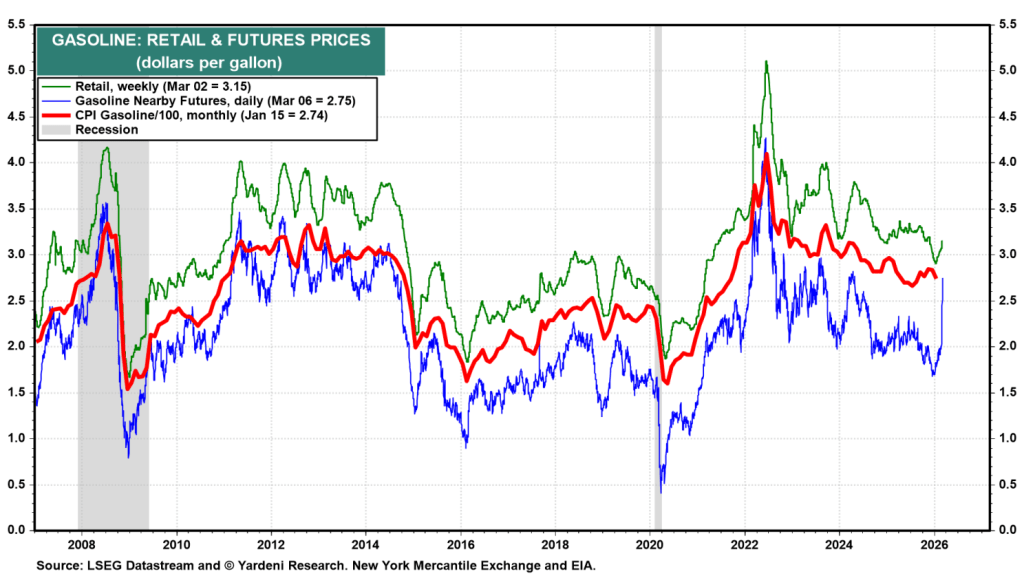
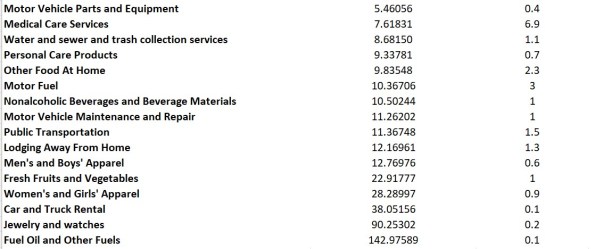
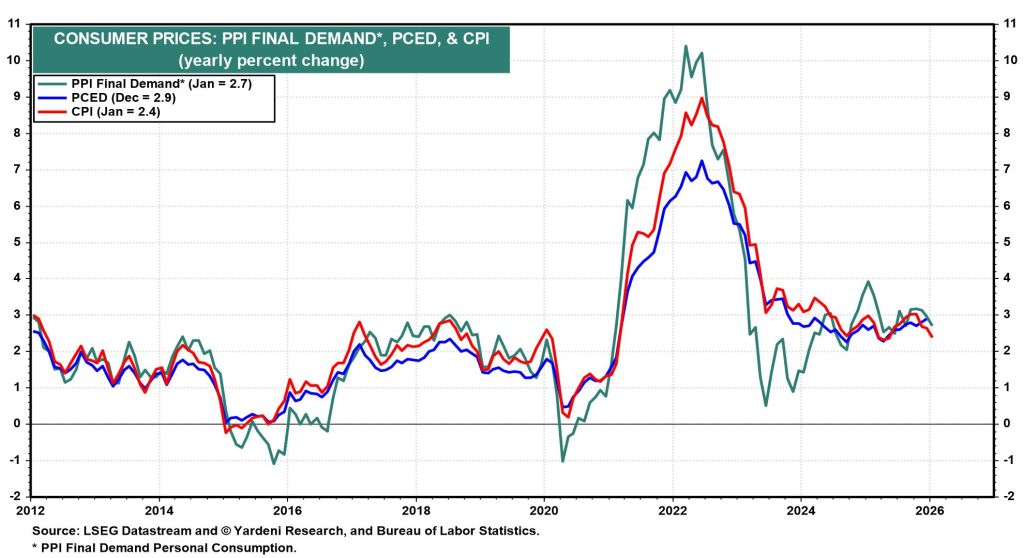
Within the United States, economic data from January and February were collected before the war and present a mixed picture. Data from March will likely reveal the first economic effects of the conflict, including rising inflation and a weakening labor market. One immediate sign of inflationary pressure is the sharp increase in gasoline prices, driven by the surge in crude oil prices (Fig. 12).
Food prices may not increase right away, but fertilizer shortages could push them higher in the months ahead. Roughly 25%–33% of the global nitrogen fertilizer trade—particularly urea and anhydrous ammonia—moves through the Strait of Hormuz. On March 2, an Iranian drone attack struck the Ras Laffan Industrial City in Qatar, the world’s largest export hub for liquefied natural gas. Since natural gas is the main feedstock used to produce nitrogen fertilizers, disruptions there could have significant downstream effects. Meanwhile, Saudi Arabia, Oman, and the United Arab Emirates—all among the world’s top ten exporters of urea—are facing logistical and production challenges because of the ongoing air conflict.
If the blockade remains in place into early April, farmers might be forced to shift away from nitrogen-intensive corn-based fertilizer systems toward soybean alternatives or simply reduce fertilizer usage. Lower fertilizer application typically results in reduced crop yields, which could lead to a secondary food price shock toward the end of 2026.
This conflict represents another major test of the resilience of the U.S. economy since the beginning of the decade. It also challenges the so-called “Roaring 2020s” outlook. Despite the new risks, that optimistic scenario remains the base case with a 60% probability. However, the likelihood of a 1970s-style stagflation scenario has been raised to 35%, while the probability of a market melt-up has been reduced to 5% for the rest of 2026.
Recent economic data suggest that the labor market weakened in February and retail sales were soft in January. On the positive side, productivity growth has been particularly strong in recent quarters. If that trend continues, higher productivity could help mitigate some of the stagflationary pressures created by the war.
Employment
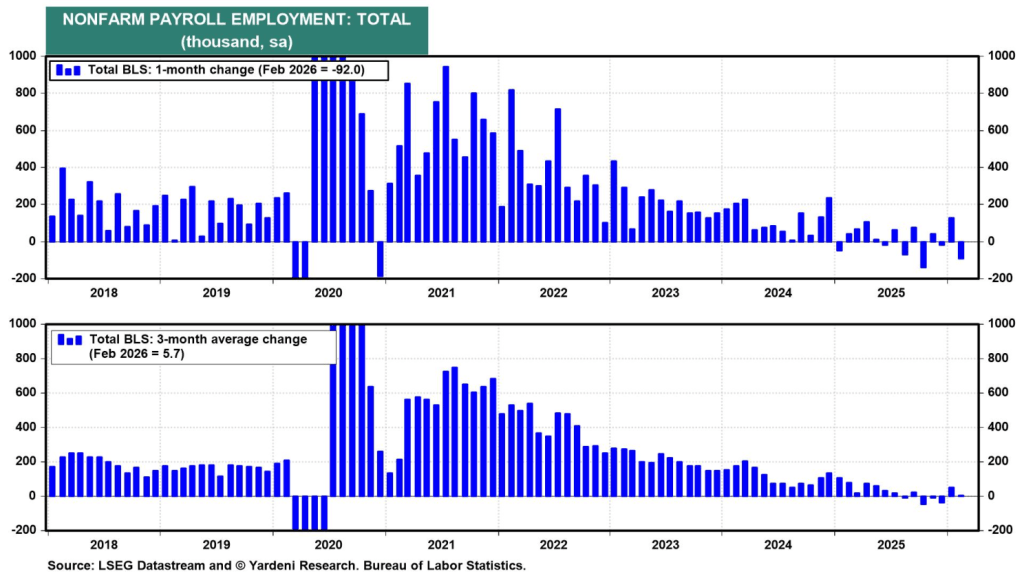
The January employment report came in significantly stronger than expected, whereas the February report was much weaker than forecasts. Severe weather conditions and a labor strike negatively affected February’s figures. As a result, nonfarm payrolls declined by 92,000 last month.
In addition, the January payroll figure was slightly revised downward by 4,000 to 126,000, while December’s data was adjusted from a previously reported gain of 48,000 to a decline of 17,000 (Fig. 13). Meanwhile, the unemployment rate increased marginally, rising to 4.4% in February from 4.3% in January.
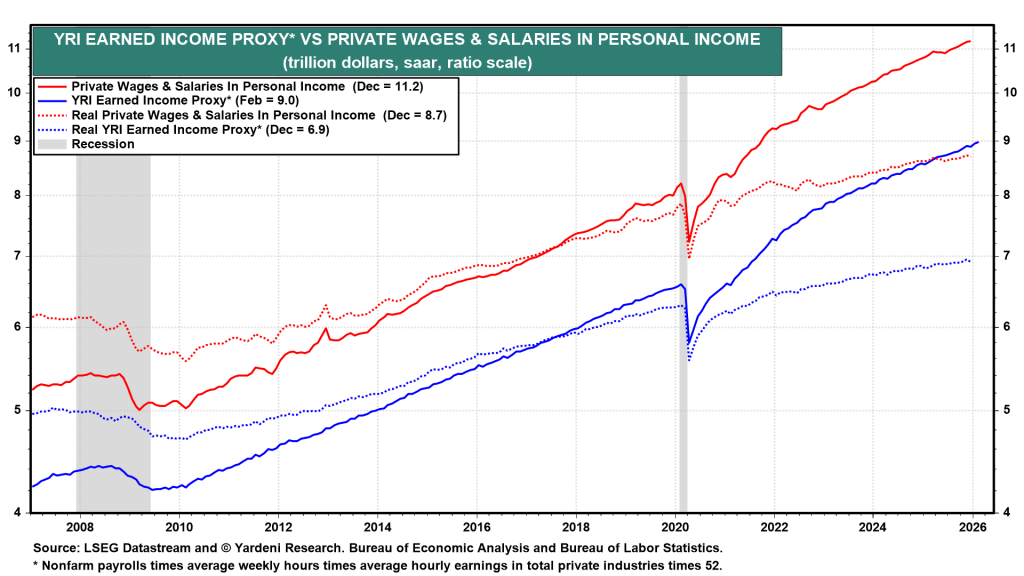
The positive development is that average hourly earnings increased by 0.4% month over month in February, while the average workweek remained unchanged. Consequently, our Earned Income Proxy, which estimates wages and salaries within personal income, rose by 0.3% in February, reaching a new record high (Fig. 14).
The Federal Reserve is facing a policy dilemma: a softening labor market, which would normally justify cutting the federal funds rate, versus rising energy and fertilizer costs linked to the Iran conflict, which could push inflation higher and argue for keeping rates unchanged or even tightening policy.
This clash of signals complicates the Fed’s next move. Weak employment data suggests the economy may need monetary support, while higher oil and commodity prices risk reigniting inflation, forcing policymakers to remain cautious about easing.
Retail Sales
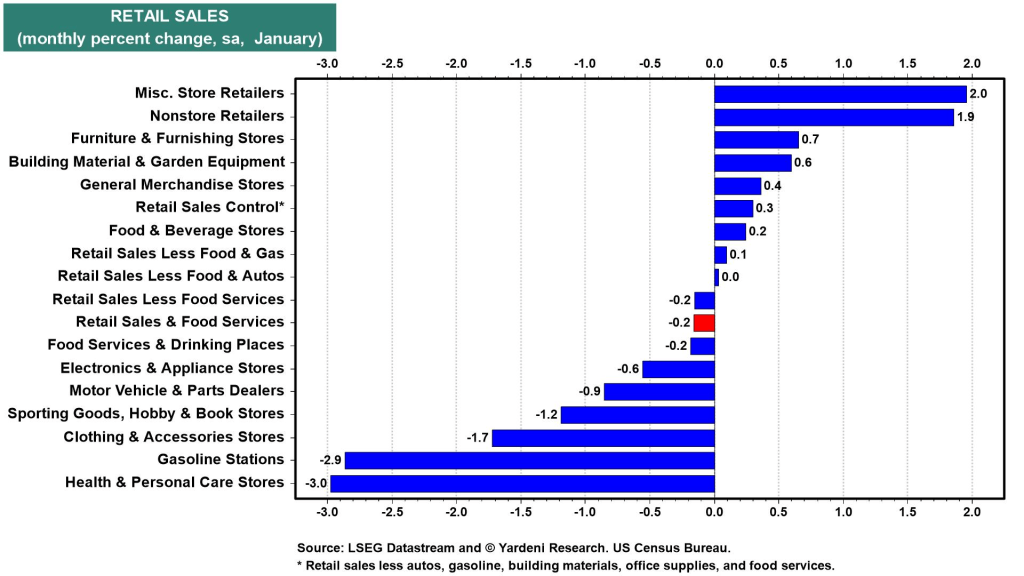
In January, retail sales declined by 0.2% month over month, while December’s figures, previously reported as showing moderate growth, were revised downward to no change compared with the previous month.
Among sectors, nonstore retailers experienced a 1.9% monthly increase, whereas motor vehicle and parts dealers recorded a 0.9% decline (Fig. 15). Sales at gasoline stations also dropped 2.9%.
One positive sign was a 0.3% month-over-month rise in core retail sales, which excludes several more volatile categories.
The rollout of last year’s One Big Beautiful Bill Act is expected to support consumer spending in the weeks ahead. A “February rebound” in retail activity is likely as record-high tax refunds—about 20% larger on average than last year—begin reaching households’ bank accounts.
Productivity
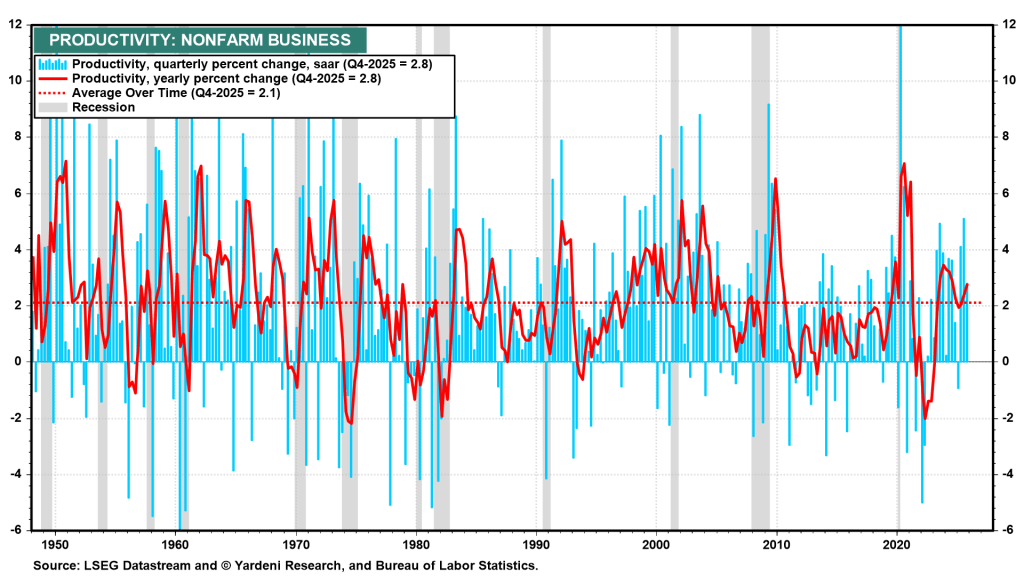
Labor productivity—defined as output per hour worked—increased at an annualized rate of 2.8% in Q4 2025. This marks the third consecutive quarter in which productivity growth has surpassed the long-term average of 2.1%, a benchmark calculated from data beginning in the late 1940s (Fig. 16).
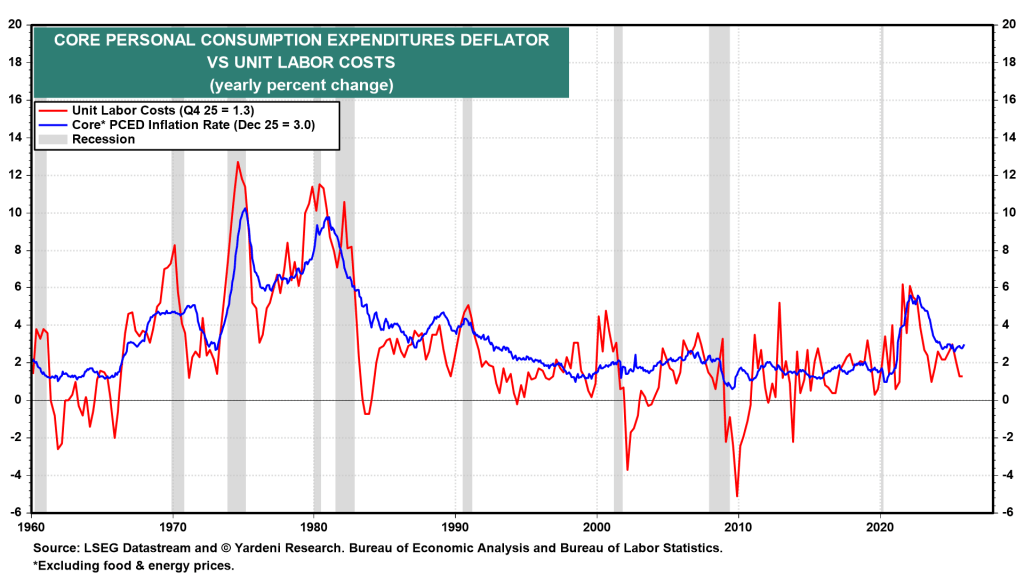
At the same time, unit labor costs rose by only 1.3% year over year in Q4 2025, which helped contain inflationary pressures in the economy (Fig. 17).
GDPNow
As noted earlier, the newest economic data prompted the Federal Reserve Bank of Atlanta’s GDPNow model to lower its forecast for first-quarter 2026 economic growth from 3.0% to 2.1% (Fig. 18).
This week will see a series of major central bank meetings worldwide, including those of the Federal Reserve, European Central Bank, Bank of Japan, and Bank of England. With oil prices climbing sharply and inflation expectations edging higher, investors will be closely watching how policymakers assess the outlook for monetary policy and the implications of elevated energy costs.
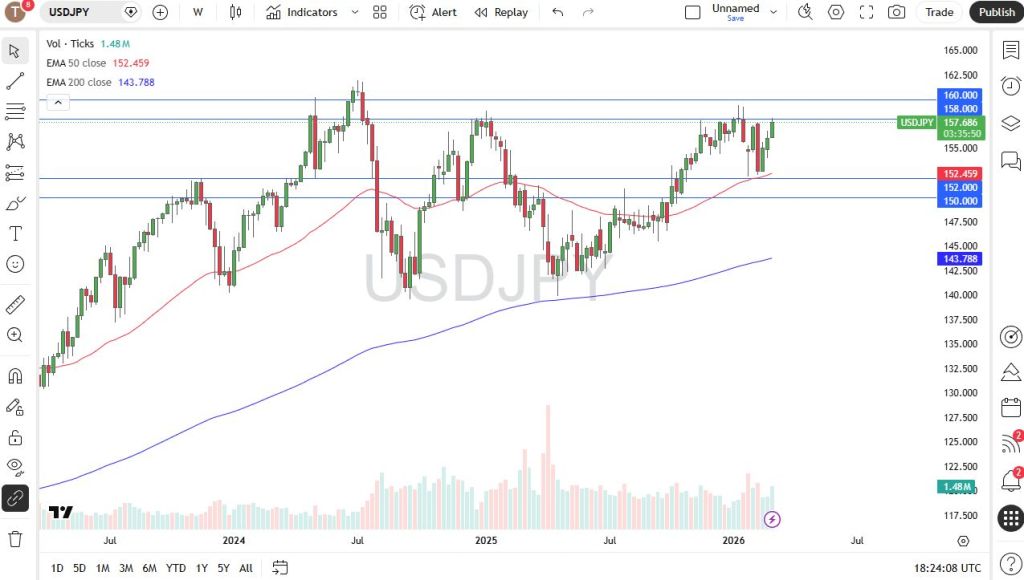
Among these institutions, the Bank of Japan faces perhaps the most delicate situation, particularly after the country’s February general election and the policy trajectory it had already been pursuing since its previous meeting. With oil trading near $100 a barrel, the BOJ must proceed cautiously as the USD/JPY exchange rate moves toward 160 — a level widely viewed as a potential tipping point for the currency.
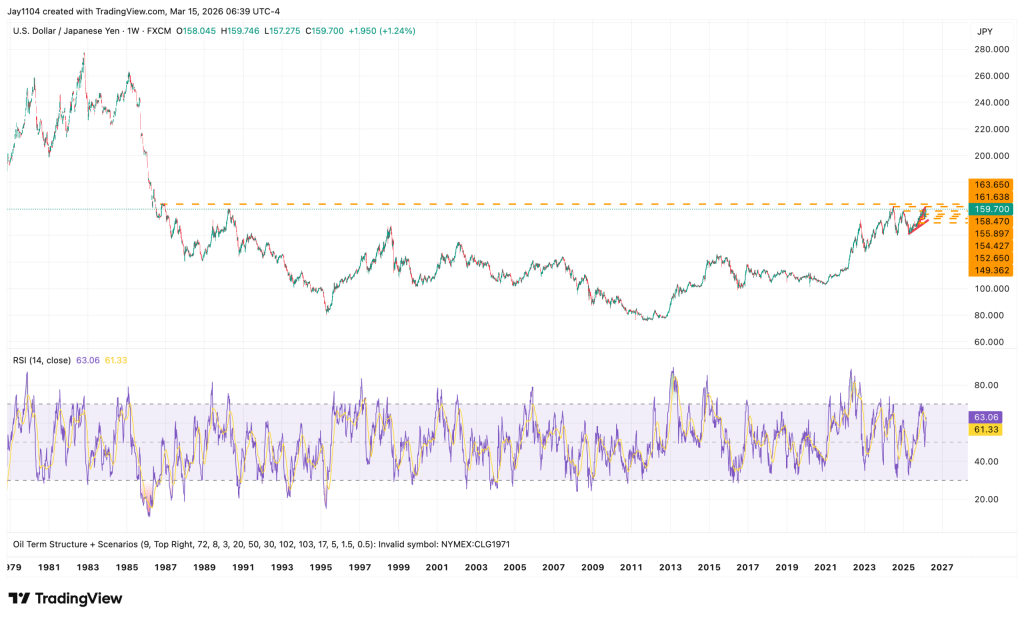
The pair has already broken above resistance near 159, though it still remains below the highs reached in July 2024.
From a technical perspective, once USD/JPY moves above its July 2024 peak, there would be no clear resistance levels ahead, potentially opening the door for further and possibly sharp depreciation of the Japanese yen.
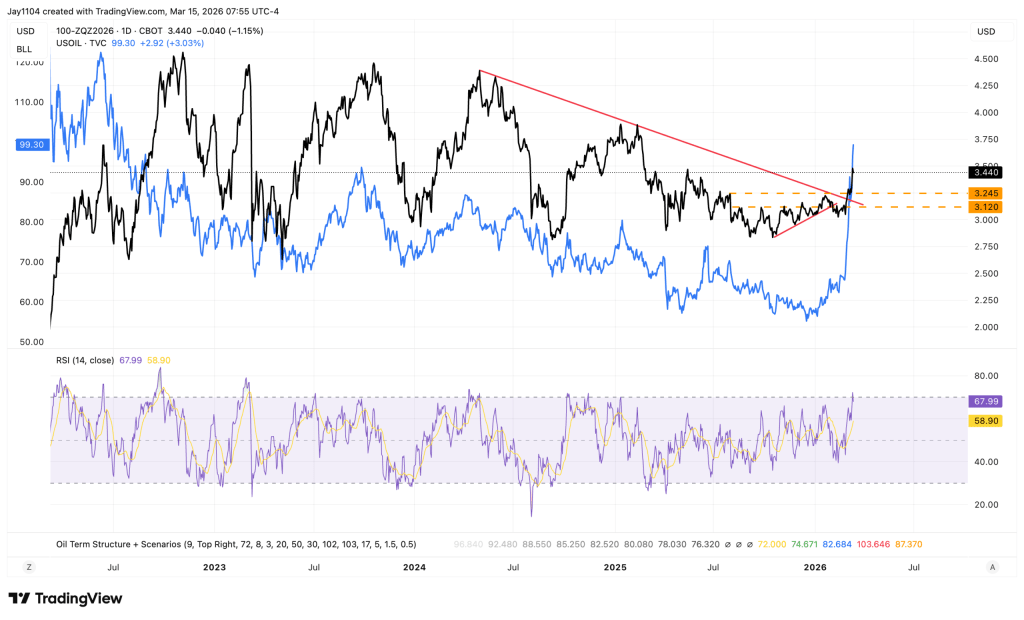
Meanwhile, the recent surge in oil prices has reshaped expectations for U.S. interest-rate cuts. Markets have gradually scaled back their projections for easing, even though the incoming Federal Reserve chair nominee has indicated a preference for looser monetary policy.
December Fed funds futures have climbed to around 3.44%, reflecting reduced expectations for rate cuts. Since 2022, market pricing for Fed easing has broadly moved in tandem with oil prices.
If oil continues to rise, it could complicate the Fed’s ability to lower rates, as higher energy costs tend to fuel inflation. Rate cuts may only become more likely if oil prices rise to a point where they begin pushing the economy toward recession.
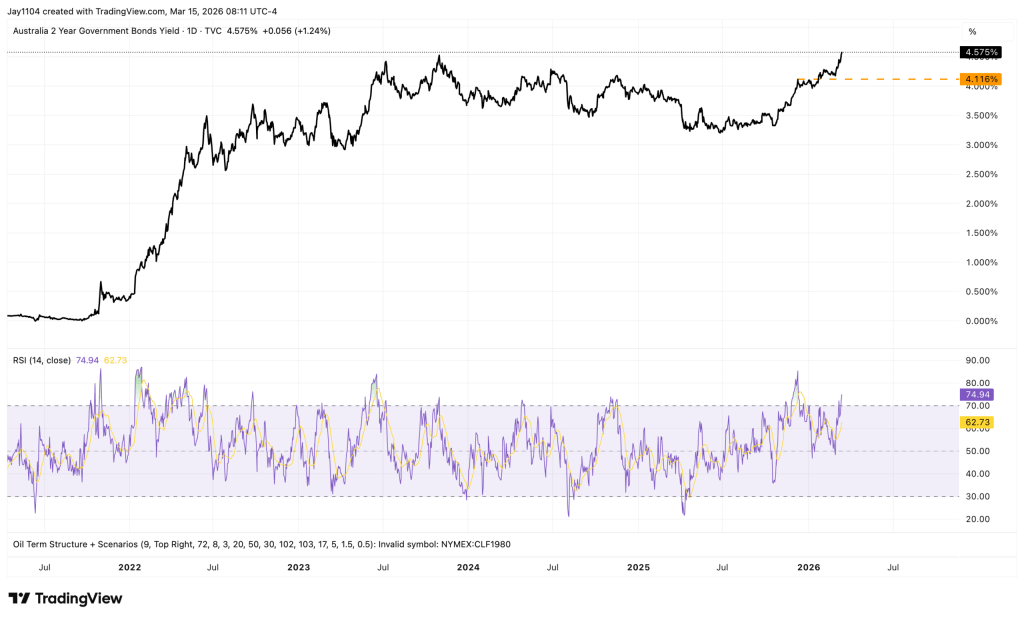
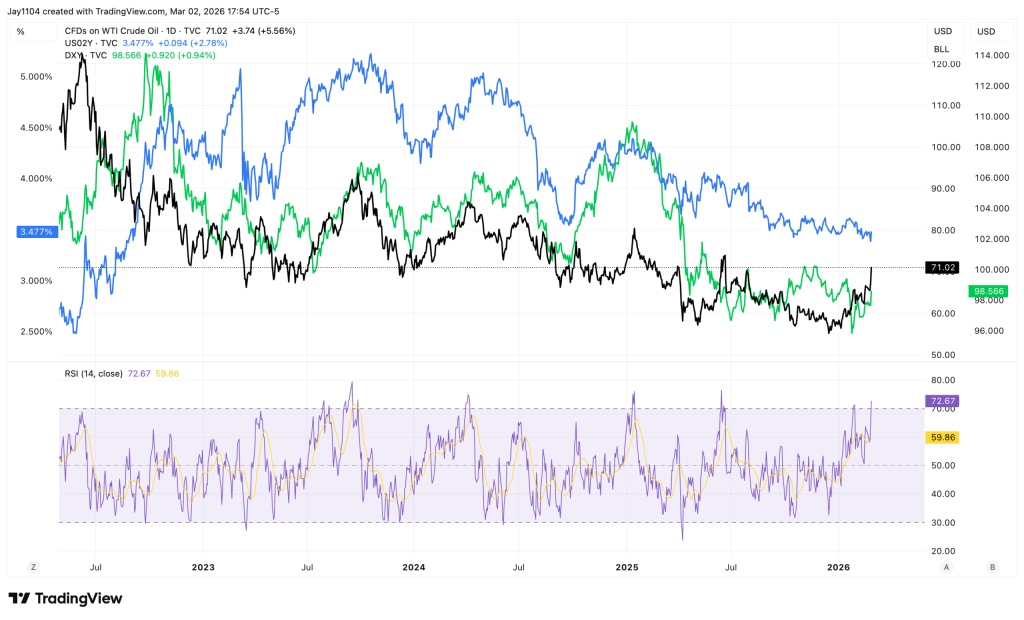
Rising rates are not limited to the U.S., as Australia’s 2-year bond yield has now moved above its October 2023 peak.
Rising global oil prices are likely to tighten liquidity and financial conditions worldwide. Tighter financial conditions typically place pressure on economic activity and risk markets. As long as oil prices remain elevated — or continue to climb — they are likely to further tighten global financial conditions and weigh on risk assets.
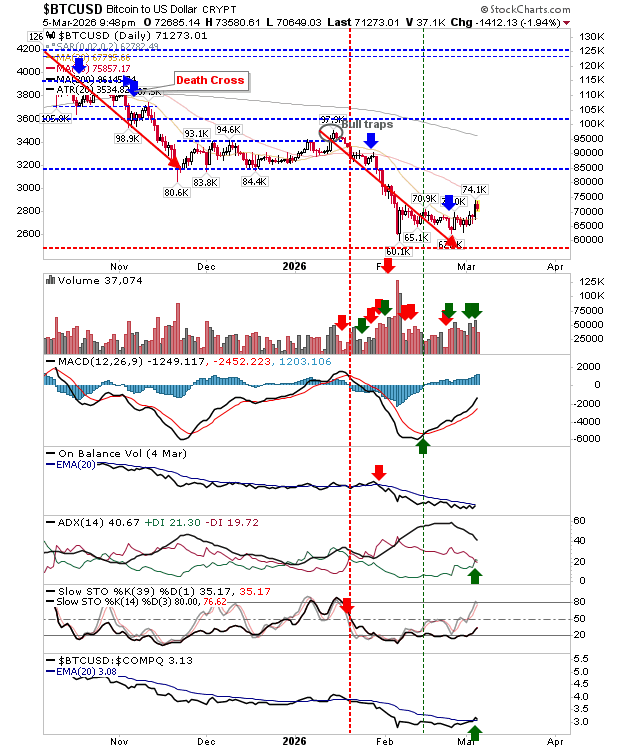
For investors trying to gauge the outlook for risk assets, the direction of oil prices has become increasingly important. However, predicting oil’s near-term path remains challenging. Weekend oil CFDs were trading about 3% higher and above $100 per barrel.
From a technical perspective, the trend remains upward for now, as long as oil continues to hold above its 10-day exponential moving average.
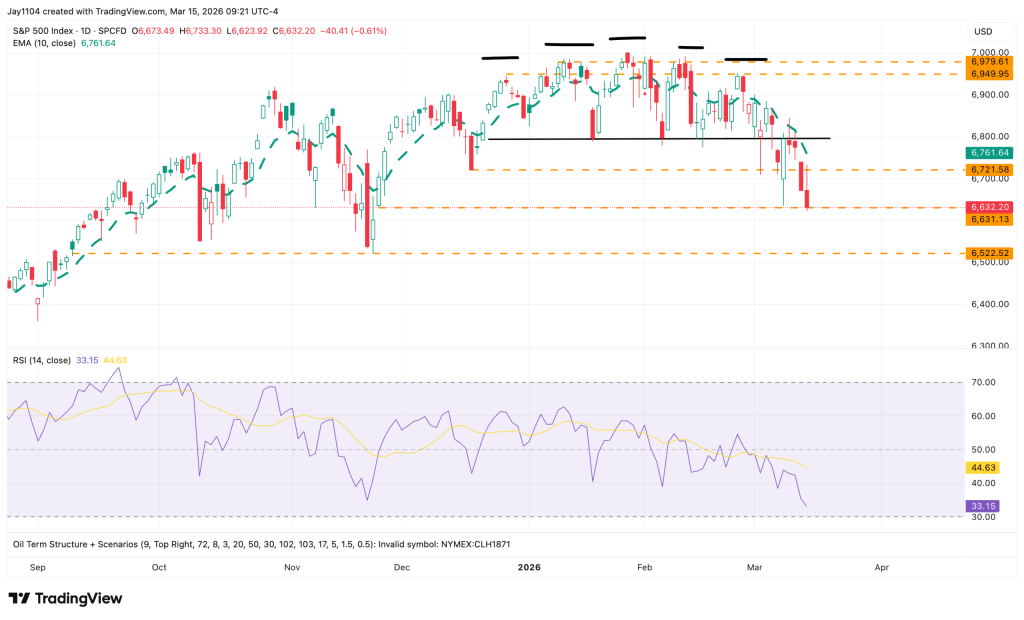
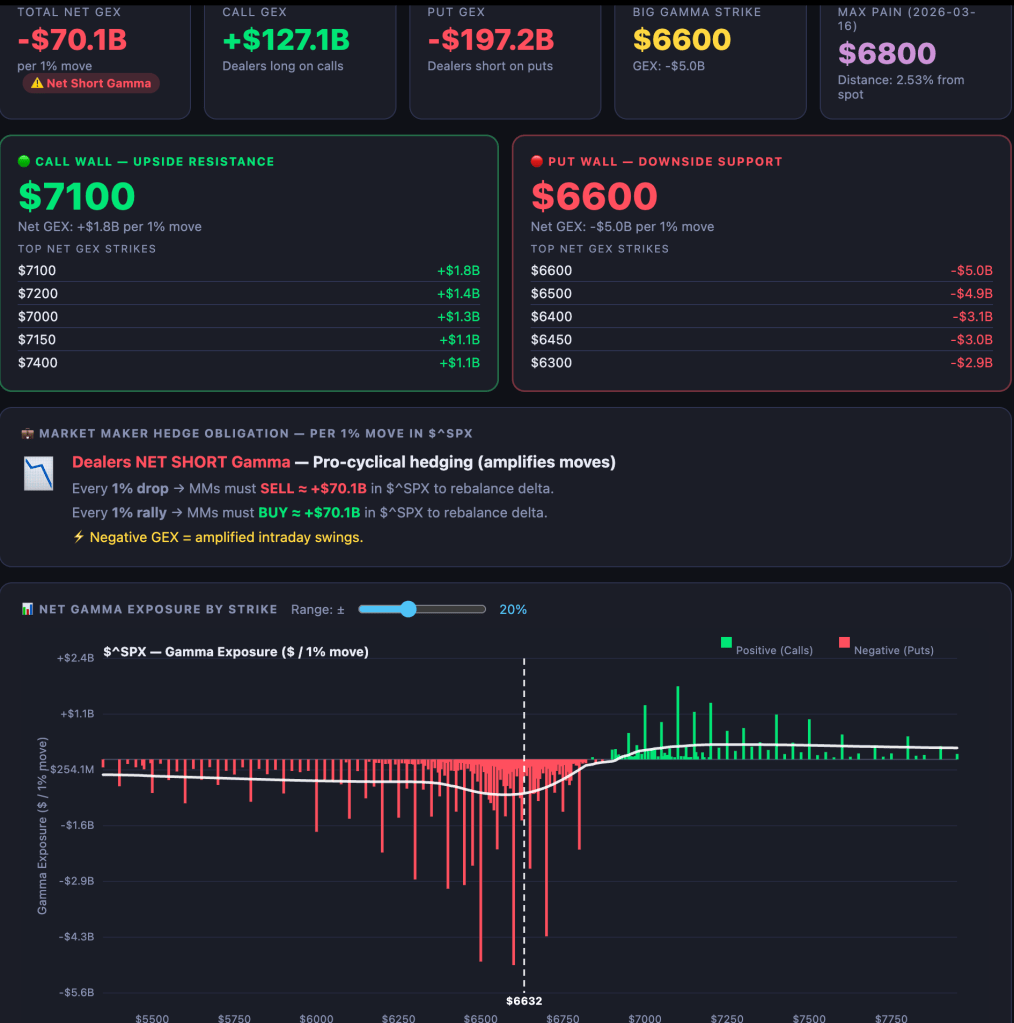
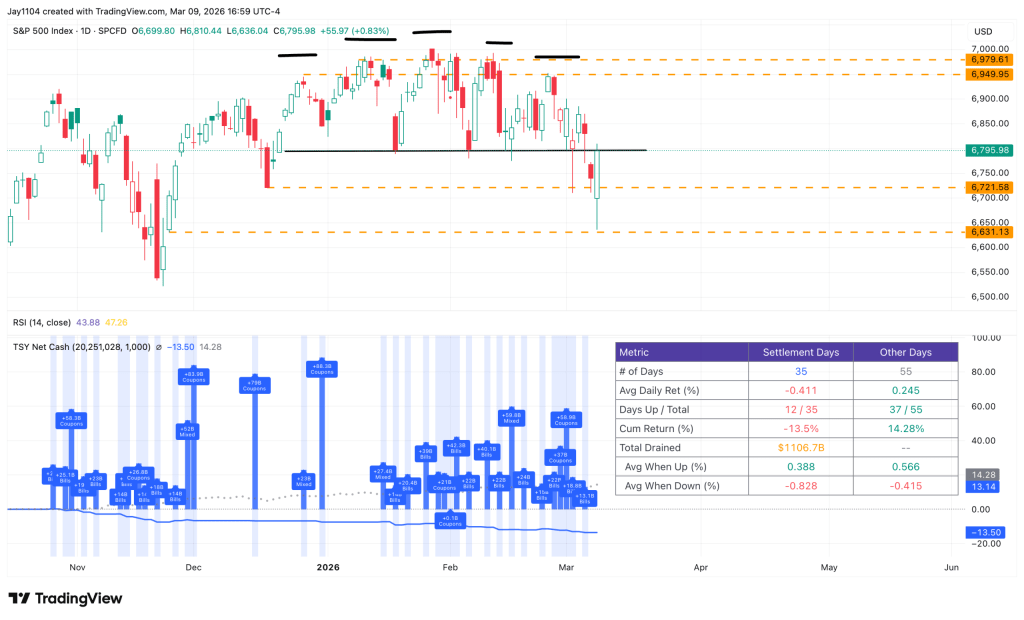
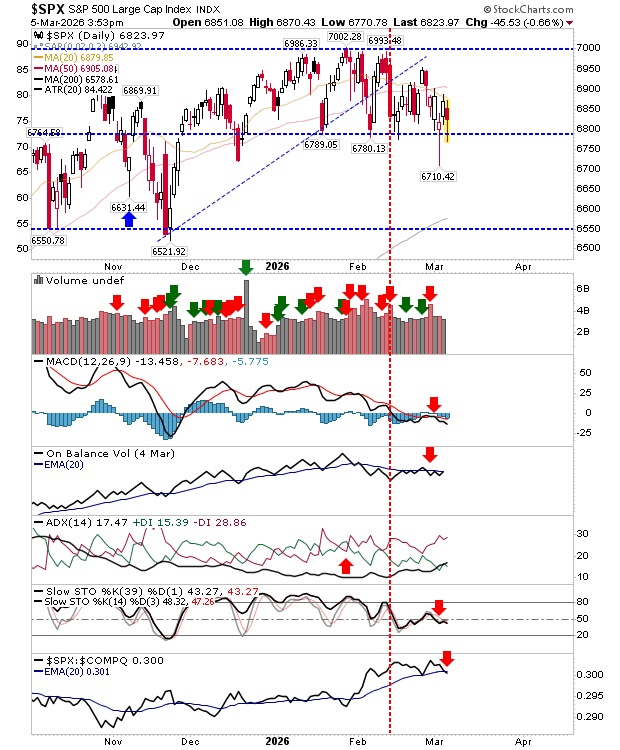
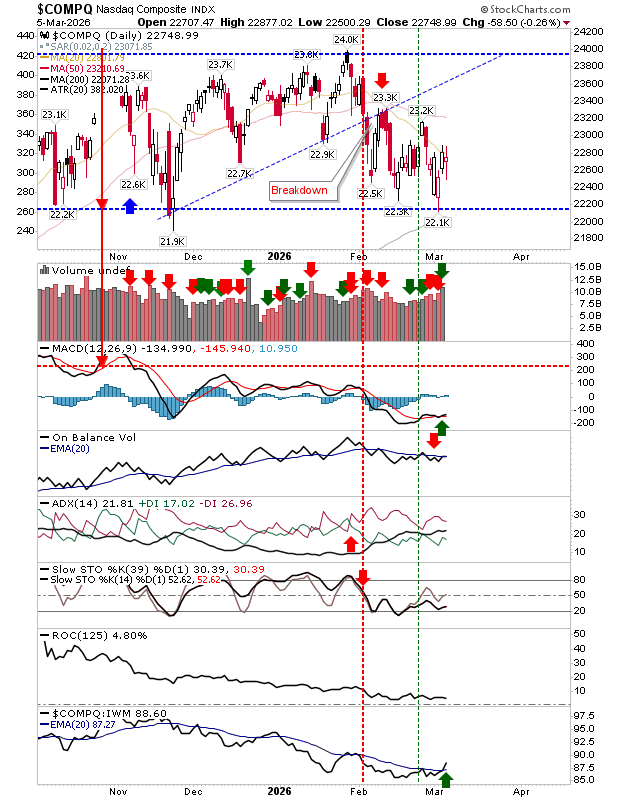
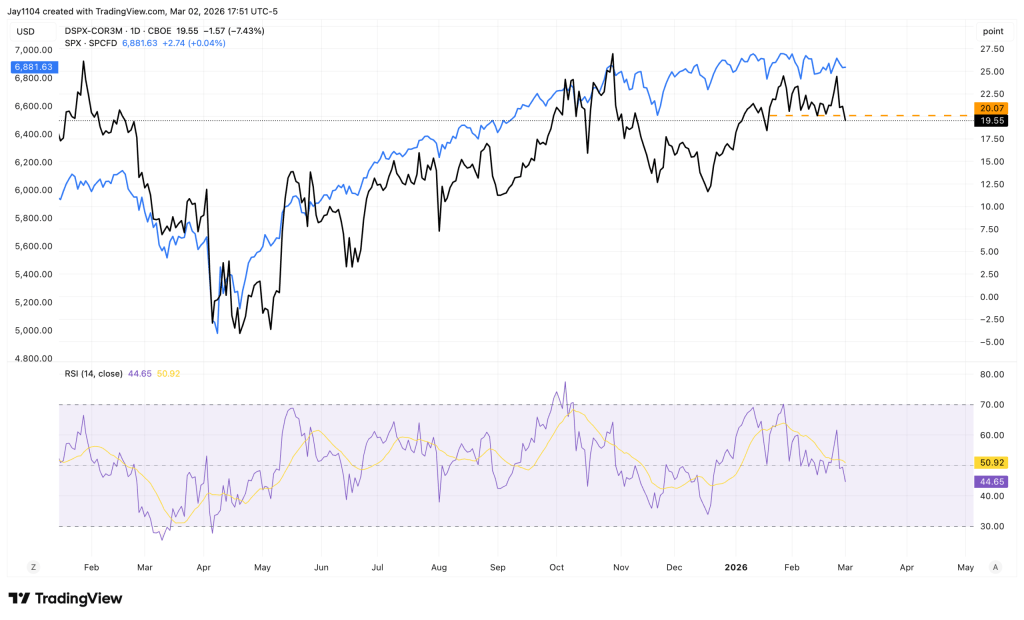
The situation is similar for the S&P 500—as long as the index stays below its 10-day exponential moving average, the short-term trend is likely to remain downward.
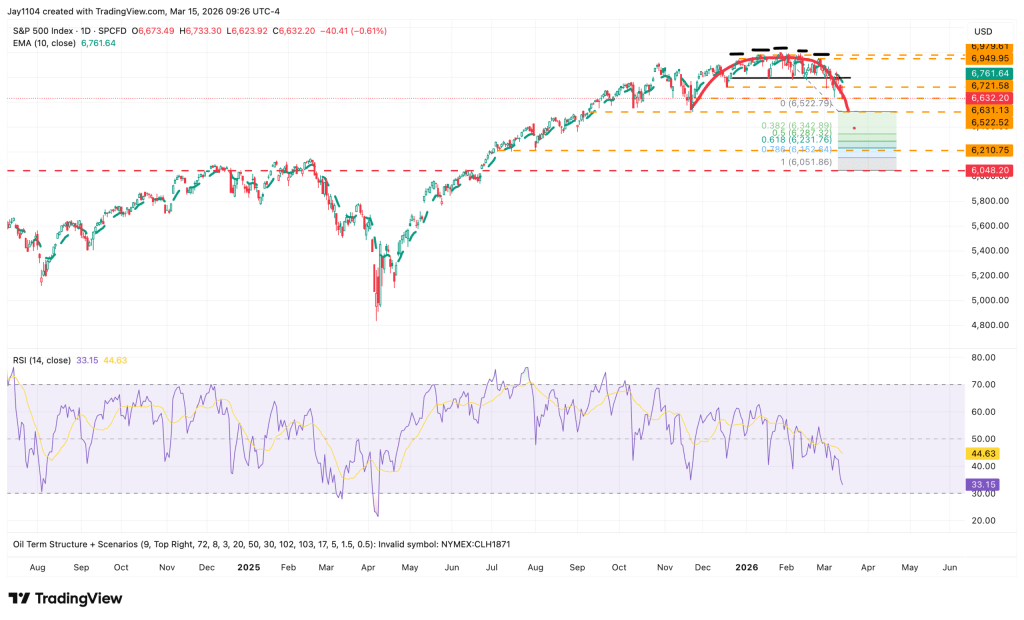
The distribution pattern in the S&P 500 appears relatively clear, with a key pivot level near 6,525, which coincides with the index’s November lows.
More significantly, measuring the decline from the recent high to this pivot level and projecting that move 100% lower points to a potential downside target near 6,050. Such a move would also fill the price gap from June 24 and allow the index to retest the breakout level from the pre-tariff highs, an area that could act as technical support.
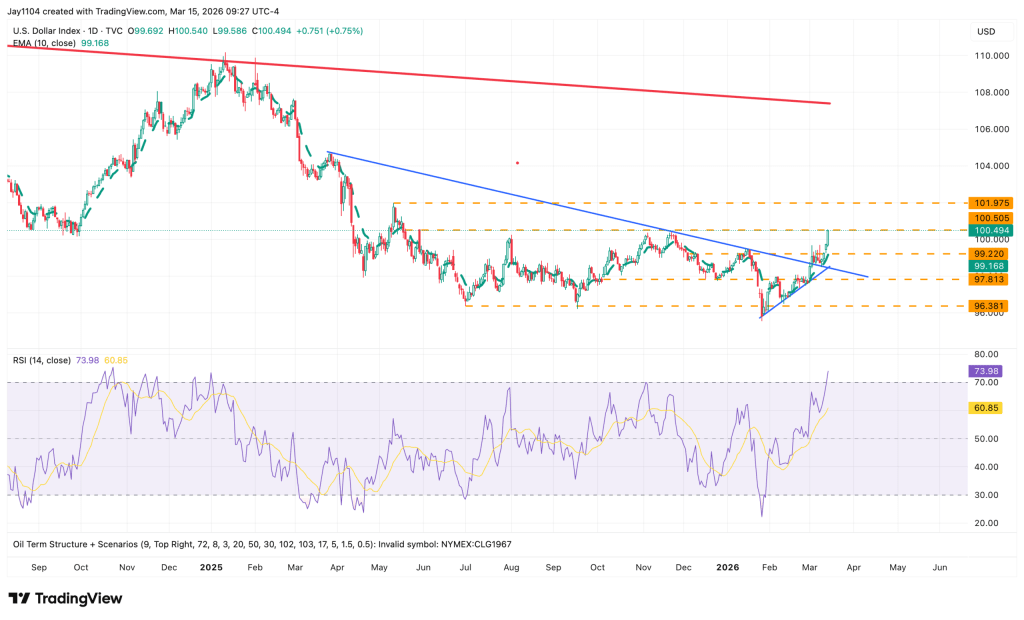
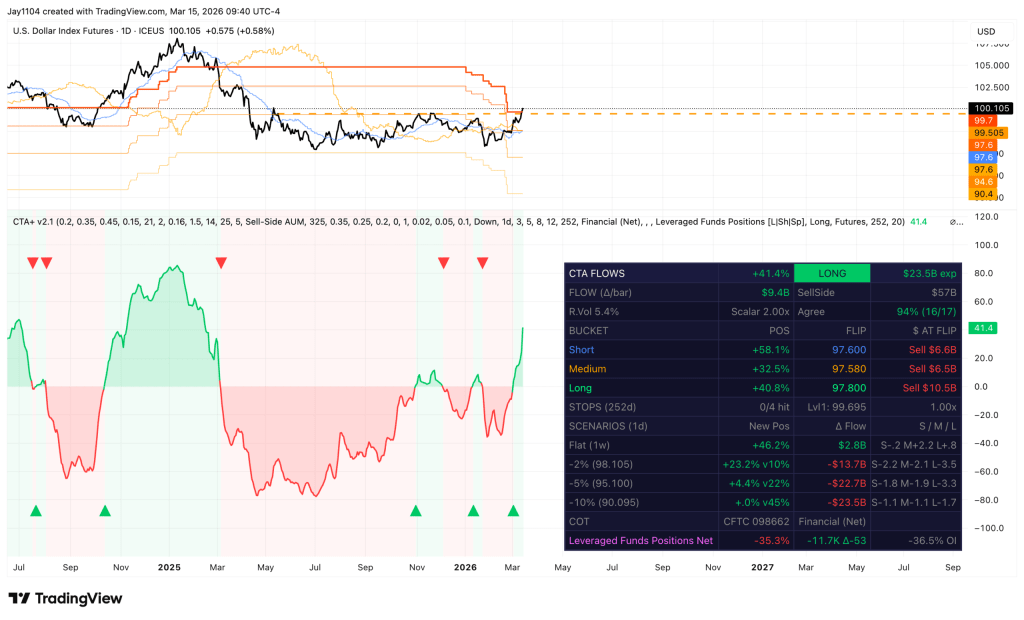
Such a scenario would likely require oil prices to stay elevated while interest rates and the U.S. dollar continue to strengthen. The U.S. Dollar Index could also extend its gains; a decisive break above 100.50 may open the door for a move toward 102.
With momentum indicators turning positive, it appears likely that CTAs and leveraged funds may start adding long dollar positions while reducing their existing shorts.
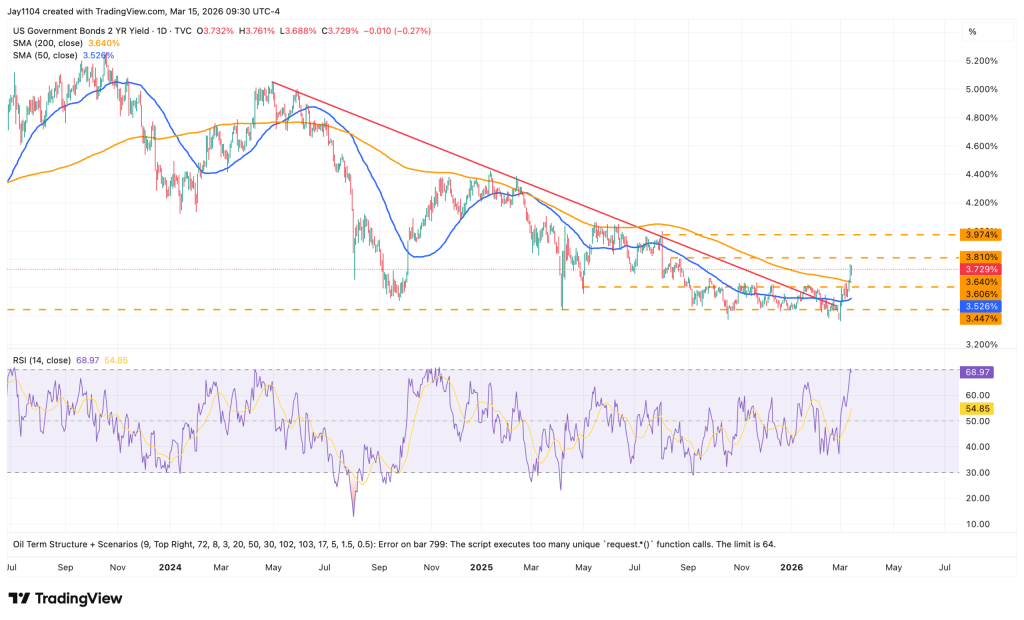
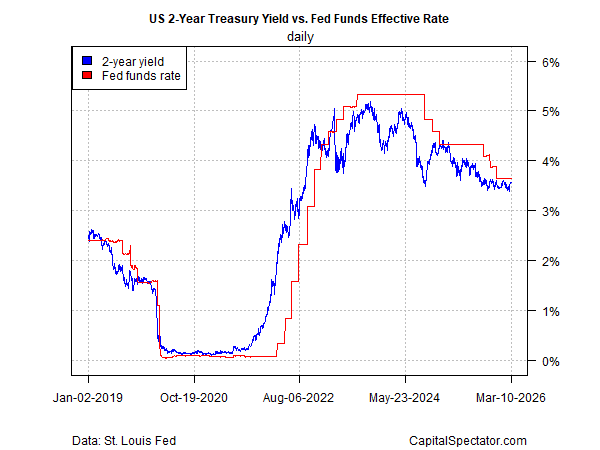
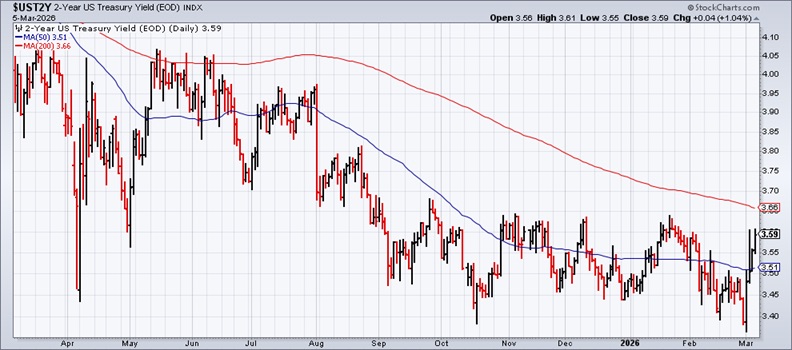
Meanwhile, the U.S. 2‑Year Treasury Yield may have room to extend higher, with the next resistance level seen near 3.80%, followed by a potential move toward 3.97%.
Technically, the outlook has strengthened as the yield has moved above its 200-day moving average, while the 50-day moving average is beginning to trend upward. In addition, the yield recently broke above a multi-year downtrend line that had been in place since April 2024, reinforcing the case for further upside momentum.
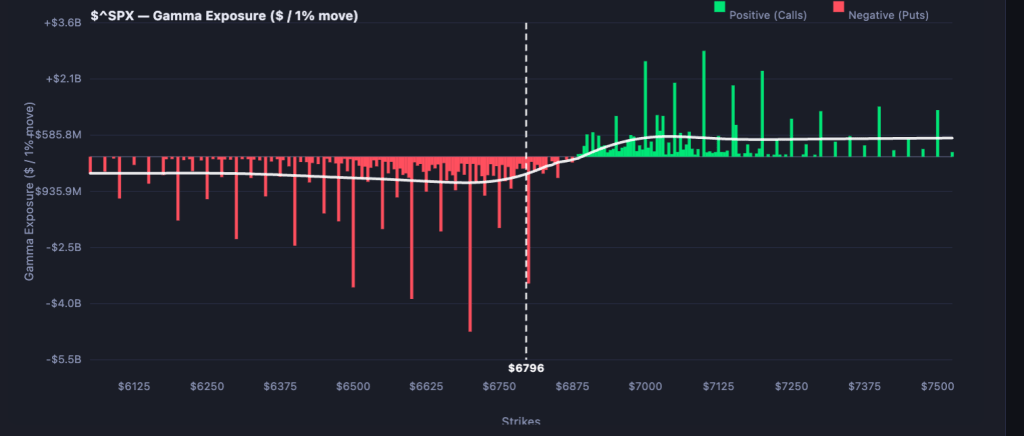
We’ll have to watch how the week develops. With options expiration (OPEX) taking place, market volatility could remain elevated. This is particularly true for the S&P 500, where put options currently dominate positioning, increasing the potential for sharp and erratic intraday price swings.
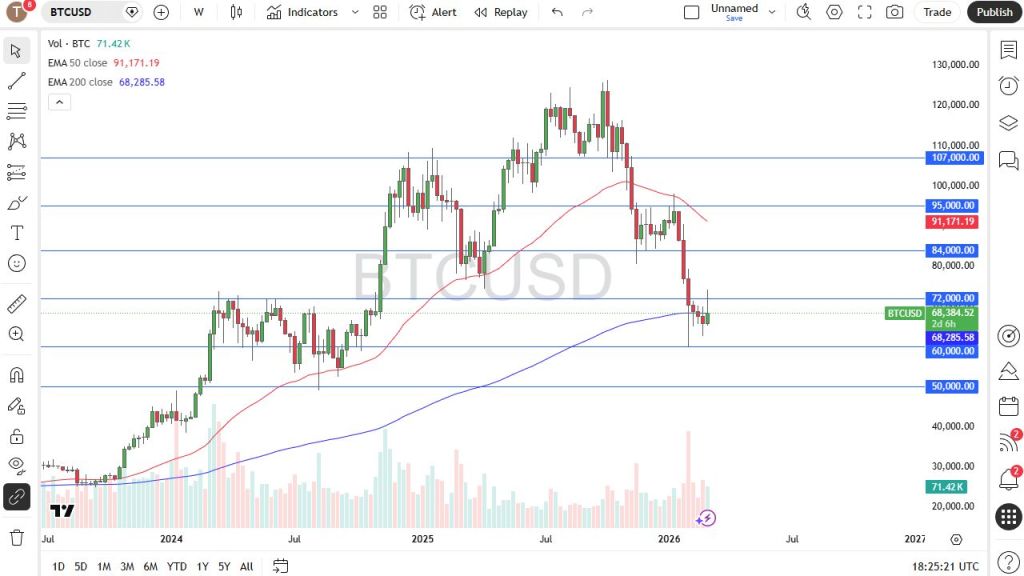
Bitcoin climbed above $74,000 on Monday, reaching its highest level in roughly six weeks as a wave of short liquidations supported the rally, although investors stayed cautious amid rising geopolitical tensions in the Middle East.
The largest cryptocurrency was last up 3.4% at $73,892.4 by 02:21 ET (06:21 GMT), after touching an intraday high of $74,336.9 earlier in the session.
Bitcoin gained about 6% last week even as global equity markets declined, with surging oil prices fueling concerns about inflation.
Crypto rallies on short liquidations
Cryptocurrency markets posted broad gains as traders who had bet on further price declines rushed to close their short positions.
Data from CoinGlass showed about $344 million in crypto liquidations over the past 24 hours, with short positions making up roughly 83% of the total.
Liquidations occur when leveraged traders are forced to close their positions after prices move against them, often intensifying price swings.
Despite the rebound, sentiment remained cautious as the conflict in the Middle East entered its third week, raising worries about global energy supply and inflation pressures.
Donald Trump, the U.S. president, has urged allies to help safeguard the Strait of Hormuz, a critical route for global oil shipments, as hostilities in the region continue.
Oil stays above $100 amid Iran war concerns
Reports indicated that despite repeated statements from U.S. officials claiming Iran’s military capabilities had been destroyed, drone attacks continued in Gulf states on Monday.
Oil prices remained supported above $100 per barrel amid fears of potential supply disruptions around the Strait of Hormuz, a key shipping route for global crude exports.
U.S. stock futures moved slightly higher in Asian trading on Monday as investors looked ahead to the upcoming policy meeting of the Federal Reserve, where policymakers are widely expected to keep interest rates unchanged while evaluating inflation risks.
Analysts noted that geopolitical uncertainty and broader macroeconomic risks could keep cryptocurrency markets volatile in the near term, even as short covering supports prices.
Oil prices increased on Monday as the ongoing conflict involving the United States, Israel, and Iran continued to disrupt oil production and transportation across the Middle East, despite a call from Donald Trump for international cooperation to protect the strategic Strait of Hormuz.
Brent crude futures climbed by $2.30, or 2.2%, reaching $105.44 per barrel at 0903 GMT, while U.S. West Texas Intermediate crude rose $1.29, or 1.3%, to $100 per barrel.
Both benchmarks have jumped more than 40% this month, reaching their highest levels since 2022. The surge followed U.S.–Israeli strikes on Iran, which led Tehran to halt shipments through the Strait of Hormuz—an essential route for global energy trade—disrupting roughly one-fifth of the world’s oil and LNG supplies.
On Monday, oil-loading activities were suspended at the UAE’s Fujairah port after a drone strike triggered a fire in the emirate’s petroleum industrial area, according to two sources who spoke to Reuters.
Fujairah, located outside the Strait of Hormuz, serves as an export hub for around 1 million barrels per day of the UAE’s flagship Murban crude oil, equivalent to roughly 1% of global oil demand.
The International Energy Agency warned on Thursday that the conflict in the Middle East is causing the most severe oil supply disruption on record, as major producers including Saudi Arabia, Iraq, and the United Arab Emirates have reduced output since the war began.
According to PVM analyst Tamas Varga, investors appear to understand that if just two weeks of disruption in the Strait of Hormuz have already caused significant damage to production, exports, and refining, a prolonged conflict could have far more serious consequences, particularly as global inventories continue to decline.
Analysts from ING said on Monday that recent U.S. strikes on Kharg Island over the weekend have heightened concerns about oil supply, as the majority of Iran’s crude exports are shipped through the island.
Although the attacks appeared to focus on military installations rather than energy infrastructure, ING noted that they still threaten supply stability. This is because Iranian crude is currently among the few oil flows still passing through the vital Strait of Hormuz.
During the weekend, Donald Trump warned that additional strikes could target Kharg Island—an export hub responsible for roughly 90% of Iran’s oil shipments—after U.S. forces hit military facilities there, prompting retaliatory actions from Tehran.
On Sunday, Trump called on other countries to assist in safeguarding this critical energy corridor and said that Washington was holding discussions with several nations about jointly monitoring and securing the strait.
Trump also stated that the United States remained in communication with Iran, though he expressed skepticism that Tehran was ready to engage in meaningful negotiations to bring the conflict to an end.
Meanwhile, the International Energy Agency announced on Sunday that more than 400 million barrels of strategic oil reserves would soon be released into the market—a record intervention intended to stabilize prices amid disruptions caused by the Middle East conflict.
According to the agency, reserves from countries in Asia and Oceania will be made available immediately, while supplies from Europe and the Americas are expected to enter the market by the end of March.
SEB analyst Meyersson said that as the conflict moves into its third week, the absence of a clear resolution is increasing global market anxiety about the possibility of an uncontrolled escalation.
However, U.S. Energy Secretary Chris Wright said on Sunday that he expected the war to end within the next few weeks, which could allow oil supplies to recover and energy prices to decline.
In a market dominated by passive strategies, investment decisions are often detached from traditional valuation metrics, which blurs the distinctions between classic styles such as value and growth.
Passive investors are commonly associated with broad market index funds tracking benchmarks like the S&P 500 or the Nasdaq. Yet passive capital also flows into sector- or factor-focused ETFs, including funds targeting areas such as consumer staples or large-cap growth.
While “passive” refers to not selecting individual stocks, it does not necessarily mean the investment behavior itself is passive. Increasingly, investors in passive vehicles actively trade themes and narratives, shifting capital between popular sectors and strategies.
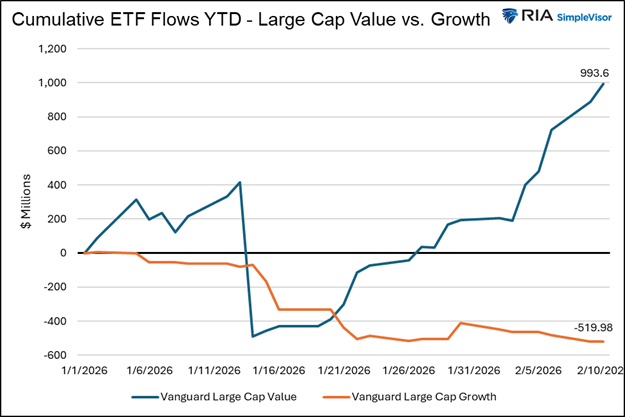
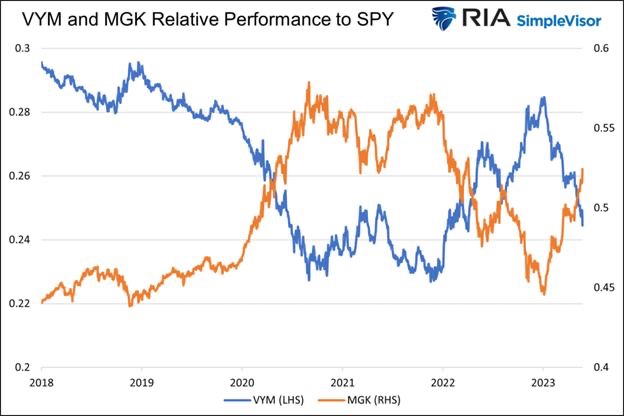
For example, in recent months, stocks within large-value ETFs have gained popularity, while the once-favored mega-cap technology names have lost momentum. This rotation is clearly visible in the diverging performance of value and growth ETFs and sectors, as well as in the inflows and outflows among the largest exchange-traded funds.
The first chart below highlights the sharp contrast in capital flows between the Vanguard Value ETF and the iShares Russell 1000 Growth ETF.
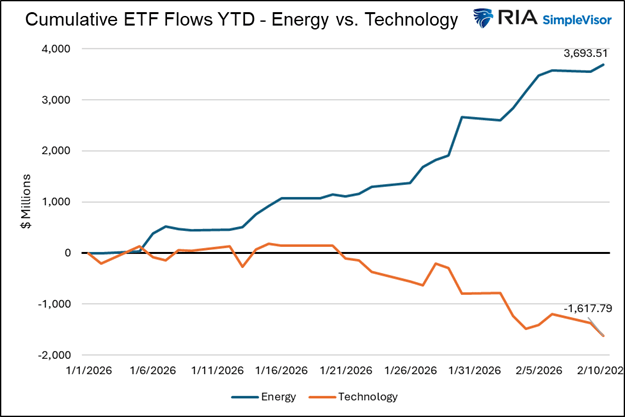
The second chart illustrates an even wider divergence in flows between the Energy Select Sector SPDR Fund and the Technology Select Sector SPDR Fund.
All flow data presented in the charts is sourced from ETF.com.
The Value Rotation Narrative
Financial media has been heavily focused on the apparent shift from “expensive” growth stocks into supposedly “cheaper” value stocks. However, as discussed in Part One, investors are largely responding to a narrative. In many cases, market participants believe they are buying value when they are actually selling it.
The value-rotation story generally goes like this: high-beta, mega-cap growth stocks have already enjoyed strong gains and now appear overvalued and risky. As a result, investors assume the logical move is to rotate into the opposite segment of the market—smaller-cap, lower-priced, and traditionally “value” sectors.
Whether or not this reasoning is accurate, the narrative itself is influencing markets, sectors, and factor performance. Even if many so-called value ETFs do not truly represent value, capital flows continue to follow the story until investor sentiment eventually shifts.
When narratives diverge from underlying fundamentals, however, distortions can emerge. For that reason, active investors must recognize the influence of prevailing narratives while also identifying genuine value opportunities—because eventually the market tends to reward them.
Why Traditional Screens Often Miss True Value
Most value investors start their search with quantitative screens that filter for metrics such as low price-to-earnings ratios, high dividend yields, or low price-to-book multiples. While these indicators are helpful starting points, they should not be treated as definitive conclusions. Frequently, they only highlight companies that appear inexpensive on the surface.
In reality, “cheap” valuation metrics can sometimes reflect underlying problems rather than attractive opportunities. For example:
Earnings could be cyclical and currently near their peak.
The company’s business model may be weakening.
Management execution might be inconsistent.
Emerging legal, political, or structural challenges could be affecting the outlook.
Many screening models—particularly those that rely on historical data rather than forward-looking estimates—struggle to differentiate between companies that are truly undervalued and those that are simply in decline. As a result, investors often mistake statistical cheapness for genuine value.
A Forward-Looking Framework
To properly assess value, investors should evaluate companies through several valuation perspectives. Each perspective addresses a different aspect of a company’s fundamentals, and when all three point in the same direction, the likelihood of identifying genuine value opportunities increases.
These perspectives focus on the past, present, and future. Investors should ask: Does the company have a strong earnings history? Is it currently performing well? And does it have solid prospects for future growth? Just as important as earnings themselves is how the current share price compares with past results, current performance, and expected future earnings.
Past Earnings
The first step is determining whether the stock appears expensive based on its recent financial performance. Measures such as trailing price-to-earnings ratios, free cash flow yield, and profit margins help investors evaluate valuation relative to earnings and cash flow generated over the past year or two.
One-Year Forward Earnings
Forward-looking estimates are often more informative than historical metrics—but only when those projections are credible. As the legendary investor Benjamin Graham once advised, investors should limit forecasts to what can reasonably be anticipated.
Businesses with stable financial trends, durable competitive advantages, and consistent management execution generally deserve greater confidence than companies reliant on optimistic projections, uncertain economic scenarios, or speculative growth stories.
Growth-Adjusted Valuations
As discussed earlier, both trailing and forward P/E ratios can appear elevated if earnings growth is expected to accelerate. For that reason, investors often incorporate the PEG ratio, which compares valuation multiples with anticipated growth rates.
This third layer is frequently absent from many screening approaches. It is also the most challenging to evaluate, since small adjustments to growth expectations can significantly influence whether a stock qualifies as a genuine value opportunity.
Applying the Framework
In Part One, we highlighted that companies such as Walmart and Costco—often perceived as classic value names—are not necessarily inexpensive.
Applying the three-tier framework shows that Walmart, for example, trades at a P/E ratio of 46, a forward P/E of 43, and a PEG ratio of 4.50, indicating a relatively high valuation across all three measures.
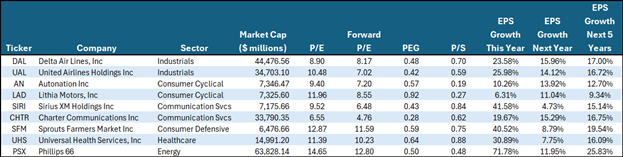
To help investors identify companies that may represent genuine value rather than merely appearing inexpensive, we developed a screening process. The companies that emerge from this screen combine relatively low valuations with solid earnings prospects and growth expectations that justify their current prices. While these stocks may better resemble true value opportunities in today’s market, they still carry risks.
The screen included the following criteria:
Market capitalization above $5 billion
U.S.-listed companies
P/E ratio
Forward P/E ratio
PEG ratio
Price-to-sales ratio
Quick ratio
Beyond the three primary valuation lenses, we also incorporated the price-to-sales ratio to reinforce the valuation assessment and the quick ratio to gauge a company’s short-term liquidity. Financial companies were excluded from the analysis because their earnings structures differ significantly from those of most other industries, making direct comparisons less meaningful.
Why True Value Often Gets Overlooked
Market outcomes are shaped not only by fundamentals but also by investor psychology and industry incentives. Many professional portfolio managers prefer to hold widely owned stocks because straying too far from benchmark indices can create career risk. Meanwhile, passive investment vehicles allocate capital according to index weightings that loosely align with their mandates, which naturally directs more money toward the largest and most established companies. Financial media narratives can further reinforce this dynamic by highlighting popular themes that attract even more capital to the same group of stocks.
These forces often create a self-reinforcing cycle: popular companies draw new inflows, rising prices follow, and the higher prices then attract additional investment. Companies that fall outside the spotlight frequently face the opposite pattern—even when their earnings and financial positions remain solid. As a result, the valuation gap between favored companies and overlooked ones can widen significantly.
For example, the companies identified in our screen generally represent only small positions in widely held ETFs. Phillips 66, the largest firm in the screen, represents just 3.78% of the Energy Select Sector SPDR Fund. Delta Air Lines and United Airlines—the next-largest companies—account for only 0.86% and 0.67% of the Industrial Select Sector SPDR Fund respectively. Their weights are even smaller in the large-cap value ETF Vanguard Value ETF.
The Value Trap
A common misconception in investing is that a stock that looks “cheap” automatically qualifies as a value investment. In reality, one of the riskiest situations is when a stock appears inexpensive but lacks the earnings strength, growth potential, or stability needed to justify its low valuation.
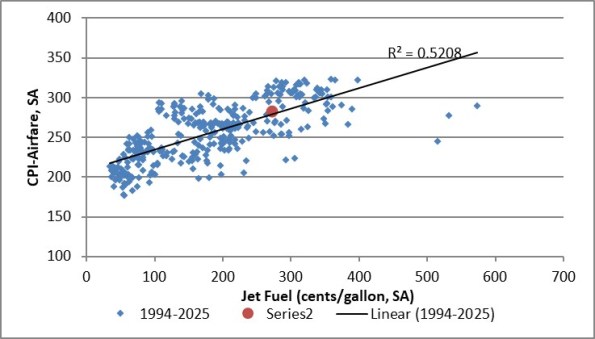
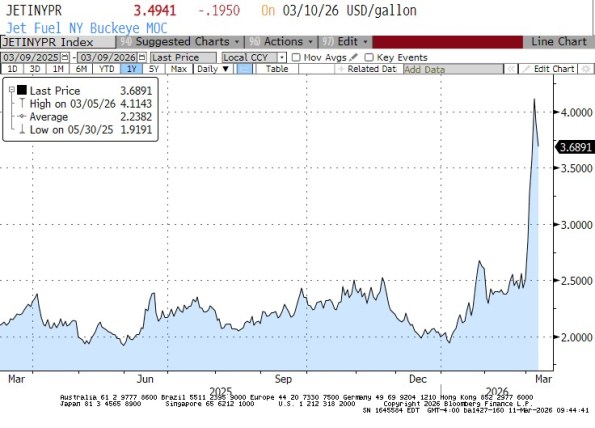
Take the airline sector as an example. Both Delta Air Lines and United Airlines appear in our screen as potential value candidates. However, their revenue prospects are highly sensitive to economic conditions and jet fuel prices. In addition, a meaningful share of their profits comes from airline credit card reward partnerships. If the economy slows, forecasts for strong double-digit earnings growth may prove unrealistic.
Rising jet fuel costs also pose an important question: can airlines pass those higher costs on to consumers? Another uncertainty is whether increasing competition from newer financial service providers could pull customers away from airline rewards cards tied to networks such as Visa and Mastercard.
Ultimately, genuine value investing requires both a reasonable price and credible earnings prospects. The stronger the investor’s confidence in a company’s future earnings growth, the higher the likelihood that a value investment will succeed.
Summary
Identifying true value has always been challenging, but the rise of passive investing has made the task even more difficult. Many investors today purchase “value” in name only, often through ETFs labeled with the term. These funds attract capital from investors seeking value exposure, yet fewer participants are actively searching for genuinely undervalued companies.
This dynamic can lead to a wide divergence between stocks perceived as value and those that truly offer value. Over time, such market distortions can create compelling opportunities—though investors must remain patient while waiting for those valuation gaps to eventually close.
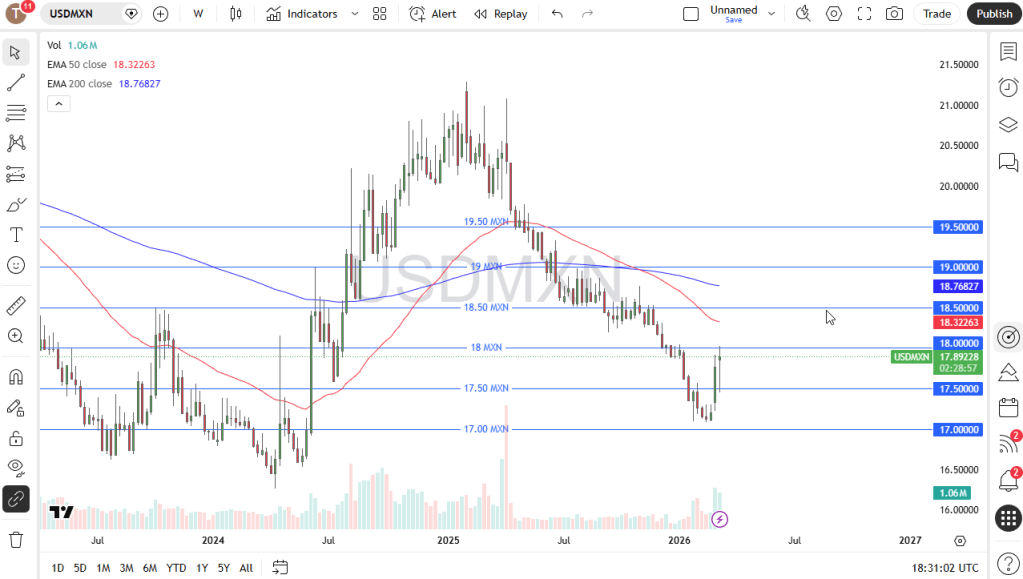
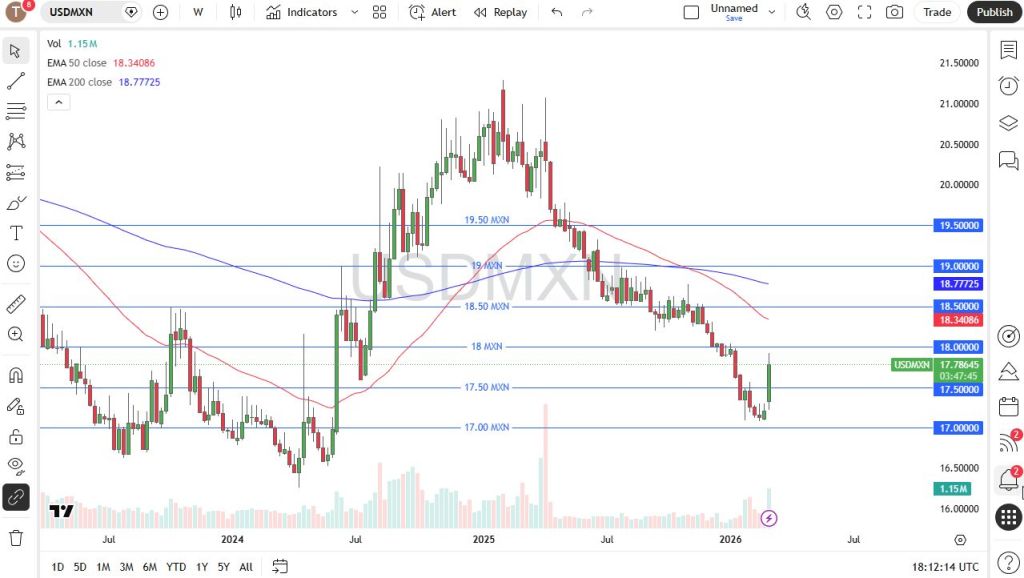
The U.S. dollar remained highly volatile over the past week as markets continued to assess the broader risk appetite outlook. The 18 MXN level still stands as a major resistance barrier, while the weekly candlestick formed a hammer pattern, signaling the potential for continued volatility. However, it is important to remember that holding long positions may carry costs due to interest rate differentials. A move lower would likely indicate a return of risk appetite in the market.
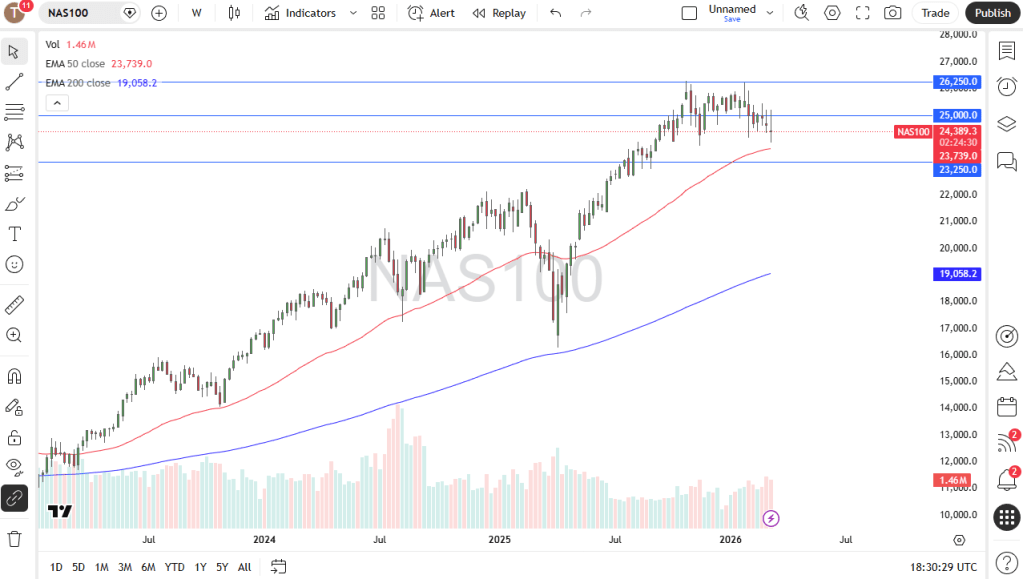
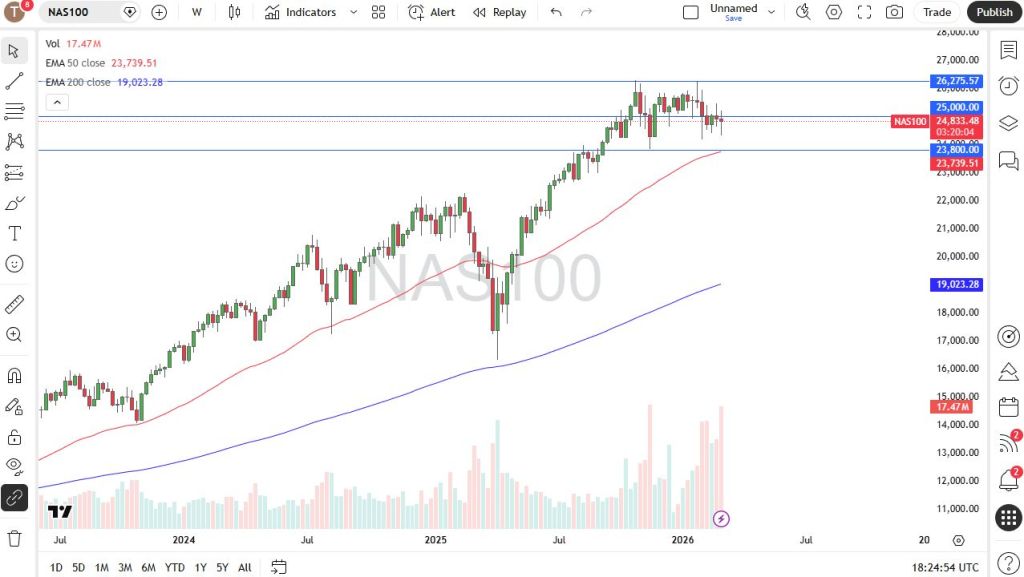
NASDAQ 100
The NASDAQ 100 experienced significant volatility over the past week, driven largely by rising U.S. interest rates and ongoing war-related headlines. Surging energy costs could also pose challenges for many AI-related companies, creating a lingering overhang that may weigh on the market. That said, a major sell-off does not appear likely at this stage. Instead, the market is likely to remain choppy, with pullbacks continuing to attract buyers.
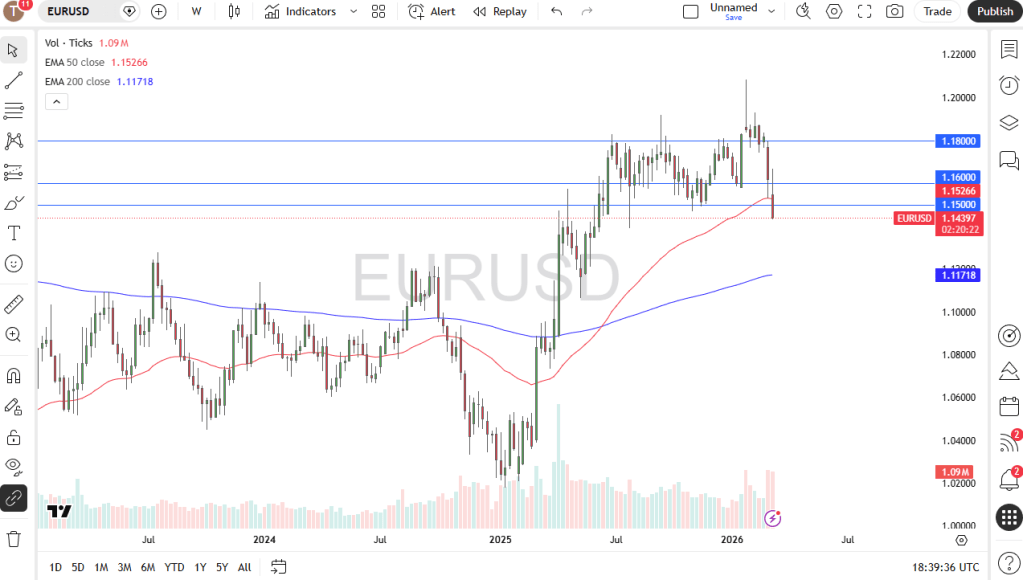
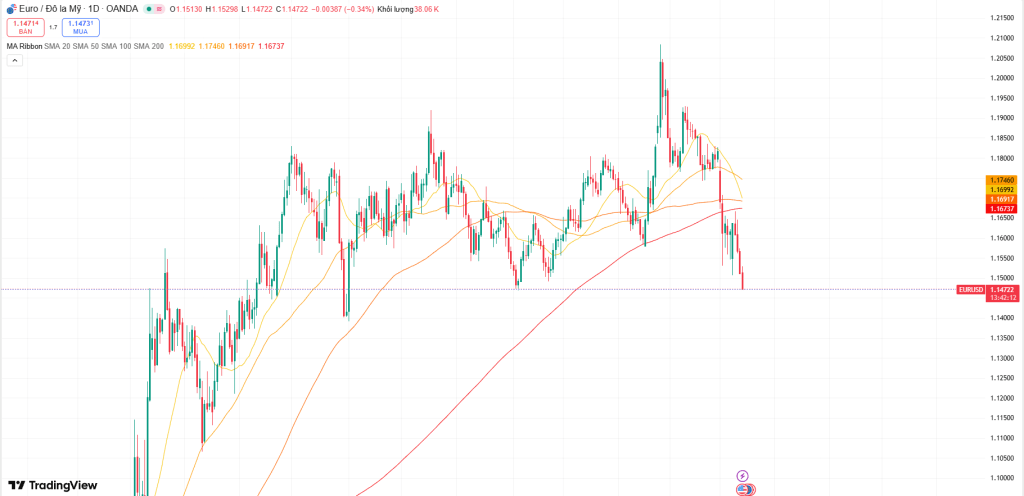
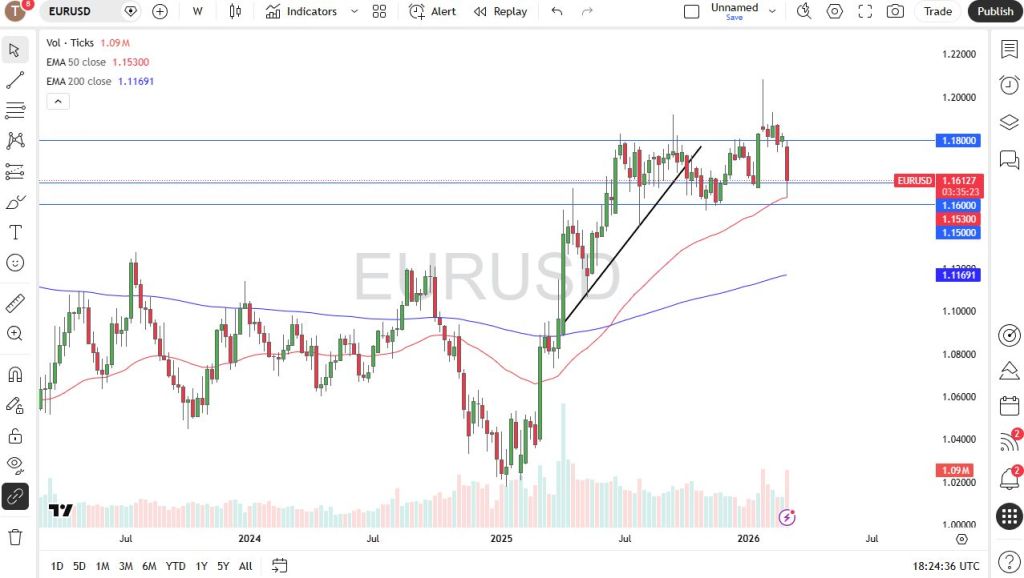
EUR/USD
The euro has declined sharply over the past week and has now slipped below the key 1.15 level, an area closely monitored by many traders. As a result, investors appear to be moving toward the US dollar in search of safety. At the same time, inflation in the United States remains persistent, leading traders to believe the Federal Reserve may have to keep interest rates higher for longer. Meanwhile, the European Central Bank must contend with potential energy shortages that could pose challenges for the continent.
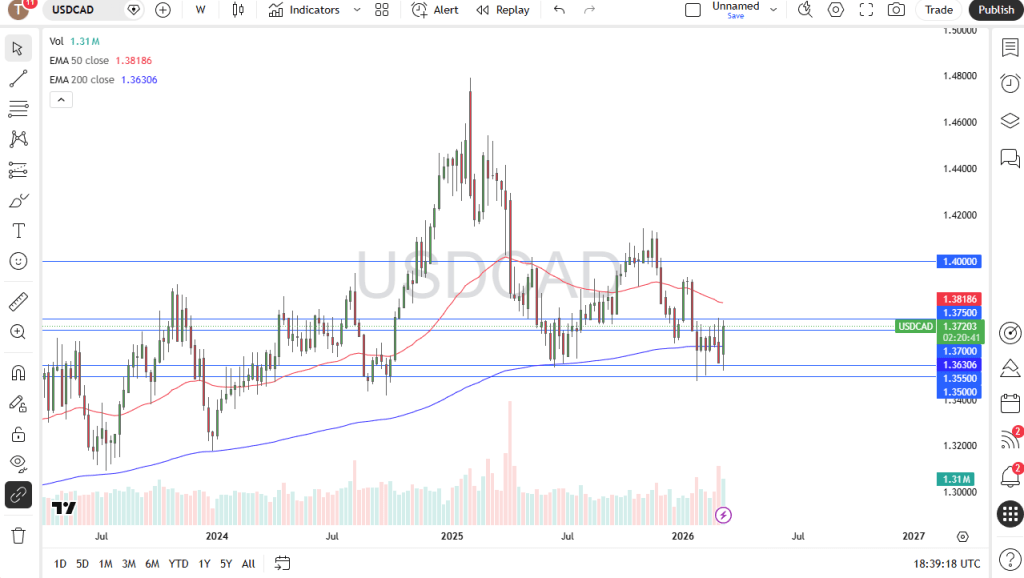
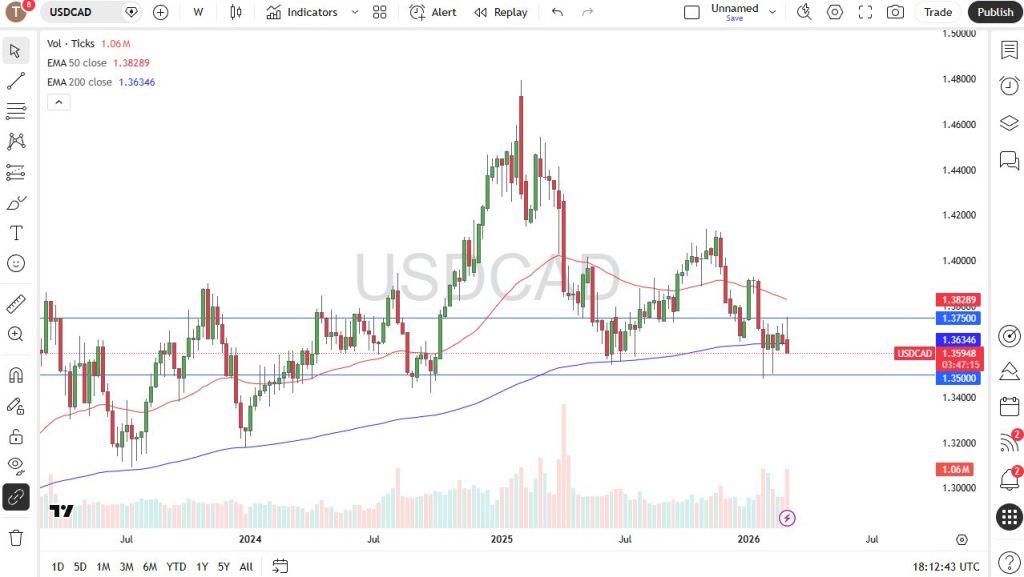
USD/CAD
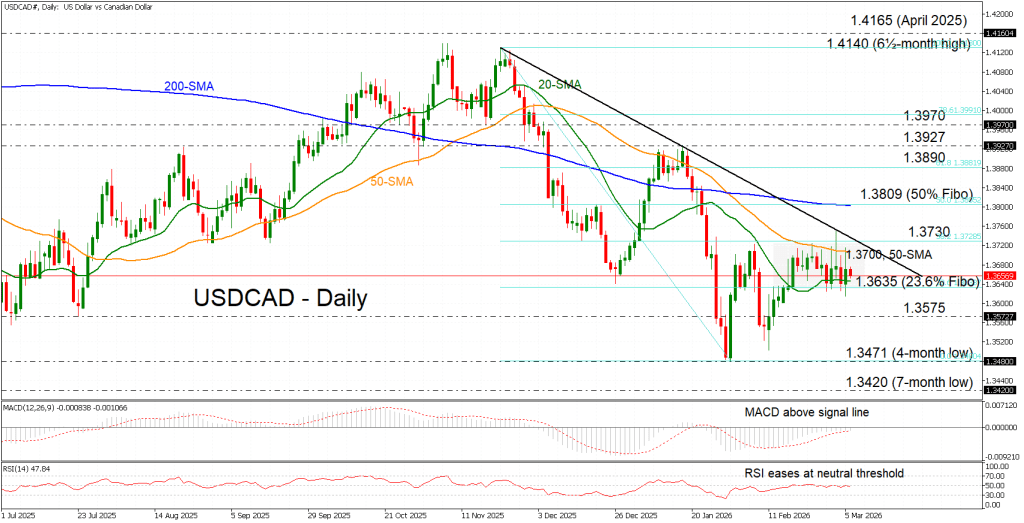
The US dollar strengthened for most of the week, with the market continuing to encounter significant resistance around this area. The 1.3750 level remains a key obstacle, having acted as a strong barrier on several occasions. While higher oil prices typically support the Canadian dollar, this pair may behave differently as the United States keeps boosting its oil output, currently around 14 million barrels per day. As a result, the pair is likely to be driven largely by shifts in risk sentiment, with traders turning to the greenback during periods of uncertainty.
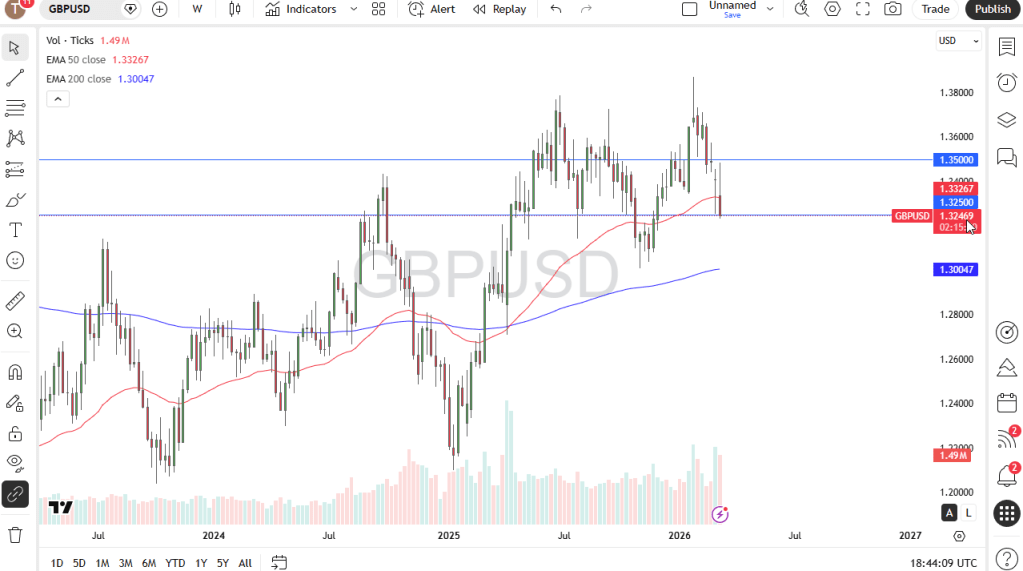
GBP/USD
The British pound attempted to rally over the past week but was sharply pushed lower as risk appetite deteriorated. GBP is now threatening a breakdown below the 1.3250 level. If it falls through that support, the next potential target could be around 1.30. Any rallies at this stage may present selling opportunities, as several factors continue to drive traders toward the US dollar. For now, buying interest remains limited, especially with ongoing war-related headlines that could continue to influence market sentiment.
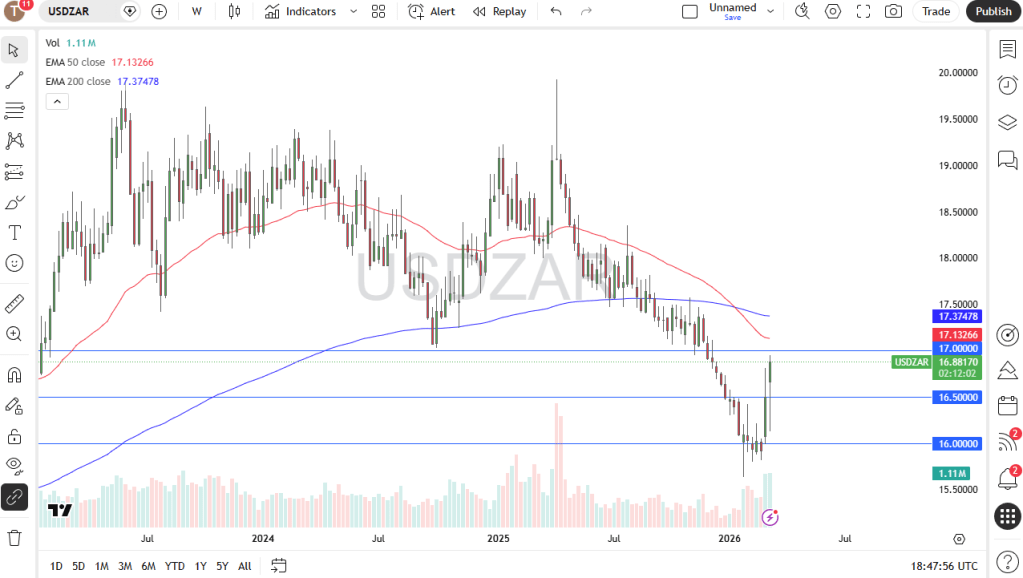
USD/ZAR
The US dollar started the week on the back foot but then rebounded sharply as traders navigated the ongoing risk aversion dominating the market. South Africa sits on the higher end of the risk spectrum, and concerns about the country’s ability to secure sufficient energy supplies are prompting capital outflows. As a result, the pair is now approaching the 17 ZAR level, a significant round and psychological threshold that many traders monitor closely. A break above this level could trigger a stronger move higher, suggesting the market is nearing a key turning point.
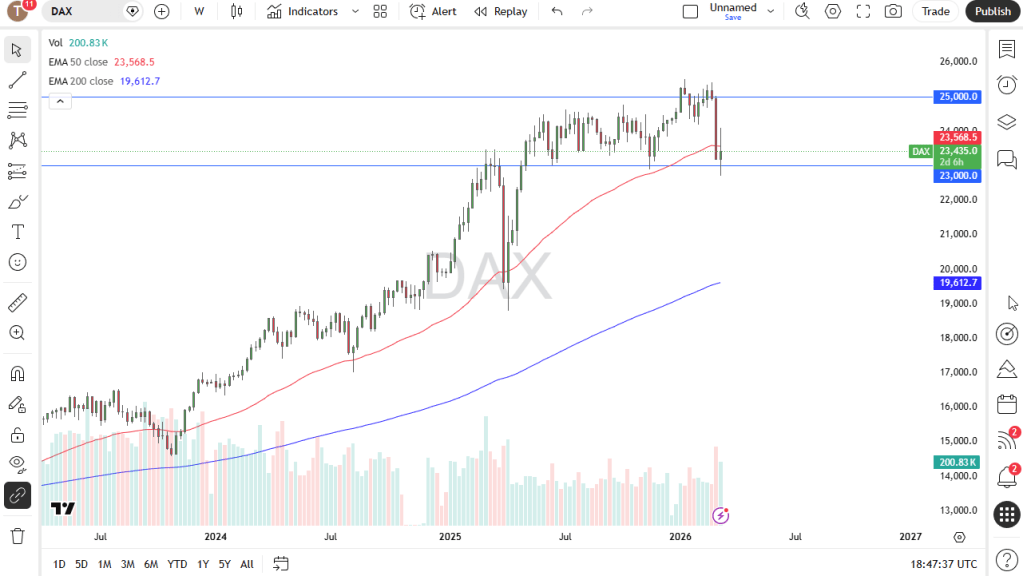
DAX
The German index has remained highly volatile, much like other markets, but it has so far managed to hold relatively steady, with the 23,000-euro level acting as a potential floor. From here, the market may attempt to recover. However, a closer look at the daily chart shows considerable choppiness, suggesting the index may be trying to form a base before any broader turnaround. If the market were to break below the 23,000-euro level, it could trigger a much sharper decline.
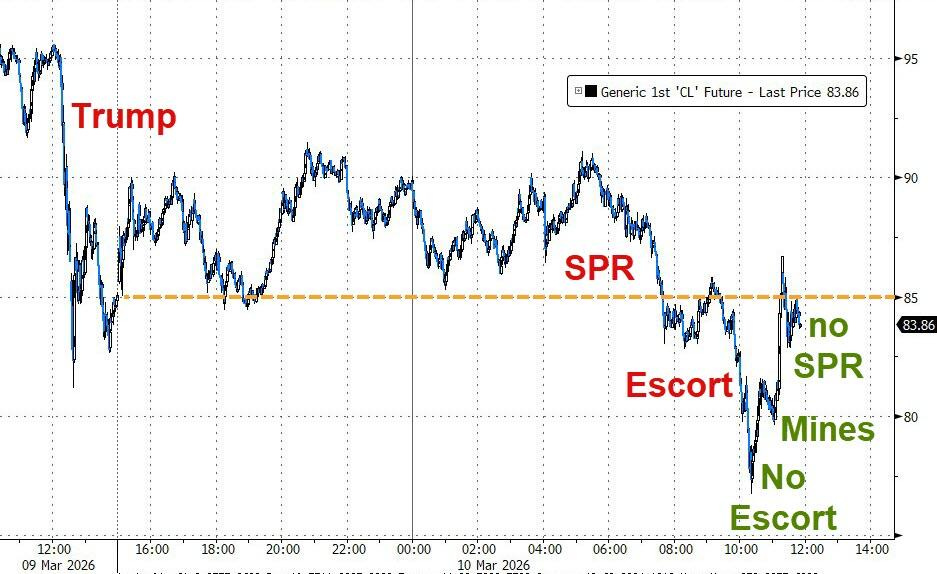
U.S. President Donald Trump has rejected Iranian proposals for a ceasefire, signaling that Washington intends to continue its “Operation Epic Fury” military campaign until Tehran agrees to tougher conditions, including the complete dismantling of its nuclear program.
With the conflict now entering its third week and the regional death toll approaching 3,750, the White House is reinforcing its “maximum pressure” strategy. At the same time, the effective shutdown of the Strait of Hormuz has helped keep global crude prices hovering close to $100 per barrel.
Hormuz tensions and Washington’s tougher demands
In a Saturday interview with NBC, Trump said Iran appears “ready to negotiate,” but emphasized that its current proposals do not meet U.S. strategic expectations. His refusal to scale back the offensive comes as Washington pushes for a multinational naval task force—including China, France, Japan, South Korea, and the United Kingdom—to reopen the world’s most critical maritime energy route.
The U.S. demands follow a wave of major strikes on Kharg Island, Iran’s main crude export terminal. Trump said military facilities there had been “obliterated,” though he claimed oil infrastructure was deliberately spared “out of decency.”
However, the president warned that restraint could end if Iran continues using mines and drones against commercial shipping. So far, at least 16 vessels have been targeted, prompting major oil exporters such as Saudi Arabia, Iraq, and Kuwait to scale back crude production.
Regional escalation and Fujairah’s role as a bypass
The conflict broadened overnight as Iran launched retaliatory attacks across the Persian Gulf, striking targets linked to Israel and several Arab energy hubs. The United Arab Emirates said its defenses have intercepted roughly 1,600 drones and 300 missiles since fighting began. Explosions were reported over Dubai as air defense systems engaged incoming threats.
Tensions intensified further after Tehran accused the UAE of allowing strikes on Iranian territory to be launched from its soil. Meanwhile, the port of Fujairah—a key export route that bypasses the Strait of Hormuz—resumed loading operations on Sunday after briefly suspending activity due to a drone-triggered fire.
Analysts view the stability of this alternative route as crucial to preventing a broader collapse in Gulf energy exports. Saudi Arabia also reported intercepting drones near Riyadh, while Qatar has suspended LNG shipments.
With the region’s defensive network under increasing strain, the prolonged confrontation risks turning into a sustained disruption to the global energy supply chain.
Stablecoins are transitioning from a niche cryptocurrency instrument into a macro-relevant component of the financial system, connecting global payment activity with U.S. dollar liquidity and short-term Treasury markets, according to a report from BCA Research.
The firm noted that the rapid growth of stablecoins could gradually alter parts of the global financial landscape as their use expands beyond crypto trading into areas such as payments, remittances, and tokenized assets.
Stablecoins are blockchain-based digital tokens designed to maintain a stable value by referencing another asset, most commonly the U.S. dollar. Their circulation has increased significantly in recent years, with total supply now exceeding $300 billion, compared with about $30 billion in 2020.
Because issuers must hold reserves to back the tokens they create, those funds are typically placed in highly liquid and low-risk assets such as U.S. Treasury bills, reverse repurchase agreements, and bank deposits. As the market expands, stablecoin issuers are becoming increasingly important marginal buyers of short-term U.S. government debt.
According to BCA, this development establishes a new channel linking worldwide payment demand to the U.S. Treasury market. Rising stablecoin issuance could boost demand for Treasury bills and potentially influence short-term interest rates, especially if new inflows represent additional capital rather than funds shifting from existing investors.
Adoption is also spreading geographically, particularly in emerging economies dealing with inflation, currency depreciation, or capital controls. In such environments, digital dollar tokens can function as a store of value and provide access to dollar-based financial services outside traditional banking channels.
This dynamic may further strengthen global demand for the U.S. dollar while creating policy challenges for governments where the growing use of digital dollars accelerates currency substitution and capital outflows.
Stablecoins may also pose competitive pressure for banks. The report highlighted that expanding digital dollar balances could divert funds from traditional bank deposits—especially non-interest-bearing transaction accounts—forcing banks to compete more aggressively to attract funding.
Despite their rapid growth, BCA emphasized that stablecoins still account for a relatively small portion of global payments and financial assets. However, continued expansion, clearer regulation, and broader institutional adoption could significantly increase their economic influence over the next decade.
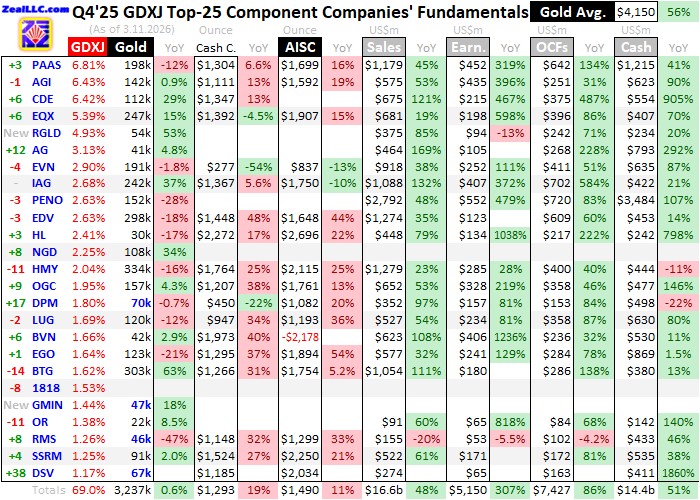
Mid-tier and junior gold mining companies have largely completed reporting what has turned out to be the strongest quarter the industry has ever seen. These smaller producers—often considered the sector’s sweet spot for upside—once again broke numerous records and clearly outperformed the large major miners. In the latest quarter, mid-tier companies posted exceptional figures across the board, including revenue, net earnings, profit per ounce, operating cash flow, and cash reserves. Remarkably, early indicators suggest the current quarter could deliver even stronger results.
The main benchmark tracking mid-tier gold miners is the VanEck Junior Gold Miners ETF (GDXJ). With about $10.6 billion in assets under management as of midweek, it remains the second-largest gold-mining ETF after its counterpart, the VanEck Gold Miners ETF (GDX). While GDX is dominated by the largest mining companies, there is considerable overlap between the two funds. Despite its name, GDXJ today functions primarily as a mid-tier gold miner ETF, with true junior miners representing only a smaller share of the portfolio.
Gold mining companies are typically categorized by annual production levels measured in ounces. Junior miners generally produce less than 300,000 ounces per year, mid-tier producers generate between 300,000 and 1 million ounces, major miners exceed 1 million ounces, and the largest “super-major” companies produce more than 2 million ounces annually. On a quarterly basis, these thresholds translate to roughly under 75,000 ounces for juniors, 75,000–250,000 for mid-tiers, more than 250,000 for majors, and over 500,000 for super-majors. Among the 25 largest holdings of GDXJ, only four actually qualify as true juniors today.
In the referenced analysis table, quarterly production figures are highlighted in blue. Junior miners are defined not only by producing under 75,000 ounces per quarter but also by generating more than half of their revenue from gold production itself. This classification excludes streaming and royalty companies—firms that provide upfront capital for mine development in exchange for future production—as well as primary silver miners that produce gold as a byproduct. Even so, mid-tier miners often present more attractive investment opportunities than juniors.
The mid-tier companies dominating GDXJ offer a compelling combination of diversified production, strong growth potential, and relatively smaller market capitalizations, which create room for outsized gains. Compared with junior miners, they generally carry less operational risk, yet they tend to deliver greater upside during gold rallies than the large majors.
For many years, these mid-tier miners were largely overlooked by investors, but attention toward the group has grown recently. In 2025, leading up to gold’s mid-October peak, GDXJ surged an impressive 161.3% year-to-date. However, the sector experienced a sharp correction early in the fourth quarter as gold prices briefly retreated, sending GDXJ down 21.6% within just a few weeks. Once gold rebounded, the ETF quickly recovered, climbing another 38.9% by late December.
Interestingly, unlike GDX, GDXJ’s share price did not approach its historical highs during the quarter. The ETF originally peaked at $146.20 back in December 2010 and did not finally surpass that level until late January 2026, when gold reached an extremely overbought condition. The average price of GDXJ during Q4 2025 was about $103.33—still well below the $127.84 average recorded in Q4 2010. Even the strong rally earlier in the quarter did not push valuations to historic extremes.
At one point in early October, GDXJ traded 69.5% above its 200-day moving average, an unusually stretched level. However, this was still below the even more extreme 84.2% deviation reached in mid-2016. Over the course of gold’s massive 139.1% bull market from October 2023 to October 2025, GDXJ rose about 262.3%. That equates to only about 1.9 times leverage relative to gold’s gains, which is far below the historical pattern where smaller miners often amplify gold’s performance by three to four times.
Following a rapid correction, gold’s bull market resumed and continued climbing into late January 2026, ultimately reaching a total gain of roughly 196.4%. During that period, GDXJ increased about 387.9%, representing only around 2.0 times leverage to the metal. In other words, despite strong absolute returns, smaller gold miners have still underperformed relative to gold itself. This suggests that their share prices could still rise substantially as more investors begin to recognize the sector’s strong fundamentals.
For 39 consecutive quarters, the analyst behind this research has examined the operational and financial results of the 25 largest companies within GDXJ. These firms—mostly mid-tier producers—now account for roughly 69% of the ETF’s total weighting. While reviewing quarterly reports requires extensive effort, it provides valuable insight into the underlying fundamentals of smaller gold miners and helps cut through the often misleading market sentiment surrounding the sector.
The accompanying table summarizes key operational and financial metrics for the top 25 GDXJ holdings in Q4 2025. The stock symbols listed are not all U.S. listings and are preceded by their ranking changes within the ETF over the past year. These shifts largely reflect changes in market capitalization, highlighting which companies have outperformed or lagged since Q4 2024. Each company’s current weighting within GDXJ is also provided.
The table then details each miner’s gold production during Q4 2025, measured in ounces, along with year-over-year changes compared with Q4 2024. Production remains the lifeblood of the mining industry, and investors typically place the greatest emphasis on companies that can consistently grow output. Cost metrics follow, including cash costs and all-in sustaining costs per ounce, both of which provide insight into the profitability of each operation.
Additional financial data—such as quarterly revenue, net income, operating cash flow, and total cash holdings—comes directly from regulatory filings. Some data points may appear blank if companies had not yet reported those figures at the time of analysis. Year-over-year comparisons are also excluded in cases where they would be misleading, such as when figures shift from negative to positive or vice versa.
With gold’s average quarterly price soaring 56% year-over-year to a record $4,150 in Q4, the results for smaller gold miners were bound to be exceptional. Indeed, the industry delivered the strongest performance ever recorded. And if that were not impressive enough, preliminary data suggests the current quarter is shaping up to be even stronger. Mid-tier and junior miners clearly deserve far greater attention from investors than they have received so far.
Last week, a similar study was conducted on the Q4 results of the 25 largest gold miners within the VanEck Gold Miners ETF (GDX). These results serve as an important benchmark when comparing the performance of the 25 largest mid-tier miners in the VanEck Junior Gold Miners ETF (GDXJ). Over many quarters and years, smaller gold miners have consistently delivered stronger fundamental performance than their larger counterparts. Given that mid-tier companies outperform majors across most key metrics, there is little strategic rationale for prioritizing investment in major miners. In theory, GDXJ should attract significantly more capital than GDX.
However, as of midweek, GDXJ’s total assets were only about one-third the size of GDX. As more investors and traders examine the sector closely and recognize the superior operational and market performance of smaller gold miners, this imbalance may gradually shift. Mid-tier miners deserve stronger capital inflows than the majors, which could push their share prices higher at a faster pace. The Q4 comparison between GDXJ and GDX once again reinforced this argument.
During the fourth quarter, the top 25 GDXJ miners collectively produced approximately 3.237 million ounces of gold, representing a modest 0.6% increase year-over-year. While this growth was slightly below the global mined-gold output increase of 1.1% reported by the World Gold Council, it still significantly outperformed the production trend among the GDX top 25 majors. Those large miners experienced a steep 12% year-over-year decline in output. After adjusting for a structural change in the ETF composition, the majors’ production decline was closer to 5.6%, but this still lagged mid-tier performance.
Fundamentally, major and mid-tier gold miners operate under different dynamics. Large mining companies often struggle with declining production because of depletion at their massive operating scale. Mid-tier companies, by contrast, usually operate smaller portfolios of mines—often between one and four. This means that expansions or new projects can have a meaningful impact on their overall production levels. As a result, mid-tier companies are generally better positioned to offset depletion and maintain steady production growth.
Production growth is critical in the gold mining industry because it generates the cash flow needed to expand existing operations, develop new mines, or acquire producing assets. These investments ultimately support higher stock valuations. Interestingly, mid-tier miners frequently maintain lower mining costs than large producers, despite the supposed economies of scale enjoyed by major companies. Lower costs relative to output translate into higher profitability, which in turn can drive stronger share-price appreciation.
Another factor supporting mid-tier stock performance is their smaller market capitalization. The average market cap of the 25 largest GDX companies stood at roughly $38.8 billion last week—around 2.8 times higher than the average $13.9 billion market cap of the top 25 GDXJ miners. The five largest holdings in GDX averaged $98.3 billion each, compared with $20.3 billion for GDXJ’s top five. Companies with smaller market capitalizations typically require less capital inflow to drive significant stock-price movement, giving them greater upside potential.
Analyzing fourth-quarter results can be challenging because many mining companies delay reporting until their year-end annual reports are finalized. Some firms within the leading gold-miner ETFs do not release their Q4 results until mid-to-late March. One such company is Harmony Gold Mining Company from South Africa, which only reported its results this week. Harmony is notable because it appears among the top 25 holdings in both GDX and GDXJ.
Because Harmony is a large major producer, its results are important for comparison. Its late reporting meant it was excluded from the earlier GDX analysis but has now been incorporated into updated comparisons. Including Harmony slightly changes the previously reported GDX figures. Given its large size, the company arguably should not have been included in the GDXJ portfolio in the first place.
In general, unit mining costs tend to decline as production volumes increase. This is because many operational expenses for gold mines are fixed during the planning and construction phases, when processing plant capacities are determined. Infrastructure, equipment, and labor requirements remain relatively stable regardless of short-term production fluctuations.
The primary factor influencing quarterly production is the grade of the ore processed by the mining facilities. Ore grades can vary significantly even within the same deposit. Higher-grade ore produces more gold per ton, spreading fixed operating costs over more ounces and lowering per-unit costs. However, in addition to these fixed costs, gold mining also involves significant variable costs—many of which have been affected by the high inflation seen in recent years.
Cash costs remain the traditional metric for measuring mining expenses, covering the direct cash expenditures required to produce an ounce of gold. However, this measure does not include the capital investments required for exploration or mine construction. For that reason, cash costs should be viewed mainly as a minimum survival threshold, indicating the lowest gold price needed for mines to remain operational.
In Q4 2025, the average cash cost among the top 25 GDXJ miners surged 19.1% year-over-year to a record $1,293 per ounce. By comparison, the GDX top 25 majors experienced a smaller increase, with cash costs rising 7% to $1,238. One of the main drivers behind these increases was higher royalty payments, which rise alongside gold prices because they are typically calculated as a percentage of production value.
For example, Lundin Gold reported a 33.6% year-over-year increase in cash costs to $947 per ounce, partly due to higher royalty obligations and employee profit-sharing tied to record gold prices. Meanwhile, OceanaGold saw royalty payments across its operations increase sixfold in absolute terms compared with the same quarter the previous year.
A more comprehensive cost metric is the all-in sustaining cost (AISC), introduced by the World Gold Council in 2013. AISCs include cash costs along with sustaining capital expenditures and other operational expenses required to maintain current production levels. As such, they provide a clearer picture of true profitability.
Cash costs typically represent the largest portion of AISCs. In Q4 2025, they accounted for nearly seven-eighths of the average AISC among the top 25 GDXJ miners. As a result, rising royalty expenses pushed AISCs higher as well. During the quarter, the group’s average AISC rose 10.7% year-over-year to a record $1,490 per ounce. Even so, this still compared favorably with the GDX majors, whose AISCs climbed 16% to $1,687.
However, these averages were distorted by an extreme outlier. Peru’s Compañía de Minas Buenaventura reported a remarkable negative AISC of $2,178 per ounce. This unusual result stems from the company’s polymetallic production profile. While it reports results in gold-equivalent terms, its operations primarily produce other metals such as silver, copper, zinc, and lead. Gold accounted for only about 28% of its revenue in the quarter.
Because the company treats other metals as byproducts that offset gold-production costs, its gold AISCs can appear extremely low or even negative. Such anomalies have occurred repeatedly over the past nine quarters. Although Buenaventura was historically a top-25 holding in both GDX and GDXJ, it has recently fallen to 27th place in GDX as other companies have outperformed.
For consistency, all reported figures—including outliers—are included in the long-term dataset used in this research. Without Buenaventura’s unusual figures, the average AISC for the GDXJ top 25 would have been $1,719 per ounce in Q4, representing a much larger 27.7% year-over-year increase.
Other factors also influenced the cost averages. For instance, Hecla Mining reported exceptionally high AISCs of $2,696 per ounce, while New Gold did not release Q4 results due to its pending acquisition by Coeur Mining. In the previous quarter, New Gold had reported relatively low AISCs of around $966.
After decades of studying the gold-mining sector, the analyst considers “implied unit earnings” to be the most useful metric for evaluating the collective performance of mid-tier miners. This measure subtracts the average AISC from the average quarterly gold price, providing a clearer indicator of profitability than accounting earnings, which can be distorted by non-cash items.
In Q4 2025, the average gold price reached a record $4,150. Subtracting the $1,490 AISC yields implied profits of approximately $2,660 per ounce. This represents an extraordinary 102.4% increase year-over-year and the highest profitability ever recorded for either GDXJ or GDX miners.
This milestone extends a remarkable trend. Over the previous ten quarters, the GDXJ top 25 recorded year-over-year implied earnings growth of 106%, 133%, 63%, 63%, 71%, 95%, 91%, 79%, 82%, and 102%. Few sectors in global equity markets have experienced such sustained profit growth. With such performance, mid-tier gold miners arguably deserve to be among the most sought-after sectors for investors.
The trend may continue. With more than three-quarters of Q1 2026 completed, gold has averaged roughly $4,931 so far. If this level holds, it would represent another extraordinary year-over-year increase of about 72%. This rise would likely continue to outpace cost inflation among mid-tier miners.
Based on guidance, the average 2026 AISC for the GDXJ top 25 is projected to reach about $1,857 per ounce. Excluding unusually high estimates—such as the $3,075 forecast from Hecla Mining—the average falls closer to $1,776. Using a conservative estimate of $1,850, implied profits in Q1 2026 could approach another record near $3,080 per ounce, representing roughly 107% year-over-year growth.
Gold stocks also benefit from seasonal patterns. Historically, gold experiences three major rallies during the year—autumn, winter, and spring. The winter rally tends to be the strongest for gold itself, while the spring rally—from mid-March through early June—often delivers the strongest outperformance for gold-mining stocks. That seasonal window coincides with the release of Q1 earnings, which could further boost investor enthusiasm.
Sometimes accounting results differ from implied profitability due to non-cash adjustments. However, that was not the case in Q4 2025. The top 25 GDXJ miners reported total revenue of $16.6 billion, up 48.1% year-over-year and marking a new industry record. Net earnings surged even more dramatically, jumping 307% to a record $5.15 billion.
After adjusting for unusual items such as asset impairments or valuation changes, total earnings remained almost unchanged at $5.16 billion—still representing a massive 252% increase compared with Q4 2024.
Operating cash flow also surged, rising 86.3% year-over-year to a record $7.43 billion. This influx of cash boosted the combined cash reserves of the GDXJ top 25 to another all-time high of $14.4 billion, up 50.8% from the previous year.
While net profits influence valuations, operating cash flow and cash reserves directly support future production growth. Companies with strong balance sheets are better positioned to expand existing mines, build new operations, or acquire producing assets. These investments could accelerate production growth among mid-tier miners in the coming years.
The main risk to this bullish outlook is gold itself. Gold-mining stocks typically amplify movements in the metal by three to four times. When gold becomes extremely overbought, corrections can be sharp. Earlier this year, gold reached one of its most extreme overbought conditions since the early 1980s before experiencing a brief correction.
Although prices have since stabilized at elevated levels, historical precedent suggests that a significant pullback could still occur. If gold were to decline sharply, mining stocks would likely fall even more dramatically despite their strong fundamentals. Such declines, however, could present attractive buying opportunities.
In summary, mid-tier and junior gold miners have just reported the strongest quarter in the history of the industry. Record gold prices fueled unprecedented revenues, profits, cash flows, and balance-sheet strength. This marks the tenth consecutive quarter of extraordinary earnings growth for the sector.
With gold prices still trending toward another record quarter, the next round of results may be even stronger. These improving fundamentals could attract additional investment capital into mid-tier miners, driving further stock gains—unless a sharp gold correction occurs first, in which case mining stocks would likely magnify the downside.
The sharp rise in oil prices following escalating tensions between the United States and Iran has reignited talk of stagflation. That concern is largely misplaced. What markets may actually be reacting to is not a repeat of the 1970s, but the early stages of a broader shift in capital allocation — away from financial assets and toward tangible ones.
The Stagflation Comparison Falls Apart
Whenever oil prices surge, fears of stagflation quickly emerge. The pattern appeared in 2022 and is resurfacing again. The instinct makes sense: higher energy costs can push inflation upward while weighing on economic growth. However, drawing a direct parallel with the stagflation period of the 1970s and early 1980s oversimplifies the situation.
Classic stagflation requires a persistent combination of three conditions: entrenched inflation far above target levels, stagnating or shrinking economic activity, and limited policy tools capable of correcting the imbalance without worsening the problem. In the United States during 1973 and again in 1979, all of these factors were present. Today’s environment looks very different.
Inflation is the first major distinction. During the 1970s, U.S. consumer prices averaged above 7% for much of the decade and surged beyond 13% at the end of the period. Inflation was embedded in wages, expectations, and policy frameworks. By contrast, today’s inflation has already declined significantly from its 2022 highs. While still above the ultra-low levels seen after 2008, it remains far more controlled. Importantly, central banks now possess the credibility that was missing during the Federal Reserve leadership of Arthur Burns. Inflation expectations remain relatively stable — a crucial difference.
Economic growth tells a similar story. Real GDP continues to expand at a respectable pace, and while the labor market is gradually cooling, it is far from collapsing. Corporate profits have generally remained resilient, apart from sectors particularly sensitive to higher interest rates. Consumer spending — supported by continued employment — has not stalled. In this context, an oil price spike represents a headwind rather than an automatic trigger for recession.
Supply conditions also differ dramatically from those of the 1970s. The earlier oil crises were driven by coordinated OPEC embargoes that deliberately restricted supply to Western economies. At the time, alternatives were limited and domestic production could not compensate. Today, the United States is the world’s largest oil producer thanks to the shale revolution. A disruption involving Iran can lift prices, but it does not recreate the systemic vulnerability that defined the 1973 crisis.
The reality is straightforward: energy prices may push inflation slightly higher and shave some growth at the margins. But an isolated oil shock does not produce stagflation unless the broader economic structure is already broken — and that is not the case today.
What the Oil Spike Actually Signals
Rather than focusing on stagflation, investors should consider what oil’s move may be revealing about broader market dynamics.
Historical patterns following geopolitical shocks offer a useful guide. In the first three months after such events, oil tends to be the strongest performer among major assets, rising roughly 18% on average. Gold typically advances about 6%, while equities post modest gains of around 4%, often reflecting relief that the situation did not escalate further.
Six months later, however, the picture often changes. Gold generally continues to climb, with average gains near 19%. Equity markets lose momentum, and oil frequently gives back much of its initial spike as supply responses and fading fear premiums bring prices back down.
The tactical takeaway is clear: oil tends to perform best during the initial shock phase, while gold benefits from the longer period of uncertainty that follows. The geopolitical risk premium embedded in oil prices is often temporary, but in gold it can evolve into a more lasting repricing tied to concerns about currencies, fiscal sustainability, and the reliability of financial assets.
The Bigger Shift: Real Assets Regaining Importance
Looking at the broader market landscape, the oil rally may represent just one element of a larger transition.
During 2024 and 2025, equity markets were dominated by a single theme: artificial intelligence. Capital poured into a small group of large technology companies investing heavily in AI infrastructure. The narrative was simple — if AI would reshape the economy, investors should own the companies leading that transformation.
By 2026, leadership appears to be shifting. The strongest performers are increasingly the firms supplying the physical foundations of the AI economy: semiconductor manufacturers, materials producers, energy providers, and industrial supply chains. Meanwhile, some of the technology platforms themselves face rising costs and pressure on their traditional software revenue models.
This development suggests something deeper than a normal sector rotation.
For decades, capital markets favored companies that consumed resources while undervaluing those that produced them. Asset-light businesses commanded premium valuations, while industries tied to the physical economy — mining, energy, utilities, and heavy industry — were often neglected and underfunded.
Yet the real economy never disappeared. In fact, its importance is now becoming more apparent.
The expansion of artificial intelligence requires enormous amounts of electricity to power data centers. Electrification of transportation and manufacturing depends on vast quantities of copper and other metals. Efforts to rebuild domestic manufacturing and strengthen supply chains demand steel, critical minerals, and engineering capacity that has been underdeveloped for years. Energy security has also become a top political priority, encouraging renewed investment in domestic production infrastructure.
All of these forces point toward the same conclusion: the materials and energy systems that underpin the global economy are increasingly scarce relative to rising demand.
When markets begin to recognize a prolonged supply gap in strategically important commodities, the resulting repricing can be powerful and long-lasting. Recent strength in assets such as copper, gold, uranium, and energy infrastructure may be early evidence of that process.
Investment Implications
Viewing the current environment through the lens of stagflation frames it as a temporary economic problem. That interpretation misses the larger opportunity.
The macroeconomic risks are likely overstated: inflation is not deeply entrenched, the economy continues to expand, and the conditions that produced 1970s-style stagflation are absent. Investors who position primarily for economic collapse may find themselves overly defensive.
At the same time, the stagflation narrative understates the structural shift taking place. If markets are beginning to rotate from financial assets toward real ones — from digital platforms to the physical infrastructure supporting them — then the investment strategy should focus less on protection and more on positioning.
In simple terms, the beneficiaries are likely to be the builders rather than the spenders: companies involved in energy production, materials, infrastructure, and industrial supply chains, along with scarce hard assets.
History shows that when these types of market rotations begin, they often last longer and move further than most investors expect. Commodity sectors have experienced more than a decade of underinvestment, while the forces driving demand — artificial intelligence power needs, electrification, and reindustrialization — are structural trends rather than short-term cycles.
This moment may not replicate the 1970s. But it could mark the beginning of a similarly significant shift: a period in which the physical economy returns to the center of global capital markets, rewarding investors who recognize the change early.
Middle East tensions likely to delay Fed rate cuts
The conflict in the Middle East is expected to increase price pressures, while at the same time posing risks to U.S. economic growth and employment prospects. As a result, the situation is more likely to delay potential Federal Reserve rate cuts rather than eliminate them entirely. This differs from the situation in 2022, when a combination of demand and supply shocks sharply accelerated inflation and forced the central bank to raise interest rates.
Rising inflation limits the Fed’s flexibility
Recent developments in the Middle East have significantly altered expectations for monetary policy at the Federal Reserve. Financial markets had previously anticipated two 25-basis-point rate cuts this year, but pricing has now shifted to reflect barely one cut.
Investors are also overwhelmingly expecting the Federal Open Market Committee to leave interest rates unchanged at its meeting on March 18, a view we also support.
Military activity in Iran and heightened risks to shipping through the Strait of Hormuz have driven a sharp rise in energy prices. Although the United States imports relatively little crude oil from the Persian Gulf and remains self-sufficient in natural gas, global oil pricing means domestic consumers still feel the impact.
Retail gasoline prices in the U.S. have already climbed above $3.60 per gallon, with the national average potentially approaching $4.25 per gallon in the near term. Higher fuel costs are expected to raise transportation and distribution expenses, while airline ticket prices could also increase.
If the disruption persists, price pressures may extend into other sectors such as fertilizers, food products, and plastics. As a result, inflation could rise toward 3.5% by the summer, remaining well above the Fed’s 2% target.
Growth and employment outlook uncertain
The implications for economic growth and employment remain less certain. February’s ISM business surveys suggested activity levels consistent with roughly 3% GDP growth. However, the labor market data paints a less optimistic picture.
The February employment report showed the economy lost 92,000 jobs, while the unemployment rate rose to 4.4%. This suggests the Fed may have been premature in removing its earlier assessment that “downside risks to employment rose in recent months” from the January FOMC statement.
Increasing geopolitical and economic uncertainty is unlikely to support stronger job creation and may dampen economic activity outside the U.S. energy sector.
Fed expected to signal a delay in rate cuts
Against this backdrop, attention will turn to the updated economic projections from the Federal Reserve. In its December outlook, the Fed had anticipated one interest-rate cut in 2026, followed by an additional 25-basis-point reduction in 2027.
However, the ongoing conflict and the uncertainty surrounding its duration and severity make the outlook highly unpredictable. As a result, policymakers are likely to have limited confidence in their forecasts.
At the press conference, Fed Chair Jerome Powell is expected to emphasize the difficulty of setting monetary policy amid such geopolitical and economic uncertainty.
Even so, the Fed may modestly downgrade its growth projections, raise its inflation forecasts, and ultimately push back the previously expected 2026 rate cut to 2027.
Risks still tilted toward lower interest rates
We have been projecting two interest-rate cuts in September and December, although—like financial markets—we acknowledge the possibility that these reductions could be pushed into next year. While the Federal Reserve operates under a dual mandate of maintaining price stability and promoting maximum employment, safeguarding its credibility on inflation remains crucial. Cutting rates becomes difficult to justify when inflation is already above target and appears to be moving further away from it.
In early 2022, the Fed initially argued that inflation would prove temporary because it was largely driven by supply disruptions, suggesting there was no immediate need to raise rates. However, strong job creation, rapid wage growth, pent-up consumer demand following pandemic lockdowns, and stimulus payments fueled a surge in spending. Inflation subsequently accelerated far more than expected.
As a result, the central bank was forced to respond aggressively, lifting interest rates by 525 basis points between March 2022 and July 2023 in an effort to regain control over rising prices.
Currently, the U.S. labour market appears significantly weaker, with both job creation and real household disposable income showing little growth over the past six months. At the same time, consumer confidence has been weighed down by concerns over tariffs and job security, reducing the likelihood of a strong demand surge that could push inflation higher. This environment suggests that inflationary pressures may indeed prove temporary this time.
Instead, the current energy shock may ultimately dampen demand, which would help ease core inflation over time. A correction in equity markets could amplify this demand destruction further. For this reason, we continue to expect a downward bias in Federal Reserve policy rates over the next 12–18 months.
Although tax refunds this year are expected to be relatively large—averaging around $4,000 compared with $3,200 last year—a much stronger fiscal stimulus would likely be required to generate enough demand to entrench inflation. Measures such as widespread stimulus checks would probably be necessary to produce sustained price pressures that might force the Fed to raise interest rates again.
However, such a scenario could unsettle bond markets due to concerns about rising government debt and renewed inflation risks. This, in turn, could trigger fears of 1970s-style inflation dynamics, a period marked by persistent inflation and financial market volatility. For now, we view that outcome as relatively unlikely.
Should the Fed Address the Persistent Stickiness in the Effective Funds Rate?
Since the Federal Reserve resumed purchasing Treasury bills in mid-December 2025, it has accumulated about US$165 billion in T-bill holdings. Overall, the Fed’s total securities portfolio—including bills—has increased by US$130 billion, bringing the balance sheet to roughly US$6.26 trillion. At the same time, bank reserves have risen by around US$180 billion to slightly above US$3 trillion, partly supported by a moderate drawdown in the Treasury’s cash balance.
Despite this US$130 billion expansion of the balance sheet, the Fed may find it frustrating that the effective federal funds rate has not declined, even marginally. Historically, the effective rate traded roughly 8 basis points above the policy floor, but it climbed to about 14 basis points in September and October 2025—one of the factors that prompted the renewed T-bill purchase program.
The underlying issue emerged when bank reserves slipped below US$3 trillion, causing conditions in the repo market to tighten noticeably. That tightening, from a relative-value perspective, helped push the effective funds rate higher. While the broader policy narrative has been dominated by rate cuts, the real concern is the effective funds rate drifting upward within the 25-basis-point target range.
For now, the effective funds rate remains stuck at 3.64%, just 1 basis point below the interest rate on reserve balances (3.65%). Moving up to 3.65% would be difficult because eligible counterparties can choose between holding reserves or lending in the federal funds market, though the rate should not exceed that level. Whether the Fed will address this issue publicly remains uncertain, although it arguably warrants attention from reporters, given that efficient market functioning is particularly important in the current environment.
Looking more broadly at interest rates—especially the outlook for bonds—the Fed is facing signals of higher nominal yields, rising real yields, and widening inflation breakevens. This mix does little to support further rate cuts. In fact, each element points toward the logic of maintaining current policy settings. For the time being, the market is likely to see more of the same, with 10-year Treasury yields potentially moving into the 4.3%–4.5% range before real yields eventually begin to decline again.
Fed Caution Should Continue to Support the Dollar
Like the rest of the world, the United States has seen a hawkish re-pricing of short-term interest rate expectations as the Middle East energy shock reduces the likelihood of near-term monetary easing. Although the shift in US rates has been smaller than in many other regions, it has done little to weaken the dollar. At the moment, the macro impact of rising energy prices is the dominant force shaping currency markets, while traditional drivers such as rate differentials have temporarily taken a back seat.
This suggests that even a mildly hawkish Federal Open Market Committee meeting on Wednesday—where the Fed could push the projected 25-basis-point rate cut from 2026 to 2027—may not provoke a dramatic reaction in the dollar. Still, if policymakers emphasize the inflation risks posed by higher energy prices while the US labor market remains resilient, it would likely provide modest support for the currency. In fact, the market’s reassessment of the Fed’s policy path has amplified the energy shock confronting Europe, Asia, and many emerging economies, undermining earlier expectations of a gradual dollar decline this year.
As long as energy prices remain elevated—or climb further—it will be difficult for the dollar to surrender the gains it has made this month. One potential source of increased dollar supply could come from official intervention, particularly if Japan steps in to curb USD/JPY should the pair rise beyond 160. A coordinated intervention by the United States and Japan to sell dollars would be unexpected and could trigger a broader correction in the currency. However, unless energy prices retreat meaningfully, any intervention would likely serve only to limit volatility rather than reverse the dollar’s broader strength.
Bitcoin climbed on Friday, marking its fifth consecutive day of gains as expectations for more supportive cryptocurrency regulation in the United States helped counter lingering worries surrounding the Iran conflict.
The world’s largest cryptocurrency rose 1.4% to $71,113.1 by 18:00 ET (22:00 GMT).
Bitcoin on track for weekly gains amid regulatory optimism
Bitcoin was heading for a weekly advance of nearly 6%, outperforming broader risk-sensitive assets despite the uncertainty stemming from the ongoing Iran war.
The rally in the leading digital asset was largely fueled by an announcement on Wednesday that the U.S. Securities and Exchange Commission and the Commodity Futures Trading Commission will cooperate to develop a clearer and more comprehensive regulatory framework for U.S. crypto markets.
Through the agreement, the two agencies signaled plans to jointly craft a federal policy that would introduce a “fit-for-purpose regulatory framework for crypto assets and other emerging technologies.”
The initiative, known as the Joint Harmonization Initiative, seeks to establish structured data-sharing practices, simplify reporting requirements, and reduce overlapping enforcement actions between the two regulators.
Although the arrangement is non-binding, the announcement boosted investor confidence that U.S. authorities may move toward clearer and more coordinated regulation for the cryptocurrency sector.
The initiative also aligns with promises by Donald Trump to provide greater regulatory clarity for the crypto industry, with the administration appointing leaders at both agencies viewed as supportive of digital assets.
Bitcoin has climbed about 6.1% since the United States and Israel launched attacks on Iran in late February. Meanwhile, the second-largest cryptocurrency, Ether, has gained roughly 6.2% during the same period.
According to David Morrison, senior market analyst at Trade Nation, both Bitcoin and Ether have demonstrated notable resilience despite growing negative sentiment toward risk assets.
He noted that the two cryptocurrencies have held up well even as global equities—particularly technology stocks—faced significant selling pressure. At the same time, Bitcoin has been rising alongside the U.S. dollar and crude oil, while traditional safe-haven metals such as gold and silver have struggled.
Morrison added that the rebound may partly reflect technical factors. After reaching an all-time high above $126,000 six months ago, Bitcoin lost more than half of its value, dropping to around $60,000 in early February. That sharp correction left the market technically positioned for renewed buying interest. Whether the recovery proves temporary or develops into a more sustained trend remains uncertain.
Despite the recent gains, broader investor appetite for risk remains subdued, as equity markets have experienced sharp declines amid concerns about the economic consequences of the U.S.–Israel conflict with Iran.
One major concern is the war’s potential inflationary impact. Prolonged disruptions to oil supply could push crude prices higher and contribute to global inflation. Such pressures may force major central banks to adopt a more hawkish policy stance, which could weigh on cryptocurrencies and other speculative assets.
Iliya Kalchev, analyst at Nexo Dispatch, said Bitcoin’s rebound from the mid-$60,000 range to above $72,000 suggests the market has stabilized after a brief period of deleveraging. Open interest has recovered to 687,200 BTC—its highest level since late February—while funding rates and trading volume indicators have turned positive. Meanwhile, implied volatility has dropped to a two-week low of 55%.
Inflation data meets expectations
U.S. inflation figures released earlier showed price pressures broadly in line with forecasts but still above the level preferred by the Federal Reserve.
The Personal Consumption Expenditures (PCE) price index, the Fed’s preferred inflation gauge, rose 0.4% month-on-month in January, matching expectations. On an annual basis, core PCE increased 3.1%, also in line with estimates and still well above the central bank’s 2% target.
The Fed closely monitors the core PCE index because it reflects a broader range of consumer spending than the Consumer Price Index and captures shifts in purchasing behavior.
Earlier data from the U.S. Department of Labor showed that February’s headline CPI rose 2.4% year-on-year, while core CPI increased 2.5%—the lowest reading since March 2021, though still above the Fed’s target.
The Federal Reserve is scheduled to announce its next interest-rate decision on Wednesday, with markets currently pricing in an almost certain probability that the Federal Open Market Committee will keep rates unchanged.
Altcoins mostly higher, $TRUMP token surges
The broader cryptocurrency market also moved higher on Friday in line with Bitcoin.
Ether gained 1.3% to $2,089.11, while XRP rose 1.2% to $1.3950. BNB, Cardano, and Solana increased 0.6%, 0.8%, and 2.2%, respectively.
Among memecoins, Dogecoin added 1.4%, while the $TRUMP token surged 30%. The rally followed news of an exclusive cryptocurrency and business conference at Mar-a-Lago, where President Donald Trump is expected to deliver a keynote speech, prompting traders to accumulate the token ahead of an April 25 gala luncheon.
Despite the recent rebound, most altcoins—like Bitcoin—remain significantly below their highs from recent months, with overall sentiment toward the crypto sector still fragile.
U.S. President Donald Trump warned that he could authorize strikes on Iran’s oil infrastructure on Kharg Island if Tehran continues attacks on vessels passing through the strategically crucial Strait of Hormuz. The threat added further uncertainty to global markets already facing one of the most significant supply disruptions in history.
Trump accompanied the warning with a social media message claiming that U.S. forces had “completely destroyed” military targets on Kharg Island. The island functions as the main export terminal for roughly 90% of Iran’s crude shipments and is located about 300 miles northwest of the Strait of Hormuz.
However, the president clarified that American strikes had not targeted Kharg’s oil infrastructure. He added that if Iran or any other party attempted to block the safe passage of ships through the Strait of Hormuz, Washington could reconsider that restraint.
Trump also stated that Iran lacked the capability to defend itself against U.S. military action. In a post on Truth Social, he urged Iran’s armed forces and their allies to surrender, warning that continuing the conflict could further devastate the country.
Iran’s military responded on Saturday by warning that any attack on its oil or energy facilities would be met with retaliation against installations belonging to oil companies cooperating with the United States in the region, according to Iranian media reports.
Iran’s semi-official Fars News Agency reported that more than 15 explosions were heard on Kharg Island during the U.S. strikes. Sources said the attacks hit air-defense systems, a naval installation, and airport infrastructure, while leaving oil facilities untouched.
Energy markets were closely monitoring whether the strikes had damaged Kharg Island’s complex network of pipelines, storage tanks, and export terminals. Even minor disruptions could further constrain global oil supply and intensify volatility in energy markets.
Elsewhere in the region, Iran’s Islamic Revolutionary Guard Corps announced that it had carried out additional strikes against Israel in coordination with Lebanon’s Hezbollah, according to Iran’s Tasnim News Agency.
Meanwhile, the Israel Defense Forces said on Friday that its air force had attacked more than 200 targets across western and central Iran within the past 24 hours, including missile launchers, air-defense systems, and weapons manufacturing facilities.
The United States has also suffered losses. The U.S. military confirmed that all six crew members aboard a refueling aircraft that crashed in western Iraq had died.
According to The Wall Street Journal, citing U.S. officials, five U.S. Air Force tanker aircraft stationed at a base in Saudi Arabia were damaged in an Iranian missile strike and were undergoing repairs.
Gulf and Lebanon emerge as key flashpoints
Oil markets have experienced sharp price swings in response to Trump’s shifting comments about the potential duration of the conflict, which began on February 28 when large-scale U.S. and Israeli airstrikes targeted Iran. The fighting quickly expanded into a wider regional confrontation with major implications for global energy and financial markets.
Lebanon has become another focal point of the conflict, with Israeli forces and Hezbollah exchanging strikes in and around Beirut.
In addition to missile and drone attacks against Israel and U.S.-aligned Gulf states, Iran’s Islamic Revolutionary Guard Corps has attempted to disrupt shipping through the Strait of Hormuz, a vital route that carries about 20% of the world’s fossil fuel supplies.
Trump said on Friday that the United States Navy would soon begin escorting oil tankers through the waterway.
Although he previously suggested the war might last only a few weeks, Trump declined to predict a timeline for its end, saying the conflict would continue for as long as necessary.
Despite the fighting, Iran has continued exporting crude oil while several Gulf producers have halted shipments due to concerns about potential Iranian attacks.
Satellite imagery reviewed by TankerTrackers.com showed multiple very large crude carriers loading oil at Kharg Island earlier in the week. Iran exported between 1.1 million and 1.5 million barrels per day from the start of the war through midweek.
Bob McNally, president of Rapidan Energy Group, said Trump’s remarks could push markets to focus on the possibility that the current energy disruption — already the largest on record — might worsen and persist longer than expected.
Some industry analysts doubt Kharg Island’s oil infrastructure will remain untouched. Josh Young, chief investment officer at Bison Interests, remarked that bombing the island without hitting its oil facilities would be pointless.
War spreads across the Middle East
Iran’s new supreme leader, Mojtaba Khamenei, said in his first public remarks that the Strait of Hormuz would remain closed and warned neighboring countries to shut down U.S. military bases on their soil or risk becoming targets themselves.
European governments are now discussing measures to protect their interests. France has been consulting with European, Asian, and Gulf Arab partners on plans to deploy warships to escort commercial tankers through the Strait of Hormuz, according to French officials.
After nearly two weeks of fighting, about 2,000 people have been killed — the majority in Iran, with significant casualties also reported in Lebanon and increasing losses in Gulf states that have rarely been on the front lines of regional conflicts.
Millions of civilians have been displaced. In Lebanon, as Israeli airstrikes continued to hit the outskirts of Beirut, the country’s interior minister said authorities were struggling to accommodate the hundreds of thousands of people seeking refuge in the capital.
The U.S. dollar strengthened on Friday and remained on course for a solid two-week winning streak, supported by its status as a preferred safe-haven asset amid the ongoing conflict involving Iran.
By 15:46 ET (19:46 GMT), the U.S. Dollar Index, which measures the greenback against a basket of six major currencies, rose 0.7% to 100.36 and was set for a weekly gain of around 1.4%. Meanwhile, EUR/USD fell 0.8% to 1.1423 and GBP/USD dropped 0.9% to 1.3228. USD/JPY edged 0.2% higher to 159.65.
Analysts at ING noted that the dollar has climbed to fresh monthly highs as markets struggle to see a clear resolution to the escalating Middle East crisis.
The joint U.S.–Israeli military campaign against Iran has now lasted more than a week and shows little sign of easing. President Donald Trump stated that Washington is “totally destroying” Iran’s military and economic capacity.
However, Tehran has signaled it will continue resisting. Iran’s new Supreme Leader, Mojtaba Khamenei, emphasized that the strategic Strait of Hormuz — a crucial shipping lane responsible for roughly one-fifth of global oil supply — will remain closed.
The possibility of a prolonged shutdown of the strait has triggered significant volatility in global oil markets. Brent crude prices surged to nearly $120 per barrel earlier in the week before briefly dropping below $90. On Friday, Brent futures were trading above $100 per barrel.
Because much of the oil and gas transported through the Strait of Hormuz is used to produce key goods such as fertilizers and plastics, rising energy prices could intensify inflationary pressures worldwide.
These inflation risks could lead central banks, including the Federal Reserve, to reconsider plans for near-term interest rate cuts. Higher interest rates typically attract foreign capital, which could further strengthen the U.S. dollar.
PCE inflation data in focus
Investors are also closely watching U.S. inflation data due on Friday, when the personal consumption expenditures (PCE) price index for January will be released.
The core PCE index — which excludes volatile categories like food and energy — is expected to rise 3.1% year-on-year, slightly above the 3.0% reading in December. This indicator is closely followed by financial markets because it is one of the Federal Reserve’s preferred gauges when setting monetary policy.
According to ING analysts, the core PCE index has been drifting further away from the Fed’s 2% target since reaching a low of 2.6% last summer.
They suggested that this trend may limit the Fed’s ability to lower interest rates this year and that policymakers will likely address the issue during next Wednesday’s Federal Open Market Committee (FOMC) meeting.
Interestingly, recent PCE data has shown stronger inflation than the Consumer Price Index (CPI) reported by the Labor Department. This difference largely reflects variations in weighting methods, particularly for housing and healthcare costs, as well as differences in coverage and consumer substitution patterns. Lower weighting for cooling shelter costs and higher exposure to rising medical expenses have kept PCE inflation relatively elevated compared with CPI.
In contrast, February’s CPI data released on Wednesday showed relatively moderate inflation of 2.4% year-on-year.
However, these figures mostly reflect a period before the Iran conflict escalated in late February with a wave of U.S. and Israeli airstrikes. Since then, the inflation outlook has become more uncertain.
Major central bank decisions ahead
Next week will be a crucial period for global monetary policy watchers, as several major central banks — including the Federal Reserve, the European Central Bank (ECB), and the Bank of England — are set to announce interest rate decisions.
Investors will pay close attention to how policymakers address the economic implications of the Iran conflict.
According to JPMorgan economist Michael Feroli, markets widely expect the Fed to leave its benchmark interest rate unchanged at a target range of 3.5%–3.75%.
However, the Middle East conflict may complicate the outlook. Feroli said the Fed’s post-meeting statement is likely to mention the crisis as an additional source of uncertainty affecting both employment and inflation objectives.
The ECB is also expected to keep rates unchanged, although policymakers are likely to comment on the severe oil and gas shock Europe is experiencing due to the conflict.
JPMorgan economists Bruce Kasman and Nora Szentivanyi noted that central banks often face difficult policy choices during periods of volatile energy prices. Energy costs frequently fluctuate by around 25% annually, pushing up energy inflation while making it difficult to determine whether changes stem from supply disruptions or shifts in demand.
While oil prices are expected to remain elevated, a prolonged closure of the Strait of Hormuz could drive prices well beyond current market expectations. A sustained rise to $125 per barrel or higher would likely increase inflation while simultaneously weakening economic growth.
They warned that such a scenario could trigger different policy responses from major central banks. The Federal Reserve typically prioritizes mitigating recession risks and could adopt a more dovish stance if oil shocks intensify. In contrast, the ECB has historically been more sensitive to rising inflation and could tighten monetary policy if oil prices climb significantly.
EUR/USD was trading near 1.1546 on March 12, extending a sharp three-day decline that has wiped out weeks of recovery efforts within just a few sessions. The pair reached a high of 1.2082 on January 27—its strongest level since June 2021—but has since formed a clear sequence of lower highs and lower lows, a classic signal of a sustained downtrend. From the January peak to current levels, the pair has fallen by roughly 536 pips, suggesting more than a simple correction. Instead, the shift points to a broader change in market dynamics: the dollar has regained control while the euro has moved firmly onto the defensive.
The decline has been structured enough to resemble a steady trend, yet sharp reversals around key turning points have repeatedly caught bullish traders off guard. After the initial breakdown in late January, EUR/USD briefly stabilized around the 1.1700 region before rolling over again. The pair later touched a low near 1.1507, followed by a modest rebound that quickly lost momentum. That bounce failed to convincingly retake 1.1600, leaving the market once again testing the psychologically important 1.1500 level, a threshold closely monitored by technical analysts in recent weeks.
A major catalyst behind this move has been the conflict involving Iran that erupted on February 28, which has widened the economic divergence between the United States and the Eurozone. The surge in energy prices has played a particularly significant role. Brent crude has climbed to around $97 per barrel, while West Texas Intermediate is trading near $93.
In response to the supply shock, the International Energy Agency authorized the release of more than 400 million barrels from strategic reserves, with the United States contributing over 172 million barrels. Even with these emergency measures, oil prices continued to rise, underscoring the severity of the supply disruption currently being priced into global energy markets.
Iraq announced it would suspend port operations at key oil export terminals after two tankers were attacked in the Persian Gulf. As a result, the risk of disruption to the Strait of Hormuz is no longer theoretical—it is actively being priced into global energy markets.
For Europe, the implications are particularly severe. Unlike the United States, the continent lacks sufficient domestic energy production to offset supply shocks. Its energy system has already been strained by the sharp reduction in Russian gas flows following the Russia–Ukraine War. Now, policymakers are confronting another potential surge in energy costs, with analysts warning that European inflation could climb above 3% in the coming months. Meanwhile, Iran has openly stated its goal of pushing oil prices toward $200 per barrel, leaving European economic planners with few credible short-term countermeasures.
The situation looks very different for the United States. As the world’s largest oil producer, higher crude prices translate into stronger revenues for domestic energy companies. While rising oil prices complicate the Federal Reserve’s path toward monetary easing, they do not represent the kind of systemic import shock faced by Europe. In addition, the global oil trade is largely settled in U.S. dollars, meaning elevated energy prices tend to reinforce structural demand for the currency. The same oil shock that weighs on the euro therefore provides underlying support for the dollar. This imbalance lies at the heart of the current bearish outlook for EUR/USD and is unlikely to shift unless geopolitical tensions ease or Europe secures alternative energy supplies at scale—neither of which appears imminent.
Recent inflation data has done little to alter this outlook. February headline Consumer Price Index (CPI) rose 0.3% month-over-month and 2.4% year-over-year, while core CPI increased 0.2% on the month and 2.5% annually. The readings were not alarming, but they also failed to give markets a clear signal that the Federal Reserve is ready to pivot toward easier policy.
The 2.5% core inflation rate, although near recent lows, remains above the Fed’s 2.0% target. More importantly, the forward-looking risks are intensifying. With crude oil trading near $97 per barrel and the conflict involving Iran showing little sign of resolution, higher energy costs are likely to filter through to consumer prices over the next two to three CPI releases, reinforcing concerns that inflation pressures could reaccelerate.
The market’s expectations have shifted dramatically. Earlier in 2026, investors widely anticipated multiple Federal Reserve rate cuts during the first half of the year. That outlook has since been completely overturned. Futures markets now price in only a single 25-basis-point cut in September, meaning the first potential easing step would arrive nine months into the year—far later and far smaller than previously expected.
This sharp repricing has provided strong support for the U.S. dollar. Elevated yields on U.S. Treasury securities relative to their European counterparts have widened the interest-rate differential that typically drives capital flows. As returns on dollar-denominated assets increase compared with euro assets, funds tend to move from EUR into USD holdings. When that spread widens, EUR/USD usually declines—and it has been expanding steadily since January.
The U.S. Dollar Index (DXY) is currently trading near 99.39, just below a key resistance level around 99.68, after touching a 15-week high of 99.70 earlier in the week. The index has now posted three consecutive sessions of gains, supported by rising oil prices and renewed safe-haven demand for the dollar.
Technically, the outlook for the dollar remains constructive. DXY is trading comfortably above both its 50-day and 200-day exponential moving averages, a configuration that typically signals underlying strength. Momentum indicators are also supportive: the Relative Strength Index (RSI) is climbing toward the 60–65 range, suggesting there is still room for further upside before conditions become overbought.
From a technical perspective, the 0.236 Fibonacci retracement near 99.18 is acting as immediate support. Below that, the channel midpoint and the 0.382 Fibonacci level around 98.87 represent a deeper support zone. A confirmed break above 99.68 would likely open the door to a move toward 100.00 and potentially 100.32.
If such a rally unfolds, it would likely intensify pressure on EUR/USD. Historically, each incremental advance in the dollar index toward the 100 level tends to translate into further compression in the euro pair, potentially pushing it toward 1.1450 and even 1.1391.
In the near term, only two developments appear capable of interrupting the dollar’s upward momentum: a shift toward a more dovish tone from the Federal Reserve during its March 18 policy communication, or a sudden de-escalation in Middle East tensions that triggers a sharp decline in crude oil prices. Until one of those catalysts emerges, the macro and technical backdrop continues to favor dollar strength.
EUR/USD broke below its 200-day Simple Moving Average (SMA) at 1.1672 on March 3, marking a key structural shift in the pair’s trend. Before that breakdown, the 200-day average had acted as a heavily contested level between buyers and sellers. Once the pair decisively moved below it, the level flipped into resistance—a classic technical reversal. Since then, every attempt to reclaim the 1.1672 area has failed. The pair’s earlier peak at 1.2082 on January 27 was followed by a steady decline that has carried EUR/USD down to its current levels.
The 100-day SMA, located near 1.1696, is now flattening, a development that often precedes a bearish crossover with the 200-day average. Meanwhile, on shorter time frames, the 50-day EMA has already crossed below the 200-day EMA on the 2-hour chart, forming a Death Cross—a signal that reinforces the prevailing bearish bias among short-term traders. Price action remains below the 50-day EMA, which is now functioning as dynamic resistance during intraday rebounds.
Momentum indicators also lean bearish. The 14-day Relative Strength Index (RSI) has fallen toward 33, approaching but not yet reaching the oversold threshold near 30. This suggests the pair still has room to move lower before a technical rebound becomes more likely.
The Moving Average Convergence Divergence (MACD) indicator remains below both its signal line and the zero level, confirming ongoing downward momentum. Although the histogram bars have begun to contract slightly—hinting at a potential slowdown in momentum—the broader directional bias remains negative.
Finally, the Average Directional Index (ADX) sits near 29, indicating that the current downtrend is strengthening rather than fading. Since ADX measures the strength of a trend rather than its direction, this reading suggests that bearish momentum in EUR/USD is continuing to build.
The 1.1500 level has become the immediate battleground for EUR/USD. This area aligns with Monday’s intraday low and represents one of the strongest psychological support levels on the chart. During Monday’s session, the pair briefly dipped to 1.1507 before staging a modest rebound. However, that bounce quickly faded and now appears to have been little more than a temporary dead-cat bounce, leaving the pair once again approaching the 1.1500 threshold, this time from a technically weaker position.
A decisive daily close below 1.1500—not merely an intraday dip—would significantly shift the technical outlook. The next clear support lies at the November 5, 2025 low of 1.1468, followed closely by 1.1450. If selling momentum continues through those levels, attention would likely turn to the August 1, 2025 low at 1.1391, which becomes the next major downside target. From current levels, that would represent roughly a 155-pip decline, adding to a move that has already erased more than 500 pips since the January peak.
On the upside, 1.1600 serves as the first hurdle bulls must reclaim before any meaningful recovery attempt can develop. Even then, the pair would still need to challenge the 200-day Simple Moving Average near 1.1672. Beyond that, 1.1700 stands as the critical structural level: a daily close above it would effectively undermine the current bearish framework and potentially open the door toward the 1.1800–1.1825 resistance zone.
However, achieving such a recovery would likely require a significant shift in the macro backdrop—something that currently appears absent. In the meantime, the broader Fibonacci retracement band between 1.1644 and 1.1714 continues to act as a strong ceiling for any rallies, making upward progress difficult while leaving the downside path comparatively clearer.
GBP/USD trading near 1.3378 and extending losses for a third straight session is not simply a U.K.-specific issue. Instead, it reinforces the idea that the dollar strength pushing EUR/USD lower reflects a broader, systemic move rather than a euro-only story. Sterling was rejected from the 1.3480–1.3500 resistance zone and has since reversed sharply, with price now sitting below both the 200-day EMA and the 50-day EMA, which have shifted from support to overhead resistance.
Technically, the pair did form a modest higher low near 1.3280, but momentum indicators are weakening. The Relative Strength Index (RSI) is rolling over around the mid-50 region, a pattern that often signals fading bullish momentum and can precede another leg lower. If GBP/USD breaks decisively below 1.3300, the next downside targets appear near 1.3215 and then 1.3150.
For sterling to stage a more meaningful recovery, bulls would first need to reclaim 1.3480 and break above the descending trendline that has capped price action since late January. That trendline has remained intact since it formed, reinforcing the broader bearish structure. Until it is convincingly broken, rallies are likely to face selling pressure, while dips continue to look for the next support level below.
The parallel weakness in GBP/USD alongside EUR/USD suggests that the current market dynamic is not limited to euro fundamentals. Instead, it reflects a broader U.S. dollar appreciation cycle, driven by rising energy prices, inflation concerns, and the repricing of expectations around Federal Reserve policy. Those forces are exerting pressure across major currency pairs simultaneously.
Analysts at Deutsche Bank have noted that the European Central Bank is likely to maintain a cautious policy stance while inflation risks remain unresolved. Although this approach resembles the position of the Federal Reserve, the euro area faces a more fragile economic backdrop. Europe is more directly exposed to energy price shocks than the United States, relies more heavily on export demand that is weakening amid global trade uncertainty, and has less flexibility to sustain high interest rates given the debt burdens of several peripheral Eurozone sovereign economies.
The Federal Reserve, with policy rates in the 3.50%–3.75% range, is operating from a position that remains relatively strong despite restrictive conditions. U.S. economic fundamentals continue to show resilience: GDP growth has remained positive, the labor market has held firm, and the domestic energy sector actually benefits from elevated oil prices.
The situation is very different for the European Central Bank. The ECB must manage monetary policy for a 20-nation bloc, where consensus decision-making can slow policy responses. At the same time, Germany—the largest economy in the euro area—is dealing with an ongoing industrial slowdown. This leaves the ECB with less room to project a convincingly hawkish stance. As the yield spread between U.S. and European government bonds widens, capital continues to flow toward dollar-denominated assets. For EUR/USD to stage a meaningful recovery, either the ECB would need to raise rates or the Fed would need to cut—scenarios that appear unlikely over the next couple of months.
The geopolitical backdrop has further complicated matters. When Iraq announced the closure of its oil export ports after tanker attacks in the Persian Gulf, it removed an important marginal supply source from an already tight energy market. In response, the International Energy Agency authorized the release of 400 million barrels from strategic reserves, including 172 million barrels from the United States. Yet oil prices continued climbing, signaling that traders believe the supply disruption linked to the Strait of Hormuz is more significant than emergency reserves can offset in the near term.
Iran has openly discussed pushing crude prices toward $200 per barrel, a target that highlights the asymmetric risk facing global markets. Even if prices fall short of that level, the implications remain serious. At around $120 oil, European inflation could move above 3%, forcing the ECB to confront stagflation risks that would limit its ability to ease policy. If crude were to approach $150, energy-intensive industries in Europe could face severe demand destruction, threatening eurozone growth. In a scenario where oil reached $200, the strain on the European economy could be profound, potentially pushing EUR/USD toward levels not seen since the early 2000s. Importantly, the bearish outlook for the euro does not require such extreme outcomes—simply keeping oil above $90, which is already the case, maintains pressure on the currency.
From a trading perspective, EUR/USD near 1.1546 remains vulnerable within a well-defined descending channel that began after the January 27 peak at 1.2082. The technical structure is reinforced by a sequence of lower highs and lower lows. Several key indicators now act as resistance: the 200-day SMA around 1.1672, the 50-day EMA, and the 100-day SMA near 1.1696. Meanwhile, the Average Directional Index (ADX) near 29 suggests the downtrend is strengthening rather than fading, while the RSI near 33 indicates there is still room for further downside before oversold conditions prompt a technical rebound.
In this context, rallies toward the 1.1600–1.1640 resistance zone are likely to face selling pressure. The immediate technical pivot remains 1.1500. A decisive daily close below that level would expose further downside targets around 1.1446, followed by the November 2025 low near 1.1391.
A bullish scenario would likely require a strong rejection from below 1.1500, ideally accompanied by a sharp reversal candle and increased trading volume, which could support a short-term rebound toward 1.1600. Outside of that narrow tactical setup, however, the broader picture remains bearish. With crude oil trading near $97, the U.S. Dollar Index hovering around 99.39, the Fed maintaining a steady policy stance, and the ECB constrained by weaker regional fundamentals, the macro environment currently offers little reason to expect a sustained EUR/USD recovery.
The U.S. housing market is currently facing a pronounced imbalance between supply and demand. Housing starts have climbed to their highest level in a year, even as existing home inventory remains limited and home prices continue to face upward pressure.
At the same time, new inflationary risks are emerging. A 15% global tariff and rising energy costs tied to the conflict in Iran threaten to weaken consumer purchasing power and potentially disrupt expectations for a housing market recovery in 2026.
Ongoing inflation has also forced the Federal Reserve to maintain a defensive “higher for longer” interest-rate stance. Market expectations now suggest the first potential rate cut may not arrive until October 2026.
This week, the U.S. housing sector has been in focus as a wave of economic data coincides with an important earnings release from homebuilder Lennar. Investors are closely monitoring the interaction between limited housing supply, evolving inflation pressures, and geopolitical developments that could reshape the economic outlook for 2026.
The Inventory Challenge: Existing Home Sales and Construction Activity
The week began with a reminder of the housing market’s supply-demand imbalance. On Tuesday, the National Association of Realtors reported that existing home sales for February rose 1.7% from January to a seasonally adjusted annual rate of 4.09 million units. Although the monthly increase suggests some stabilization, sales remain down 1.4% compared with the same period last year.
NAR Chief Economist Lawrence Yun noted that while housing inventory is gradually increasing, supply growth remains slow. As the spring buying season approaches, a key concern is that if demand strengthens faster than inventory expands, home prices could climb further, worsening affordability challenges for first-time buyers.
However, more encouraging news emerged today from the United States Census Bureau. The latest housing starts report showed that residential construction activity rose for the third straight month, reaching its fastest pace since February 2025. Housing starts increased 7.2% in January to an annualized rate of 1.49 million units.
The rise was largely driven by a sharp 29.1% increase in multifamily construction, while single-family building activity continued to lag. This development offers some support for homebuilders—particularly Lennar Corporation, which is scheduled to report earnings later today.
Despite the improvement in construction activity, sentiment across homebuilding stocks has remained cautious, as investors continue to worry about housing affordability and elevated construction costs.
Spotlight on Homebuilders: Lennar Earnings in Focus
With many homeowners locked into ultra-low mortgage rates from previous years, the responsibility for adding new housing supply has increasingly shifted to publicly traded homebuilders. Lennar is scheduled to report its Q1 2026 earnings later today, offering investors an important gauge of the industry’s current health.
Market participants will be paying close attention to several key issues:
Construction Outlook: Whether Lennar plans to accelerate new housing starts despite ongoing economic uncertainty.
Mortgage Rate Buy-Down Programs: The extent to which the company continues subsidizing buyer mortgage rates—an approach that has helped sustain sales activity but is beginning to weigh on profitability. Analysts expect gross margins to ease toward the 15–16% range this quarter.
Upcoming Homebuilder Earnings to Watch
Lennar (LEN) – March 12, 2026
KB Home (KBH) – March 24, 2026
D.R. Horton (DHI) – April 21, 2026
PulteGroup (PHM) – April 23, 2026
Toll Brothers (TOL) – May 19, 2026
*Estimated based on historical reporting schedules.
The Inflation Shock: Tariffs and the Iran Conflict
The housing outlook is becoming more complex as the U.S. economy faces a sudden two-pronged inflation shock. Although February’s Consumer Price Index (CPI) showed a relatively moderate 2.4% year-over-year increase, that figure is now considered outdated because it was recorded before two major inflationary developments.
Global Tariffs: After a ruling by the Supreme Court of the United States, the administration introduced a 10% global tariff on February 24, which was quickly raised to 15% in early March. These tariffs are expected to increase the cost of imported construction materials. Perhaps more importantly, they could further strain household finances, making prospective buyers even more hesitant to enter the housing market.
Conflict in Iran: Shortly after the tariff announcement, military strikes by Israel and the United States targeted multiple locations across Iran, triggering sharp reactions in global energy markets. Oil prices surged in the aftermath, and the impact is already being felt by consumers. U.S. gasoline prices have climbed roughly 20% in under two weeks, pushing the national average to $3.58 per gallon.
Despite the International Energy Agency releasing 400 million barrels from strategic reserves, energy markets remain skeptical that this supply will be sufficient to offset potential disruptions from the Middle East if the conflict persists. Concerns intensified after reports that Iran intends to keep the Strait of Hormuz closed, a move that threatens a critical global oil transit route.
The Fed’s Dilemma: March FOMC Meeting
Later this week, the Bureau of Economic Analysis will publish the Personal Consumption Expenditures (PCE) Price Index, the Federal Reserve’s preferred gauge of inflation. Under normal circumstances, this would be the most significant economic release of the week.
However, due to the 2025 government shutdown, the agency is still working through a backlog of delayed reports. As a result, Friday’s release will reflect January data, meaning it predates both the newly implemented tariffs and the outbreak of the Iran conflict.
Attention is also turning to the upcoming meeting of the Federal Open Market Committee scheduled for March 17–18. Earlier in the year, markets anticipated that the Federal Reserve might begin easing policy relatively soon. Now, however, expectations have shifted. According to the CME FedWatch Tool, policymakers are widely expected to hold interest rates steady, with current market pricing suggesting the first—and possibly only—rate cut of 2026 could arrive in October.
Consumer Impact: Windfalls vs. Headwinds
As the U.S. tax season progresses, many households are receiving larger tax refunds. Consumers often treat these refunds as a temporary financial windfall, typically using them to pay down credit card balances accumulated during the holiday season or to make major purchases such as vehicles or household appliances.
However, this extra liquidity is unlikely to trigger a surge in housing demand. Instead, it may simply help households cope with rising living costs. Higher gasoline prices, in particular, function like a stealth tax by reducing discretionary income. Rather than saving for a home down payment, many consumers may find themselves allocating more of their budgets toward essential expenses.
Recent data from the Internal Revenue Service shows that the average tax refund has increased by 10.6% compared with last year, based on figures from the first four weeks of the filing season.
The Bottom Line
The U.S. housing market currently finds itself caught between an urgent need for additional supply and an increasingly challenging macroeconomic backdrop. While major homebuilders such as Lennar represent the sector’s strongest source of new housing inventory, they are confronting a difficult environment marked by higher construction costs from tariffs and cautious consumers strained by persistent inflation.
At the same time, the Federal Reserve appears poised to maintain its “higher for longer” interest-rate policy as it works to contain renewed inflationary pressures. If that stance persists, borrowing costs are likely to remain elevated, limiting housing affordability and slowing demand.
As a result, the much-anticipated housing market recovery expected in 2026 could face delays, particularly if geopolitical tensions and trade disruptions continue to weigh on inflation and consumer confidence. Until those uncertainties begin to ease, the path toward a sustained housing rebound may remain uneven.
In late December 2025, I wrote a blog post to reflect on the various factors that influence equity market returns. One of the simplest ways to look at historical performance, however, is to assume that double-digit gains cannot continue indefinitely.
After three consecutive years of strong returns for the S&P 500:
2025: +17.88%
2024: +24.87%
2023: +26.37%
it would be reasonable to expect that a typical “reversion to the mean” year for the index might deliver single-digit performance, either slightly positive or slightly negative.
One of the more interesting developments in 2025 was the resurgence of previously underperforming asset classes, particularly international equities (and even bonds), along with emerging market stocks. These so-called non-correlated trades had been largely stagnant for years, yet international equities posted their strongest performance since 2006 during 2025.
However, tensions involving Iran have significantly altered the investment outlook for 2026, disrupting the rotational trade that had appeared logical—at least before the recent airstrikes.
The real challenge now is distinguishing between stocks, sectors, and asset classes that could face genuine long-term damage from the geopolitical conflict and those that are simply undergoing a normal correction driven by news headlines.
Earlier, the “Liberation Day” correction from late January 2025 to early April 2025 resulted in roughly a 20% peak-to-trough decline. That episode was the last time investors experienced a meaningful surge in market fear and negative sentiment.
Looking back at history, the last time the S&P 500 produced returns similar to those seen from 2023 to 2025 occurred during the following stretch:
2021: +28.75%
2020: +18.2%
2019: +31.8%
Aside from 2019, those gains were heavily influenced by accommodative monetary policy and the era of near-zero interest rates. But it is worth noting what happened next: in 2022, the S&P 500 declined by -18.11%.
In short, some investors describe market behavior as a “sequencing of returns.” The broader takeaway is that after two or three years of strong equity gains, markets often transition into a period where returns become more modest—typically in the single digits. This is not a forecast, but historical patterns are worth considering.
At the moment, the U.S. equity market may need a significant spike in fear to establish a tradable bottom, particularly following the recent surge in crude oil prices. As always, this commentary is not investment advice but simply an opinion. Past performance does not guarantee future results. Investors should assess their own tolerance for portfolio volatility and make adjustments accordingly.
Gold attracted dip-buying during Friday’s Asian session, ending a two-day losing streak.
Declining US Treasury yields weighed on the US Dollar, helping support the precious metal as safe-haven demand increased.
However, inflation concerns have reduced expectations for interest rate cuts by the Federal Reserve, strengthening the US Dollar and potentially limiting further gains in gold.
Gold (XAU/USD) moved higher during Friday’s Asian session, recovering part of the losses recorded over the previous two days. The rebound came as the US Dollar (USD) paused its three-day rally amid a modest decline in US Treasury yields, offering some support to the precious metal. In addition, escalating tensions in the Middle East have boosted safe-haven demand, encouraging traders to buy Gold near the lower end of the trading range that has persisted over the past two weeks.
Iran’s new supreme leader, Mojtaba Khamenei, warned in his first public remarks that all US military bases in the region should close immediately or face potential attacks. He also stated that Iran would continue strikes against US bases, even while expressing a willingness to maintain goodwill with neighboring countries. Meanwhile, Donald Trump emphasized that countering Iran’s “evil empire” was more important than the impact on oil prices. In fact, Crude Oil prices have been rising since the beginning of the US-Israel conflict with Iran.
At the same time, fears of supply disruptions caused by the closure of the Strait of Hormuz have increased concerns about a potential surge in inflation. This has prompted investors to scale back expectations for interest rate cuts by the Federal Reserve in 2026. Such expectations could push US bond yields and the USD higher, potentially limiting further gains for non-yielding assets like Gold.
Investors are also waiting for the US Personal Consumption Expenditures (PCE) Price Index, due later in the North American session. This key inflation indicator will play an important role in shaping expectations for the Fed’s policy outlook, especially as markets worry that the war could push consumer prices higher.
Overall, geopolitical developments remain the dominant driver for markets. However, XAU/USD still appears on track to post a second consecutive weekly loss, and the mix of supportive and restrictive factors suggests traders may remain cautious before taking strong directional positions.
XAU/USD four-hour chart
Gold continues to receive support around the 200-period EMA on the 4-hour chart.
Gold is once again rebounding from support near the 200-period Exponential Moving Average (EMA) on the 4-hour chart. This reaction keeps the broader bullish structure intact despite the recent pullback and suggests that XAU/USD bears should remain cautious.
At the same time, the Moving Average Convergence Divergence (MACD) remains below both its signal line and the zero level. However, the shrinking negative histogram suggests that bearish momentum is fading rather than signaling a fresh downside move. The Relative Strength Index (RSI), hovering around 44, remains below the 50 midpoint but is well above oversold territory, indicating that the current move may be more of a corrective phase within a broader upward trend rather than a confirmed top.
In terms of levels, immediate support lies near $5,090, where recent intraday lows sit slightly above the 4-hour 200-period EMA around $5,039, creating an important demand zone. A break below this region could expose stronger support near $5,000.
On the upside, initial resistance is seen around the recent swing high near $5,160. A sustained move above this level could pave the way toward $5,200, followed by the late-stage peak near $5,230.
A recovery above the $5,160–$5,200 area would likely push the MACD back toward the zero line and lift the RSI closer to 50, strengthening the bullish bias. Conversely, if the $5,090–$5,039 support cluster fails to hold, the 4-hour outlook could shift toward a more neutral or even bearish tone.
The US Dollar Index (DXY) eased to around 99.70 during Friday’s Asian session. Rising geopolitical tensions in the Middle East may increase demand for safe-haven assets, which could lend support to the dollar. Meanwhile, the US Personal Consumption Expenditures (PCE) inflation report for January will be the key focus later on Friday.
The US Dollar Index (DXY), which measures the US Dollar (USD) against a basket of six major currencies, is trading near 99.70 during Friday’s Asian session. Although the index is slightly lower on the day, it remains on track for a second straight weekly gain and is hovering around its highest level since November 2025, supported by rising geopolitical tensions in the Middle East.
Officials from the Pentagon and the National Security Council (NSC) acknowledged that they had underestimated Iran’s willingness to shut the Strait of Hormuz following recent US military strikes while planning the current operation. Meanwhile, Iran’s new supreme leader, Mojtaba Khamenei, stated that the strategic waterway should remain closed and warned that Tehran would continue attacks on its Persian Gulf neighbors. The ongoing conflict involving the US, Israel, and Iran could continue to support the US Dollar as investors seek safe-haven assets.
At the same time, expectations for interest rate cuts by the Federal Reserve have eased, as surging oil prices raise concerns that inflation could remain elevated and complicate the central bank’s policy outlook.
Market participants will look to the January US Personal Consumption Expenditures (PCE) Price Index, due later on Friday, for further direction. The headline PCE is expected to rise 2.9% year-on-year, while core PCE—the Fed’s preferred inflation gauge—is forecast to increase 3.1% over the same period. A softer-than-expected inflation reading could put downward pressure on the US Dollar in the near term.
WTI declined after Australia’s Energy Minister Chris Bowen announced the release of 762 million liters of fuel from the country’s reserves. However, oil prices could climb again as the Strait of Hormuz remains closed amid intensifying tensions between the U.S., Israel, and Iran. Iran’s new supreme leader Mojtaba Khamenei stated that keeping the strait shut should continue to serve as a “tool to pressure the enemy.”
West Texas Intermediate (WTI) crude traded slightly lower during Asian trading hours on Friday, hovering around $95.20 per barrel after surging more than 9% in the previous session. Prices eased after Australia’s Energy Minister Chris Bowen announced that the country would release up to 762 million liters of fuel from strategic reserves and relax fuel stockholding rules to ease supply disruptions linked to the conflict with Iran.
The Australian government also plans to cut minimum fuel reserve requirements by as much as 20% in an effort to stabilize domestic supply. Nevertheless, oil prices could continue to climb as the Strait of Hormuz remains effectively closed amid escalating tensions between the United States, Israel, and Iran.
Since the war began, U.S. crude prices have jumped more than 40%. The International Energy Agency (IEA) warned that the U.S.–Israeli conflict with Iran could be triggering the largest supply disruption in the history of the global oil market.
Reports indicate that officials from the U.S. Department of Defense and the National Security Council underestimated Iran’s willingness to shut down the Strait of Hormuz in response to U.S. military strikes while planning the operation. The waterway carries around one-fifth of global oil consumption, making it one of the most strategically vital shipping routes in the world. Any interruption to tanker traffic there can rapidly impact global energy markets.
In his first public remarks since assuming power, Iran’s new supreme leader Mojtaba Khamenei said the closure of the Strait of Hormuz should remain a “tool to pressure the enemy.” He also warned that all U.S. military bases in the region should be shut down immediately or risk potential attacks.
Bitcoin edged slightly higher on Thursday, remaining largely insulated from the geopolitical developments unfolding in the Middle East.
The world’s largest cryptocurrency was last trading about 2% higher at $71,653.5 as of 20:23 ET (00:23 GMT).
Prices appear to be consolidating around the $70,000 level as investors assess the ongoing conflict involving the United States, Israel, and Iran.
Oil prices surged back toward $100 per barrel, raising renewed concerns about inflation.
Crude oil prices climbed back toward $100 per barrel, rekindling concerns about inflation. Oil markets were the main force shaping investor sentiment. Brent crude rose above $100 a barrel after retreating from Monday’s spike near $120, its highest level in almost two years.
The latest escalation in the Middle East involved attacks on two fuel tankers in Iraqi territorial waters and strikes on commercial vessels passing through the Strait of Hormuz, a vital global oil chokepoint.
About one-fifth of the world’s oil shipments pass through the strait, but tanker traffic has slowed sharply due to security concerns. Iran’s new leader, Mojtaba Khamenei, said on Thursday that the waterway will remain closed.
The surge in energy prices has renewed fears of global inflation just as central banks had begun considering policy easing. Analysts warn that oil remaining above $100 per barrel could complicate the U.S. Federal Reserve’s plans to cut interest rates and weigh on risk-sensitive assets like cryptocurrencies.
In recent months, Bitcoin has often moved alongside broader risk assets, and traders worry that another inflation shock could reduce market liquidity.
Investors are also watching key U.S. economic data for signals about the Federal Reserve’s next policy moves.
Weekly jobless claims declined slightly last week, indicating that layoffs remain relatively limited. Initial claims for unemployment benefits totaled 213,000 in the week ending March 7, below expectations and slightly down from 214,000 the previous week, according to the Labor Department.
Continuing claims, which measure the number of people still receiving unemployment benefits, fell to 1.85 million in the week ending February 28 from 1.87 million the week before. This data typically lags initial claims by one week.
The jobless claims report follows weaker-than-expected U.S. employment figures released by the Labor Department last week. Meanwhile, the U.S. Personal Consumption Expenditures (PCE) price index—the Federal Reserve’s preferred measure of inflation—is scheduled for release on Friday.
Tether invests in Ark Labs to support programmable payments on Bitcoin.
Tether said Thursday it has invested in Ark Labs as part of a funding round aimed at advancing programmable payments on the Bitcoin network.
The investment was included in a $5.2 million round for the startup, which is developing infrastructure to enable faster transactions and support application development on Bitcoin. With this latest funding, Ark Labs said its total capital raised has reached about $7.7 million.
Ark Labs is building Arkade, a system designed to operate as an execution layer on Bitcoin. The platform aims to help developers create services such as payment networks, lending applications, and digital asset platforms on top of the blockchain.
The project focuses on improving Bitcoin’s practicality for financial services that require quicker settlement and greater automation.
Alongside Tether, the round also attracted backing from Ego Death Capital, Epoch VC, Lion26, Sats Ventures, and Contribution Capital. Anchorage Digital, former PayPal vice president of finance Ralph Ho, and several other investors from the digital asset and fintech sectors also participated.
The project aims to enhance Bitcoin’s usability for financial services that require faster settlement and greater automation.
Alongside Tether, the funding round also drew investments from Ego Death Capital, Epoch VC, Lion26, Sats Ventures, and Contribution Capital.
Anchorage Digital, former PayPal vice president of finance Ralph Ho, and several other investors from the digital asset and fintech sectors also took part in the round.
Crypto prices today: altcoins edge higher.
Most altcoins followed Bitcoin higher on Thursday.
The world’s second-largest cryptocurrency, Ethereum, rose 3.9% to $2,135.71.
The third-largest crypto, XRP, gained 1.2% to $1.4083.
China has expanded its restrictions on iron ore from BHP Group for the second time in two weeks, intensifying a prolonged contract dispute with the world’s third-largest supplier of the key raw material used in steel production.
On Thursday, the state-owned buyer China Mineral Resources Group informed domestic steelmakers and traders that, beginning late next week, they will no longer be permitted to take delivery of Newman fines — a widely traded BHP iron ore product stored at Chinese ports, according to three sources familiar with the matter.
However, customers will still be able to collect shipments that are scheduled for delivery within the next five working days, two of the sources said, requesting anonymity.
One source noted that the move had been expected. “We had anticipated that restrictions on additional BHP products might eventually arrive, so the decision did not come as a surprise,” the person said.
BHP declined to comment, while CMRG did not immediately respond to requests for comment.
Over the past six months, Beijing has gradually tightened controls on purchases of BHP iron ore by domestic mills and traders as negotiations continue over the company’s 2026 supply agreement.
China first banned purchases of Jimblebar fines in September, followed by restrictions on the Jinbao product in November.
Last week, traders were instructed to limit new purchases of Newman fines, Newman lumps, and Mac fines, although buying cargoes already stored at ports was still permitted. The latest measure now limits purchases only to existing port inventories of Newman lumps and Mac fines.
Spillover impact
Concerned that additional restrictions may soon target the remaining grades, traders have begun offloading their cargoes quickly.
“We plan to sell all Newman fines stored at ports within the next few days and will also try to exit Mac fines positions,” another source said. “Even if Mac fines are not yet restricted, there is uncertainty about when delivery might be banned.”
Meanwhile, benchmark April iron ore futures on the Singapore Exchange rose more than 4% on Thursday afternoon to $108.95 per ton, the highest level since January.
According to another trader, port inventories of Newman fines reached 3.17 million tons this week — an increase of 55% compared with October.
The U.S. dollar maintained its strength on Friday and is on course for a second consecutive weekly gain since the outbreak of the conflict involving Iran, as global market volatility has reinforced its role as the primary safe-haven asset.
The euro hovered close to its lowest level since November, while the Japanese yen remained weak enough to raise concerns among traders about possible intervention by Japanese authorities.
As oil prices surged, the United States allowed limited sales of certain Russian petroleum products that had previously been sanctioned due to Russia’s war in Ukraine. Meanwhile, Iran intensified strikes on oil and transportation infrastructure across the Middle East. The country’s new Supreme Leader, Mojtaba Khamenei, also pledged to keep the vital Strait of Hormuz shipping route closed.
“For now, markets are focused less on diversification and more on inflation and slowing growth,” said Gavin Friend, senior markets strategist at National Australia Bank in London, during a podcast. “The longer this crisis continues, the more we face a dangerous combination of rising inflation and weaker economic growth.”
The dollar index, which tracks the U.S. currency against a basket of major currencies, climbed to its highest level since November. The rise reflects both its safe-haven demand and the fact that the United States is a net exporter of energy.
In early Asian trading, the index slipped slightly by 0.04% to 99.63, though it remained on track for a weekly gain of about 0.8%. The euro edged up 0.13% to $1.1525.
The yen strengthened by 0.17% to 159.08 per dollar after hitting 159.43 on Thursday—its weakest level since January 14. The British pound also rose 0.11% to $1.3356.
On Thursday, the U.S. Treasury issued a new Russia-related general license allowing the sale of Russian crude oil and petroleum products that were loaded onto ships through April 11.
According to a report by the Financial Times, the Trump administration has used up “years” worth of key munitions since the conflict began. Meanwhile, U.S. forces are conducting rescue operations in western Iraq after a military refueling aircraft crashed—an incident that U.S. Central Command said was not caused by hostile or friendly fire.
Earlier this week, the International Energy Agency agreed to release a record 400 million barrels of oil from strategic reserves. However, this would cover only around 20 days of supply lost from disruptions around the Strait of Hormuz and could take weeks or months to reach the market.
Investors are also turning their attention to next week’s policy meetings at the Federal Reserve and the European Central Bank to assess how central bankers might respond to a potential shock in energy prices.
Data from LSEG showed that the swaps market now expects the European Central Bank to potentially begin raising interest rates as early as June. In contrast, the U.S. Federal Reserve is expected to delay any rate cuts until September, later than earlier expectations of July.
The Australian dollar gained 0.14% against the U.S. dollar to reach $0.7084, while New Zealand’s kiwi rose slightly by 0.05% to $0.5858.
In the cryptocurrency market, bitcoin climbed 1.81% to $71,464.23, and ether increased 2.48% to $2,114.22.
Before the attack began on Feb. 28, lingering inflation concerns had already made the Federal Reserve cautious about continuing the interest rate cuts introduced last year. While several indicators of price pressure had eased compared with earlier highs, policymakers were reluctant to declare victory over inflation, which had peaked at 9.0% year over year in the Consumer Price Index in June 2022.
Since then, inflation has fallen sharply and stabilized around the mid-2% range, slightly above the Fed’s 2% target. However, the cautious optimism that accompanied this disinflation may quickly fade because of the war.
The main concern is that surging energy prices could reignite inflation and force the central bank to keep monetary policy tighter for longer. With oil, gasoline, and natural gas prices rising sharply, it remains unclear how persistent the shock will be—or how the Fed should respond. This uncertainty creates a policy gray area that may take time to resolve. The longer the conflict lasts, the more uncertain the outlook for monetary policy becomes.
Two key questions dominate the discussion: When will the war end, and what economic consequences will follow? For now, the answers remain highly speculative. Much of the analysis focuses on the recovery of oil exports through the Strait of Hormuz, which remains largely closed due to the conflict and normally handles about one-fifth of the world’s seaborne oil exports.
The basic calculation is straightforward: the longer shipments remain disrupted, the greater the hit to global supply, which could sustain upward pressure on energy prices. According to estimates from Capital Economics, cited by the Financial Times, prolonged export disruptions would likely extend the period of elevated oil prices and complicate the inflation outlook.
The challenge for the Federal Reserve is determining which scenario is most likely and calibrating monetary policy accordingly. With no clear end to the war in sight, the near-term outlook for energy prices—and their implications for inflation and economic growth—remains highly uncertain.
Financial markets are also struggling to assess the range of possible outcomes and are largely adopting a wait-and-see stance. One signal of this caution can be seen in the U.S. 2‑Year Treasury Yield, which is widely viewed as a proxy for expectations about Fed policy. In recent days, the yield has hovered close to the Effective Federal Funds Rate, suggesting investors broadly expect the central bank to keep interest rates steady in the near term.
Fed funds futures point to a similar outlook, indicating that markets expect the Federal Reserve to keep interest rates unchanged over the next three policy meetings. Current pricing suggests the first potential rate cut could come in July or September, although those expectations remain tentative given the high level of uncertainty surrounding the war’s impact on growth and inflation.
“The Fed always has a problem in deciding how to respond to a supply shock,” said Alan Detmeister, a former Fed economist now at UBS. “On the one hand, the inflationary effects argue for raising interest rates. On the other, weaker output and rising unemployment point toward lowering rates. It’s not clear-cut, which often leads the Fed to wait and see which side of its dual mandate—inflation or employment—requires the most support.”
Ultimately, even if a ceasefire eventually stabilizes the region, the economic aftershocks could persist. As a result, the Fed’s policy outlook is likely to remain uncertain for some time, with policymakers needing clearer signals on how the conflict will shape inflation and economic growth.
It’s difficult to get too excited about today’s CPI report. Because the data entirely predates the Iran war, it does not capture the recent surge in energy prices that could make next month’s inflation reading far more dramatic. Normally, this might be considered the last relatively “clean” inflation print before those effects appear. However, the data is not truly clean either, as lingering distortions from earlier shutdowns are still influencing the figures.
Those lingering effects may become more visible in April’s report, when rent data could show a temporary spike. This is expected because the October owners’ equivalent rent (OER) sample—assumed to have contained zero increases—will drop out of the calculation, potentially lifting the shelter component for one month. By that time, inflation data will also begin to reflect the impact of the Iran conflict. As a result, the next couple of months could bring more volatile inflation readings.
For February, expectations were roughly +0.26% for headline inflation and +0.24% for core inflation. That pace implies an annual rate close to 3%—still above the Federal Reserve’s target but not dramatically so. However, inflation had already been showing signs of firming even before the geopolitical tensions in the Middle East intensified, raising questions about how markets and policymakers will interpret the latest data.
The U.S. CPI swaps curve already appears to be factoring in the effects of the conflict. Unsurprisingly, it is inverted, reflecting expectations of higher inflation in the near term due to energy prices. What is more unusual is that longer-term inflation expectations remain lower. While that might initially seem odd, it also serves as a useful reminder that markets may expect the energy shock to be temporary rather than a lasting source of inflation pressure.
Another interesting point can be seen in the chart of five-year inflation swaps across several regions. Despite the sharp swings in energy prices, U.S. five-year CPI swaps have moved relatively little compared with other markets. This is partly because the U.S. economy is generally less sensitive to oil price fluctuations than many other countries. In addition, the U.S. dollar has often moved in the same direction as oil prices, which can soften the direct pass-through of energy costs into domestic inflation.
Even so, the move still appears notable. Given that this is a five-year tenor, it is somewhat surprising to see such a reaction when most of the current volatility stems from spot energy prices rather than longer-term inflation pressures.
With those preliminaries in mind, the actual data is worth examining. Forecasts proved fairly accurate, with headline CPI rising 0.267%, while core CPI increased 0.216%, both broadly in line with expectations.
The spike in apparel prices is somewhat unusual, although such jumps do occur occasionally and the category represents a relatively small share of the overall CPI basket. The increase in medical care costs—driven largely by hospital services—was somewhat concerning. On the other hand, shelter inflation came in softer, which helped offset some of the upward pressure from other components.
Both core services and core goods inflation eased on a year-over-year basis. Core goods inflation is now running at about +1% y/y. While a continued downward turn had been widely expected, the key question is where it ultimately stabilizes—around +0.5% or -0.5%. My view is that it is more likely to settle near +0.5%. Even so, the latest trend is encouraging news for the broader inflation outlook.
The main surprise in the report came from primary rents. While Owners’ Equivalent Rent (OER) rose 0.22% month-on-month, roughly in line with the previous month and continuing to trend lower on a year-over-year basis, Rent of Primary Residence increased by only 0.13% month-on-month.
This softer reading was notable, although the year-over-year trend in OER may shift in the coming months as the October sample—when increases were effectively assumed to be zero—drops out of the calculation.
The broader trend in rents is clearly moving lower, but the sharp drop is still surprising—especially given the ongoing cost pressures faced by landlords. It is possible that the decline will partially reverse next month. One likely explanation could be compositional shifts in the data. For example, rents may be softening in large cities as reverse immigration flows ease pressure on housing supply, while outmigration from places like New York City could also be influencing the figures. A deeper breakdown of the data would be needed to confirm these effects.
Meanwhile, the Lodging Away from Home category rose 1%. This component has been recovering after a dip last year, although hotel prices remain below the post-pandemic surge that followed COVID-19, when pent-up travel demand pushed rates sharply higher. Given the ongoing recovery in travel demand, there is a reasonable chance that hotel prices could reach new highs in 2026.
Airfares also increased, rising 1.4% month-on-month. This is worth watching closely. As energy prices climb, airlines often pass higher fuel costs on to passengers. While February’s data does not yet reflect the latest surge in energy prices, persistently high jet fuel costs could push airfares higher in the coming months.
If that happens, it may show up as stronger core inflation, even though the underlying driver would primarily be energy-related rather than a broader rise in service-sector prices.
The red dot reflects the end-of-February reading. Since then, jet fuel prices have been highly volatile. They are currently around $3.49, after briefly reaching $4.11 just a few days ago. Such swings in fuel costs typically feed through to airline pricing with a short lag, meaning the impact is likely to appear in next month’s airfare data.
Turning to “supercore” inflation—core services excluding shelter—**the pace eased compared with the previous month. Last month, supercore rose 0.59% month-on-month, while this month it increased a more moderate 0.35% m/m.
On a year-over-year basis, core services excluding rents currently stand at 2.94%. However, that figure is likely to jump next month due to base effects. The comparison will drop the unusually weak reading from last March, when several travel-related categories posted sharp declines: airfares fell 5.27%, lodging away from home dropped 3.54%, and car and truck rentals declined 2.66%.
As those unusually weak numbers roll out of the calculation, the year-over-year supercore measure will likely rise—even if the month-to-month readings remain relatively modest. And given recent developments in travel and energy costs, those monthly figures may not stay soft for long.
The overall distribution of price changes this month is also notable. Several categories recorded increases of less than 1% on an annualized month-to-month basis, although most of them were only slightly below that threshold.
It is also worth noting that the figures shown in red reflect adjustments based on my own estimate of seasonal patterns, rather than the methodology used by the Federal Reserve Bank of Cleveland.
There were also many categories in the upper tail of the distribution, although the upper tail appears longer than the lower one. Of course, Median CPI—a measure published by the Federal Reserve Bank of Cleveland—doesn’t depend on how long those tails are. That is precisely the point of using a median measure.
While I’m not fully confident in my estimate this month, I expect the median reading to come in relatively soft, likely below 0.2%.
Typically, median CPI tends to run comfortably above the mean CPI because for many years inflation has existed in a disinflationary regime, where price-change distributions were skewed to the downside—meaning the tails were longer on the negative side. In such environments, the median usually sits above the mean. This month, however, that pattern may not hold. During inflationary cycles, the distribution often flips, with longer tails on the upside, causing the mean to exceed the median. That said, one month of data is not enough to draw firm conclusions.
Regarding monetary policy, the February CPI figures may not carry much weight given the developments in March. Markets appear to be misinterpreting the recent energy price spike, treating it as an inflationary impulse that complicates the Federal Reserve’s policy path amid soft employment data. In reality, energy-driven increases in CPI are not typically the kind of inflation central banks try to suppress through tighter policy. Energy prices tend to be mean-reverting and are often anti-growth, meaning they slow economic activity.
Earlier observations about the CPI swaps curve—which is inverted and shows lower longer-term inflation expectations than a month ago—likely reflect markets beginning to price in a possible recession. While recessions themselves are not inherently disinflationary, markets often treat them that way.
If the Fed were to tighten policy in response to an energy-driven spike in inflation, it could worsen an economic slowdown. That dynamic contributed to several policy mistakes during the 1970s inflation crisis, something modern policymakers are well aware of. As a result, an energy shock combined with weak employment data is more likely to push the Fed toward easing rather than tightening.
In that sense, the current situation would not qualify as classic stagflation if core inflation continues to moderate. It may resemble “stag”—sluggish growth—but a higher headline CPI driven by energy does not necessarily signal persistent inflation if core and median measures remain contained.
That said, there are reasons for caution. Core and median inflation may not remain subdued indefinitely. There are already signs they could move back toward the mid-to-high 3% range, and indicators such as the Enduring Investments Inflation Diffusion Index are trending higher, suggesting broader price pressures could gradually re-emerge.
(That said, the Federal Reserve does not necessarily share this view. We may eventually find ourselves discussing stagflation in a more literal sense, but many observers could still be misled by spikes in headline inflation.)
Another key implication is that the February data will likely have limited influence on policy decisions. Given the events that unfolded in March, the CPI figures for February are already somewhat outdated. Since the report came in largely in line with expectations, markets are unlikely to dwell on it for long.
In short, February’s inflation print will probably be forgotten quickly. Attention will soon shift to the next few releases, which are likely to reflect the impact of the recent energy shock. Those upcoming numbers could be far more dramatic—and not necessarily in a reassuring way.
The U.S. dollar remains exceptionally strong, a factor that could help keep U.S. financial markets relatively resilient. Because gold is priced in dollars, the metal may once again attract nervous investors as a safe haven. At the same time, shipping disruptions have created an acute shortage of fertilizers, raising concerns about potential food supply shortages.
Meanwhile, the International Energy Agency has proposed the largest release of oil reserves in its history—around 400 million barrels—to help offset supply disruptions linked to tensions around the Strait of Hormuz. Bloomberg also reported that Germany and Japan are preparing to tap their strategic crude reserves in the coming days.
Signs of stress are also emerging in private credit markets. BlackRock has restricted withdrawals from one of its flagship private credit vehicles, the HPS Corporate Lending Fund, after a surge in redemption requests. The $26 billion fund received about $1.2 billion in withdrawal requests during the first quarter but will permit only $620 million in redemptions—roughly 5% of the fund. If anxiety spreads further across private credit markets, it could tighten lending conditions and slow economic growth, potentially prompting the Federal Reserve to respond with additional interest-rate cuts.
Inflation data also supported expectations for future rate reductions. The U.S. Department of Labor reported that the Consumer Price Index rose 0.3% in February and 2.4% over the past 12 months, with both headline and core readings matching economists’ forecasts. A particularly encouraging detail was the moderation in shelter costs—often measured through owners’ equivalent rent—which increased only 0.2% in February. Given that shelter costs have risen about 3% over the past year and have been a major driver of inflation, this slowdown suggests price pressures in that category may be cooling more rapidly.
On the corporate front, Nvidia is set to host its annual GPU Technology Conference next week, where the company is expected to unveil details about its next-generation chip architecture. Anticipation surrounding the event has already helped lift semiconductor and memory stocks. The conference is also expected to emphasize optical networking technologies, which could benefit companies such as Ciena, Corning, and Ubiquiti.
Singapore-based logistics firm GLP is targeting a valuation of around $20 billion through a potential initial public offering in Hong Kong, which could take place as early as this year, according to two people familiar with the matter.
The company has been discussing the possible listing with advisers including Citigroup and Morgan Stanley, one source and a third person with knowledge of the plans said.
However, both the size and timing of the offering have yet to be finalized.
Under the rules of the Hong Kong Exchanges and Clearing, large-cap companies typically float at least 15% of their shares in an IPO.
The sources declined to be identified as the discussions are private. GLP, Citigroup and Morgan Stanley all declined to comment.
If completed, the listing would add a major name to a revitalized equity capital market in Hong Kong, where the current IPO pipeline is largely dominated by companies from China.
After ranking first globally for IPO fundraising last year, Hong Kong entered 2026 with a strong pipeline. About $5.5 billion was raised through IPOs and secondary listings in January alone, according to data from HKEX and London Stock Exchange Group.
Return to public markets
A Hong Kong listing would mark a return to public markets for GLP, which was taken private from the Singapore Exchange in 2017 in a S$16 billion ($12.6 billion) deal led by investors backing CEO Ming Mei.
Investors involved in the privatization included Hopu Investment, Hillhouse, the investment arm of Bank of China, and Ping An Insurance.
GLP describes itself as a global thematic investor and business builder focused on logistics real estate, digital infrastructure, renewable energy and related technologies. The firm manages more than $80 billion in assets across real assets and private equity.
In recent years, GLP has sought to strengthen its capital base and reshape its business. In August, a subsidiary of the Abu Dhabi Investment Authority agreed to invest up to $1.5 billion in the company.
Earlier, in March 2025, GLP sold GCP International to Ares Management in a deal that included $3.7 billion upfront and a potential earn-out of up to $1.5 billion.
The U.S. dollar strengthened on Wednesday as rising oil prices reignited inflation concerns, while an in-line and backward-looking U.S. consumer inflation reading did little to reinforce expectations for Federal Reserve rate cuts.
By 16:03 ET (20:03 GMT), the U.S. Dollar Index—tracking the greenback against a basket of six major currencies—had climbed 0.4% to 99.22. The euro slipped 0.3% to 1.1570, while the British pound was largely unchanged at 1.3416.
Oil prices climb despite record release from strategic reserves
Oil prices rose on Wednesday as the conflict with Iran showed little sign of easing, with a record release of 400 million barrels from emergency reserves by the International Energy Agency (IEA) doing little to calm concerns about rising inflation.
In a note, analysts at ING said the foreign-exchange market remains “strongly driven” by the recent sharp swings in oil prices.
Market attention remains focused on the Strait of Hormuz, the narrow passage south of Iran through which roughly one-fifth of the world’s oil supply passes, much of it headed to Asia. Concerns over potential Iranian attacks have caused a buildup of vessels on both sides of the strait, as shipping companies seek to ensure crew safety and face difficulties securing insurance for voyages.
Brent crude, the global benchmark, is now trading near $90 per barrel after surging to $120 earlier in the week. U.S. gasoline prices have also climbed, raising the risk of renewed inflationary pressure that could prompt the Federal Reserve to adopt a more hawkish monetary policy stance. Higher interest rates may in turn attract foreign capital, providing additional support for the U.S. dollar.
Oil prices have remained highly sensitive to developments in the Middle East. Comments from the U.S. Energy Secretary that the military had escorted a tanker through the Strait of Hormuz sent Brent prices swinging between $81 and $92 per barrel.
President Donald Trump has also threatened to intensify U.S. attacks on Iran following reports that Tehran had deployed naval mines in the Strait of Hormuz. After a CNN report suggested that mines had been placed in the bottleneck—though not yet extensively—Trump warned on Tuesday that Iran would face retaliation “at a level never seen before” if the mines were not removed.
The IEA’s coordinated release announced on Wednesday far exceeds the 182 million barrels made available by member countries after Russia’s invasion of Ukraine in 2022.
ING analysts described the move as a “temporary measure,” arguing that only military de-escalation would be capable of pushing crude prices sustainably lower. They added that the large reserve release could also signal that markets should not expect an immediate ceasefire.
“In our view, these mixed signals could prevent the dollar from falling much further today unless there are encouraging headlines on de-escalation,” the ING analysts said.
U.S. consumer inflation comes in line with forecasts
The February Consumer Price Index (CPI) report drew attention on Wednesday, although the data does not reflect the impact of the Iran conflict or the resulting surge in oil prices, making it more backward-looking than usual.
According to the U.S. Bureau of Labor Statistics, headline CPI rose 0.3% month-on-month and 2.4% year-on-year in February, both in line with market expectations. Core CPI increased 0.2% from the previous month and 2.5% from a year earlier, also matching forecasts.
Despite meeting estimates, the report is likely to receive limited attention as markets focus on developments in the Middle East. Concerns that higher oil prices could trigger renewed inflationary pressure may prompt the Federal Reserve to keep interest rates on hold.
“The good news is that inflation didn’t come in higher than expected in this morning’s CPI report, but the data is backward-looking and reflects a period before the war in Iran began,” said Chris Zaccarelli, chief investment officer at Northlight Asset Management.
“It is widely assumed — and we agree — that the Fed will remain on hold for longer as policymakers wait to see whether inflation expectations begin to rise and become entrenched, or if conditions return to where they were before the military operations in the Middle East,” Zaccarelli added.
Oil prices surged in Asian trading on Thursday, climbing back above the key $100 per barrel mark as concerns mounted over energy supply disruptions tied to the ongoing conflict between the United States, Israel, and Iran.
Brent crude futures jumped more than 9% to $100.25 per barrel by 22:52 ET (02:52 GMT), while West Texas Intermediate (WTI) rose 8.8% to $93.67 per barrel.
Reports indicated that two international oil tankers were attacked in the northern Persian Gulf near Iraq and Kuwait. Videos circulating online showed the vessels on fire, with Iraqi media blaming the strike on Iran.
Separately, Bloomberg reported that Oman evacuated all ships from the major oil export terminal at Mina Al Fahal as a precaution following a series of attacks on vessels in the region.
These incidents suggest the conflict is spreading beyond the Strait of Hormuz, as the war entered its thirteenth straight day on Thursday. Attacks on tankers and port shutdowns intensified fears of supply disruptions, particularly after Iran warned that no crude oil would pass through the strategic waterway, which carries roughly 20% of global oil shipments. The country was reported to have already blocked traffic through the route earlier this week.
However, oil prices stayed below their weekly highs as several countries moved to counter potential supply shortages. Reports suggested the International Energy Agency was preparing to release a record 400 million barrels from strategic reserves. Meanwhile, Donald Trump said the United States would release 172 million barrels from its Strategic Petroleum Reserve to ease energy market pressures caused by the conflict.
Despite repeated claims from U.S. officials that the war could soon end, the fighting has shown little sign of easing. Oil prices had earlier surged to nearly $120 per barrel earlier this week.
President Donald Trump appears to be effectively controlling the pace and direction of the conflict, a point echoed by U.S. Defense Secretary Pete Hegseth. For traders, this concentration of decision-making power is not entirely unfamiliar, as markets have grown accustomed to navigating policy shocks driven by Trump. In theory, when authority is concentrated in a single figure, it could narrow the range of possible outcomes.
In practice, however, the opposite may be happening. During most geopolitical crises, markets assess risks through institutional processes—cabinet deliberations, coalition coordination, and diplomatic negotiations. These structures allow traders to gradually build probability models for how events may unfold. This time, while the decision-making framework appears more centralized, the range of potential outcomes seems broader. When the decision loop runs through a single, highly unpredictable leader, markets struggle to rely on consistent messaging. Instead of clarity, price action begins to reflect personality, tone, and mood.
As a result, global financial markets are being influenced not only by economic fundamentals but also by political rhetoric and timing. Traders find themselves constantly reacting to headlines—whether from press briefings or social media—because a single comment can shift market positioning more quickly than traditional macroeconomic analysis.
This dynamic defined one of the week’s most chaotic trading sessions. Market movements were not driven by earnings revisions, macroeconomic releases, or the typical interaction between bond and equity markets. Instead, crude oil became the central driver of market sentiment, with every headline emerging from the Strait of Hormuz quickly rippling across equities, currencies, and safe-haven assets. When volatility spikes in energy markets, it rarely remains confined to commodities. Oil remains a critical component of the global economic system, meaning fluctuations in its price often transmit shocks across multiple asset classes.
The Asian trading session initially opened with cautious optimism. After Trump suggested the conflict might be approaching some form of resolution, crude prices moved sideways, well below the sharp volatility seen previously. For a short period, it appeared that markets might return to pricing economic fundamentals rather than reacting to geopolitical developments.
That sense of calm proved short-lived. Hegseth later warned that Tuesday could become the most intense day of strikes in the conflict. At that point, markets quickly reassessed the situation, realizing that the earlier calm might have been only a temporary pause before further escalation. As a result, the geopolitical risk premium rapidly returned to oil prices.
For traders, the oil market has effectively become the roulette ball—bouncing unpredictably as new headlines hit the market. The result is a trading environment that feels less like a traditional price discovery process and more like a casino table, with participants watching the wheel spin and trying to anticipate where the next move will land.
Follow the bouncing barrel
Overnight: After Donald Trump delivered a quasi “all-clear” tone the previous day, oil prices moved sideways during overnight trading, remaining well above the sharp lows seen during the earlier selloff.
09:00 ET: Reports that the International Energy Agency was convening a meeting to discuss the possibility of a coordinated Strategic Petroleum Reserve (SPR) release pushed crude prices lower.
12:45 ET: U.S. Energy Secretary Chris Wright posted on social media that the U.S. military had escorted an oil tanker through the Strait of Hormuz, triggering a sharp drop in oil prices.
13:10 ET (approx.): Wright deleted the post shortly afterward. Journalists cited sources denying the escort operation, while Islamic Revolutionary Guard Corps officials also rejected the claim—prompting oil prices to rebound.
13:25 ET:CBS News reported that U.S. intelligence believed Iran may be laying mines in the Strait of Hormuz, sending crude prices sharply higher.
14:00 ET: White House Press Secretary Karoline Leavitt confirmed there had been no tanker escort, which helped extend the upward move in oil.
14:20 ET: The International Energy Agency concluded its meeting without announcing any coordinated SPR release, allowing oil prices to climb further.
By the closing bell, the overall result appeared deceptively calm. West Texas Intermediate crude oil settled around $85 a barrel—technically lower than the previous close but essentially unchanged from levels seen when equities finished trading the day before. Anyone focusing only on the closing price would miss the real story. The session itself demonstrated how modern markets behave when geopolitics drives price action and information arrives in fragments rather than through formal policy announcements.
The options market, however, reveals the deeper dynamic. Volatility in crude rose again, and the skew in pricing has become pronounced. Investors are paying the largest premiums in years for call options on WTI futures relative to puts—an indication that traders remain uneasy about potential upside risks tied to disruptions in the Strait of Hormuz. In effect, the derivatives market is insuring against the possibility that the next headline could remove additional barrels from global supply. In an environment where tanker movements slow and supply routes tighten, the real threat is not yesterday’s price spike but the next one.
That anxiety is grounded in fundamentals. If disruptions in the Gulf expand—or simply persist longer than expected—oil prices would likely rise as more Middle Eastern supply faces shutdown risks and potential force majeure declarations. Even with diversion pipelines and strategic reserves acting as buffers, the scale of possible disruption clashes with a global market that still consumes more than 100 million barrels per day. While daily trading may appear dominated by headlines, the underlying arithmetic of missing supply continues to shape market expectations.
The uncertainty also spilled directly into equity markets. When crude prices fell earlier in the session, stocks briefly rallied as inflation concerns eased and interest-rate-sensitive sectors found support.
However, Asian and European equities remain particularly vulnerable because both regions are major energy importers. Markets have become highly sensitive to Brent crude oil once it moves above the $85 level. That threshold is deeply embedded not only in trader psychology but also within automated trading systems that now dominate market flows. When crude rises above that zone, systematic strategies, energy sensitivity models, and macro-risk algorithms often trigger a reflexive reaction, amplifying the feedback loop between oil and equities. In practical terms, the relationship becomes mechanical: higher oil prices tend to pressure Asian equities, while cooling crude prices allow stocks to stabilize.
Even in U.S. markets, the environment is not ideal for absorbing shocks. According to the Delta One desk at Goldman Sachs, liquidity conditions remain relatively thin. Depth in the S&P 500 order book sits near $4.53 million—around 25% below the 20-day average—while overall market trading volumes are also roughly 25% lower than typical levels. This means markets are attempting to interpret large macroeconomic signals with reduced liquidity, a situation that can amplify price swings whenever oil becomes the trigger.
In effect, the broader financial system spent the session taking cues from the crude market. When oil moves sharply, equity markets quickly react. While this correlation may weaken during calmer periods, it becomes dominant when the Strait of Hormuz turns into the world’s most important venue for price discovery in energy markets.
For traders, the lesson is clear. In stable environments, fundamentals dominate and models guide trading decisions. But during geopolitical crises—particularly those involving Middle Eastern energy supply—unexpected shocks become the primary driver. Information itself becomes the commodity being traded. Headlines, signals, and rumors can move prices as much as actual supply changes. When global risk perception hinges on a small number of political decisions—often shaped by figures such as Donald Trump—markets stop behaving like predictable equations and begin reacting more like mood indicators, capable of changing direction with a single statement or social media post.
Gold prices are stabilizing near a key resistance area as global financial markets position ahead of the latest U.S. Consumer Price Index (CPI) report. The inflation data due later in the session is expected to be one of the week’s most important macroeconomic events, with the potential to influence expectations for Federal Reserve policy, real interest rates, and global asset allocation.
Across markets, investors have already begun adjusting their positions, trimming directional exposure before the data release. Precious metals have remained relatively supported, while performance across other asset classes has been more mixed, underscoring gold’s role as a defensive asset during periods of macroeconomic uncertainty.
Instead of taking aggressive new positions, many traders are adopting a wait-and-see stance as the market enters the final hours ahead of the CPI release. Such cautious positioning often leads to short-term consolidation across major assets as participants manage risk before potentially market-moving economic data.
Inflation data emerges as the key macro catalyst for markets
The upcoming U.S. CPI release is considered the most important scheduled macroeconomic event of the week, as inflation data directly shapes expectations for Federal Reserve policy, real interest rates, and the direction of the U.S. dollar. All three factors have historically played a major role in influencing gold price movements.
When inflation data comes in stronger than expected, markets often reassess how persistent price pressures may be and whether monetary policy could remain restrictive for longer. In such situations, investors tend to increase allocations to assets that help preserve purchasing power, which typically supports demand for gold and other precious metals.
Conversely, softer inflation readings can trigger the opposite reaction. If price pressures appear to be easing, investors may anticipate that the Federal Reserve will have greater flexibility to slow or pause its tightening cycle. Shifts in interest-rate expectations frequently ripple through currency markets and broader commodity positioning, which in turn affects gold price dynamics.
Because of this sensitivity, gold often enters a phase of consolidation ahead of major inflation releases as traders reduce exposure while waiting for clearer macroeconomic signals.
Recent market behavior reflects this pattern. Movements in U.S. Treasury yields and currency markets have remained relatively contained, while equity indices have shown uneven performance across different regions. These mixed signals suggest that investors are largely focused on the upcoming inflation data rather than reacting to short-term fluctuations in individual markets.
Within the broader metals complex, gold continues to act as the anchor asset guiding investor flows. While silver and other metals have shown greater short-term volatility, gold remains the primary reference point for portfolio allocation during periods of macroeconomic uncertainty.
Demand for precious metals has stayed relatively stable even as other commodity sectors display more volatile price movements. Energy markets, in particular, have recently experienced sharp swings, underscoring a growing divergence between the behavior of industrial commodities and defensive assets.
This divergence indicates that investors are reassessing broader macro risks rather than simply reacting to individual commodity price fluctuations. With inflation expectations and the outlook for monetary policy still uncertain, capital flows are increasingly being directed toward assets that can help preserve value during periods of financial instability.
From a technical standpoint, gold is currently trading within a consolidation range just below its recent highs. The Renko chart highlights a resistance zone around the $5,225 level, where several attempts to extend the rally have stalled in recent sessions.
After testing this resistance, price action pulled back and entered a compression phase around the $5,200 region. This level has repeatedly acted as a short-term equilibrium point, where buying interest has emerged to stabilize the market.
Additional support is visible near $5,190, which has served as a secondary defense area during recent pullbacks. The proximity of these levels suggests that gold is currently moving within a relatively narrow range while awaiting fresh macroeconomic catalysts.
Momentum indicators also indicate that the market is rebuilding directional energy rather than entering a prolonged reversal. Oscillators have retreated from overbought territory and are stabilizing as price consolidates ahead of the upcoming U.S. CPI release.
Meanwhile, the ECRO indicator on the chart signals a compression phase, suggesting that volatility is temporarily contracting as the market digests recent price movements. Such compression patterns often appear before major macro events, as traders reduce risk exposure ahead of potentially market-moving economic data.
CPI release may determine gold’s next directional move
The upcoming inflation report represents a pivotal moment for gold markets.
If the CPI data confirms that inflationary pressures remain persistent, investors may increase allocations to precious metals as a hedge against potential monetary instability and declining purchasing power. Such an outcome could allow gold to challenge the resistance zone near recent highs and potentially reignite bullish momentum.
A sustained move above the $5,225 region would indicate that buyers are regaining control of the trend and could open the door for further upside across the precious metals complex.
However, if the inflation data comes in below expectations, markets may interpret the result as a sign that price pressures are gradually easing. In that scenario, gold could enter a deeper consolidation phase as investors adjust expectations for monetary policy and interest rates set by the Federal Reserve.
For now, gold remains positioned near a key technical threshold as markets await confirmation from macroeconomic data. The CPI release will likely determine whether the current consolidation evolves into a renewed bullish advance or develops into a broader pause within the ongoing precious metals trend.
Oil prices rebounded on Wednesday as investors questioned whether a planned large-scale release of strategic reserves by the International Energy Agency would be enough to offset potential supply disruptions caused by the U.S.–Israeli conflict with Iran.
Brent crude futures rose 59 cents, or 0.7%, to $88.39 a barrel by 07:27 GMT, while West Texas Intermediate crude oil gained 98 cents, or 1.2%, to $84.43 per barrel.
Both benchmarks had extended losses earlier in Asian trading after plunging more than 11% on Tuesday, despite U.S. crude initially jumping 5% at the market open.
According to a report by The Wall Street Journal, the proposed IEA release would surpass the 182 million barrels collectively released by member countries in 2022 following the Russian invasion of Ukraine.
Analysts at Goldman Sachs said such a stockpile release could offset roughly 12 days of an estimated 15.4 million barrels-per-day disruption in Gulf exports.
Meanwhile, the conflict continued to escalate. The U.S. and Israel launched what both the Pentagon and Iranian sources described as the most intense airstrikes of the war on Tuesday. The United States Central Command also said the U.S. military had destroyed 16 Iranian mine-laying vessels near the Strait of Hormuz, after Donald Trump warned that any mines placed in the waterway must be removed immediately.
Some analysts remained skeptical that the reserve release would significantly ease market tensions. Suvro Sarkar, energy sector team lead at DBS Bank, said such moves were unlikely to solve the crisis, adding that oil prices would largely depend on how long the conflict with Iran continues. Strategic signals, including potential reserve releases, may help temper near-term price spikes, he added.
Leaders of the Group of Seven have also convened to discuss a coordinated emergency stockpile release. Emmanuel Macron is set to host a virtual meeting with other G7 leaders to assess the Middle East conflict’s impact on energy markets and possible responses.
Trump has repeatedly stated that the U.S. is prepared to escort oil tankers through the Strait of Hormuz if necessary. However, sources told Reuters that the United States Navy has so far declined shipping industry requests for escorts, citing high security risks.
Supply concerns remain
Energy infrastructure disruptions have also added to supply worries. Abu Dhabi National Oil Company reportedly shut down its Ruwais refinery after a drone strike caused a fire at the complex.
At the same time, Saudi Arabia, the world’s largest oil exporter, is attempting to increase shipments via the Red Sea. However, current export levels remain far below what would be needed to fully offset the decline in flows through the Strait of Hormuz. The kingdom is relying on the Red Sea port of Yanbu to boost shipments as neighbors such as Iraq, Kuwait, and the UAE have already reduced production.
Energy consultancy Wood Mackenzie estimates the war is currently cutting Gulf oil and refined product supplies by about 15 million barrels per day, a disruption that could potentially push crude prices as high as $150 per barrel.
Analysts at Morgan Stanley noted that even a quick resolution to the conflict could still leave energy markets facing several weeks of disruption.
Meanwhile, signs of strong demand also supported prices. Data from the American Petroleum Institute indicated that U.S. crude, gasoline, and distillate inventories all declined last week.
The U.S. dollar rally paused on Tuesday as investors evaluated signs that the joint U.S.–Israeli military campaign against Iran could be nearing its end.
The Dollar Index, which measures the greenback against a basket of six major currencies, fell 0.3% to 98.91 at 15:47 ET (19:47 GMT).
U.S. President Donald Trump suggested that the conflict in Iran—now ongoing for more than a week—could conclude “very soon.” However, he warned that further fighting could occur if Iran attempts to block shipments through the Strait of Hormuz, a crucial passage south of Iran that carries about one-fifth of global oil flows.
Despite these comments, the conflict has shown little sign of easing, with the United States launching its most intense airstrikes on Iran so far on Tuesday.
Concerns that prolonged disruptions in the Strait of Hormuz could drive global inflation higher had supported the dollar in recent days. Iran’s leadership reportedly warned it would not allow “one liter of oil” to pass through the chokepoint if U.S. and Israeli strikes continued. Still, Trump’s remarks appeared to boost market sentiment.
Analysts at ING, including Chris Turner and Francesco Pesole, said in a note that markets reversed course after an initially shaky start to the week.
“After a very shaky start, Monday proved to be a day of reversal for risk assets as President Trump hinted that military operations could end soon,” they wrote. “No one knows whether that will be the case, but Monday’s events show that the U.S. administration is more sensitive to energy than it seemed.”
However, the analysts added that oil supplies—currently stranded near the Strait of Hormuz or rerouted away from the region—would need to begin flowing normally again for the dollar’s pullback to continue.
Elsewhere in currency markets, EUR/USD slipped 0.2% to 1.1609, while GBP/USD declined 0.1% to 1.3414.
Yen remains stable in Asian trading
The Japanese yen remained relatively steady in Asian trading, with the USD/JPY pair edging up 0.2% to 158.07. The currency continued to face pressure from a stronger U.S. dollar and concerns that disruptions to energy supplies could weigh on Japan’s economy. Japan relies heavily on oil imports that pass through the Strait of Hormuz.
Revised gross domestic product data for the fourth quarter showed that Japan’s economy expanded more than previously estimated, supported by robust capital investment and stable consumer spending.
The figures indicated a degree of resilience in the Japanese economy, although exports remained under strain. Private consumption growth was also revised higher but stayed close to its long-term average of roughly 0.3% quarter-on-quarter.
This economic resilience may provide the Bank of Japan with more room to raise interest rates. However, the central bank is unlikely to tighten policy in the near term given heightened uncertainty in global markets.
Gold prices edged higher in Asian trading on Wednesday as investors weighed mixed developments surrounding the U.S.-Israel conflict with Iran, particularly concerns about energy market disruptions and the possibility that the fighting could ease.
Traders are also awaiting U.S. consumer inflation data for February for fresh insight into the health of the world’s largest economy, although the report is unlikely to fully capture the recent surge in energy prices linked to the Iran conflict.
Spot gold rose 0.2% to $5,204.29 an ounce as of 01:17 ET (05:17 GMT), while gold futures slipped 0.5% to $5,213.11 per ounce.
Gold breaks above $5,200/oz as markets weigh mixed Iran signals
Gold’s gains on Wednesday pushed prices above the $5,000–$5,200 per ounce range that had contained trading over the past week, though it remained uncertain whether the breakout would hold.
The precious metal has experienced sharp volatility in recent weeks, retreating significantly after reaching a record high near $5,600 per ounce in late January.
Conflicting developments surrounding the Iran war also contributed to choppy trading this week. U.S. President Donald Trump said late Monday that the conflict was nearing an end. However, exchanges of strikes between the U.S., Israel, and Iran continued into early Wednesday, marking the twelfth straight day of fighting.
Investors remain concerned that a surge in energy-driven inflation could prompt global central banks to adopt a more hawkish policy stance—an outlook that typically weighs on gold. As a result, the metal’s gains were capped despite rising safe-haven demand.
Elsewhere in the precious metals market, price movements were relatively muted. Spot silver slipped 0.1% to $88.2245 an ounce, while spot platinum edged up 0.3% to $2,208.89 per ounce.
U.S. CPI report in focus for fresh clues on inflation
Markets are awaiting the release of U.S. consumer price index (CPI) data for February later on Wednesday, which is expected to offer clearer signals on inflation and the outlook for interest rates in the world’s largest economy.
Headline CPI is forecast to hold steady at 2.4% year-on-year, while core CPI is projected to remain unchanged at 2.5%.
Although the data is unlikely to capture the recent spike in energy prices triggered by the Iran conflict, investors will still monitor the report closely for indications on consumer spending trends and the broader health of the U.S. economy.
The CPI release follows a weaker-than-expected February payrolls report, which has fueled some concerns that economic momentum in the United States may be slowing.
Gold declines as a surge in oil prices pushes the U.S. dollar and Treasury yields above important levels.
However, safe-haven demand tied to tensions in the Middle East is helping limit further losses despite the rise in yields.
For now, the key levels to watch are $5,000 as support and the $5,150–$5,200 resistance zone.
Gold has begun the week on a weaker note after recording its first weekly loss since the sharp drop at the end of January. Although prices attempted to rebound in the latter half of last week, the recovery was not enough to offset the earlier declines.
The move largely reflects the sharp surge in oil prices, which has pushed both the U.S. dollar and bond yields higher. With oil climbing above $100 today, gold slipped again at the start of the session. As a result, gold is currently caught in a difficult position: escalating tensions in the Middle East are generating some safe-haven demand, but the strengthening U.S. dollar and rising bond yields are acting as significant headwinds.
Stronger U.S. Dollar and Rising Yields Offset Safe-Haven Demand
Rising yields typically weigh on assets like gold and silver, which do not generate interest and involve storage costs. In recent months, however, gold has shown notable resilience even as bond yields remained elevated. That strength faded somewhat last week, and at the start of today’s session gold slipped again—an unsurprising move given the firmer U.S. dollar and higher Treasury yields.
As the session progressed, gold did recover from its earlier lows, though it was still trading in negative territory at the time of writing.
The recent spike in oil prices has had a mixed impact on gold. On one side, the rise in bond yields and the stronger U.S. dollar has put downward pressure on the metal. On the other, safe-haven demand has continued to limit the downside. If oil prices were to ease somewhat—perhaps through a coordinated release of strategic reserves—gold could find room to move higher again.
Overall, gold’s price action remains volatile and largely in a consolidation phase, offering both bullish and bearish traders opportunities amid the heightened market swings.
Key Gold Price Levels to Watch
For now, the market appears to be trading strictly between key levels, and this pattern is likely to continue until we see a decisive breakout above resistance or a breakdown below the major support levels protecting the downside.
So, which levels are the most important to watch?
Support is currently located between $5,000 and $5,050. This zone has been tested several times from above in recent days and has held up well so far.
As long as gold does not break decisively below the $5,000 level, the overall bias could still favor the upside. Despite the recent rebound in the U.S. dollar and bond yields, gold’s broader trend has remained bullish, making it difficult to dismiss that outlook—especially given the ongoing tensions in the Middle East.
On the resistance side, the key range lies between $5,150 and $5,200. This area has been tested multiple times since the breakout seen last Tuesday, which initially appeared to signal a potential turning point for gold.
However, there has been little meaningful follow-through to the downside. The fact that gold has managed to hold steady suggests it may be forming a base around $5,000 before possibly attempting another move higher.
For now, the focus remains on these levels. Whether gold breaks above resistance or falls below support will likely determine its next short-term direction.
Stocks dropped sharply at Monday’s open but, as anticipated, recovered steadily throughout the session as volatility began to fade. Sentiment improved further later in the day after headlines suggested the war could end soon.
From a bullish perspective, however, one key challenge remains. Today marks the settlement of roughly $15 billion in Treasury bills. Historical data indicates that markets rise only about one-third of the time on settlement days, while in roughly two-thirds of cases equities tend to decline.
It is still possible that elevated volatility overrides the typical settlement pattern, allowing the market to post a modest gain of around 40 to 50 basis points. Even so, the historical analysis has generally proven reliable.
From both an options-market and technical-analysis standpoint, 6,800 is a key level. If the SPX moves above it, the index could quickly advance toward 6,900, which corresponds to the zero gamma level.
Another concern is that the USD/JPY cross-currency basis has been turning more negative, pointing to tighter dollar liquidity. This comes on top of signals from the Treasury settlement data. Overall, the liquidity situation hasn’t improved much so far and may even be slightly worse.
That said, the cross-currency basis could widen if markets begin to believe oil prices will stabilize or decline. For now, however, the outlook remains uncertain and difficult to call.
Oil had clearly become overbought, trading above its upper Bollinger Band while the RSI was above 70. There also appears to be solid support near the $80 level. While prices could decline further, a return to the $60 range in the near term seems unlikely.
Oil at $80 is certainly preferable to $100, but it is still significantly higher than $60. A $20 jump in prices represents more than a 33% increase, which is unlikely to be favorable for the upcoming CPI report or for consumers paying at the gas pump.
Financial markets have begun acting as if the conflict involving Iran is nearing its conclusion. However, no diplomatic resolution has been reached, fighting continues, and several critical strategic issues remain unsettled.
Oil markets reflected the shift first.
Crude prices surged to roughly $120 per barrel at the peak of escalation fears. Within days, prices dropped sharply, falling back below $90 after remarks from U.S. President Donald Trump suggested the war could end “very soon,” even though he indicated hostilities might persist beyond the coming week.
Equity markets reacted quickly. U.S. stocks advanced, with the S&P 500 and Nasdaq Composite both moving higher as investors returned to risk assets.
Asian markets soon followed. Major indices in Japan, South Korea, and Hong Kong rebounded after several cautious trading sessions dominated by geopolitical concerns.
These movements highlight how rapidly market sentiment can shift. Investors appear to be positioning for easing tensions in the Middle East, even though no ceasefire has been agreed upon and rhetoric from both sides remains confrontational.
By nature, financial markets look ahead. Prices attempt to anticipate future developments rather than simply reflect current conditions. Recent trading patterns suggest investors believe the worst escalation risks will remain contained. Oil falling below $90 while equities climb signals confidence that supply disruptions will be limited and that the conflict will not expand into a broader regional crisis. That confidence may ultimately prove correct. However, markets sometimes move ahead of geopolitical realities.
Energy markets offer a clear example of this sensitivity.
Iran produces around 3.2 million barrels of oil per day and sits beside the Strait of Hormuz, a narrow maritime passage through which roughly 20% of global oil consumption moves. Any perceived threat to this route tends to trigger immediate price surges. Traders initially rushed to price in disruption risks during the early stage of the conflict, pushing Brent crude more than 12% higher within days. The recent pullback illustrates how quickly geopolitical risk premiums can fade when expectations shift. Political signaling now plays a powerful role in shaping those expectations.
Comments from President Trump alone were enough to drive oil prices lower while lifting equity markets. Financial markets process political messaging almost instantly, adjusting prices well before underlying realities change. Modern trading technology accelerates this dynamic. Algorithmic systems monitor headlines and geopolitical developments in real time. Capital flows across asset classes within seconds as military developments, diplomatic statements, and political rhetoric are rapidly incorporated into market pricing. This speed magnifies every shift in sentiment.
Despite the market optimism, the strategic outlook remains uncertain. Iran’s Islamic Revolutionary Guard Corps responded firmly to President Trump’s remarks, stating that the end of the war ultimately rests “in Iran’s hands.” Such statements highlight a fundamental truth: decisions in Tehran will shape the trajectory of the conflict just as much as decisions in Washington, D.C..
Another factor also deserves close attention from investors: Iran’s leadership transition. Mojtaba Khamenei now holds the role of Supreme Leader following the death of Ali Khamenei. Ultimate authority over Iran’s armed forces and the Revolutionary Guard flows through that position. Leadership changes within Iran have historically influenced strategic priorities, military posture, and diplomatic decision-making.
Global investors have little experience with Mojtaba Khamenei’s strategic outlook. His willingness to tolerate a prolonged confrontation with the United States and its allies remains uncertain. A longer conflict aimed at draining financial and military resources cannot be ruled out. For now, markets appear comfortable assuming tensions will ease. Falling oil prices and rising equities both reflect this belief. Risk assets rarely perform well when investors expect prolonged military escalation.
Yet geopolitical conflicts rarely unfold according to market expectations. Political incentives, domestic pressures, and strategic calculations often shape decisions in ways markets struggle to anticipate. Recent weeks have demonstrated how quickly global conditions can become volatile. Sudden geopolitical developments can overturn prevailing market assumptions within hours.
Investors therefore face a delicate balancing act. Markets reward forward-looking positioning, but ignoring geopolitical risks can be costly. At the same time, excessive confidence in early signals carries its own dangers.
Current market behavior suggests investors believe escalation risks will remain limited and that the conflict could cool sooner rather than later. That assumption may ultimately prove correct.
However, alternative scenarios remain possible. Military incidents, political miscalculations, or changes in leadership strategy could quickly alter the course of events, forcing markets to reassess their assumptions at speed.
Financial markets often move first and confirm later. Recent trading indicates investors are already treating the end of the Iran conflict as a likely outcome. Geopolitical developments, however, have yet to validate that expectation.
Bitcoin rebounded above the $70,000 mark during Asian trading on Tuesday as risk appetite improved after Donald Trump said the ongoing U.S.–Israel conflict with Iran could soon come to an end.
The world’s largest cryptocurrency was last up 3.4% at $70,201.3 as of 01:02 ET (05:02 GMT), after earlier rising to an intraday high of $70,558.4.
Bitcoin had briefly dropped to around $65,000 over the previous 24 hours as investors moved away from riskier assets amid a sharp surge in oil prices, which heightened concerns over global inflation.
Risk appetite improves after Donald Trump signals Iran war may soon end.
Market sentiment improved after Donald Trump said the war involving Iran could end soon, helping ease tensions in financial markets that had been unsettled by fears of a prolonged regional conflict.
Trump said the situation could ultimately be resolved, although he cautioned that it was unlikely to conclude this week. He also warned that the United States would respond “20 times harder” if Iran attempted to block the strategically critical Strait of Hormuz, a vital route for global oil shipments.
Oil prices fell to around $90 per barrel on Tuesday after surging close to $120 a barrel on Monday. The pullback helped ease worries about a sharp spike in global inflation that had weighed on markets earlier in the week.
Asian stock markets rebounded on Tuesday, with major regional benchmarks recovering part of the heavy losses recorded in the previous session after Monday’s sharp selloff. The improved mood followed gains on Wall Street overnight.
Cryptocurrency markets also moved higher in line with the broader recovery in risk appetite. Still, traders remain cautious as developments in the Middle East continue to influence commodity prices and global market sentiment.
Investors are now turning their attention to upcoming U.S. inflation data, including the January consumer price index due on Wednesday and the February personal consumption expenditures price index— the preferred inflation gauge of the Federal Reserve — scheduled for release on Thursday.
Crypto prices today: Altcoins gain as markets trade within a narrow range.
Most altcoins posted gains on Tuesday, although trading remained within relatively tight ranges.
Ethereum, the world’s No. 2 cryptocurrency, rose 1.8% to $2,046.92. XRP, ranked third by market capitalization, advanced 2.3% to $1.38.
Solana climbed 3%, while Cardano gained 1.2%. Polygon was largely unchanged. Among meme tokens, Dogecoin edged up 0.6%.
The U.S. dollar pulled back on Monday after reaching a three-month high, following remarks from Donald Trump suggesting that the conflict with Iran could soon come to an end.
The greenback had earlier strengthened on safe-haven demand as tensions escalated in the U.S.–Israel conflict with Iran, which also drove a surge in oil prices. However, the currency reversed direction and moved sharply lower after Trump’s comments raised hopes of de-escalation.
As of 17:24 ET (21:24 GMT), the U.S. Dollar Index—which measures the dollar against a basket of six major currencies—was down 0.1% at 99.557. Earlier in the session, the index had risen as much as 0.6%, briefly reaching its highest level since late November 2025 before surrendering those gains.
Dollar extends sharp gains in powerful run.
The U.S. dollar has surged in recent sessions, supported by safe-haven demand as a sharp rise in oil prices raised concerns about the outlook for global economic growth. The U.S. Dollar Index recorded its strongest weekly performance since early August 2025 on Friday.
“The Dollar Index has rallied significantly in a short period, so it may need to consolidate before attempting another move higher,” said David Morrison, senior market analyst at Trade Nation. “It tested the 100.00 level several times last year, particularly during November, but failed to break above it on each occasion.”
He added that the index would need to build substantial upward momentum to overcome that resistance. “While the U.S. dollar may have finally found a bottom, if the Dollar Index fails to break above 100.00, a retest of the January lows near 95.25 cannot be ruled out,” Morrison said.
Earlier in the day, crude prices surged to nearly $120 a barrel, approaching levels seen at the start of the Russian invasion of Ukraine. However, prices later trimmed gains and then fell sharply after Donald Trump told CBS that the war was “very complete, pretty much,” and that developments were progressing “very far” ahead of his administration’s initial four-to-five-week timeline.
Over the weekend, Israeli and U.S. airstrikes targeted Iranian oil facilities, while Tehran responded with missile strikes against several oil installations across the Middle East.
Iran also effectively shut down the Strait of Hormuz by attacking vessels passing through the shipping lane, a crucial route for oil supplies to much of Asia.
Even so, oil prices pared earlier gains on Monday after reports that the Group of Seven (G7) would discuss a potential coordinated release of emergency reserves to counter supply disruptions caused by the conflict.
Brent crude oil futures for May delivery initially surged more than 30% to a peak of $119.50 a barrel, while West Texas Intermediate crude futures jumped about 30% to an intraday high of $119.43. Both benchmarks later turned sharply lower following Trump’s comments to CBS.
Euro pressured by worries over economic growth.
In Europe, EUR/USD trimmed earlier losses to trade little changed at 1.1634. The single currency has come under pressure as rising oil prices highlight the eurozone’s reliance on imported energy, dampening expectations for economic growth in the region.
Analysts at ING Group noted that prolonged high energy prices could undermine the narrative of synchronized global growth in 2026 and weaken Europe’s efforts to catch up with the strong economic performance of the United States.
Economic data released earlier on Monday also pointed to weakness. Germany’s factory orders plunged 11.1% in January, far worse than the expected 4.2% decline and a sharp reversal from the 6.4% increase recorded in the previous month.
Meanwhile, German industrial production fell 0.5% in January after dropping 1.0% in the prior month, adding to concerns about the strength of the region’s largest economy.
Elsewhere, GBP/USD recovered slightly, edging up 0.1% to 1.3432. The British pound sterling had also been pressured earlier as surging energy costs prompted traders to shift toward the stronger U.S. dollar.
Yen stabilizes after recent volatility.
In Asia, USD/JPY fell 0.1% to 157.66, although the Japanese yen remained under pressure after heavy losses in the Nikkei 225 as surging oil prices weighed on investor sentiment.
The yen drew limited support from stronger-than-expected wage income data for January, which showed a notable increase in pay levels—a trend that could reinforce medium-term inflation expectations in Japan.
Meanwhile, USD/CNY rose 0.2% to 6.9066, moving above the 6.9 yuan level after a weaker daily midpoint fixing from the People’s Bank of China.
Government data also showed that China’s consumer price index increased 1.3% year-on-year in February, exceeding expectations of 0.9% and marking the fastest pace of inflation in three years.
The stronger reading was largely driven by higher spending during the extended Lunar New Year holiday period, when demand for travel, services, and discretionary goods rose sharply.
However, producer price index inflation remained in contraction, leaving markets looking for further evidence on whether China’s inflation trend can continue beyond the holiday-driven boost. Elsewhere, AUD/USD edged up slightly to 0.7071, while NZD/USD gained 0.6% to 0.5932.
Gold prices increased during Asian trading on Tuesday but remained within a narrow range as investors looked for clearer signals about a potential de-escalation in the U.S.–Israel conflict with Iran.
The precious metal advanced alongside a broader improvement in market risk sentiment after U.S. President Donald Trump suggested the conflict with Iran could end soon and said Washington was also considering steps to help curb the recent surge in oil prices.
Spot gold climbed 0.8% to $5,175.48 per ounce as of 01:55 ET (05:55 GMT), while gold futures gained 1.6% to $5,184.79 per ounce. Spot prices had edged slightly higher on Monday after experiencing significant volatility throughout the session.
Gold stays within the $5,000–$5,200 range as safe-haven demand remains mixed.
Gold stayed firmly within the $5,000–$5,200 per ounce range set over the past week, as traders weighed a wave of uncertainty surrounding the global economy.
Although the conflict with Iran boosted safe-haven demand for gold, gains were limited by worries that the crisis could fuel inflation, potentially prompting more hawkish policies from major central banks.
Analysts at ANZ also pointed out that gold’s strong rally this year has faced bouts of profit-taking, as investors looked to raise liquidity during a sharp selloff in global equity markets.
Other precious metals moved higher on Tuesday, with spot silver climbing nearly 6% to $89.1915 per ounce, while spot platinum gained 0.7% to $2,201.48 per ounce. In the industrial metals market, LME copper futures rose 1.3% to $13,095.30 a tonne.
Trump signals Iran tensions may ease, boosting oil supply outlook.
Risk sentiment improved on Tuesday and oil prices declined after Donald Trump said several times on Monday that the war with Iran could soon come to an end. Trump also floated potential steps to reduce supply disruptions caused by the conflict, including temporarily easing sanctions on certain oil exporters, particularly Russia.
However, he did not provide a clear timeline for any de-escalation and continued to maintain a tough stance toward Tehran. Trump warned that the Islamic Republic would face severe consequences if it attempted to block the Strait of Hormuz.
“We will strike easily destroyable targets that would make it virtually impossible for Iran to rebuild as a nation again — death, fire and fury will follow,” Trump said.
Iran dismissed Trump’s statements and reiterated that it would continue blocking the Strait of Hormuz until attacks by the United States and Israel against Tehran cease.
The conflict entered its eleventh consecutive day on Tuesday, with tensions across the Middle East showing little sign of easing. A prolonged war is expected to keep supporting gold prices, as safe-haven demand remains strong amid rising inflation risks driven by disruptions in the oil market.
European natural gas prices surged again on Monday, extending the sharp gains recorded last week as the escalating Middle East conflict continued to disrupt global energy flows and unsettle markets.
By 08:50 GMT, benchmark Dutch TTF natural gas futures had climbed 16.6% to €62.26 per megawatt-hour after earlier hitting a session high of €69.50. Meanwhile, U.S. natural gas futures rose 5.4% to $3.36 per MMBtu.
The latest rally adds to an extraordinary surge last week as traders responded to growing supply risks. Monday’s jump was triggered by the forced shutdown of Ras Laffan in Qatar — the world’s largest liquefied natural gas complex — sparking concerns over the availability of global LNG shipments. Even if hostilities were to end immediately, market participants warn that supply-chain disruptions could linger.
“European natural gas rose 67% last week, its biggest weekly gain since the 2022 energy crisis,” analysts at ANZ said. The disruption comes at a particularly vulnerable moment for Europe.
Western Europe is entering a period of relatively low gas storage levels, leaving the region more exposed to supply shocks and raising concerns about its ability to rebuild inventories ahead of the winter heating season.
Energy markets more broadly have also been shaken by the conflict. U.S. crude oil futures climbed back above $100 a barrel as investors increasingly priced in the risk of a prolonged supply shock from the Middle East.
The surge in oil and gas prices has also reverberated across financial markets, pushing global bond prices lower as investors reassess the outlook for inflation and interest rates amid rising energy costs.
The coming week is set to be tense as developments in the Middle East continue to unfold. In the nine days since the United States and Israel launched strikes on Iran, the conflict has spread across several neighboring countries.
Tehran’s actions to effectively close the Strait of Hormuz have triggered sharp jumps in oil and gas prices, forcing economic forecasters to rethink their outlook. Brent crude climbed above $100 a barrel on Monday evening. Against this backdrop, upcoming reports from OPEC and the International Energy Agency (IEA) on disruptions to Persian Gulf energy shipments could strongly influence markets. The outlook has already tightened after the United Arab Emirates and Kuwait cut oil production due to a lack of storage capacity.
Attention is now focused on whether the conflict escalates further and how it might affect inflation expectations. Investors have already started trimming forecasts for interest-rate cuts this year, including expectations surrounding the Federal Reserve’s March 17–18 policy meeting. Several Federal Open Market Committee members remain concerned about the slow progress toward bringing inflation back to the Fed’s 2% target.
In fact, minutes from the January meeting showed that several policymakers even saw the possibility that rate hikes might still be necessary.
As a result, this week’s economic releases could carry greater significance than usual for already jittery bond markets. February consumer price data due Wednesday and January PCE inflation figures on Friday will be closely watched. The PCE index — the Fed’s preferred measure of inflation — could be particularly influential, as it has remained stubbornly near 3%.
Beyond the United States, markets will also receive updates on inflation trends in China, India, Brazil, and Mexico. Meanwhile, economic indicators from the Eurozone (industrial production), Japan (GDP), Canada (trade and employment), and the United Kingdom (monthly GDP) will offer insight into how President Donald Trump’s tariffs are affecting the global economy.
The following U.S. data releases are the ones most likely to move financial markets this week, though events in the Middle East may dominate attention.
PCE Inflation
After registering 2.9% year-over-year in December, the Cleveland Fed’s Inflation Nowcasting model suggests that headline PCE inflation may cool slightly to 2.8% in January (see chart). Such a reading could offer some reassurance to the more dovish policymakers at the Federal Reserve. However, with inflation trends shifting quickly, many officials may choose to look beyond any short-term improvement.
CPI
After easing to 2.4% year over year in January, with core inflation at 2.5%, consumer prices are widely expected to remain broadly stable in February. The Federal Reserve Bank of Cleveland’s nowcasting model points to roughly a 0.2% month-over-month rise in both headline and core CPI. Still, such stability could prove temporary if stronger inflation pressures emerge in the months ahead.
Housing Data
A series of housing indicators scheduled for release this week could provide valuable clues about U.S. consumer confidence as bond yields and the broader economic outlook continue to fluctuate. Markets will be watching February existing home sales and housing affordability data on Tuesday, followed by January housing starts on Thursday, for signs of how the housing sector is coping with shifting financial conditions.
JOLTS and Jobless Claims
Recent data showing that U.S. job openings fell to their lowest level in more than five years in December aligns with other indications that the labor market may be gradually cooling. Investors will be watching the January JOLTS report on Friday for signs of any additional softening.
At the same time, weekly initial jobless claims, due Thursday, will provide another gauge of labor market conditions. Claims totaled 213,000 in the previous week, a level that still suggests a relatively stable job market with limited layoffs.
Oil prices surged about 25% on Monday, reaching their highest level since mid-2022. Brent crude was on course for its largest single-day increase on record, while gold declined by around 2%. The sharp moves came as the escalating war involving Iran tightened global energy supplies, strengthened the U.S. dollar, and reduced expectations that interest rates will be cut soon.
Agricultural markets also moved higher, particularly edible oils, which tend to follow crude oil prices because vegetable oils are widely used in biofuel production. Aluminium prices edged higher due to supply concerns, although other industrial metals struggled under pressure from the stronger U.S. dollar.
According to IG market analyst Tony Sycamore, the intense market reaction reflects the lack of any clear path to de-escalation in the Middle East conflict. He noted that the situation has turned into a high-stakes standoff where neither side appears ready to back down, increasing the risk of lasting economic damage. Meanwhile, Iran announced that Mojtaba Khamenei will succeed his father Ali Khamenei as Supreme Leader, signaling that hardline leadership remains firmly in control in Tehran during the ongoing conflict with the United States and Israel.
Oil rally pushes agricultural markets higher
Brent crude appeared set to record its largest single-day gain both in percentage and absolute terms. The surge was driven by the widening U.S.–Israeli conflict with Iran, which prompted some major Middle Eastern producers to reduce supply and raised fears of prolonged disruptions to shipping through the Strait of Hormuz, a critical global oil chokepoint.
During the session, Brent crude futures climbed to about $119.50 per barrel, while U.S. West Texas Intermediate (WTI) reached roughly $119.48 per barrel.
Analysts at ING Group said in a note that conditions appear to be worsening further. They added that upstream oil production has begun to shut down as producers face limited storage capacity. As a result, Iraq, Kuwait, and the UAE have started cutting their oil output. In agricultural markets, Malaysian palm oil prices jumped about 9%, while Chicago soybean oil climbed to its highest level since late 2022, supported by the strong rally in crude oil. Wheat prices reached their highest point since June 2024, and corn rose to a 10-month high.
Meanwhile, gold dropped more than 2% as a stronger U.S. dollar put pressure on dollar-denominated bullion. Rising energy costs also increased inflation concerns and further reduced expectations that interest rates will be lowered in the near term.
The U.S. dollar remained close to a three-month high, which made gold more expensive for buyers using other currencies. Concerns that higher oil prices could drive inflation and delay rate cuts appear to have pushed U.S. bond yields and the dollar higher, offsetting gold’s usual safe-haven demand and sending prices lower.
Aluminium surges on supply concerns
Aluminium prices surged to their highest level in four years as supply worries intensified amid the Middle East conflict. Benchmark three-month aluminium contracts on the London Metal Exchange rose to about $3,544 per ton, the highest level since March 2022.
Two major Gulf producers—Qatalum and Aluminium Bahrain—have already declared force majeure on shipments as tensions in the region escalate. However, other base metals faced downward pressure due to the strengthening U.S. dollar.
Silver faced a difficult week as the U.S. dollar strengthened for much of the period, though it’s important to remember that its recent collapse wiped out many retail trading accounts.
That said, this is a market worth monitoring closely because the $80 level represents an important support area and sits near the center of the broader consolidation range.
If the price breaks below this week’s candlestick, it could open the door for silver to decline toward the $70 level, where I also expect support to emerge.
Overall, the market has been quite volatile and choppy, and that pattern is likely to persist. Because of this, careful position sizing will be essential.
S&P 500
The S&P market declined quite sharply over the week, testing the 5,000 level. This level is a major round number with strong psychological importance, so it’s an area many investors are watching closely.
If the market breaks below 5,000, it could pave the way for a drop toward 4,800, with the possibility of quickly moving further down to around 4,600.
From a longer-term perspective, the 5,000 level may continue to act as a price magnet for the market.
If that remains the case, we could see extended sideways movement around this zone, although my broader outlook still leans bullish over the long run.
USD/CAD
The US dollar first strengthened against the Canadian dollar, rising to test the 1.3750 level, but then reversed and began showing signs of weakness. Meanwhile, the 1.35 level below stands as an important support area that many market participants are closely monitoring.
It is also worth noting that the Canadian dollar has been gaining some strength on the back of rising oil prices. Whether that trend will continue is uncertain, but if oil fails to maintain its momentum, a reversal could follow.
For now, the market remains within the same consolidation range that it has revisited repeatedly.
USD/MXN
The US dollar surged sharply against the Mexican peso during the week, but in reality a pullback had been due. The key question now is whether the 18-peso level will act as strong enough resistance to reverse the move.
If it does, it could present a solid opportunity to take short positions. However, if the market manages a daily close above the 18-peso level, it may signal that the recent trend is coming to an end.
All things considered, this is a market where traders may look for signs of exhaustion to sell into, as the interest rate differential still generally favors Mexico.
Bitcoin
The Bitcoin market has been quite volatile during the week, but it did manage to break above the $72,000 level. This is notable given the overwhelmingly negative headlines around the world at the moment, and it’s a market I’ll be monitoring very closely.
If the market can close above the weekly high and continue moving higher, Bitcoin could begin to rally strongly. There may still be debate about what Bitcoin truly represents, but one thing seems clear—it appears to be heavily oversold.
The key question now is whether buyers will step back in. On the other hand, if the price drops below the $60,000 level, it could trigger a sharp and widespread sell-off.
Nasdaq 100
The Nasdaq 100 has been volatile but has continued to show resilience. This is a pattern that appears repeatedly in the US stock market, even when there have been plenty of reasons for it to break down. In itself, that persistence likely says a lot about the underlying strength of the market.
What I think it tells you is that given enough time, the US stock market, and in this case the Nasdaq 100, will find buyers on any pullback and selling just does not seem to be working out.
EUR/USD
The euro weakened significantly during the week. Much of this appears to be driven by expectations that energy costs in the European Union will rise sharply, which could heavily influence the options available to the European Central Bank.
Keep a close eye on the 1.15 level. If the market breaks below that point, the euro could decline sharply.
For now, the market remains within the same consolidation range it has been trading in for some time. I do not expect significant movement at the moment, but the 1.15 level will be important to watch.
USD/JPY
The US dollar continues to signal the possibility of a major breakout against the Japanese yen, although it has not achieved it yet. The ¥158 level marks the start of a strong resistance zone that extends up to the ¥160 level.
If the market manages to break above that area, it is likely to move significantly higher. In the short term, pullbacks could present buying opportunities as traders look to pick up the dollar at lower prices.
Over the longer term, I expect an eventual breakout to the upside. However, the current situation makes it challenging to short the market, while buying directly at this resistance zone is also difficult. It may be best to wait for better value and take advantage of opportunities when they appear.
Since the pandemic, the distinction between passive investing and outright speculation has increasingly blurred. The current surge in speculative behavior extends well beyond traditional financial markets. A similar mindset can be seen in the rapid growth of Sports betting industry as well as the rising popularity of event-prediction platforms such as Kalshiand Polymarket.
Within financial markets, signs of heightened risk-taking are evident. Margin debt has climbed to record levels, while zero-day-to-expiry options (0DTE) now represent roughly half of total options trading volume. At the same time, the number of leveraged exchange-traded funds (ETFs) and their trading activity have expanded significantly.
As highlighted by The Kobeissi Letter, the technology sector has become the primary focus of this trend. There are currently 108 long and 31 short leveraged ETFs tied to technology stocks, bringing the total to 139 funds. That figure is three times larger than the next-largest sector, financials, which has 47 leveraged ETFs. For comparison, consumer discretionary has 44, and communication services has 34. In other words, the technology sector alone now hosts more leveraged ETFs than the next three sectors combined.
Although it is harder to measure than indicators like margin debt or sports wagering, aggressive speculation is increasingly visible within so-called passive investment vehicles. One clear example is the rapid and often intense rotations occurring between sector and factor exchange-traded funds (ETFs).
In this article, we examine how today’s speculative environment is influencing trading behavior within passive ETFs. We also explore methods for identifying sector and factor rotations and discuss how investors may be able to take advantage of these shifts—effectively turning the increasingly aggressive behavior of passive investors into potential opportunities.
Passive Investment Strategy Timeline
The intellectual foundation for passive investing dates back to Harry Markowitz, who introduced Modern Portfolio Theory in 1952. His research demonstrated that diversification across a broad market portfolio could maximize expected returns for a given level of risk. Markowitz’s work ultimately laid the groundwork for what would later become known as index investing, the core principle behind many passive investment strategies today.
John C. Bogle is widely regarded as the “father of indexing.” In 1976, he introduced the First Index Investment Trustat Vanguard Group, a fund designed to track the S&P 500. It became the first index mutual fund accessible to retail investors. At the time, competitors ridiculed the concept, referring to it as “Bogle’s Folly.” Decades later, Vanguard oversees more than $12 trillion in assets, demonstrating the success of Bogle’s low-cost, long-term passive investing philosophy. Ironically, Bogle also cautioned that the intraday liquidity of exchange-traded funds might encourage the kind of frequent trading behavior he spent his career advising investors to avoid.
In 1993, the SPDR S&P 500 ETF Trust became the first exchange-traded fund available to U.S. investors, allowing them to trade a passive index product throughout the day just like a stock.
Passive investment strategies were originally designed to promote discipline and long-term thinking. Rather than attempting to outperform the market by actively trading individual securities, passive approaches aim to replicate overall market performance through broad diversification.
Bogle’s Warning
Despite the strong long-term rationale behind passive investing, investor behavior has evolved in ways Bogle anticipated. ETFs, with their ease of trading and intraday liquidity, have encouraged some passive investors to adopt more active strategies.
In recent years, sharp performance differences have emerged across broad-market indexes, sector ETFs, and factor-based ETFs. Instead of simply buying a diversified market ETF and holding it over time, many investors now frequently rotate between products tracking major indexes like the S&P 500, Nasdaq Composite, and Dow Jones Industrial Average, as well as sector-focused funds (such as technology, consumer staples, or financials) and factor strategies (including momentum, value, or market-cap tilts).
Another clear example of speculative behavior within the passive universe is the growing popularity of leveraged ETFs. These funds reset their exposure on a daily basis, which can gradually erode returns over time and makes them better suited for short-term trading rather than long-term investing. This effect, known as Volatility Decay, is significant enough that regulators require warnings in leveraged ETF prospectuses. As stated in the prospectus for Direxion ETFs:
“If a Fund’s shares are held for a period other than a calendar month, the Fund’s performance is likely to deviate from the multiple of the underlying exchange-traded fund performance for the period the Fund is held. This deviation will increase with higher underlying volatility and longer holding periods.”
The rapid growth in leveraged ETF products and trading volume—mentioned earlier—reflects the increasing presence of short-term speculation within instruments originally designed for passive investing.
Another sign of this trend is the sharp rise in thematic ETFs. Funds centered on popular narratives—such as Artificial Intelligence, clean energy, or precious metals—often attract substantial inflows when investor enthusiasm is strong. When the narrative loses momentum, however, those same funds can experience rapid outflows. In many cases, this behavior resembles momentum chasing wrapped in the appearance of passive investing.
In fact, many investors who consider themselves passive might find—if they reviewed their transaction history closely—that their activity resembles active trading far more than traditional buy-and-hold investing.
Rotation Analysis
Recognizing that investors are aggressively rotating across sectors and factors using passive instruments is only the first step. The real challenge is identifying how to profit from these movements. One approach is technical analysis, which can help detect when rotations begin, gain momentum, stall, or reverse.
We first explored this concept in detail in our 2023 article, Relative Rotation – Unlocking the Hidden Potential. One of the most compelling illustrations from that research compares the relative performance of Vanguard High Dividend Yield ETF and Vanguard Mega Cap Growth ETF against the SPDR S&P 500 ETF Trust. The chart demonstrates a recurring pattern: when one ETF begins to outperform the broader market, the other often underperforms. This dynamic creates a rotation effect that, when identified early through technical analysis, may provide trading opportunities.
The more aggressively passive investors rotate between sectors and factors, the more consistent and exploitable these technical patterns can become.
Narrative Analysis
While technical analysis can signal when a rotation is beginning or gaining momentum, narrative analysis helps explain why investors are moving capital. Understanding the narrative behind a trade allows investors to determine whether the underlying story is supported by fundamentals or driven primarily by speculation.
In today’s market—where passive instruments are frequently traded in an aggressive, short-term manner—narratives spread quickly and can have a powerful impact. A compelling theme can generate billions of dollars in ETF inflows within days, often well before the fundamentals justify the move, if they ever do.
However, not all market narratives carry the same weight. Some sector or factor rotations are triggered by genuine shifts in economic conditions or changes in monetary policy. These developments tend to produce more durable trends. Others arise largely from momentum and media attention. In such cases, a popular theme gains traction, investors pour money into ETFs aligned with that story, and the momentum feeds on itself until enthusiasm fades.
Distinguishing between these two types of narratives is just as important as identifying the rotation itself. A strong technical signal paired with a weak fundamental story may produce only a short-lived opportunity.
Summary
One of the great ironies of modern passive investing is that instruments originally designed to encourage patience and long-term discipline have increasingly become vehicles for short-term speculation. Many investors who consider themselves passive are, in practice, behaving much like active traders—rapidly rotating between sectors and factors based on evolving narratives.
Recognizing this dynamic is the first step toward maintaining stronger investment discipline. Through our blog posts, daily commentary, podcasts, and the weekly Bull Bear Report, we aim to help investors distinguish meaningful signals from the noise created by constantly shifting market narratives.
The idea that “fiat is dying” has become a popular slogan among supporters of digital assets, gold enthusiasts, and cryptocurrency advocates. At the center of this argument is the belief that central banks have created enormous amounts of money, leading to currency debasement and ultimately making the U.S. dollar obsolete. We have addressed this debasement narrative before.
It’s an appealing storyline: inflation is spiraling, governments keep printing money, and the dollar is supposedly nearing its end. While there are legitimate risks to monitor, many headlines emphasize fear more than facts. The message can be powerful, especially when promoters of gold, silver, or other “doomsday” assets use it to push people into acting quickly. A commonly cited piece of evidence in this debasement argument is the familiar chart claiming the U.S. dollar has lost about 90% of its purchasing power since 1966.
But here’s the key point: that chart doesn’t actually demonstrate currency debasement. It simply reflects inflation—an expected and well-understood feature of a growing economy. Prices tend to rise over time as demand increases, driven by population growth, higher incomes, and expanding consumption. This dynamic is particularly evident in a modern, service-based economy that encourages credit expansion and capital investment. In that sense, it’s not so much that the dollar is losing value, but rather that the economy itself is growing.
Those who promote the “debasement” argument often overlook how modern inflation and economic systems function. What the chart really illustrates is the declining purchasing power of idle cash. Money that remains uninvested naturally loses value over time relative to inflation. That doesn’t signal the collapse of fiat currency—it simply highlights the importance of putting capital to work.
While gold advocates frequently argue that gold protects against debasement (in other words, inflation)—which can be true—other assets can serve the same purpose. Short-term U.S. Treasury bills and longer-term Treasury bonds have also preserved value on a real, inflation-adjusted total-return basis. Still, historically, a single dollar invested in the S&P 500 has been the most effective way to maintain—and significantly grow—the purchasing power of the U.S. dollar.
Most importantly, the term “debasement” does not mean a currency is collapsing. Rather, it reflects the impact of inflation on money that remains uninvested. Inflation gradually reduces purchasing power when income and investment returns fail to keep up. For example, a $100 bill today buys less than it did in 2010 because the overall price level of goods and services tends to rise as the economy expands. While this effect is real, it is a normal outcome of economic growth and monetary policy working together—not evidence of a fundamental loss of confidence in the currency.
In reality, the U.S. dollar continues to hold a dominant position in the global financial system. As discussed in “The Dollar’s Death Is Greatly Exaggerated,” several key facts highlight this strength:
Around 80% of global transactions are still conducted using the U.S. dollar as the primary unit of account or settlement currency.
The dollar represents nearly 60% of the world’s foreign-exchange reserves held by central banks.
No other currency or asset currently offers the same depth, liquidity, and institutional credibility as the U.S. dollar.
These facts challenge the claim that the world is turning away from fiat currencies or the U.S. dollar. The idea that the dollar is in decline overlooks strong evidence of its ongoing global demand and widespread use—reflected in the record surge of foreign purchases of U.S. Treasuries.
The Illusion of Escape
Those who claim that investors are turning to gold or Bitcoin based on the “currency debasement” narrative either deliberately mislead others or lack a proper understanding of how the modern monetary system works—particularly how pricing, exchange, and settlement function within today’s economy.
We fully agree that investors should put their “idle” dollars to work in assets such as bonds, gold, stocks, or Bitcoin to help preserve purchasing power over time. However, when these assets rise in nominal terms, the gains mostly reflect shifts in relative valuations rather than a true rejection of the dollar. Many investors, influenced more by headlines than by underlying facts, buy gold or Bitcoin as perceived “safe havens,” believing they are moving away from fiat currency due to fears of debasement.
In reality, that isn’t the case. These assets are still priced and settled in dollars. Bitcoin commonly trades in USD pairs, and the global price of gold is quoted in dollars. When investors want to spend or use those holdings outside the digital-asset ecosystem, they typically convert them back into the dollar-based system. The notion of fully escaping fiat currency is largely philosophical; in practice, value transfer and financial utility still revolve around the dollar. Historically, the most effective way to protect purchasing power from debasement has been participation in the U.S. stock market.
Although the debasement narrative often portrays U.S. Treasuries as outdated remnants of a failing system, the reality is quite the opposite. U.S. Treasuries remain the most liquid and trusted financial instruments in the world, forming the backbone of global interest-rate benchmarks, risk-free rate calculations, collateral markets, and international reserves.
Moreover, a new development in the modern financial system may strengthen the dollar’s influence even further: the rapid growth of USD-denominated stablecoins.
USD Stablecoins and Why They Matter
As discussed, the U.S. dollar remains—and is likely to remain—the backbone of the global financial system. This dominance is unlikely to change in either the near or distant future, largely because no credible alternative currently exists. If anything, the rapid rise of USD-denominated stablecoins may reinforce that position even further.
Today, nearly 99% of fiat-backed stablecoins are pegged to the U.S. dollar. This mirrors the dollar’s dominance in global foreign-exchange reserves, where its share still exceeds that of all other major currencies combined. Despite periodic concerns about inflation or monetary debasement, global confidence in the dollar remains strong. In fact, the growth of USD stablecoins reflects the dollar’s strength rather than signaling its decline.
But what exactly are USD stablecoins? They are digital tokens designed to maintain a 1:1 value with the U.S. dollar. Unlike volatile cryptocurrencies such as Bitcoin or Ethereum, whose prices can fluctuate dramatically, stablecoins aim to provide price stability by backing their tokens with reserves of highly liquid assets.
Two of the largest examples are Tether (USDT) and USD Coin (USDC), which together account for more than 90% of the USD-stablecoin market. By late 2025, the company behind USDT—Tether Holdings—held over $135 billion in U.S. Treasury securities. That level of holdings would rank it roughly 17th among global holders of U.S. sovereign debt, exceeding the Treasury holdings of several countries, including South Korea, Saudi Arabia, Germany, and the United Arab Emirates.
This development is particularly important when examining claims about the “death of the dollar.” USD stablecoins function on blockchain networks, allowing digital dollars to be transferred and settled globally in real time without relying on traditional banking intermediaries. This feature makes them especially useful for cross-border payments, remittances, and financial activity in regions where banking infrastructure is limited or less developed.
The International Monetary Fund has noted that while most stablecoin transactions today are still linked to cryptocurrency trading, cross-border usage is expanding quickly, indicating that these digital dollars could play a larger role in the global financial system in the future. As highlighted by Chainstack, …
“Stablecoins have entered mainstream finance, creating a bridge between traditional banking systems and digital asset networks. Dollar-pegged tokens already process transaction volumes comparable to major payment networks, with activity rivaling systems such as ACH, Visa, and PayPal. By mid-2025, the total supply of stablecoins had surpassed $250 billion, highlighting growing demand for faster, always-available payment solutions.”
Although stablecoin transaction activity still represents a very small share—roughly 1% of the global cross-border payments market, which totals around $2 quadrillion annually—there are several factors that lead many analysts to expect significant expansion in the USD stablecoin sector in the years ahead.
These applications align with the ongoing modernization of global payment systems. If USD stablecoins achieve wider adoption, they could evolve into a key layer of infrastructure for digital money movement, which would, in turn, increase the importance of U.S. Treasuries within the global financial system.
How USD Stablecoins Could Increase the Importance of U.S. Treasuries
USD stablecoin reserves often include these assets, highlighting that digital dollar infrastructure is closely linked to U.S. sovereign debt markets rather than operating independently from them. As the stablecoin market continues to expand, its connection to U.S. Treasuries may grow even stronger. Issuers must hold liquid, low-risk assets to preserve their dollar pegs and satisfy both regulatory standards and market expectations. Short-term U.S. Treasuries are a natural fit because they are highly liquid and widely accepted as collateral.
Regulatory developments further reinforce this relationship. For example, the GENIUS Act, passed in 2025, requires stablecoin issuers to back their tokens with high-quality liquid assets such as U.S. dollars or short-term Treasury securities. This requirement increases the likelihood that stablecoin reserves remain closely tied to U.S. government debt. Additionally, if the STABLE Act is enacted, it would impose further rules obligating issuers to maintain safe and highly liquid assets as backing for their tokens.
Industry forecasts suggest that the USD stablecoin market could expand to $2–$3 trillion by 2030, supported by clearer regulatory frameworks and broader financial adoption. If this scenario materializes, stablecoin issuers could become a meaningful source of demand for U.S. Treasuries. Their reserves would likely position them as incremental buyers in money markets, potentially reinforcing traditional sources of Treasury demand. According to Reuters, as much as 80% of current stablecoin reserves are already held in Treasury bills and repurchase agreements, indicating that reserve management is already heavily oriented toward Treasuries.
Academic research also indicates that stablecoin demand may already be influencing short-term interest rates. One study found that stablecoin purchases of Treasury bills were associated with noticeable downward pressure on one-month yields, suggesting that reserve demand tied to digital dollars can have tangible effects on real financial markets.
That said, any discussion of USD stablecoins must also acknowledge the risks involved. Much of this outlook assumes that stablecoins will evolve into a widely used global transaction tool. While possible, that outcome is far from guaranteed. At present, most stablecoin activity remains concentrated in cryptocurrency trading and settlement, rather than everyday commerce or sovereign-level payments. Future adoption will largely depend on regulatory clarity, institutional participation, and sustained global confidence.
Custodial and transparency risks also remain important considerations. S&P Global Ratings recently downgraded the stability assessment of Tether, citing that only 64% of its reserves were held in short-term U.S. Treasuries and highlighting ongoing concerns around transparency. This emphasizes the need for stronger reporting standards, improved governance, and more regulated custody arrangements if stablecoins are to scale safely.
As S&P Global Ratings noted:
“Bitcoin represents 5.6% of USDT in circulation, exceeding the 3.9% overcollateralization marginassociated with a collateralization ratio of 103.9%. A decline in the price of bitcoin or other higher-risk assets could therefore reduce collateral coverage.”
Another potential challenge comes from the rise of central bank digital currencies, or Central Bank Digital Currency. Governments may prefer to develop their own digital payment infrastructure, which could limit the role of privately issued USD stablecoins in some applications. Even so, if CBDCs gain widespread adoption, they would likely still rely on reserves backed by U.S. Treasuries, given their liquidity, safety, and central role in the global financial system.
Another consideration is that stronger demand for Treasuries could push yields lower. In response, stablecoin issuers might adjust how they structure their reserves. However, the key point is that these reserves would still consist of dollar-linked instruments. Whether issuers hold Treasury bills, repurchase agreements, or other short-term dollar assets, the peg remains tied to the U.S. dollar. As a result, the system continues to function within the existing dollar-based monetary framework rather than creating an entirely separate financial ecosystem.
Finally, it is important to recognize the possibility that these developments may not occur at the projected scale. Regulatory obstacles, technological limitations, or changes in macroeconomic conditions could slow or even halt the growth of stablecoins. While the future is uncertain, the evolving structure of USD stablecoins and the broader pace of financial technology innovation suggest that global payment systems are likely to change in the coming years—and that the United States Dollar will remain central to that transformation.
Conclusion and Investment Thesis
The claim that “fiat money is dying” is not supported by current data or economic reality. While inflation does erode purchasing power, it should not be confused with the type of currency debasement seen historically. Instead, it reflects the gradual loss of value in idle cash within a growing and expanding economy.
The United States Dollar continues to serve as the backbone of the global financial system. It dominates international trade, central-bank reserves, and cross-border settlements. At present, no alternative currency, asset, or financial structure offers the same level of liquidity, institutional credibility, or market depth as the dollar.
The belief that investors can fully escape fiat currencies by moving into assets like Gold or Bitcoin reflects a misunderstanding of how the modern monetary system operates. While these assets can serve as hedges against inflation, they still function within the broader fiat framework. Their pricing, settlement, and liquidity are deeply tied to the United States Dollar, meaning the idea of completely “escaping” fiat is more ideological than practical.
What appears to be unfolding is not the decline of the dollar but a reconfiguration of its infrastructure—a form of monetary “rebasement” driven by digital technology. USD stablecoins are not undermining the U.S. monetary system; they are extending it. By enabling near-instant digital payments on blockchain networks while holding reserves in U.S. Treasuries and cash equivalents, stablecoins effectively reinforce the dollar’s global dominance.
If USD stablecoins evolve into a widely used transactional layer—an outcome that remains a forward-looking assumption—the demand for Treasuries could rise substantially. With industry projections placing the stablecoin market at $2–$3 trillion by 2030, issuers could become meaningful buyers of Treasury securities. Such demand could deepen liquidity in money markets, help maintain lower yields, and further integrate Treasuries into the operational backbone of global finance.
At the same time, investors should remain aware of the risks. The widespread adoption of stablecoins is far from guaranteed. Regulatory frameworks could slow development, transparency and custody concerns persist with some issuers, and Central Bank Digital Currency initiatives could create competing payment systems. If stablecoins fail to expand beyond crypto-trading and settlement use cases, their broader economic impact may remain limited.
Even with those uncertainties, the broader investment thesis remains compelling:
U.S. Treasuries continue to be a foundational global asset. Demand from both traditional institutional buyers and digital-dollar issuers reinforces their central role in financial markets.
The growing USD stablecoin ecosystem may create opportunities for companies involved in custody, liquidity provision, and compliant digital payment infrastructure, including firms such as Circle Internet Financial, Coinbase, PayPal, Fiserv, Visa, and Mastercard.
Financial institutions and fintech platforms operating at the intersection of blockchain settlement and regulatory compliance may also play a key role in this emerging architecture, including JPMorgan Chase, Bank of New York Mellon, Citigroup, Block Inc., and Stripe Inc..
The United States Dollar is not fading away—it is adapting and transforming. In many ways, USD stablecoins could act as the bridge between the traditional financial system and the emerging digital economy. As regulatory frameworks and financial technology continue to develop, these digital dollars are increasingly supported by the credibility of U.S. sovereign credit.
For investors prepared to position themselves for this shift, the opportunity lies in recognizing how the dollar’s role is evolving. The story is not about the collapse of the dollar system, but about the digitization and expansion of dollar dominance in the next era of global finance.
So far, the economic impact of the war involving Iran has been limited for the United States. However, if the conflict continues, its consequences are expected to become more visible over time. The primary concerns are slower economic growth and rising inflation, largely due to higher energy prices. Although it is still too early to accurately gauge the full impact, the economic cost is likely to increase as the war—now approaching its first week—continues.
Because economic indicators are released with delays, the effects may not immediately appear in official data. For example, even if the conflict lasts through the end of March, its influence may be difficult to detect in the upcoming first-quarter GDP report.
The Federal Reserve Bank of Atlanta projected on March 2 that U.S. first-quarter GDP could grow by about 3.0%, representing a strong recovery from the 1.4% growth recorded in the fourth quarter. While this estimate may change before the official April 30 release, the war’s effect may remain limited since the conflict began near the end of the quarter.
Recent February data also suggests the U.S. economy remains resilient. According to ADP, private employers added 63,000 jobs, the largest monthly increase since July. At the same time, the Institute for Supply Management reported that its Services Index climbed to the strongest expansion reading in nearly four years.
The outlook for the second quarter appears more uncertain. Officials from both the U.S. and Israel have indicated the war could last several weeks, which could amplify inflation pressures and slow economic momentum. Although the full scale of these effects remains unclear, financial markets have already begun to reflect a more cautious outlook compared with expectations before the conflict began.
One noticeable shift involves expectations for monetary policy. Interest rate cuts that investors previously anticipated for June are now considered unlikely. Current market pricing suggests that September is the earliest point when a rate reduction may occur.
Earlier this week, Beth Hammack, president of the Federal Reserve Bank of Cleveland, advocated for maintaining interest rates at current levels for an extended period. She noted that economic activity appears to be strengthening in the first quarter, and uncertainty about inflation linked to the war further supports the case for holding policy steady. She emphasized the need for clearer evidence that inflation is moving toward the central bank’s target before considering rate cuts.
Meanwhile, U.S. Treasury yields have stayed relatively stable since the conflict began, remaining within the range seen in recent months. However, markets are increasingly pricing in the possibility of higher inflation. The 2-year Treasury yield, which is highly sensitive to monetary policy expectations, has risen each day this week, reaching 3.59% on Thursday.
Bond yields are likely to keep rising until there are clear indications that the war is easing, even if it has not fully ended. At the moment, however, the outlook suggests the conflict could intensify in the near term rather than subside.
According to a report from the Financial Times this morning, Qatar—the world’s second-largest exporter of liquefied natural gas—warned that the war could halt energy shipments from the Persian Gulf “within days.”
Saad al-Kaabi, Qatar’s energy minister, cautioned that such a scenario could have severe global consequences. He suggested that a prolonged conflict lasting several weeks would weigh on worldwide GDP growth. Energy prices would surge across countries, supply shortages could emerge, and disruptions in production chains might occur as factories struggle to obtain necessary inputs.
Is this an exaggeration? Possibly. Yet with each passing day that the war continues and pressure on Gulf energy infrastructure grows, it becomes increasingly difficult to argue that the economic fallout will remain limited.
U.S. crude oil futures surged on Friday as the widening U.S.–Israeli conflict with Iran disrupted global oil supply expectations.
Brent crude settled at $92.69 per barrel, rising $7.28 or 8.5%, while West Texas Intermediate (WTI) climbed $9.89, or 12.2%, to close at $90.90 per barrel.
On a weekly basis, WTI jumped 35.6% and Brent gained about 27%, marking their strongest weekly advances since the early stages of the COVID-19 pandemic in spring 2020.
For the second straight day, U.S. crude futures outperformed Brent as refiners around the world rushed to secure alternative oil supplies to offset potential disruptions from the Middle East.
According to UBS analyst Giovanni Staunovo, refiners and trading firms are actively seeking substitute barrels, with the United States — the world’s largest oil producer — emerging as a key supplier.
Janiv Shah, vice president of oil analytics at Rystad Energy, noted that several factors contributed to the wider gains in WTI compared with Brent. Strong refinery activity supported by attractive refining margins, along with favorable arbitrage opportunities for shipments to Europe, helped drive demand for U.S. crude.
Could oil exceed $100?
Qatar’s energy minister warned in an interview with the Financial Times that Gulf energy producers might halt exports within weeks if the conflict escalates further. Such a move, he suggested, could push oil prices as high as $150 per barrel.
John Kilduff, partner at Again Capital, said the situation is increasingly alarming. “The worst-case scenario is unfolding right in front of us,” Kilduff said, adding that forecasts of oil reaching $100 per barrel now appear increasingly realistic.
Oil prices began their sharp rally after the United States and Israel carried out strikes on Iran last Saturday, which prompted Iran to halt tanker traffic through the Strait of Hormuz.
Around 20% of the world’s daily oil supply normally passes through this key shipping route. With the strait effectively closed for seven days, roughly 140 million barrels of crude — equivalent to about 1.4 days of global demand — have been prevented from reaching international markets.
The conflict has expanded across major energy-producing regions in the Middle East, disrupting production and forcing several refineries and liquefied natural gas facilities to shut down.
UBS analyst Giovanni Staunovo said oil prices are likely to continue rising for as long as the strait remains closed. He noted that markets previously believed U.S. President Donald Trump might eventually scale back the conflict to avoid higher oil prices, but the longer the situation persists, the greater the perceived supply risk becomes.
In an interview with Reuters on Thursday, Trump said he was not worried about rising gasoline prices in the United States linked to the conflict, commenting that “if they rise, they rise.”
Earlier on Friday, oil prices briefly dropped by more than 1% after speculation that the U.S. Treasury Department might take steps to counter the surge in energy costs.
On Thursday, the Treasury issued waivers allowing companies to purchase sanctioned Russian oil. The first approvals were granted to Indian refiners, which have since bought millions of barrels of Russian crude.
The U.S. dollar weakened on Friday after a disappointing jobs report increased expectations that the Federal Reserve could cut interest rates. Nevertheless, the currency was still on track for a strong weekly gain, supported by rising demand for safe-haven assets amid escalating tensions in the Middle East.
By 16:30 ET (21:30 GMT), the Dollar Index — which measures the dollar against six major currencies — had fallen 0.4% to 98.89. Despite the decline, it remained poised for a weekly rise of about 1.3%, its strongest performance since August 2025.
Dollar pressured by weak payroll data
Markets focused on the February nonfarm payrolls report released Friday. The data showed the U.S. economy lost 92,000 jobs last month, far below economists’ expectations for a gain of 58,000. At the same time, the unemployment rate increased slightly to 4.4%.
The weak February figure followed a stronger January reading of 126,000 jobs, revised down from 130,000. December’s employment data was also revised lower, shifting from a gain of 48,000 to a loss of 17,000 jobs.
Following the report, traders increased their expectations that the Federal Reserve may cut interest rates. Since higher rates typically support the dollar while lower rates weaken it, the data weighed on the currency.
However, despite Friday’s pullback, the dollar benefited throughout the week from its safe-haven status as geopolitical tensions intensified in the Middle East.
U.S. Defense Secretary Pete Hegseth said Thursday that U.S. firepower directed toward Iran could increase significantly. Meanwhile, Israel announced earlier Friday that it had begun a large-scale wave of strikes targeting infrastructure in Tehran.
Iran retaliated by launching attacks against Israel and several regional countries including Gulf states, Cyprus, Turkey, and Azerbaijan, expanding the scope of the conflict.
Analysts at ING said the dollar is unlikely to resume a sustained decline unless a meaningful political breakthrough leads to a ceasefire. Until then, governments will likely continue grappling with the economic consequences of elevated energy prices. The Dollar Index is now approaching the key psychological level of 100.
According to Trade Nation senior market analyst David Morrison, the 100 level represents an important technical resistance point. The index repeatedly tested this level in November but failed to break through before eventually falling to a four-year low at the end of January.
At that time, some traders speculated the dollar’s decline could continue amid concerns it might eventually lose its role as the world’s primary reserve currency. Morrison said those predictions now appear premature, although the Dollar Index still faces several significant resistance levels.
Euro heads for weekly decline
In Europe, EUR/USD was mostly unchanged at 1.1611, though the euro was on track to lose about 1.7% for the week as higher energy costs weighed on economic growth prospects in the region.
Eurozone GDP data due later in the session is expected to confirm growth of 0.3% in the final quarter of last year and annual expansion of 1.3%.
Earlier data also showed eurozone inflation in February came in higher than expected, even before the outbreak of the Iran conflict.
Despite the geopolitical developments, European Central Bank policymaker and Dutch central bank chief Olaf Sleijpen said the eurozone’s monetary policy environment remains relatively stable.
Speaking in an interview Friday, he noted that while the situation is no longer ideal, he has not significantly changed his overall assessment of the region’s economic position.
Meanwhile, GBP/USD rose 0.3% to 1.3393, although sterling was still on track for a weekly decline of around 0.8% as rising energy prices add further pressure on the U.K. economy and government.
Yen weakens amid rising oil prices
In Asia, USD/JPY increased 0.2% to 157.83 and was on track for a weekly gain of 1.1%. The Japanese yen remained under pressure as higher oil prices raise inflation risks for energy-importing economies such as Japan.
Bank of Japan Deputy Governor Ryozo Himino told parliament that the weaker yen is pushing up import costs and could influence underlying inflation.
USD/CNY rose 0.1% to 6.8965 and was also heading for weekly gains, following a week in which Chinese authorities announced their lowest economic growth target since 1991.
Meanwhile, AUD/USD climbed 0.3% to 0.7026, though the Australian dollar was still set for a weekly loss of about 1.3%, as risk-sensitive currencies remained under pressure.
U.S. President Donald Trump told Reuters on Thursday that the United States should play a role in determining Iran’s next leader, adding that it would be “great” if Iranian Kurdish fighters based in Iraq crossed into Iran to attack government security forces.
In a phone interview, Trump said he believes the successor to the late Ali Khamenei is unlikely to be Khamenei’s son, Mojtaba Khamenei, who had been considered a leading candidate after his father was killed in a military strike at the beginning of the war.
“We’ll need to select that individual together with Iran,” Trump said, emphasizing that Washington must be involved in the decision.
The president also voiced support for Iranian Kurdish forces launching attacks against Iranian security forces. His comments came six days after the United States and Israel began strikes on Iran, a conflict that has killed more than 1,000 people—including at least six U.S. service members—and destabilized the wider Middle East.
“I think it would be great if they did that—I fully support it,” Trump said regarding Kurdish fighters.
Discussing Iran’s leadership transition, Trump compared the situation to Venezuela, where U.S. intervention removed Nicolás Maduro earlier in the year, leaving his deputy Delcy Rodríguez in power—a development Trump praised.
Trump said the United States wants to help shape Iran’s future leadership so the country does not repeatedly return to conflict every few years. He added that Washington hopes a new leader would benefit both the Iranian people and the nation as a whole.
After saying that Mojtaba Khamenei, who had been viewed as a leading contender to succeed his father, was unlikely to become Iran’s next leader, Donald Trump did not provide further details.
When asked whether the exiled Iranian crown prince Reza Pahlavi, the son of Iran’s last shah, could be considered for the role, Trump replied that all possibilities were still open, noting that the situation remained in its early stages.
Openness to Kurdish involvement
Responding to a question about whether the United States might provide air support for Iranian Kurdish forces considering an operation in western Iran, Trump declined to give a direct answer but suggested that their goal would be victory.
“If they decide to move forward with it, that’s fine,” he said.
According to three sources familiar with the matter, Iranian Kurdish militias have recently been in discussions with the United States about the possibility—and the strategy—of launching attacks on Iranian security forces in the country’s western regions.
The coalition of Iranian Kurdish groups, based along the Iran-Iraq border in the semi-autonomous Kurdistan Region, has reportedly been preparing for such an operation. Their aim would be to weaken Iran’s military while U.S. and Israeli strikes continue targeting sites across the country.
Trump also expressed confidence that the strategic shipping corridor known as the Strait of Hormuz would remain open.
Damage and energy market pressure
Iran has threatened to shut the Strait of Hormuz—a narrow passage between Iran and Oman—through which roughly one-fifth of global oil and liquefied natural gas supplies pass.
Shipping activity through the vital energy route has already slowed sharply after Iranian attacks struck six vessels, raising concerns about disruptions to global energy markets.
“They don’t really have a navy anymore—their fleet is essentially destroyed,” said Donald Trump, adding that he is monitoring the situation in the Strait of Hormuz very closely.
As the conflict intensified on Thursday, additional oil tankers were attacked in Gulf waters. At the same time, Iranian drones reportedly crossed into Azerbaijan, raising fears that the crisis could expand to involve more energy-producing regions. Since the fighting began, global oil prices have surged.
Trump said he was not worried about the rise in gasoline prices, arguing that they would likely fall quickly once the conflict ends. He added that even if fuel costs increase temporarily, the broader strategic issues at stake are far more important.
The president declined to estimate how long the war might continue but said events were progressing quickly and with greater force than many had anticipated. He added that, in his view, the conflict was unfolding faster and more decisively than expected.
USD/CAD remains rangebound with a slight bearish tilt
Momentum indicators continue to signal consolidation
USD/CAD is still under pressure, trading within the range that has persisted since mid-February. The pair is confined between the 20-day and 50-day simple moving averages (SMAs), fluctuating within the narrow 1.3645–1.3700 zone. While the Canadian dollar faces pressure from a stronger US dollar, it is finding some support as rising oil prices—driven by the ongoing Middle East tensions—provide underlying demand.
Technical indicators highlight the subdued market conditions seen in recent weeks. The RSI is hovering around the neutral 50 level, reflecting a lack of strong momentum, while the MACD is clustering near its zero line and signal line, suggesting limited potential for a near-term upward move.
Recently, the pair has been drifting toward the lower end of the range after multiple rejections at the short-term descending trendline. Immediate support lies at the 20-day SMA around 1.3645, just above the 23.6% Fibonacci retracement of the November–January decline at 1.3635. A drop below these levels could open the door to further support at 1.3575, followed by the four-month low near 1.3471, last recorded in late January.
On the upside, a clear break above the 50-day SMA and the 38.2% Fibonacci retracement around 1.3730—where the short-term descending trendline converges—could shift the outlook to a more bullish tone. Such a breakout would pave the way for a move toward the 200-day SMA near 1.3809, which aligns with the 50% Fibonacci retracement level. Notably, the 200-day SMA recently formed a death cross with the 50-day SMA, reinforcing the technical resistance against a sustained upward move.
Overall, USD/CAD is showing fading momentum as it drifts closer to the lower boundary of its multi-week consolidation range, with the earlier rebound from the four-month low beginning to lose steam. Although the broader downward trend is still in place, downside pressure may remain contained as long as the pair stays above the 20-day SMA.
Time-cycle analysis suggests the market is approaching an important reversal window between March 6 and March 9, followed by a secondary expansion phase from March 13 to March 16. Historically, silver tends to produce strong directional moves when periods of volatility compression align with these harmonic time cycles.
The recent consolidation within the $81–$85 range indicates the market is absorbing liquidity after the sharp volatility spike seen earlier in the week. If prices remain supported above the $81–$83 zone, the next major resistance cluster is expected between $90 and $97, an area that aligns with previous structural highs as well as the VC PMI Weekly Sell 1 level. A decisive break above this region could ignite a fresh volatility expansion, potentially resembling past major rallies in silver.
Silver futures are trading around $83.35, stabilizing after an intense bout of volatility that drove prices down from a $97.30 high to $78.06 in just two trading sessions. This roughly $19 price swing over a short period represents a classic volatility expansion phase, which historically tends to be followed by strong directional moves once the market completes its mean-reversion process.
According to the VC PMI framework, the Daily Mean is positioned near $83.50, a level the market is currently attempting to reclaim. A sustained close above this point could trigger bullish momentum, with upside targets at the Daily Sell 1 level around $86.43 and the Weekly Buy 1 level near $87.31.
From a structural perspective, the drop from $97.30 appears to have completed a corrective harmonic retracement pattern, testing several key Fibonacci levels including the 61.8%, 50%, and 38.2% retracements shown on the chart. Ultimately, prices found support slightly below the Weekly Buy 2 level near $81.34, reinforcing the 95% probability mean-reversion zone identified by the VC PMI model when price deviates significantly from its statistical mean.
The time-cycle analysis indicates that silver is nearing a crucial short-term reversal window between March 6 and March 9, followed by another notable cycle expansion phase from March 13 to March 16. These cycles are derived from harmonic timing patterns that often coincide with liquidity shifts in futures markets. When such timing windows align with prices trading close to VC PMI support zones, the likelihood of a directional reversal tends to increase significantly.
Using W.D. Gann’s Square-of-9 geometry, the recent high at $97.30 marks a significant harmonic pivot within the current market cycle. The subsequent pullback toward the $78–$81 region aligns closely with a rotational angle on the Square-of-9 grid, suggesting that the market may have completed a geometric correction before attempting to resume upward momentum.
Key harmonic resistance levels derived from the Square-of-9 now cluster around $90, $93, and $97, which closely correspond with the VC PMI Sell 1 and Sell 2 resistance zones.
If prices continue to hold above the $81–$83 support area, silver could enter a new expansion phase targeting the $90–$97 region during the next cycle window. Historically, volatility expansion phases in precious metals often precede strong upside moves, and the tightening price structure within the current consolidation suggests that a breakout may develop as the market approaches mid-March.
Trading volume has begun to increase, with selling pressure dominating, though the market has not yet confirmed the start of a new downtrend. While news headlines suggest a more severe market deterioration, price action has not fully validated that narrative so far.
The Russell 2000 (IWM) has gradually drifted toward range support, forming a series of lower highs but still avoiding lower lows. This tightening structure could eventually resolve with a decisive bearish breakdown—likely marked by a strong red candlestick—which would present a potential short opportunity targeting the 200-day moving average.
If that level is reached, the technical outlook would likely shift to a net-negative stance. At that point, the market could begin to reveal whether a broader bearish trend is developing.
The S&P 500 is also approaching the lower boundary of its trading range, though it still has the early-week spike low acting as a reference level. Trading volume in recent sessions has remained relatively modest, but the broader technical picture has turned negative, highlighted by a newly formed downtrend in On-Balance Volume (OBV).
When prices move back toward a spike low, markets often break below that level if the session ultimately closes within the spike range. A decisive drop below 6,800 would therefore create a potential short setup, with risk managed by placing a stop on a daily close back above 6,800.
The equal-weighted S&P 500 may provide clearer insight into the market’s direction. It recently registered a clear trend break and has since completed two successful retests of its 50-day moving average. Given how frequently this level has been tested, a third retest would not be surprising—and that attempt could potentially lead to a breakdown below the 50-day MA.
Technical indicators currently present a mixed picture. For the time being, the most reasonable interpretation is that the index remains in a trading range, similar to the consolidation pattern observed in the market-cap-weighted S&P 500.
The Nasdaq is showing slightly better resilience compared with other major indices. Yesterday’s volume was classified as accumulation, indicating some buying interest. However, the 20-day moving average is currently acting as resistance and is quickly converging with range support and the 200-day moving average.
This tightening price structure suggests a potential volatility squeeze, which is likely to lead to a sharp breakout. Once that move occurs, traders can look to position themselves in the direction of the breakout.
Bitcoin has made an initial move higher, successfully breaking above its 20-day moving average. Although prices have pulled back slightly since the breakout, the move remains intact and has not yet threatened the bullish shift.
The next upside target is the 50-day moving average, followed by the $85,000 level, which is likely to align with a test of the 200-day moving average.
Potential short opportunities are beginning to emerge, but with markets still confined to trading ranges, entering positions too early carries a high risk of whipsaws. For the time being, bullish traders may find Bitcoin to be the more stable long setup, as it continues to hold above its recent breakout level.
Managed futures strategies—often referred to as Commodity Trading Advisors (CTAs) or trend-followers—are built to perform best in environments where major macroeconomic shifts generate sustained trends across equities, bonds, commodities, and currencies. With geopolitical tensions rising due to the conflict involving Iran, the current market environment may become a significant test for these strategies.
Current Positioning
Using the SG Trend Indicator from Societe Generale Prime Services as a proxy for industry positioning, the latest asset-class exposures are outlined below. It should be noted that actual exposures may vary depending on each manager’s contract selection and portfolio construction methodology. The SG Trend Indicator generates signals based on a 20-day versus 120-day moving average crossover, with position sizes increasing the longer the signal persists, while still being adjusted for expected volatility.
Equities: Aside from a short position in NASDAQ futures, positioning remains long across both U.S. and developed international equity markets.
Commodities: Long positions are held in precious and base metals, crude oil, and livestock contracts, while short exposure is concentrated in agricultural commodities such as coffee, cocoa, and cotton.
Bonds: Positioning is mixed across regions and maturities. There is a short position in the middle segment of the U.S. Treasury curve, though overall directional exposure remains relatively limited.
Currencies: Long positions are held in the euro, British pound, Canadian dollar, and Mexican peso against the U.S. dollar, while the U.S. dollar is long against the Japanese yen.
Potential Impact of Rising Geopolitical Risk
Historically, periods of heightened geopolitical tension tend to trigger a flight to safe-haven assets, broad risk-off sentiment, and sharp increases in energy prices. Based on the positioning outlined above, the potential implications may include:
Equities: If equity markets continue to decline, current long exposure could weigh on performance in the near term. However, since trend signals remain relatively moderate, a deeper or more prolonged sell-off could eventually shift positioning toward net short exposure.
Commodities: Crude oil prices have already moved sharply higher, which supports the existing long positioning in energy markets.
Bonds: Demand for government bonds—particularly U.S. Treasuries—typically rises during periods of market stress. With current exposure across Treasuries relatively balanced between long and short positions, changes in investor demand along the yield curve could influence future positioning.
Currencies: A move toward traditional safe-haven currencies could put pressure on strategies currently holding short U.S. dollar exposure in the short term.
Key Takeaway
The conflict involving Iran has injected significant macro uncertainty and volatility into global markets. For managed futures strategies, such conditions highlight their role in providing dynamic diversification through both long and short exposure across equity, bond, currency, and commodity futures markets.
In the near term, gains are likely to be supported by existing long exposure to energy markets. However, long equity positions and short U.S. dollar exposure may act as a drag on returns. For managed futures to generate meaningful crisis alpha, sustained price trends are essential. Without persistent directional moves, strategies may face whipsaw conditions where signals frequently reverse—an environment that tends to be particularly challenging for the industry.
Within the managed futures space, maintaining a diversified allocation across sub-strategies remains important. These may include short-term momentum, volatility breakout systems, pattern-recognition models, and traditional trend-following approaches. Additional diversification across markets and time horizons within trend-following strategies is also recommended.
The conflict in Iran has reshaped expectations about which sectors will benefit or struggle in the U.S. stock market, steering investment toward energy, materials, and industrial companies. How long this shift in market leadership continues will largely depend on the war’s trajectory and duration. For now, however, traditional “old-economy” stocks have regained popularity among investors.
Rising oil and natural gas prices have propelled energy stocks to the top of sector performance rankings. According to ETF data through yesterday’s close (March 4), the Energy Select Sector SPDR Fund has climbed more than 25% so far this year. In comparison, the broader market, represented by the SPDR S&P 500 ETF Trust, has delivered almost no growth, posting only a modest gain of about 0.5% in 2026.
Materials and industrial stocks rank a distant second and third in sector performance this year, followed by consumer staples, utilities, and real estate. Most of the other sectors are either hovering around flat levels or showing losses. Financials have performed the worst so far, declining about 6% since the start of the year.
However, this shift in investor sentiment may not last long, depending on how the conflict develops. Many analysts believe the war could end relatively soon. If that happens, today’s leading sectors might give up their gains as investors rotate back toward themes tied to artificial intelligence and the digital economy.
That outcome remains uncertain. The joint U.S. and Israeli strike on Iran has already proven to be more than a swift, targeted operation. With the conflict now entering its fifth day, the chances of a near-term resolution appear increasingly slim.
Both the United States and Israel have indicated publicly that the conflict could extend for several weeks and may even become a prolonged war. On Wednesday, senior Pentagon officials cautioned that the situation could evolve into a longer confrontation, stressing that the fighting is “far from over.” U.S. Defense Secretary Pete Hegseth suggested the conflict might continue for up to eight weeks.
A senior Israeli military officer echoed this view, noting that preparations are being made for a conflict that could last several weeks.
How long the war continues will be a crucial factor shaping investor risk appetite and the direction of financial markets. According to Rick de los Reyes, a sector portfolio manager at T. Rowe Price, if disruptions prove brief, past experience shows that price spikes driven by geopolitical tensions often fade once uncertainty subsides. However, if production or exports are disrupted for an extended period, it could create a genuine supply shock with significant consequences for inflation, interest rate expectations, and global economic growth.
As a result, the outlook for inflation, economic activity, interest rates, and which sectors lead or lag in markets remains highly uncertain. For now, the only clear reality is that no one knows how the conflict will develop or where it will ultimately lead. While several scenarios appear plausible on paper, the eventual outcome will likely challenge many of today’s predictions once the fighting ends.
Bitcoin edged higher on Thursday, stabilizing after a wave of regulatory optimism and improving market sentiment fueled recent gains in the world’s largest cryptocurrency, though concerns linked to the Iran conflict continued to weigh on markets. The digital asset rose 1.5% to $72,620 by 09:37 ET (14:37 GMT), after reaching a one-month peak of $73,243 on Wednesday.
However, some gains were pared back as U.S. stock index futures turned negative Thursday morning, with ongoing tensions between the U.S., Israel, and Iran keeping investors cautious. Rising oil prices also intensified worries about the conflict’s potential inflationary effects.
Bitcoin had surged on Wednesday, extending earlier weekly gains as a strong performance on Wall Street boosted risk appetite. Bargain buying also contributed to the rally following the cryptocurrency’s sharp losses in February. The market was further supported after U.S. President Donald Trump urged lawmakers to quickly pass a long-delayed crypto market framework bill and criticized major U.S. banking groups for opposing yield payments on stablecoins.
His remarks fueled expectations that the industry could receive more favorable regulation in the U.S., although progress on the CLARITY Act—designed to establish a clear market structure for crypto—remains limited. Earlier optimism was also driven by reports suggesting Iran was seeking talks with Washington, raising hopes for de-escalation. However, Iran denied those reports and launched missile strikes on Israel early Thursday, dampening risk sentiment.
Meanwhile, billionaire hedge fund manager Ray Dalio renewed his criticism of Bitcoin, arguing it should not be compared with gold because it lacks central bank backing, offers limited privacy, and could be vulnerable to advances in quantum computing. Speaking on a podcast, the Bridgewater Associates founder said Bitcoin remains small relative to gold as a monetary asset and questioned its reliability as a safe haven.
Despite his skepticism, Dalio noted in 2025 that he maintains a 1% allocation to Bitcoin in his portfolio and previously suggested investors consider holding around 15% in either Bitcoin or gold amid concerns about the U.S. debt situation.
In corporate news, Intercontinental Exchange—the owner of the New York Stock Exchange—acquired a minority stake in crypto exchange OKX in a deal valuing the platform at roughly $25 billion. As part of the agreement, ICE will license OKX’s spot crypto pricing data and intends to launch U.S.-regulated futures contracts tied to those prices.
Subject to regulatory approval, ICE’s U.S. futures products and tokenized NYSE-listed equities could also become available on OKX’s platform. Financial terms of the investment were not disclosed, though ICE will receive a seat on OKX’s board.
Across the broader crypto market, prices moved slightly higher on Thursday, following Bitcoin’s gains as the sector recovered part of last month’s losses. Ether rose about 2% to $2,123.34, while XRP gained more than 1% to $1.43. Solana, Cardano, and BNB also recorded modest increases. Among memecoins, Dogecoin traded flat, while the $TRUMP token declined around 2%.
The U.S. dollar resumed its upward movement on Thursday after briefly pulling back from a three-month high, as ongoing tensions in the Middle East unsettled investors and increased demand for the safe-haven currency.
Initial optimism about a possible easing of the conflict quickly faded, replaced by renewed uncertainty after Iran warned that Washington would “bitterly regret” the sinking of an Iranian warship near Sri Lanka.
As a result, the dollar remained strong, with the euro slipping 0.18% to $1.1610 and the British pound falling 0.1% to $1.3358. The dollar index, which tracks the greenback against six major currencies, rose 0.18% to 98.99.
Nick Rees, head of macro research at Monex, said investors are struggling with limited clarity about the geopolitical outlook. He noted that markets currently react strongly even to minor headlines because confidence about future developments is low.
While geopolitical turmoil usually pushes investors toward safe assets, concerns about rising inflation have complicated the picture. Some traditional safe havens have behaved unpredictably, forcing investors to reconsider which assets truly provide protection.
Germany’s 10-year Bund yield, the eurozone benchmark, climbed 6.1 basis points to 2.807% on Thursday as bond prices declined.
Limited safe havens
Bas van Geffen, senior macro strategist at Rabobank, said investors appear to have few clear safe options. Even assets like gold are not responding in their usual way. Instead, the sharp rise in the dollar index suggests that dollar liquidity is currently the dominant refuge.
So far this week, the dollar has gained nearly 1.37%, standing out as one of the few assets to benefit during several volatile trading sessions that have pressured stocks, bonds, and occasionally even precious metals.
The surge in energy prices triggered by the Middle East conflict has also revived concerns that inflation could return, potentially disrupting expectations for interest rate cuts from major central banks.
Traders now see only a 31.5% probability that the Federal Reserve will cut interest rates in June, down from roughly 46% a week earlier, according to the CME FedWatch tool. Part of this shift reflects stronger-than-expected U.S. economic data released on Wednesday.
Expectations for rate cuts from the Bank of England have also been reduced, while markets are increasingly betting that the European Central Bank could raise interest rates as early as this year.
Thierry Wizman, global FX and rates strategist at Macquarie Group, said central bankers are increasingly worried about the return of inflation. He added that U.S. rate expectations could change significantly in 2026 if global inflation accelerates again due to energy supply constraints.
The Japanese yen also gave up earlier gains and was last trading 0.2% weaker at 157.35 per dollar.
Meanwhile, China set its 2026 economic growth target between 4.5% and 5%, slightly lower than last year’s 5% growth. The target leaves room for more efforts to reduce industrial overcapacity and rebalance the economy, though not aggressively.
The Chinese yuan recovered from a one-month low to trade roughly unchanged at 6.8951 per dollar after the People’s Bank of China set its daily reference rate at the strongest level in nearly three years.
In the cryptocurrency market, both bitcoin and ether declined by less than 1% following strong gains in the previous trading session.
Oil prices climbed more than 3% on Thursday, extending their rally as the escalating conflict involving the United States, Israel, and Iran disrupted energy supplies and shipping routes. The tensions prompted some major producers to reduce output while others took steps to secure supply. Brent crude rose $2.64, or 3.2%, to $84.04 per barrel by 1425 GMT, marking a fifth straight session of gains, while U.S. West Texas Intermediate (WTI) increased $3.35, or 4.5%, to $78.01.
The premium of prompt Brent futures over the six-month contract approached its widest level since July 2022, signaling tighter global supply. Renewed tanker attacks in the Gulf and China’s move to curb fuel exports also supported prices, according to UBS analyst Giovanni Staunovo, who noted that refined fuel markets are showing stress due to reduced Middle East exports. Some refineries in the Middle East, China, and India have shut crude units amid the conflict, while European diesel futures surged to their highest level since October 2022 at $1,130 per tonne.
Attacks on oil tankers continued in the Gulf, including damage to the Bahamas-flagged tanker Sonangol Namibe near Iraq’s Khor al Zubair port. Around 300 tankers remained stranded in the Strait of Hormuz as traffic through the vital chokepoint nearly halted. Natural gas prices also rose after Russian President Vladimir Putin warned that Russia could stop its remaining gas flows to Europe, while Qatar declared force majeure on LNG shipments. European gas prices at the Dutch TTF hub for April delivery climbed nearly 3% to around 50 euros per MWh, bringing gains since Friday to nearly 60%.
Meanwhile, Iran launched missiles at Israel as the conflict entered its sixth day, following a U.S. submarine strike that sank an Iranian warship near Sri Lanka. Analysts at J.P. Morgan warned that oil supplies from Iraq and Kuwait could begin shutting down if the Strait of Hormuz remains closed, potentially removing up to 3.3 million barrels per day from the market. Iraq has already reduced production by nearly 1.5 million barrels per day due to limited storage and export routes, while Qatar said it may take at least a month to restore normal LNG export levels.
The dollar hovered near a three-month peak in Asian trading on Wednesday, as traders pulled back from the euro amid escalating Middle East tensions that fueled concerns over persistently higher energy costs and battered global equities.
The euro edged down 0.2% to $1.1590, marking a third straight day of losses after earlier sliding to its weakest level since late November. The decline followed Tuesday’s data showing euro zone inflation rose more than anticipated in February, even before the outbreak of the Iran conflict.
According to George Saravelos, global head of FX research at Deutsche Bank, the Iran war’s effect on EUR/USD ultimately centers on energy. He noted that Europe is facing a negative supply shock that effectively acts as a tax, transferring income to overseas energy producers and increasing demand for dollars.
Markets extended their downturn on Wednesday as mounting inflation fears spread across stocks and bonds. Intensified strikes by Israeli and U.S. forces on Iranian targets triggered a flight to cash, further weighing on risk assets.
Oil and gas prices have surged as attacks on Iran disrupt Middle Eastern energy exports. Tehran’s countermeasures targeting shipping lanes and energy infrastructure have halted navigation in the Gulf and led to production suspensions from Qatar to Iraq.
Benchmark Brent crude climbed 1.9% to $82.94 a barrel—its highest level since July 2024—bringing total gains since Friday to 14%. Meanwhile, European gas prices have soared 70% since the end of last week.
ING analysts noted in a research report that the ECB’s previously comfortable position is now under pressure, adding that a quick resolution appears unlikely. They warned that the prospect of rate hikes from the European Central Bank could threaten carry trades and lead to a sharp widening in eurozone government bond spreads. Sterling weakened 0.3% to $1.3323.
The U.S. dollar index, which tracks the greenback against six major peers, rose 0.1% to 99.208 after earlier touching its highest level since November 28. The dollar slipped 0.2% against the yen to 157.52.
In offshore trading, the U.S. currency gained 0.1% versus the Chinese yuan to 6.9287, following mixed February PMI readings. Official data pointed to a contraction in activity, while a private survey significantly exceeded expectations.
The Australian dollar dropped 0.6% to $0.6996, despite figures showing stronger fourth-quarter GDP growth. Analysts at Capital Economics suggested the headline data may exaggerate weakness in private demand, noting that although details were mixed, the Reserve Bank of Australia is likely to remain wary that economic growth is still running above its sustainable pace.
The New Zealand dollar edged up 0.1% to $0.5898. In cryptocurrencies, bitcoin declined 0.4% to $67,776.69, and ether lost 0.5% to $1,958.81.
Oil prices climbed sharply again on Wednesday, building on strong gains from the previous two sessions, as the escalating confrontation among the U.S., Israel, and Iran heightened fears of supply disruptions.
By 03:40 ET (08:40 GMT), Brent Oil Futures for May delivery had advanced 3.5% to $84.25 per barrel, while WTI Crude Oil Futures rose 3.4% to $77.10 per barrel. Both benchmarks had already rallied nearly 5% on Tuesday, after jumping about 7% at the start of the week, with Brent touching its highest level since July 2024.
Supply risks dominate sentiment
The conflict erupted over the weekend when U.S. and Israeli forces carried out coordinated strikes on Iranian military targets, reportedly killing Ali Khamenei. Fighting continued into Wednesday, with U.S. Admiral Brad Cooper stating that more than 2,000 Iranian targets had been struck.
Tehran has retaliated with missile and drone attacks on neighboring Arab countries hosting U.S. bases and has issued threats to international shipping. Oil tankers passing through the Strait of Hormuz—a chokepoint responsible for roughly 20% of global crude shipments—have been specifically targeted.
The mounting threat to this key transit route for exporters such as Saudi Arabia, Iraq, and the UAE has injected a sizable geopolitical risk premium into oil markets. ING analysts noted that disruptions in the Strait are beginning to impact upstream flows. They also cited reports that Iraq has curtailed output at its largest oilfields, including Rumaila and West Qurna 2, taking around 1.2 million barrels per day offline.
Goldman raises 2026 outlook
On Wednesday, Goldman Sachs lifted its average price forecast for the second quarter of 2026, raising Brent by $10 to $76 per barrel and WTI by $9 to $71.
The bank’s projections assume that reduced flows through Hormuz will significantly draw down OECD inventories and Middle East production in March. Goldman emphasized that risks remain skewed to the upside, particularly if export disruptions persist longer than expected or if oil infrastructure sustains damage.
It added that if volumes through Hormuz remain constrained for another five weeks, Brent could climb to $100 per barrel—a level likely to trigger demand destruction to prevent inventories from dropping too low.
However, analysts cautioned that the supply-driven rally could eventually undermine demand. Prolonged high prices may stoke inflation and compound broader economic risks, potentially dampening consumption and weighing on crude prices over time.
U.S. pledges support for shipping
Investors are also watching remarks from Donald Trump, who said the U.S. Navy would escort commercial vessels if necessary and pledged government backing to ensure safe passage through the Strait.
ING pointed out that insurers have begun withdrawing war-risk coverage for ships transiting Hormuz. While U.S. assurances may offer some relief, analysts cautioned that restoring confidence in shipping lanes will take time.
Although military escalation has fueled the rally, signs of coordinated international efforts to safeguard maritime traffic could help limit further near-term gains.
Bitcoin was little changed on Wednesday, drawing modest support after Donald Trump called for stronger regulatory backing of the crypto sector.
Still, lingering concerns over the escalating U.S.-Iran conflict—and its potential inflationary fallout—kept broader digital asset markets under pressure, capping what had been a brief rebound earlier in the week.
Bitcoin was flat at $68,147.8 as of 01:30 ET (06:30 GMT). The token had briefly climbed back toward $69,000 earlier this week before surrendering part of those gains.
Trump targets banks over crypto legislation
In a Tuesday evening social media post, Trump accused major U.S. banks of attempting to weaken the GENIUS Act—legislation regulating stablecoins—by delaying progress on the CLARITY Act in the Senate. The latter bill aims to establish a broader regulatory framework for crypto markets.
Trump argued that record bank profits should not come at the expense of the administration’s crypto agenda, warning that failure to pass the CLARITY Act could drive innovation overseas. He urged banks to support, rather than obstruct, efforts to formalize rules for the industry.
According to reports, Trump met privately with Brian Armstrong, CEO of Coinbase, shortly before issuing his remarks. Armstrong has opposed a full ban on yield payments for stablecoins.
The GENIUS Act, passed in June 2025, prohibits issuers such as Tether from directly paying yields to holders. However, third-party platforms like exchanges may still offer such returns—an arrangement banking groups argue creates a regulatory loophole.
The CLARITY Act, approved by the House in July but still awaiting Senate passage, has faced delays largely due to disagreements over whether stablecoin yield payments should be regulated similarly to bank interest payments.
Altcoins muted amid geopolitical strain
Broader crypto markets traded within a narrow range on Wednesday. While optimism over potential U.S. regulatory clarity provided some support, investor sentiment remained constrained by ongoing tensions in the Middle East.
With the U.S., Israel, and Iran conflict entering its fifth day, fears of supply disruptions—particularly in global oil markets—have fueled inflation concerns. Persistent price pressures could prompt major central banks to maintain a hawkish stance, dampening appetite for risk assets, including cryptocurrencies.
Among major tokens, Ethereum fell 1% to $1,979.99, while XRP slipped 0.2% to $1.3594. Solana and BNB were little changed, while Cardano declined 3%. In the meme coin segment, Dogecoin dropped 2.6%, and TRUMP slid 3.4%.
Gold futures are hovering around $5,185, validating a decisive breakout from a multi-year consolidation range and signaling what looks like the hyperbolic stage of the ongoing bull run. Based on VC PMI modeling and Square-of-9 harmonic projections, the next key resistance zone is projected between $5,400 and $5,850.
Should upside momentum carry through the upcoming cycle window in late March, prices may stretch toward the $6,000 area by mid-April, where more substantial harmonic resistance is expected. The sharp upward angle of the moving averages reflects strong institutional participation, implying that any pullbacks are likely to represent brief consolidations within a broader bullish advance.
On the monthly continuation chart, gold futures display one of the most pronounced structural rallies in precious metals history. Following years of range-bound trade between roughly $1,700 and $2,100, gold broke out in 2024 and has since accelerated into what can be characterized as a hyperbolic expansion phase.
With prices now near $5,185—well above the primary moving-average framework—the technical backdrop confirms a robust momentum environment typical of the later stages of a long-term bull market.
From a VC PMI mean-reversion standpoint, price action unfolds in oscillating waves around equilibrium. When the market stretches materially above its mean, it reflects powerful upside momentum—but also a rising likelihood of heightened volatility.
On the current monthly timeframe, gold is trading well above its 9-month and 18-month moving averages. Historically, such extended positioning tends to occur during periods of accelerated institutional accumulation and heightened global monetary stress, conditions that often accompany the more explosive phases of a long-term bull cycle.
Market Timing Windows
Applying the VC PMI time-cycle framework alongside harmonic rhythm analysis, the following timing windows are anticipated for March and April:
March 7–10 – Initial volatility window where the market may pause or consolidate following the recent sharp advance.
March 18–22 – Secondary cycle pivot zone, a period that often reveals whether the trend resumes or shifts into corrective behavior.
March 27–31 – Key inflection window, coinciding with futures delivery dynamics and potential liquidity realignments.
April 12–18 – Major harmonic cycle window that could generate either a short-term peak or an accelerated continuation breakout.
These timeframes should be viewed as probabilistic windows, not precise reversal dates. In hyperbolic market phases, price action often accelerates into projected cycle periods, followed by short-lived pullbacks before the broader uptrend resumes.
Square-of-9 Harmonic Resistance
Applying W.D. Gann’s Square-of-9 framework to prior breakout levels highlights the next key harmonic price objectives. Current projections indicate that gold is advancing toward a significant resistance band between $5,400 and $5,850.
Should the market maintain monthly closes above the $5,400 threshold, the Square-of-9 model opens the door to the next harmonic cluster in the $6,000–$6,300 range—closely aligned with the broader cycle window projected into April.
How price reacts at these geometric resistance zones—particularly in conjunction with the upcoming time-cycle windows—will help determine whether gold enters a temporary consolidation phase or continues its acceleration within a larger liquidity-driven advance.
Structural Interpretation
The pronounced upward slope of the moving averages confirms that gold is operating in the momentum stage of a secular bull market. Historically, such phases unfold during periods when global capital rotates toward hard assets amid currency debasement, geopolitical tension, and expanding sovereign debt burdens.
Although intermittent pullbacks are normal in strong trends, the broader structure remains constructive as long as price holds above the monthly mean zone near $4,300–$4,400, which now serves as major structural support.
Oil markets are holding near the top of their recent trading band as participants factor in an added layer of logistical risk to global energy supply chains.
Crude has rebounded toward the 76–77 zone after strong buying interest emerged around 72, where support formed amid renewed tensions surrounding the Strait of Hormuz. Concerns over tanker traffic and potential shipping bottlenecks prompted buyers to step in aggressively at that level.
Although the market has not yet entered a full volatility breakout, recent price action indicates that crude is beginning to price in a geopolitical premium—driven less by outright production losses and more by uncertainty surrounding transportation routes.
At this stage, oil appears to be recalibrating to elevated logistics risk rather than responding to an immediate supply shock.
Hormuz Strains Redirect Market Focus to Supply Chain Risk
Recent events surrounding the Strait of Hormuz have underscored that energy security depends not only on production levels, but also on the reliability of transport routes.
Approximately one-fifth of the world’s traded crude moves through this narrow passage linking the Persian Gulf with the Indian Ocean. Even limited interruptions to traffic through the corridor can quickly spill over into freight markets, insurance costs, and tanker availability.
Signs of mounting congestion and heightened caution among tanker operators have already driven freight rates higher, while insurers are reassessing war-risk premiums for ships crossing the region.
Such bottlenecks may not immediately eliminate physical supply, but they can slow the circulation of oil through global networks. In commodity markets, logistical slowdowns frequently manifest as increased price volatility.
Physical Flows Matter as Much as Production
The current backdrop highlights a familiar theme in oil markets: disruptions to transportation networks can tighten supply perceptions even when overall output remains steady.
When tanker routes are constrained, ships may need to reroute or wait offshore, effectively extending supply chains and temporarily shrinking available shipping capacity. That dynamic can create pockets of tightness at key delivery hubs, even if global stockpiles appear sufficient on paper.
In recent trading sessions, this logistical dimension has become a more influential force in price formation. Market participants are increasingly monitoring tanker movements, port congestion, and freight costs as real-time signals of stress within the physical crude system.
Consequently, oil is now trading not just on traditional supply-demand fundamentals, but also on the durability and flexibility of the infrastructure responsible for moving those barrels worldwide.
Oil has staged a decisive rebound from the 72 region, marking a notable shift in short-term structure.
From a technical standpoint, the Renko pattern reflects a clear momentum transition following the recent pullback. The 72 area emerged as a strong demand zone, where buyers stepped in forcefully after a run of declining bricks signaled waning downside pressure. That reversal sparked a steady advance, lifting crude back toward the top of its near-term trading range.
Support has now rotated higher, clustering in the 75.0–74.7 band. This zone has functioned as a pivot throughout the latest consolidation phase and represents the first layer of defense should prices retrace.
Beneath current levels, the more meaningful structural support remains around 72.1, which formed the foundation of the latest corrective phase.
On the upside, the 76.3–76.8 range is shaping up as a key resistance corridor. Multiple rallies have stalled in that area, indicating that market participants are still weighing whether the prevailing geopolitical risk premium is strong enough to fuel a sustained breakout.
For now, the broader pattern appears to reflect orderly consolidation after a sharp rebound, rather than the early stages of a renewed bearish trend.
Momentum Signals Indicate a Mature Expansion Phase
Momentum metrics reinforce the view that crude is moving out of a compression environment and into a more developed directional cycle.
The ECRO profile remains elevated, hovering near the top of its historical range. This typically characterizes conditions where volatility has already expanded and the market is consolidating those gains, rather than initiating a fresh breakout. Meanwhile, stochastic momentum has rebounded toward its upper boundary after briefly easing during the recent pullback.
Together, these signals imply that upside pressure remains intact, though the market may need additional consolidation before launching its next impulsive move. In essence, the current hesitation near resistance appears to reflect constructive digestion of prior gains, not a sign of trend exhaustion.
Freight Markets Could Provide the Next Major Signal
Looking ahead, shipping conditions in the Persian Gulf are likely to remain a critical variable for oil markets.
If tanker congestion worsens or freight rates continue climbing, traders may begin assigning a higher logistical risk premium to crude. Transportation disruptions typically ripple through the system gradually, meaning their pricing impact often builds over time rather than materializing as a single abrupt shock.
On the other hand, if shipping activity stabilizes and geopolitical tensions ease, a portion of the recently embedded premium could unwind. In that case, crude would likely shift back to trading primarily on macroeconomic drivers such as global demand expectations, currency fluctuations, and inventory trends.
For now, however, freight dynamics remain a central component of the oil narrative.
Outlook
Crude is navigating a landscape shaped as much by transportation risk as by traditional supply fundamentals. The rebound from the 72 area reinforces the view that buyers are still active on pullbacks, while the consolidation around 76 indicates the market is assessing whether current geopolitical risks justify a sustained breakout.
As long as prices remain above the 75–74.7 support zone, the near-term technical structure stays constructive. A clear push above 76.8 would signal renewed upside momentum and could pave the way for a broader expansion phase. Conversely, a decisive break below 74.7 would likely shift crude back into a wider consolidation pattern.
At present, price action reflects a market recalibrating to elevated transportation risk rather than responding to a structural collapse in supply.
Currency markets experienced a noticeable shift in tone yesterday, as the initial energy shock evolved into a broader wave of risk deleveraging amid rising cross-asset volatility. Such unwinds are typically brief but intense.
Before rebuilding positions, investors will likely need reassurance—either through a moderation in energy prices or signals that central banks have room to ease policy.
USD: Attention May Shift to U.S. Inflation and the Fed
FX market drivers evolved yesterday. While Monday’s price action centered on the impact of elevated energy prices on importing versus exporting currencies, Tuesday brought a broader wave of deleveraging as cross-asset volatility surged. Equities sold off sharply—particularly financials—reflecting crowded overweight positioning in that sector.
Concerns around private credit redemptions (including headlines tied to Blackstone and Blue Owl) appear secondary to the wider risk-off move, though they remain worth monitoring. More broadly, rising volatility and higher Value-at-Risk metrics have triggered position trimming across asset classes. In FX, this dynamic has supported the U.S. dollar, especially given that speculative positioning had been skewed short.
Some of the dramatic overnight headlines—such as a 12% drop in South Korea’s Kospi—should also be viewed in context, following a roughly 50% rally year-to-date through February.
Looking ahead, near-term risk sentiment will likely hinge on two variables: whether energy prices can ease—potentially if the Strait of Hormuz reopens more fully—and whether central banks can provide policy support rather than tighten further. Risk assets briefly stabilized after President Trump suggested naval convoy protection for shipping through the Strait and federal backing for maritime insurance. While constructive, markets will want tangible follow-through. For now, energy prices remain firm.
On monetary policy, the inflationary implications of the energy shock have pushed short-end rate expectations higher. That hawkish repricing paused during yesterday’s equity slide, but absent another major sell-off, tighter short-end pricing appears to be the prevailing theme—another tailwind for the dollar.
Today’s catalysts include the monthly ADP employment report; a reading near +50K would reinforce the view that labor market downside risks have diminished, supporting the Fed’s stance. Attention will also fall on the ISM services “prices paid” component—an elevated reading would bolster the dollar. Later, the Fed’s Beige Book ahead of the March 18 FOMC meeting could shape expectations further. Any signs of persistent price pressures may prompt markets to trim expectations for rate cuts. Currently, roughly 45 basis points of easing are priced in for the year.
The dollar has posted strong gains this week on these dynamics, with DXY reaching as high as 99.68 yesterday. While investors may hesitate to chase it through the 100.00–100.35 highs seen over the past eight months, meaningful improvement in the energy backdrop may be required before short-dollar positioning regains traction.
EUR: 1.1500 Could Mark the Floor of the Trading Range
Heavy long positioning in the euro—particularly among asset managers—left EUR/USD exposed to downside pressure yesterday, with the pair touching a low of 1.1530. It is currently being weighed down by two forces: deteriorating terms of trade and a broader wave of market deleveraging. Of the two, the terms-of-trade dynamic is likely to be the more decisive factor. How long the energy shock persists will determine whether EUR/USD needs to slide toward the 1.10–1.12 region or can stabilize closer to 1.15. Our central scenario favors the latter, assuming operational tensions ease in the coming week and the Strait of Hormuz gradually reopens.
Unless fresh headlines emerge from the Gulf today, market sentiment may begin to steady—equity futures are already pointing to a less negative open—and EUR/USD could establish support in the 1.1550–1.1575 range.
Stocks ended the session little changed, rising just 4 basis points. As anticipated in this free daily note, the S&P 500 opened with a gap lower and quickly tested the 6,800 put wall. Implied volatility was sharply compressed as those put positions were likely unwound, paving the way for a rebound in equities.
In short, the action unfolded largely in line with Sunday’s outlook.
The more notable development was that the CBOE Volatility Index still climbed to 21.5 on the session after spiking to roughly 25 earlier in the day. Examining the volatility smile, implied volatility for the SPDR S&P 500 ETF Trust March 20 options moved broadly higher. With minimal net price change in the underlying, the bulk of the adjustment reflected a parallel upward shift in implied volatility across the curve. Put skew steepened, while call skew flattened.
In other words, volatility did increase overall, but the sharp pullback from intraday highs helped power the rebound following the opening gap lower.
At the same time, the gap between the S&P 500 Dispersion Index and three-month implied correlation tightened. Historically, that spread has tended to act as a leading indicator for the S&P 500. It’s hard to envision a setup where implied volatility stays elevated and correlations continue to climb without the index eventually facing downside pressure.
For the moment, though, options traders seem comfortable maintaining positioning around the 6,800 level.
Equities could also face headwinds if interest rates and crude prices keep pushing higher. A combination of rising yields and elevated oil costs is rarely constructive for economic growth. The same dynamic extends to the U.S. dollar — since 2022, oil, rates, and the greenback have often moved in tandem.
If all three continue advancing, financial conditions would likely tighten over time, a backdrop that historically has not been favorable for stocks.
But as long as the options market keeps propping up the S&P 500, what could possibly derail the rally?
WTI crude surged over 6%, climbing back above the $75 level amid heightened market tension.
Oil prices have shot up as fears grow that the escalating US-Iran conflict could disrupt global supply chains.
Goldman Sachs suggests the market is currently pricing in roughly an $18 per barrel geopolitical risk premium on crude.
West Texas Intermediate (WTI) jumped more than 6% on Tuesday, pushing past the key $75 threshold as the intensifying US–Iran conflict stoked concerns over possible supply disruptions via the Strait of Hormuz.
At the time of writing, the US crude benchmark is hovering near $76.16 — its highest level since June 2025.
Roughly 20% of global oil shipments pass through the Strait of Hormuz, underscoring its status as a critical energy chokepoint. Senior figures from Iran’s Islamic Revolutionary Guard Corps (IRGC) reportedly announced the closure of the strait, warning that any vessel attempting to transit could be “set ablaze.”
Amid escalating security risks, many shipowners have suspended passage through the corridor, with several tankers waiting outside the waterway. In addition, Saudi Aramco has halted operations at its Ras Tanura refinery after a drone strike in the vicinity. The site has a processing capacity of approximately 550,000 barrels per day.
According to a Reuters report on Monday, Goldman Sachs estimates that oil prices currently include an $18 per barrel real-time geopolitical risk premium, based on a note issued Sunday. The bank added that the premium could ease to about $4 per barrel if only half of the Strait of Hormuz’s flows are disrupted for one month.