Heightened geopolitical tensions triggered a sharp 7–8% rally in WTI and Brent crude at the start of March. A confirmed technical breakout, along with a rising 200-day moving average, indicates the broader uptrend remains intact despite near-term resistance levels. Energy equities continue to outperform the wider market as volatility intensifies across commodities.
After Venezuela, attention has now shifted to Iran. Weekend strikes led by the U.S. and Israel on the oil-producing nation sent crude prices surging to open March. WTI climbed 7% to $72, while Brent advanced 8% to $79 per barrel.
Notably, the Brent–WTI spread widened beyond $7 — up from roughly $3 during last year’s more stable geopolitical environment — underscoring growing geopolitical risk.
Oil’s Rally Isn’t Exactly a Surprise
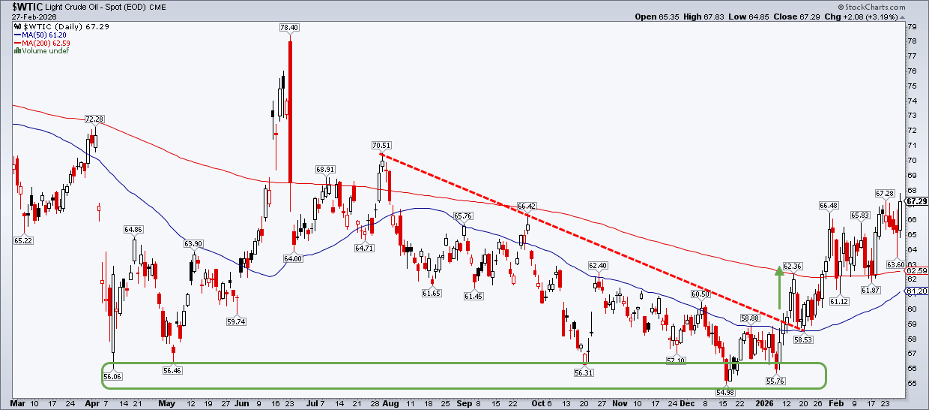
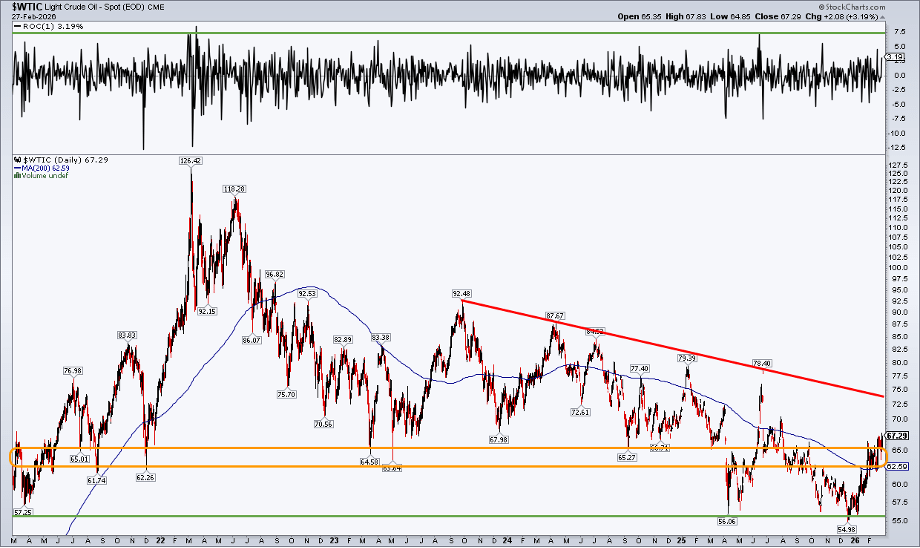
Crude’s advance didn’t begin overnight. WTI carved out a bottom in mid-December just below $55, marking a multi-year low as President Trump pushed for lower domestic energy prices. A decisive move above the 50-day moving average in January — followed by a breakout above the 200-day average weeks later — signaled that bulls were taking control. Now, $WTIC is trading at its strongest level since the U.S. struck key Iranian nuclear facilities in June 2025.
The pressing question now is: Where does oil head next?
Let the Charts Do the Talking
As always, it helps to swap the macro lens for a technical one. Earlier this year, crude broke out of a downtrend formation — a clear signal to consider gaining exposure, whether through an oil ETF like the United States Oil Fund or by overweighting energy stocks.
At the time, the mid-$50 range was emerging as a critical support zone. Even amid bearish rhetoric from the White House and persistent talk of a supply glut, WTI continued grinding higher.
Near-Term Selling Pressure?
Taking a broader view, crude may now be running into resistance following a powerful 30% surge in less than three months. The rolling front-month contract spiked into the mid-$70s on Sunday night before easing back toward the low $70s — establishing a fresh battleground for traders.
Adding to the tension, the CBOE Oil Volatility Index has jumped sharply, signaling that a decisive breakout — or breakdown — could unfold quickly. Technically, WTI has also tagged a descending resistance line drawn from the Q3 2023 peak, doing so after one of its strongest single-day advances in the past five years.
Also note the upward slope of the 200-day moving average — a sign that bulls remain in control of the broader trend. While the current advance lacks the explosive momentum seen five years ago, when Brent surged to $135, there are still constructive elements supporting the bullish case. With the 200-day average gradually climbing and seasonally favorable calendar trends ahead, oil bulls have several tailwinds working in their favor.
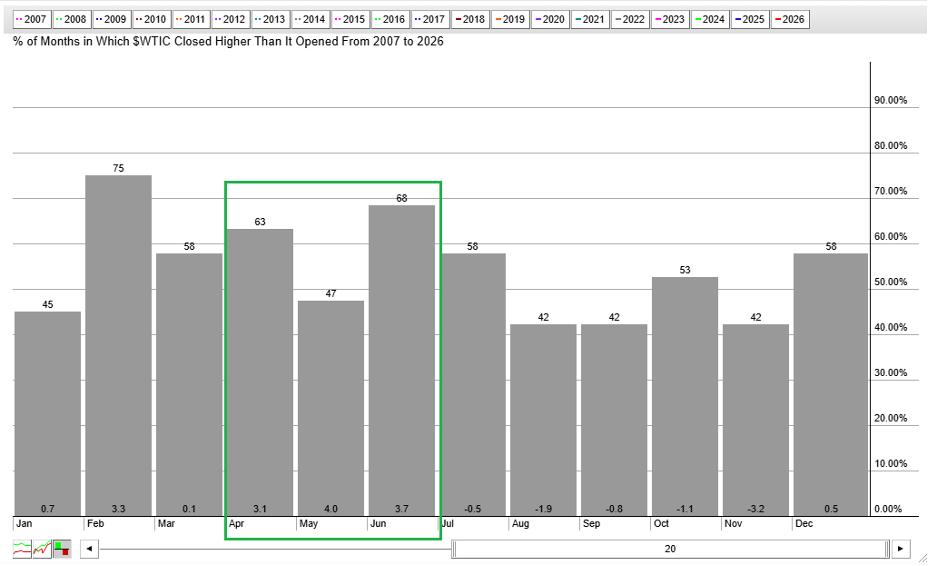
Muted March, Lively April–June?
StockCharts’ seasonality data shows that while March has delivered mixed results over the past 20 years, the second quarter has produced consistently strong returns. In fact, the April-to-June period stands out as the best-performing three-month stretch of the year.
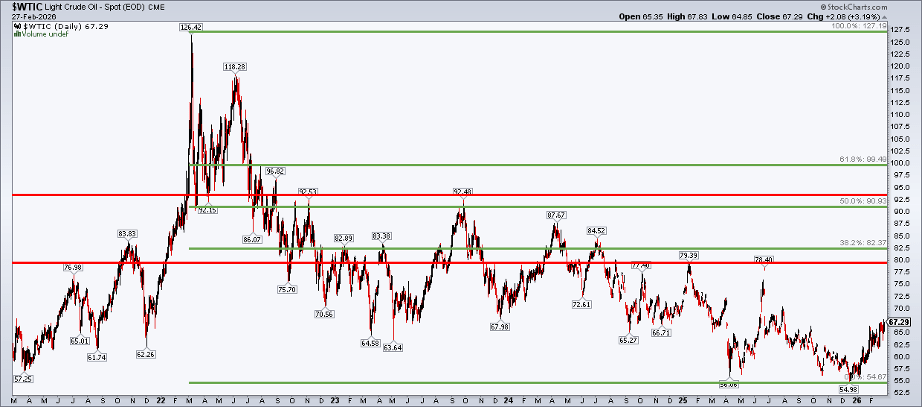
On the chart below, a push through the low $70s would suggest the next upside target lies in the $77–$80 area, where prices peaked between Q3 2024 and last June. Beyond that, a move toward $92–$93 is not out of the question.
For Fibonacci watchers, the 38.2% retracement of the March 2022 high to the December 2025 low comes into focus slightly above $82. Meanwhile, the 61.8% retracement level sits just shy of the $100 mark.
XOM & XLE Flash Clear Bullish Signals
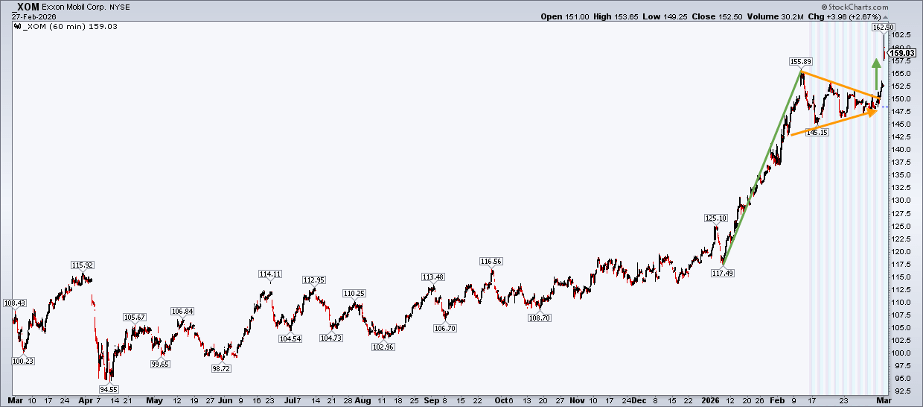
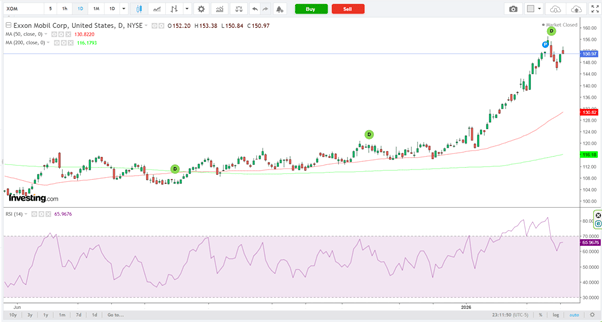
Another way to capture both relative strength and absolute momentum in the energy complex is through energy equities. My preferred name there is Exxon Mobil (NYSE: XOM). Back in December, I highlighted $155 as an achievable target based on developing chart formations. The stock reached that level swiftly, peaking near $157 before retracing to around $145. Ahead of the weekend’s geopolitical flare-up, a daily bull flag appeared to be resolving in favor of the bulls.
Although not flawless, the “Extended Hours” feature on StockCharts SharpCharts helps assess more detailed after-hours and pre-market price action. That broader view shows how a pattern of lower highs and higher lows paved the way for a breakout within a larger uptrend. On Monday, XOM gapped sharply from $152.50 to $160.
A fresh measured-move target of $188 is now in play, derived from the January–February advance projected from the $150 consolidation breakout. That said, a price gap remains just above $150, and it could be revisited if West Texas Intermediate stalls near the previously mentioned downtrend resistance.
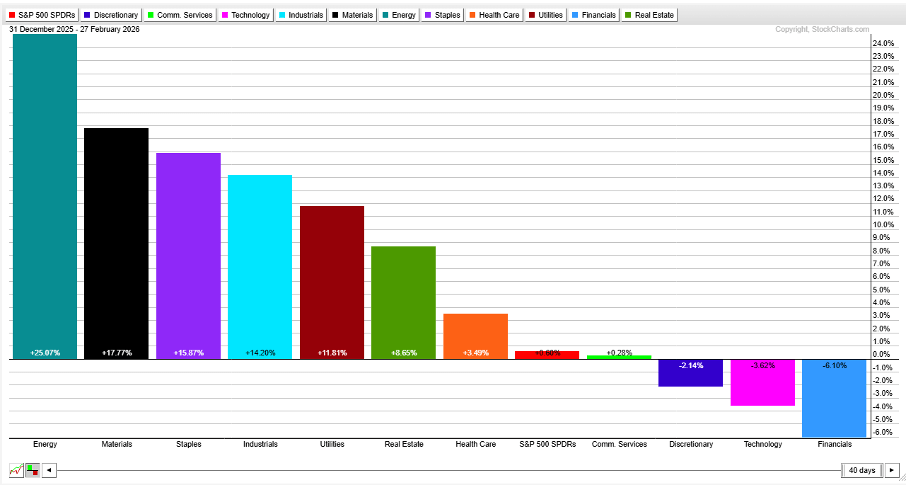
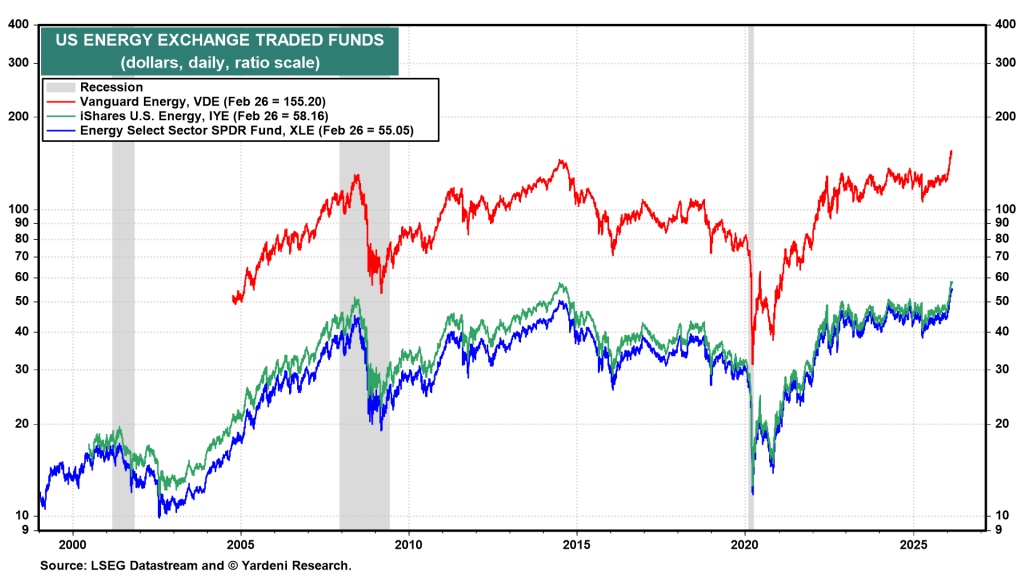
More broadly, Energy has emerged as the clear leader among the 11 S&P 500 sectors, outperforming by a wide margin. The group was up 24.4% year-to-date through February.
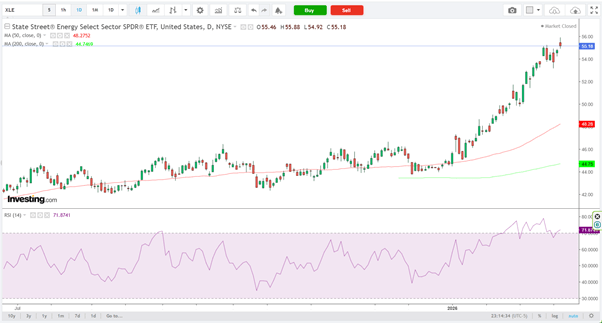
The Energy Select Sector SPDR Fund surged 25% in the first two months of the year, marking its strongest consecutive two-month performance since October–November 2022, when it rebounded sharply off the bear market lows.
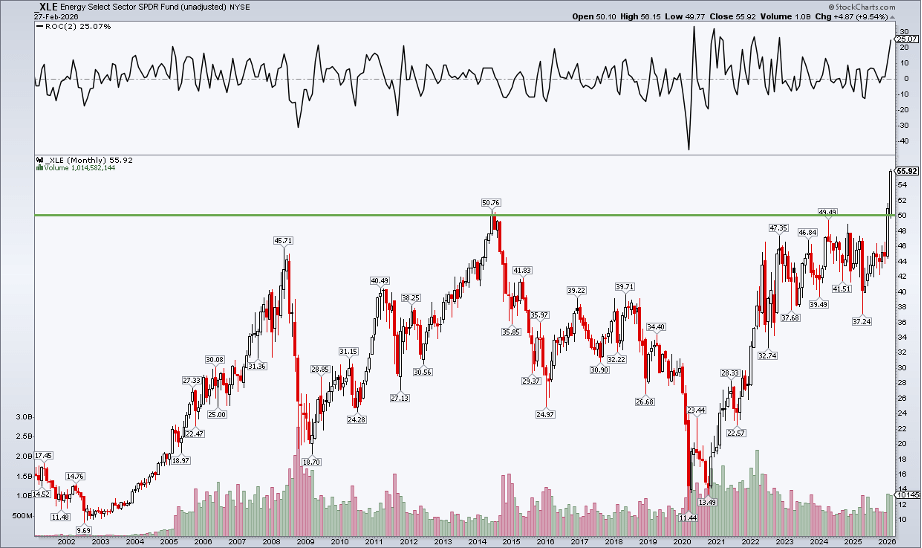
Like its largest holding, Exxon Mobil, the bulls seem firmly in control of the Energy Select Sector SPDR Fund. The monthly chart suggests that once the $50–$51 resistance zone was cleared, momentum accelerated decisively. A long-term objective in the low $90s appears achievable, measured by the magnitude of the 2014–2020 decline, the rebound to $50, and the early-2026 breakout to fresh highs.
Depending on how March plays out, XLE could be on track for its strongest quarterly gain ever.
The Bottom Line
Traders were fixated on futures screens at 6 p.m. ET Sunday, as Brent Crude surged 13% on the open and West Texas Intermediate briefly climbed toward $75. Early profit-taking tempered the initial spike, yet volatility across the energy complex remains elevated. While U.S. crude is running into near-term resistance, longer-term charts continue to show constructive strength in energy stocks.
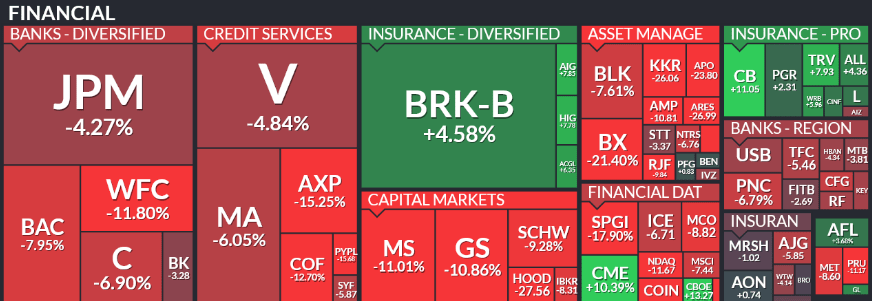
The heatmap below, via Finviz, highlights one-month returns across the S&P 500 financial sector. Notably, Berkshire Hathaway (NYSE: BRK.B) and several insurers have posted gains, while most other financial names have lagged. For comparison, the broader index declined 2.80% over the same stretch. Three key forces appear to be weighing on the group:
Yield Curve Pressure:
Banks typically fund themselves through short-term deposits and CDs while extending longer-term loans. As a result, the slope of the yield curve directly affects net interest margins. Recently, the curve has flattened by roughly 25 basis points, compressing margins and dampening earnings prospects.
Credit Concerns:
As discussed in Monday’s commentary, stress is building in the private credit market due to rising loan losses and potential fraud. Major institutions such as Goldman Sachs and Morgan Stanley are significant participants in that space. Turbulence in private credit is now spilling over into banks and brokers more broadly. At the same time, consumer delinquencies are trending higher, adding to sector-wide risk.
Credit Card Competition:
Payment leaders Visa (NYSE: V) and Mastercard (NYSE: MA), long viewed as possessing durable competitive advantages, are facing mounting competition from lower-cost payment alternatives. Real-time payment rails, account-to-account transfers, and fintech platforms are increasingly bypassing traditional card networks and their interchange fees. Investors are beginning to question the sustainability of their pricing power.
Taken together — margin compression, mounting credit risks, and intensifying payment competition — the financial sector currently lacks a compelling catalyst for sustained outperformance.
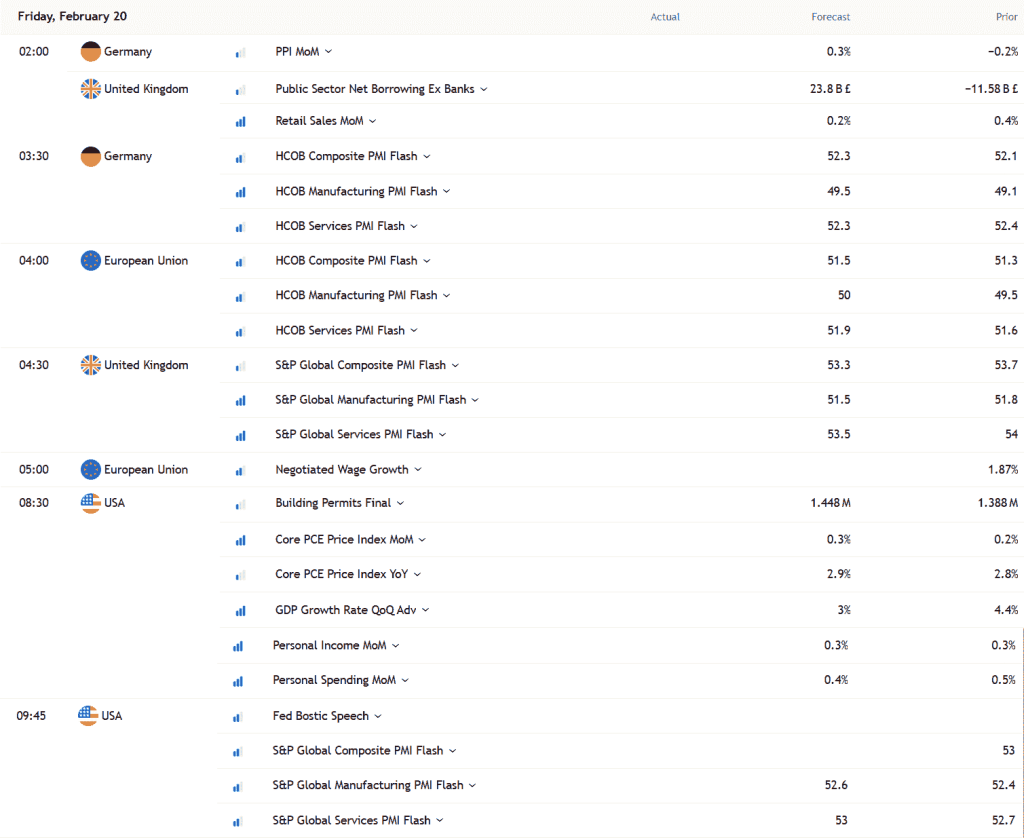
Key Things to Monitor Today
Earnings
Economy
No major economic data releases today.
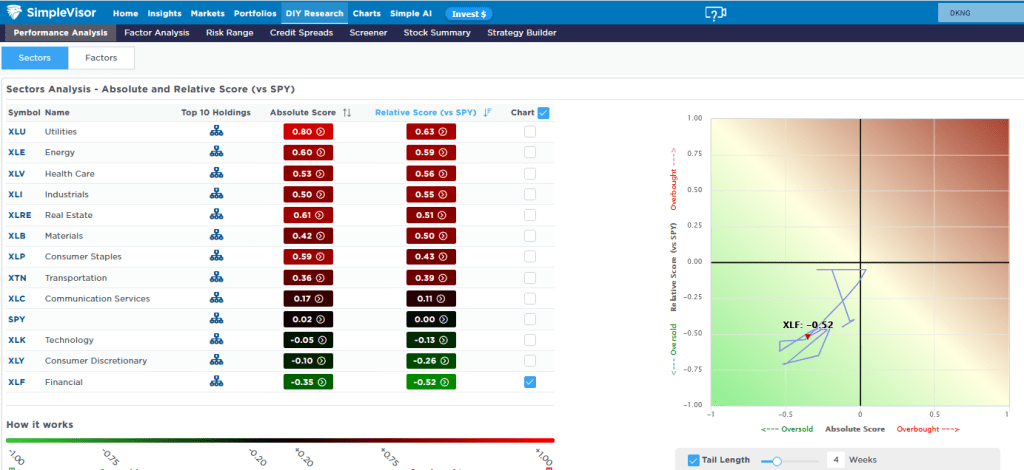
Financial Stocks Are Losing Momentum
Building on the opening section, the financial sector has been the weakest performer over the past five days. The first chart highlights that it has lagged the S&P 500 by 3.00% during that span, following an additional 2.84% underperformance in the preceding 20-day period.
The second chart shows that the Financial Select Sector SPDR Fund (XLF) continues to churn in the lower-left quadrant, indicating that both its absolute technical score and its relative strength versus the S&P 500 remain in oversold territory.
As noted earlier, three primary factors are pressuring the financial sector, and there is no clear near-term fundamental catalyst to shift the tone.
WTI crude surged over 6%, climbing back above the $75 level amid heightened market tension.
Oil prices have shot up as fears grow that the escalating US-Iran conflict could disrupt global supply chains.
Goldman Sachs suggests the market is currently pricing in roughly an $18 per barrel geopolitical risk premium on crude.
West Texas Intermediate (WTI) jumped more than 6% on Tuesday, pushing past the key $75 threshold as the intensifying US–Iran conflict stoked concerns over possible supply disruptions via the Strait of Hormuz.
At the time of writing, the US crude benchmark is hovering near $76.16 — its highest level since June 2025.
Roughly 20% of global oil shipments pass through the Strait of Hormuz, underscoring its status as a critical energy chokepoint. Senior figures from Iran’s Islamic Revolutionary Guard Corps (IRGC) reportedly announced the closure of the strait, warning that any vessel attempting to transit could be “set ablaze.”
Amid escalating security risks, many shipowners have suspended passage through the corridor, with several tankers waiting outside the waterway. In addition, Saudi Aramco has halted operations at its Ras Tanura refinery after a drone strike in the vicinity. The site has a processing capacity of approximately 550,000 barrels per day.
According to a Reuters report on Monday, Goldman Sachs estimates that oil prices currently include an $18 per barrel real-time geopolitical risk premium, based on a note issued Sunday. The bank added that the premium could ease to about $4 per barrel if only half of the Strait of Hormuz’s flows are disrupted for one month.
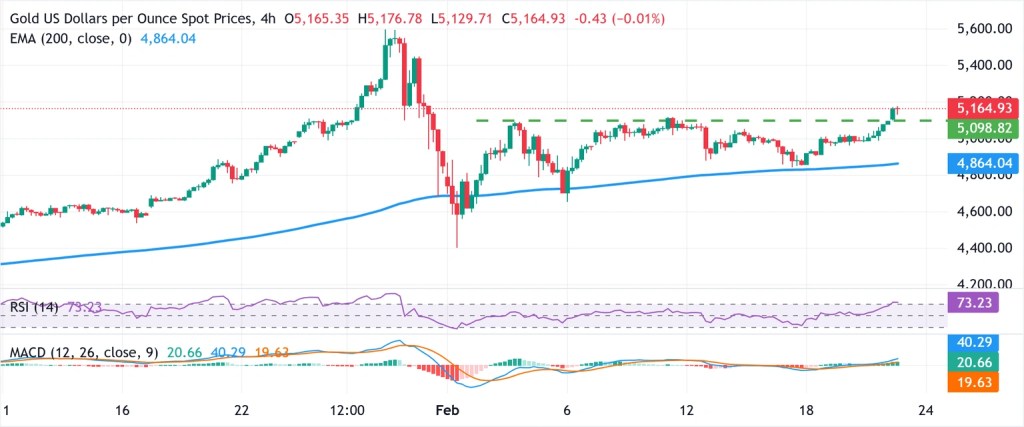
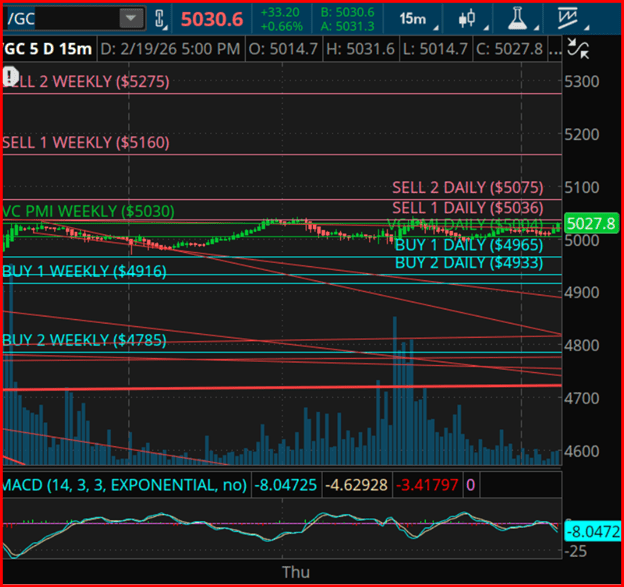
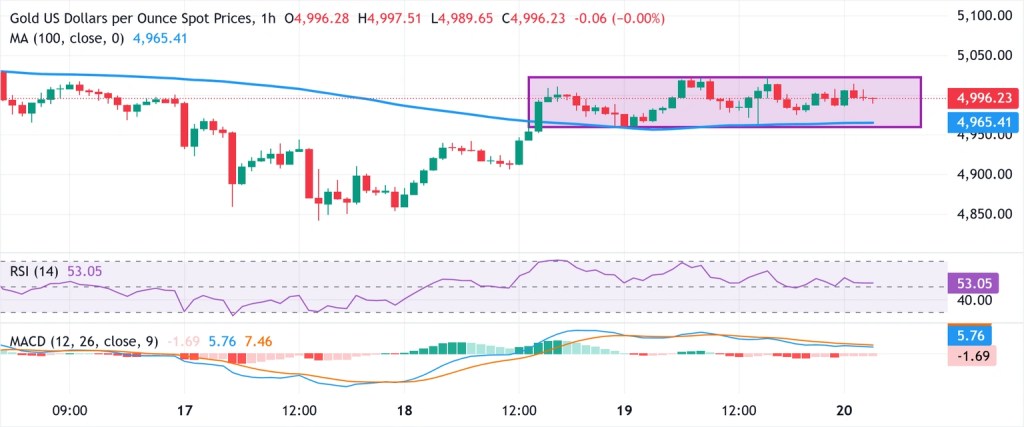
Gold prices tumble toward $5,180 despite the ongoing conflict in the Middle East. Tehran has stepped up military operations near the Strait of Hormuz in retaliation against the United States, escalating regional tensions. At the same time, stronger-than-expected US factory inflation data has prompted traders to scale back expectations of near-term Federal Reserve rate cuts.
During Tuesday’s European session, XAU/USD declined roughly 2.5% to trade near $5,180. The pullback follows four consecutive days of gains, including a sharp rally on Monday when investors sought safe-haven assets amid intensifying geopolitical risks.
Over the weekend, the United States and Israel carried out coordinated airstrikes on Iran, reportedly eliminating several senior leaders, including Supreme Leader Ayatollah Ali Khamenei.
In response, Tehran shut down the Strait of Hormuz and launched attacks on Israeli territory as well as multiple US military installations across the region. Earlier Tuesday, Iranian forces also targeted the US Embassy in Riyadh using drones.
Although gold typically benefits from heightened geopolitical uncertainty, the metal has come under pressure as expectations for a dovish Federal Reserve have moderated. According to the CME FedWatch Tool, the probability that the Fed will keep interest rates unchanged at its June meeting has risen to 53.5%, up from 42.7% on Friday.
Traders reassessed their rate-cut expectations following Monday’s release of the US ISM Manufacturing Prices Paid index for February. The inflation gauge, which measures changes in input costs such as labor and raw materials, surged to 70.5—well above forecasts of 59.5 and the prior reading of 59.0—signaling stronger price pressures at the factory level.
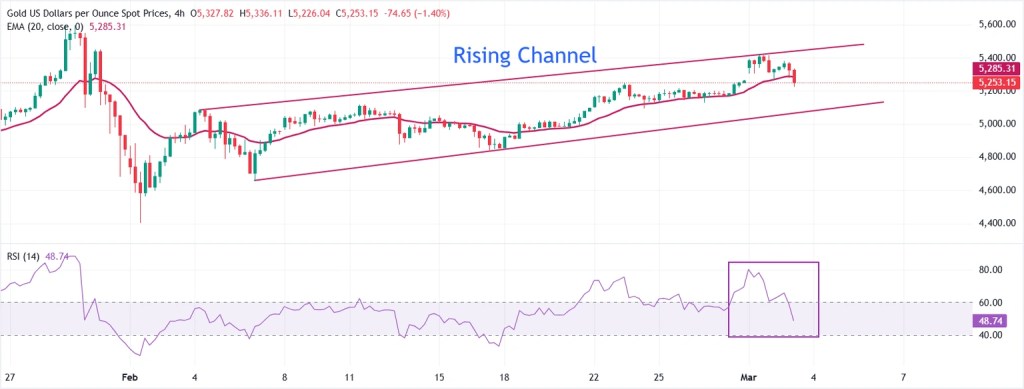
Gold (XAU/USD) 4-Hour Chart Analysis
XAU/USD is trading below $5,200 at the time of writing. The short-term outlook has shifted to neutral with a bearish bias after the pair retreated from the upper boundary of its Rising Channel formation near $5,400 and moved back toward the 20-period Exponential Moving Average (EMA), currently positioned around $5,280.
Momentum indicators reinforce the weakening bullish tone. The 14-period Relative Strength Index (RSI) has fallen sharply from overbought territory above 80 to approximately 49, signaling a clear loss of upside momentum and diminishing buying pressure.
On the downside, immediate support is located near $5,065, aligning with the lower boundary of the Rising Channel. A decisive break beneath this level could expose the psychological $5,000 mark. Conversely, on the upside, the upper boundary of the Rising Channel remains the primary resistance zone, just above $5,400.
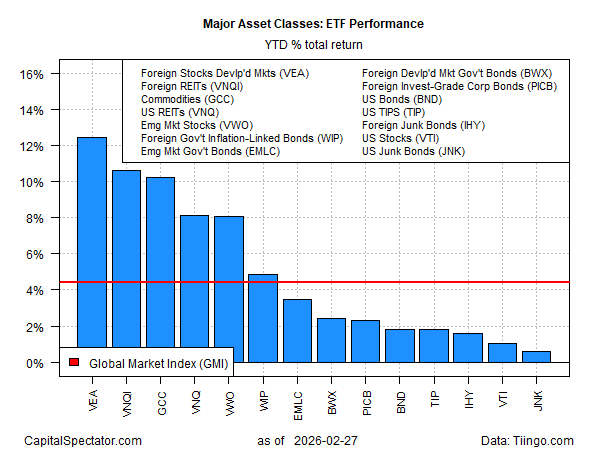
All major asset classes were still showing positive year-to-date returns as of Friday’s close. However, market conditions can shift dramatically over a single weekend.
The ongoing joint U.S.–Israel military operation against Iran is expected to persist for days, potentially even weeks. While the longer-term market impact remains uncertain, it is reasonable to expect that the prevailing bullish sentiment — already exhibiting signs of exhaustion in certain segments — may become another casualty of escalating tensions in the Middle East.
Through February 27, foreign equities and commodities had emerged as the top performers in 2026, based on ETF benchmarks. Yet assumptions that seemed firmly grounded just a week ago now appear outdated in light of rapidly evolving geopolitical developments.
The central issue now is the degree of vulnerability facing the global economy. In short, the longer the conflict persists, the greater the risk of economic blowback. At present, the likelihood of a swift resolution appears limited, particularly as the war expands across the Middle East, including Iran’s strike on Saudi oil infrastructure.
According to Torbjorn Soltvedt, an analyst at Verisk Maplecroft, the attack on Ras Tanura Refinery represents a meaningful escalation, placing Gulf energy infrastructure directly in Iran’s crosshairs. He noted that a prolonged period of instability is likely, as Iran attempts to inflict economic pressure by targeting tankers, regional energy facilities, trade corridors, and U.S. security partners.
Should the conflict drag on and oil prices remain elevated, the global economic impact could be substantial. In 2025, approximately 31% of all seaborne crude shipments passed through the Strait of Hormuz, according to analytics firm Kpler. Given Iran’s strategic positioning, it retains the capacity to disrupt — if not completely halt — shipping flows through this critical chokepoint.
Norbert Rücker, head of economics at Julius Baer, emphasized that the broader economic consequences hinge largely on the uninterrupted flow of oil and gas through Hormuz. The gravest risk, he suggested, is not necessarily a full closure, but significant damage to key regional energy infrastructure.
Kpler further cautioned that any meaningful shutdown — or even a prolonged de facto closure driven by insurers withdrawing coverage — would likely trigger simultaneous supply shocks across multiple commodity markets.
How long the conflict will endure remains highly uncertain. On Sunday, Donald Trump indicated that the military campaign could last “four weeks or less,” though such timelines in geopolitical conflicts are often fluid.
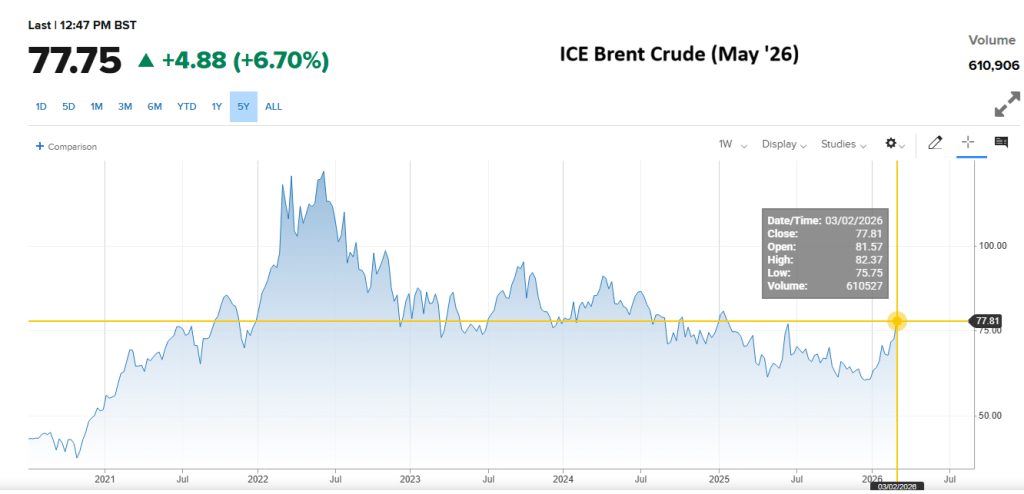
Energy markets are already reacting. Crude prices are climbing, with the international Brent Crude benchmark trading near $78 per barrel this morning — its highest level in more than a year.
The Trump administration’s stated objective of pursuing regime change in Iran points to the possibility of a protracted conflict. On Sunday, Donald Trump urged “Iranian patriots who yearn for freedom” to seize the moment and reclaim their country — rhetoric that signals ambitions extending beyond limited military strikes.
However, achieving regime change would be extraordinarily difficult. Although Iran’s Supreme Leader, Ali Khamenei, was reportedly killed in Saturday’s airstrikes, the Islamic Revolutionary Guard Corps remains a formidable power center. The Revolutionary Guard — Iran’s dominant military institution with vast economic holdings that help finance its operations — has likely prepared for sustained confrontation following years of tensions and prior strikes by the U.S. and Israel. Airpower alone is unlikely to dismantle what amounts to the regime’s praetorian guard.
According to Jonathan Panikoff, now affiliated with the Atlantic Council, the decisive factor will ultimately be internal dynamics. Once U.S. and Israeli strikes subside, any movement to end the regime would depend on whether rank-and-file security forces stand aside or align with popular unrest. Otherwise, those elements of the regime that retain control of weapons are likely to use force to preserve power.
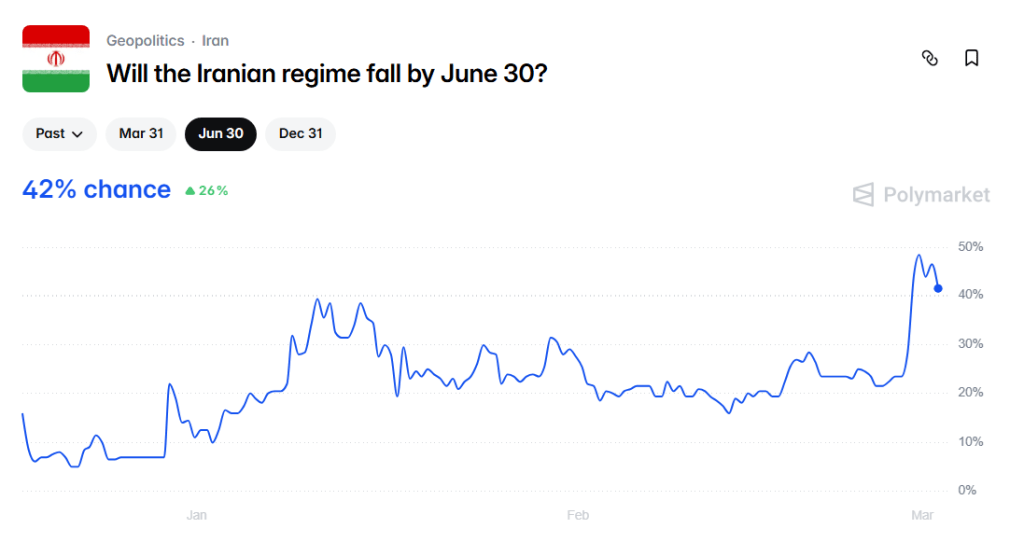
Regime change in Iran is currently viewed as only moderately probable. Betting markets on Polymarket assign roughly a 42% likelihood to that outcome. The takeaway: expectations for a swift resolution appear limited, with the conflict likely to persist until one side concedes strategic ground.
However, the longer-term outlook may look different. Sanam Vakil, director of the Middle East and North Africa Program at Chatham House, argues that over time the survival of the Islamic Republic in its current form is doubtful. In his assessment, the regime as it exists today may ultimately prove unsustainable.
If that scenario unfolds, the central question shifts to succession: what replaces the current leadership — and whether any transition ushers in greater stability or instead fuels further instability within Iran and across the broader Middle East.
The world’s most critical oil chokepoint has effectively gone offline — and energy markets are adjusting instantly.
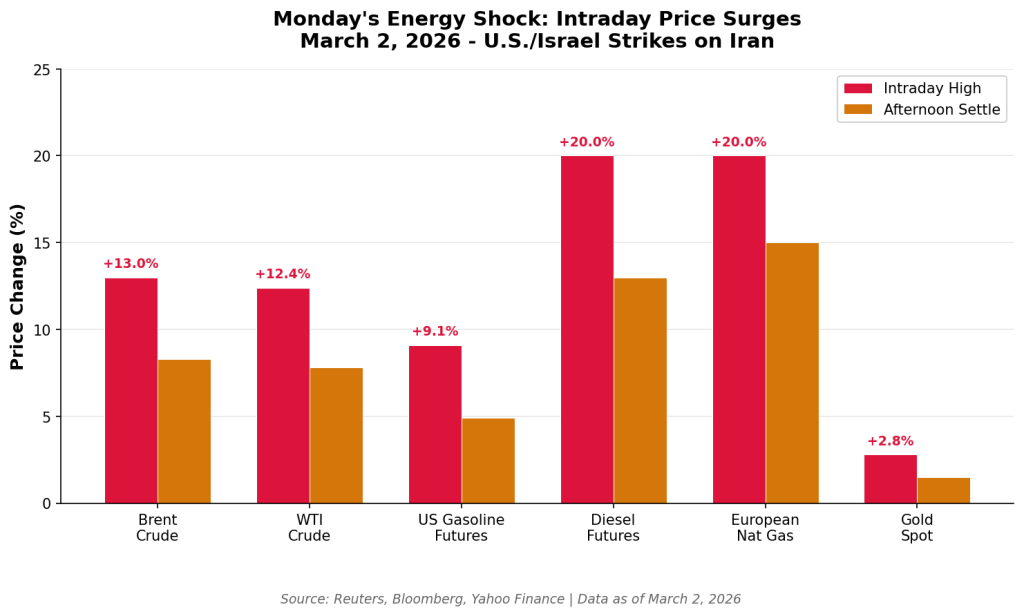
Brent crude surged 13% to $82.37 per barrel on Monday morning, marking its largest one-day jump in four years. The rally followed coordinated U.S. and Israeli airstrikes on Iran over the weekend — an operation the Pentagon has labeled Operation Epic Fury. The strikes killed Supreme Leader Ali Khamenei, ending his 36-year rule and plunging the Islamic Republic into its most severe political upheaval since 1979. Tehran responded swiftly, launching attacks on U.S. bases across the region and, more critically for global markets, targeting oil tankers moving through the Strait of Hormuz.
That narrow passageway handles roughly 20% of global oil flows each day. By Monday morning, it was effectively shut. Maersk suspended all vessel transits. Over 200 oil and LNG carriers dropped anchor. Iran’s Islamic Revolutionary Guard Corps reportedly warned ships that no vessels would be permitted to pass. This is no longer rhetoric — it is a tangible supply shock.
Why the Oil Outlook Has Fundamentally Shifted
Oil markets are accustomed to geopolitical tension. They have repeatedly absorbed headlines without lasting disruption. What they cannot easily digest is the sudden loss of one-fifth of global supply with no clear timeline for restoration.
Just days ago, Brent was trading near $73, and the prevailing narrative centered on excess supply. The U.S. Energy Information Administration projected WTI crude would average $53 by year-end. OPEC+ was discussing potential production increases. Market bears appeared firmly in control.
That backdrop has flipped. Brent settled near $79 after briefly touching $82, while WTI climbed from $67 on Friday to $72. Diesel futures — a key barometer of industrial activity — spiked more than 20% intraday. U.S. gasoline futures advanced 9% to their highest level since July 2024. According to GasBuddy analyst Patrick De Haan, retail gasoline prices could rise by 10 to 30 cents per gallon in the near term, with some stations potentially increasing prices by as much as 85 cents.
The market is no longer pricing geopolitical risk. It is pricing physical disruption.
“The magnitude of the retaliation caught the market completely off guard,” said Jorge Leon, head of geopolitical analysis at Rystad Energy. “This is far removed from what investors had been pricing in.”
OPEC+ attempted to ease concerns on Sunday by announcing a relatively small output increase of 206,000 barrels per day for April. However, as Helima Croft of RBC Capital Markets noted, incremental barrels offer limited relief if transport routes remain compromised. “Accessing spare capacity becomes highly constrained when key waterways are effectively shut down,” she wrote.
From a broader market perspective, Dominic Wilson of Goldman Sachs emphasized that equities will be driven less by dramatic headlines and more by the duration of the energy shock. In a client note, he argued that only a prolonged and severe spike in oil prices would materially alter the global growth trajectory.
Meanwhile, analysts at JPMorgan outlined four key variables shaping the outlook: the scale of supply disruption, the length of the outage, the speed at which alternative production can be activated, and the credibility of a diplomatic resolution. On Sunday, Donald Trump suggested U.S. military operations could extend for “four to five weeks” — a timeframe that implies a potentially sustained period of elevated risk for energy markets.
How to Position for the Oil Shock
Energy equities are the clearest near-term beneficiaries, and capital is already rotating aggressively into the space. The Energy Select Sector SPDR Fund (XLE) notched a fresh 52-week high on Monday. Below are five vehicles to consider:
Exxon Mobil (XOM)
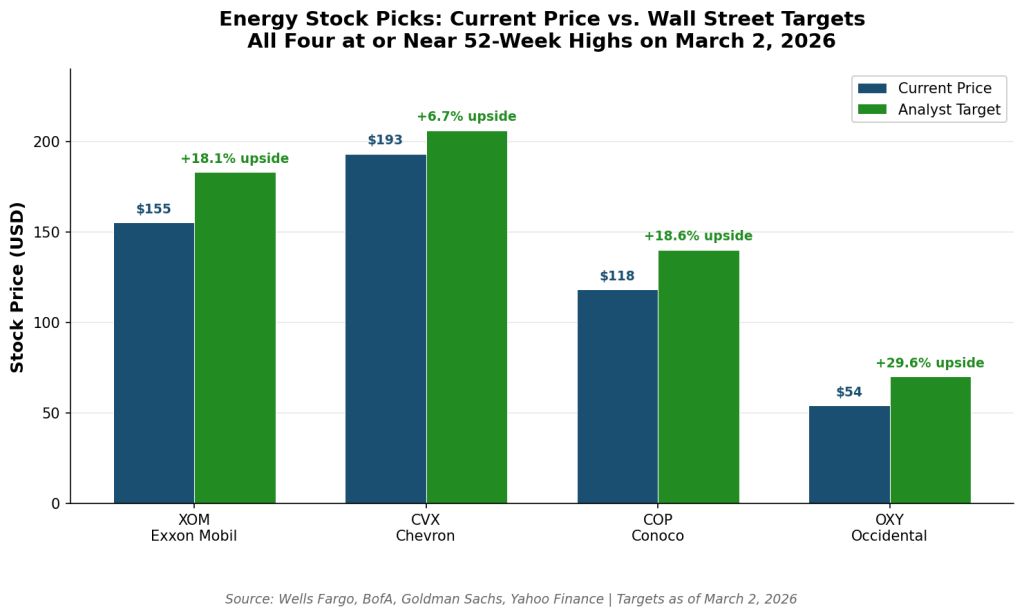
Trading near $155, just shy of its all-time high of $156.93, Exxon represents the most diversified large-cap exposure to elevated crude prices. The company produced 4.7 million barrels of oil equivalent per day last quarter, exceeded Q4 expectations with EPS of $1.71, and has earmarked $20 billion in buybacks for 2026.
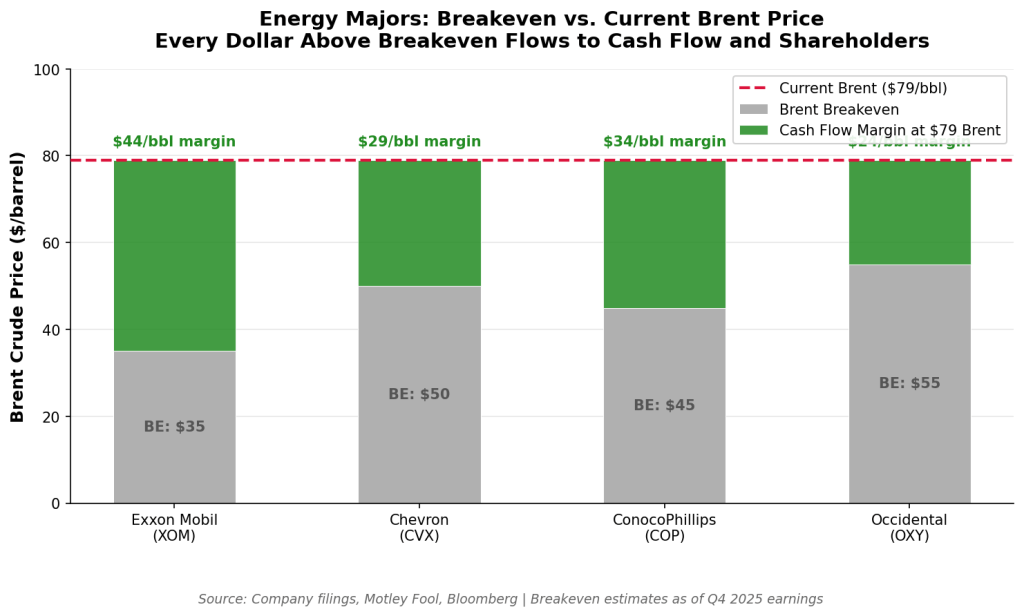
Wells Fargo recently lifted its price target to $183 from $156. CEO Darren Woods reiterated on the latest earnings call that there is “no near-term peak Permian” for the company. With Permian breakevens around $35 per barrel and production in Guyana scaling, incremental oil price gains translate efficiently into free cash flow expansion.
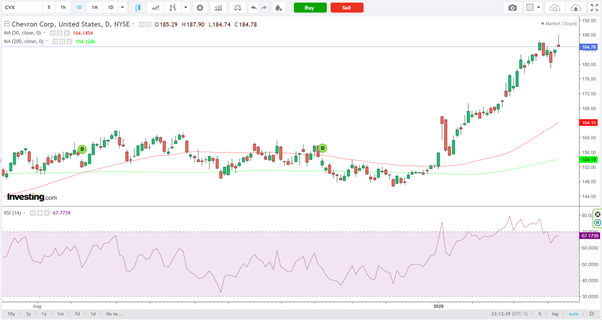
Chevron (CVX)
Shares briefly reached a new 52-week high of $196.76 before closing near $193. Chevron’s estimated Brent breakeven — inclusive of dividends and capex — sits near $50 per barrel. At current levels around $79 Brent, the company is generating substantial surplus cash.
Bank of America raised its target to $206 from $188. Chevron is also reportedly in exclusive discussions to assume control of Iraq’s West Qurna 2 field from Lukoil, a move that would add meaningful production upside. CEO Mike Wirth recently characterized the company as “bigger, stronger, and more resilient than ever.”
ConocoPhillips (COP)
Up nearly 4% to roughly $118 and marking a new 52-week high, ConocoPhillips offers more direct leverage to crude prices given its pure upstream model.
Goldman Sachs added COP to its U.S. Conviction Buy List, arguing the stock is approaching a material re-rating. The Marathon Oil integration is enhancing scale, while a $2 billion asset divestiture is sharpening its Permian focus. At current oil prices, COP is generating approximately $7 in EPS, implying a sub-17x multiple — reasonable for a commodity cycle inflection.
Occidental Petroleum (OXY)
Trading near $54, Occidental offers higher beta exposure. Its more levered balance sheet amplifies upside in a sustained higher-price environment.
Berkshire Hathaway holds roughly 28% of the company, providing a credibility anchor via Warren Buffett’s long-term endorsement. While the Carbon Engineering acquisition adds energy-transition optionality, the immediate thesis is straightforward: if Brent sustains levels above $80, OXY’s earnings power expands rapidly, making a $70+ valuation plausible under that scenario.
Energy Select Sector SPDR Fund (XLE)
For investors seeking diversified sector exposure without single-name volatility, XLE remains the default allocation. Trading near $93 and at a 52-week high, the ETF is heavily weighted toward Exxon (~22%), Chevron (~17%), and ConocoPhillips (~8%), which together account for nearly half the portfolio.
XLE provides integrated exposure across oil, gas, and energy services in a single vehicle. Should the conflict extend for several weeks — as suggested by Donald Trump — the entire sector could undergo a structural repricing higher.
The Bear Case You Can’t Ignore
History shows that geopolitical shocks often produce violent spikes followed by equally sharp reversals. During the June 2025 “12-day war” between Israel and Iran, crude initially surged but retraced quickly once it became clear that physical supply flows were unaffected.
While this episode involves direct tanker strikes and the functional closure of the Strait of Hormuz, some analysts still see a limited-duration event. Max Layton of Citigroup argues the base case is a leadership shift in Tehran that brings the conflict to an end within one to two weeks.
A similar view comes from Landon Derentz at the Atlantic Council. He notes that regional energy infrastructure remains intact and that global supply capacity has not been structurally damaged. The oversupply dynamics that capped prices before the conflict have not disappeared. If Hormuz reopens quickly, crude could surrender much of its recent gains.
The Inflation Risk
There is also a macro layer that complicates the bullish narrative. Sustained higher oil prices feed directly into transportation, manufacturing, and consumer input costs. That dynamic could constrain the Federal Reserve, forcing policymakers to delay or abandon anticipated rate cuts.
Monday’s Institute for Supply Management manufacturing data showed input costs rising at their fastest pace since 2022. Treasury yields have begun to move higher in response. If oil remains elevated long enough to reignite inflation pressures, the Fed’s stance could shift from easing to holding — a headwind for equities broadly, even if energy stocks outperform on relative terms.
A Structural Repricing of Risk
That said, even a swift diplomatic resolution would not fully reset the clock. Markets were effectively assigning near-zero geopolitical risk premium to oil prior to this weekend. That complacency has been challenged.
Energy equities were already trading at modest multiples relative to free cash flow. Now they have a tangible catalyst. Even if the conflict de-escalates quickly, the perception of risk — and the embedded premium in crude pricing — is unlikely to vanish overnight.
What to Watch
Three catalysts in the next 72 hours. First, Iran’s response — Tehran’s next move over the next 24 to 48 hours will determine whether this is a two-week shock or a multi-month crisis. Any strikes on Saudi or UAE energy infrastructure pushes Brent toward $90 or beyond.
Second, the Strait of Hormuz reopening timeline. If shipping insurance companies begin covering Hormuz transits again this week, oil pulls back. If the effective closure extends past Friday, the supply disruption becomes real and sustained — and $80+ becomes the new floor.
Third, the U.S. Strategic Petroleum Reserve. The IEA said Monday it’s in contact with major producers about potential coordinated reserve releases. Any SPR drawdown announcement would cap oil’s upside temporarily but wouldn’t change the structural supply picture.
The energy sector just went from afterthought to the most important trade in the market. Whether this conflict lasts two weeks or two months, the companies producing oil at $35 to $50 breakevens and generating massive free cash flow at $70 to $80 Brent are going to reward shareholders. The question isn’t whether to own energy — it’s how much.
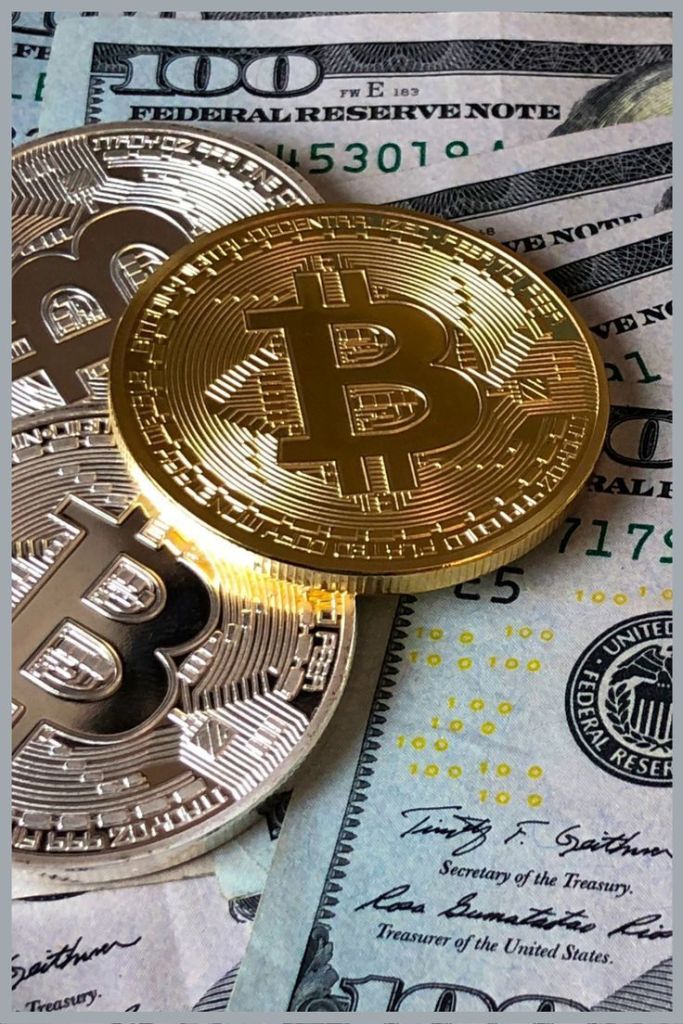
Bitcoin rebounded on Monday, recovering from losses triggered by U.S. strikes on Iran over the weekend. The cryptocurrency’s advance mirrored a broader recovery in equity markets.
The world’s largest digital asset was up 5.7% at $69,428.4 as of 16:40 ET (21:40 GMT).
Bitcoin rebounds after weekend selloff
Bitcoin had dropped sharply after coordinated U.S. and Israeli military operations in Iran reportedly resulted in the death of Supreme Leader Ayatollah Ali Khamenei, marking one of the most severe regional escalations in recent years.
Iran responded with several waves of missile attacks targeting Israeli and U.S. military facilities.
Following the initial strikes, Bitcoin tumbled to around $63,000 before stabilizing and beginning to recover.
According to Dessislava Ianeva, analyst at Nexo Dispatch, Bitcoin held relatively steady as markets evaluated the evolving U.S.–Iran situation. While prediction markets remain split on the likelihood of further escalation, the limited price reaction indicates investors currently see the conflict as a contained, short-term risk rather than the beginning of a sustained downturn.
President Donald Trump stated Monday that the military operation had four key goals: dismantling Iran’s missile capabilities, destroying its navy, preventing the country from acquiring nuclear weapons, and stopping Tehran from supporting and directing terrorist activities.
“We’re already well ahead of schedule, but whatever time is required, that’s fine. We’ll do whatever it takes,” Trump said, adding that although initial projections suggested four to five weeks, the U.S. has the capacity to extend operations significantly if necessary.
Strategy adds $204 million in Bitcoin
Michael Saylor’s company Strategy expanded its Bitcoin holdings last week, purchasing 3,015 BTC valued at approximately $204.1 million, at an average price of about $67,700 per coin.
Following the acquisition, Strategy’s total Bitcoin holdings increased to 720,737 BTC, accumulated at a total cost of roughly $54.77 billion — averaging about $75,985 per Bitcoin.
Strategy remains the largest publicly traded corporate holder of Bitcoin, having steadily built one of the most substantial corporate crypto treasuries.
Altcoins track Bitcoin higher
Most major altcoins also moved higher alongside Bitcoin.
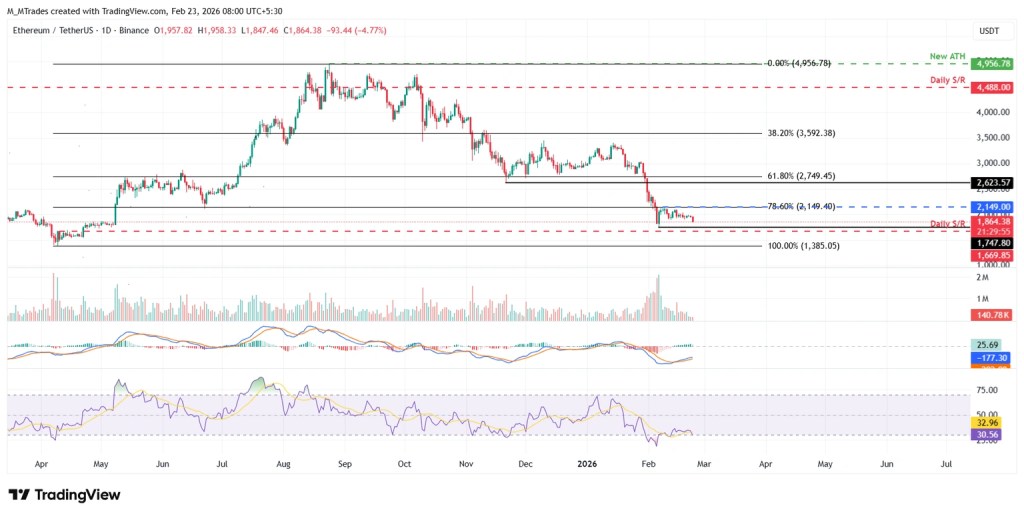
Ethereum, the second-largest cryptocurrency, climbed 6% to $2,045.01. XRP gained 2.9% to $1.3936, while Solana and Cardano rose 5.7% and 2.2%, respectively.
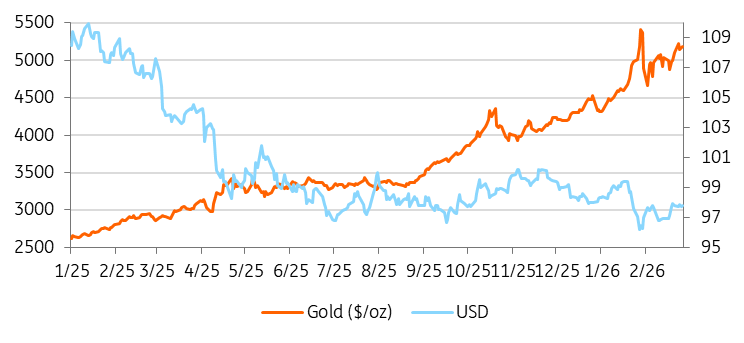
Gold prices climbed in Asian trade on Tuesday, marking a fourth consecutive session of gains as investors assessed the escalating conflict in the Middle East. However, strength in the U.S. dollar limited the metal’s upside momentum.
Spot gold advanced 1.1% to $5,378.55 per ounce as of 20:26 ET (01:26 GMT), while U.S. gold futures rose 1.5% to $5,390.06. The precious metal had already gained 1% in the prior session.
Widely regarded as a safe-haven asset during periods of geopolitical uncertainty, bullion attracted fresh demand following an intense weekend of military activity in West Asia.
Large-scale strikes by U.S. and Israeli forces targeted Iran, reportedly resulting in the death of Supreme Leader Ayatollah Ali Khamenei along with several senior military officials. Tehran responded with missile attacks across the region.
Tensions expanded beyond Iran, as Israeli forces carried out strikes in Lebanon after Hezbollah attacks, and reports emerged that Kuwaiti air defenses mistakenly shot down U.S. aircraft.
U.S. President Donald Trump indicated that military operations could persist for several weeks and acknowledged uncertainty within Iran’s leadership following Khamenei’s death, highlighting the risk of extended regional instability.
Tehran also threatened to target vessels transiting the strategically vital Strait of Hormuz—a key artery for global oil shipments—intensifying concerns over potential supply disruptions and reinforcing demand for defensive assets such as gold.
Crude prices surged on fears of supply constraints, fueling inflation expectations and underpinning gold’s appeal as a hedge. Nonetheless, gains in bullion were restrained by a firmer U.S. currency.
The U.S. Dollar Index edged up 0.2% during Asian hours after surging 0.8% in the previous session to its highest level since late January. A stronger dollar typically pressures gold by increasing its cost for holders of other currencies.
Elsewhere in the precious metals complex, silver rose 1.6% to $90.75 per ounce, while platinum gained 0.5% to $2,321.06 per ounce.
In recent weeks, the market has subtly reinforced several of the themes highlighted here:
Declining bond yields
Renewed momentum in silver and other hard assets
Relative strength in sectors like real estate and biotechnology
These were not random or disconnected developments. They were signals — and taken together, they point to an emerging macro shift.
Markets typically turn before the broader consensus catches on. At the moment, capital flows indicate that investors may already be adjusting their portfolios in anticipation of a new phase in the economic cycle.
Rotation Toward Safety and Scarcity
We’re seeing growing demand in two areas that rarely strengthen at the same time without signaling something deeper:
Bonds — pointing to expectations of slower growth, policy easing, or defensive positioning.
Hard assets — reflecting concern about persistent inflation, currency debasement, or long-term purchasing power.
That pairing is significant.
When investors buy both duration and tangible assets simultaneously, the underlying message isn’t optimism — it’s uncertainty. Specifically, uncertainty about economic stability and the durability of money itself.
What Equities May Be Signaling
Stock indices remain elevated, but leadership has narrowed and cross-sector confirmation is uneven.
Rather than pricing in robust, synchronized growth, equities appear to be grappling with shifting valuation frameworks:
Growth expectations lack clarity.
Policy direction remains fluid.
Liquidity assumptions are creeping higher again.
In short, equities don’t look decisively bullish — they look transitional, searching for a new equilibrium.
The Federal Reserve’s Potential Role
If economic momentum softens further, the Federal Reserve could come under pressure to cushion financial conditions through renewed balance sheet support or liquidity measures.
Historically, that backdrop creates a familiar tension:
Bonds rally on safety and easing expectations.
Hard assets climb on fears of currency dilution.
Equities struggle with valuation uncertainty.
Such an environment often tilts performance toward real assets over purely financial assets — at least for a period — as markets recalibrate to shifting macro conditions.
Inflation May Not Be Over
One risk that remains underappreciated is inflation not just in consumer goods, but in real-world assets (RWAs), including:
Commodities
Precious and industrial metals
Infrastructure
Scarce, tangible assets
If monetary easing begins before inflation is fully contained, asset-price inflation could reaccelerate — potentially persisting until an economic slowdown or contraction ultimately forces a reset.
At times, recession becomes the mechanism that restores equilibrium.
Bottom Line
Revisiting prior Daily themes isn’t about declaring victory — it’s about framing the present environment.
Markets may be shifting from liquidity-fueled optimism toward a more defensive, capital-preservation mindset.
Declining yields, strengthening silver, and resilience in defensive sectors could represent early signals that the investment landscape is transitioning into a more cautious regime.
The key question now isn’t whether markets were correct before.
It’s whether they are early — once again.
ETF Summary
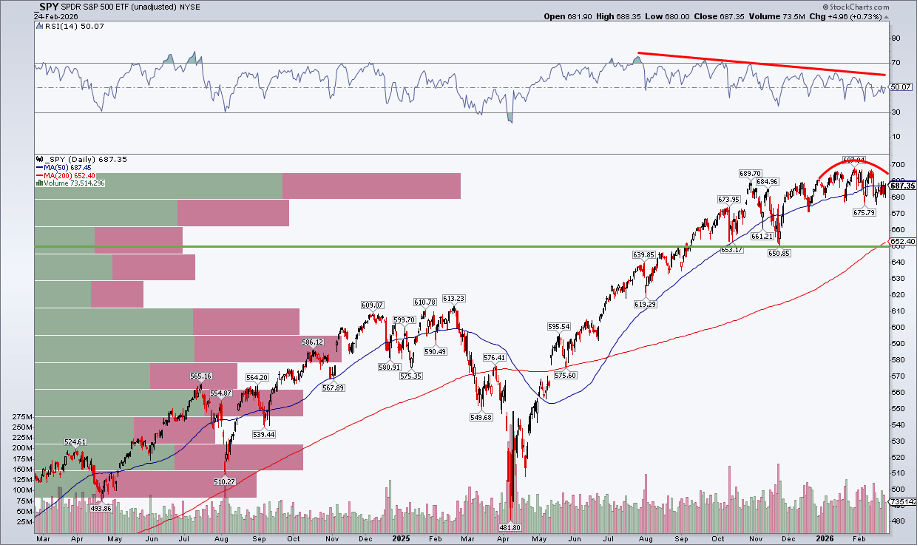
S&P 500 (SPY) – Price action is beginning to resemble a potential top, now slipping back below the 50-day moving average.
Russell 2000 (IWM) – Sitting right at the 50-DMA and still showing relative leadership versus large caps.
Dow Jones (DIA) – Has moved back into an unconfirmed caution phase.
Nasdaq 100 (QQQ) – Caution phase confirmed; key level to watch is 590 — it must hold to stabilize momentum.
Regional Banks (KRE) – Printed a notably negative candle, reminiscent of stress patterns seen in March 2023.
Semiconductors (SMH) – Remains a position of strength; critical to monitor whether this leadership group can maintain its resilience.
Transportation (IYT) – Consolidating in a constructive manner and continuing to hold support.
Biotechnology (IBB) – Healthy consolidation; if 171 holds, the setup suggests potential for further upside.
Retail (XRT) – Still below the 50-DMA. As a key economic “canary,” it must reclaim and hold 85 to improve the outlook.
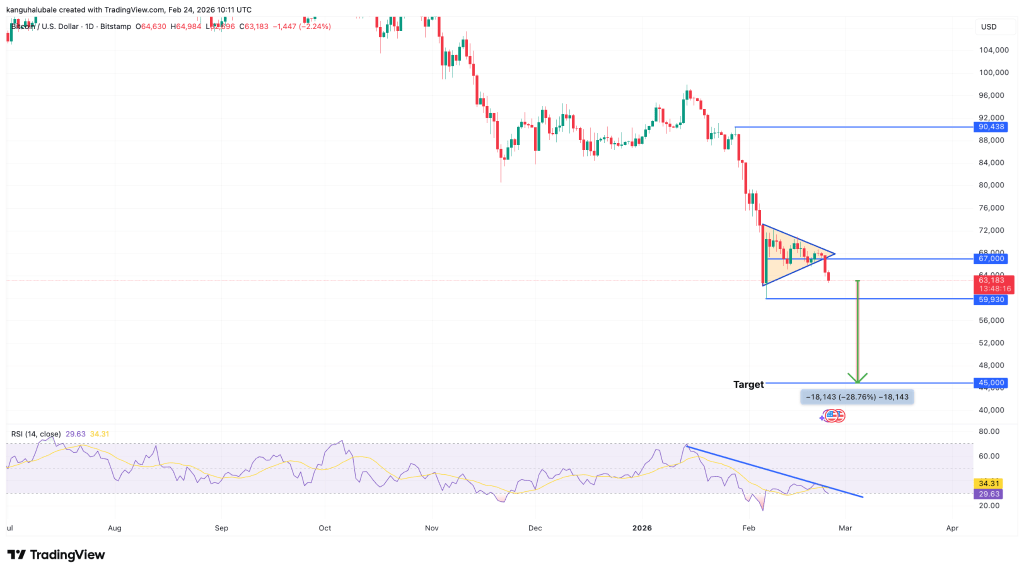
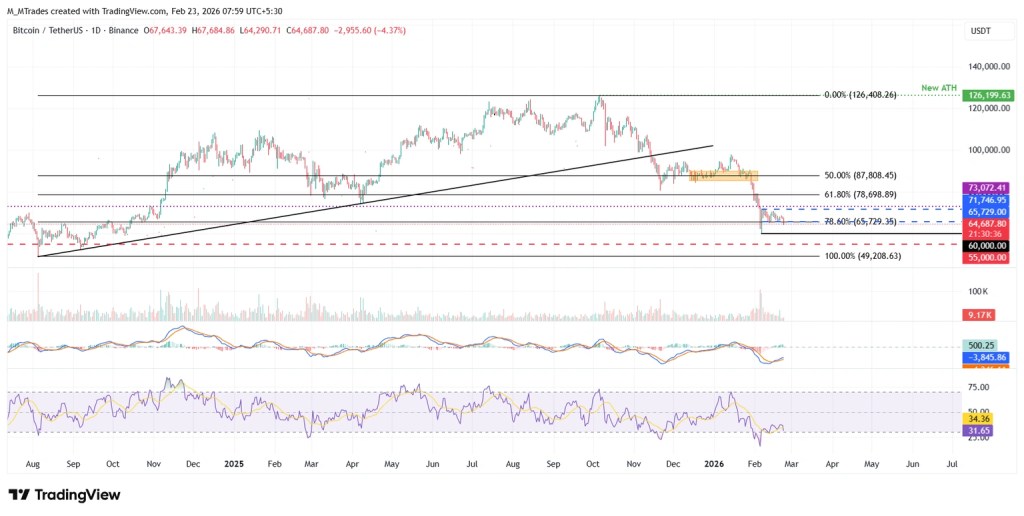
Bitcoin (BTCUSD) – The correction remains technically constructive as long as price stays above 64,000.
The United States has built up its most significant military footprint in the Middle East since 2003, deploying two aircraft carriers and F-22 stealth fighters. Indirect negotiations in Geneva between US envoys Steve Witkoff and Jared Kushner and Iranian officials concluded Thursday without progress. The Trump administration has cautioned that Iran will face “drastic consequences” if it fails to agree to meaningful nuclear concessions.
Israel has activated bomb shelters and warned Lebanon that its infrastructure could be targeted if Hezbollah becomes involved in any US–Iran confrontation. The US State Department authorized the departure of non-essential personnel and family members from the US Embassy in Israel on February 27, following similar instructions for the embassy in Beirut issued on February 23. Meanwhile, reports suggest the US 5th Fleet in Bahrain has been scaled back to fewer than 100 essential personnel.
China has urged its citizens to leave Iran immediately. South Korea escalated its advisory to a “Level 3” red alert, instructing nationals to depart. Australia has offered voluntary departure to diplomatic dependents in the UAE, Qatar, and Jordan, citing a worsening security environment. Several European countries, including Finland, Sweden, and Serbia, have also recommended that their citizens evacuate Iran.
Commercial carriers such as KLM have begun suspending regional flights. Governments are encouraging citizens to exit while commercial routes remain available, warning that air corridors could close quickly if hostilities erupt.
Does this mean a US–Israel strike on Iran is imminent? Possibly—but diplomatic channels remain active. The State Department confirmed that Secretary of State Marco Rubio will travel to Israel early next week. Meanwhile, reports indicate that Omani Foreign Minister Badr Al Busaidi is set to meet Vice President JD Vance and other US officials in Washington in previously undisclosed talks aimed at preventing escalation.
Oil markets are ending February on firm footing, with prices rising about $1 per barrel during the final trading week as tensions intensify. This week’s indirect talks in Geneva produced no tangible outcome, and Trump’s 10–15 day deadline is fast approaching. At the same time, attention to the upcoming OPEC+ summit has been muted—potentially opening the door for Saudi Arabia to surprise markets with another production increase for April.
The recovery in oil prices, combined with a reshuffling of global equity allocations, has recently delivered a notable lift to US energy ETFs (see chart). However, today’s modest $1.50 rise in crude suggests markets may have already priced in the risk of a swift conflict—or remain unconvinced that one is imminent.
Saudi Arabia could still opt to raise output, but much of that additional supply would need to transit the Strait of Hormuz, a critical chokepoint that Iran has repeatedly threatened to shut down.
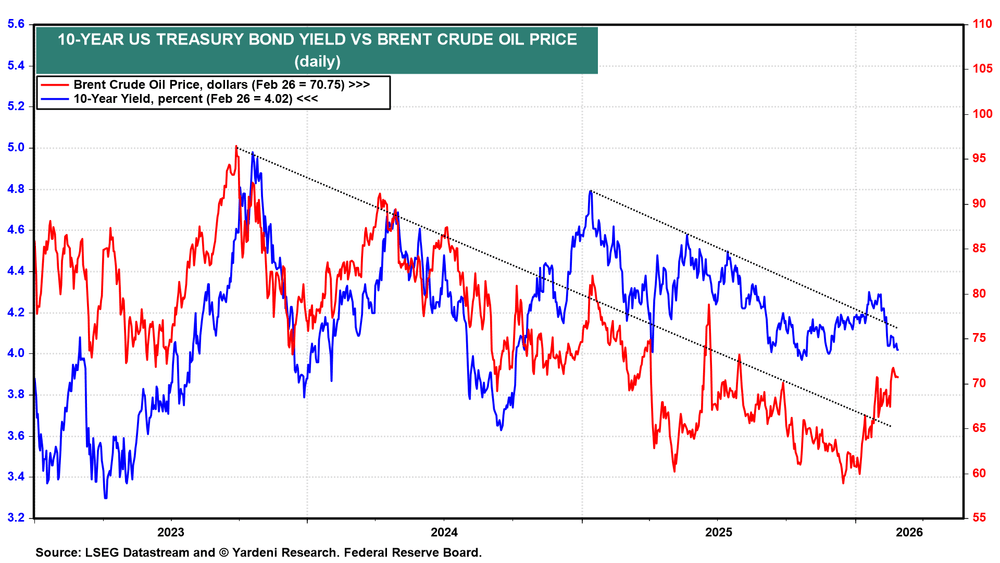
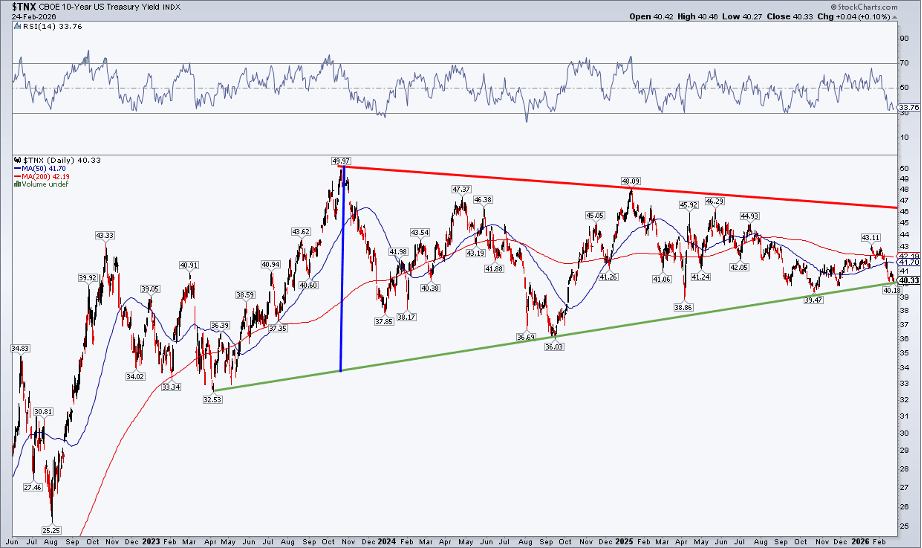
Between 2023 and 2025, the 10-year US Treasury yield moved largely in tandem with the price of Brent crude (see chart), reflecting a strong correlation between energy prices and long-term interest rates.
In recent weeks, however, that relationship has diverged. While oil prices have climbed, the 10-year yield has declined. This shift suggests that investors may be rotating into bonds as a safe haven, anticipating that a renewed conflict in the Middle East could trigger broader geopolitical instability and economic uncertainty.
It was notable that the 10-year yield slipped below 4.00% today, even after a stronger-than-expected PPI inflation print.
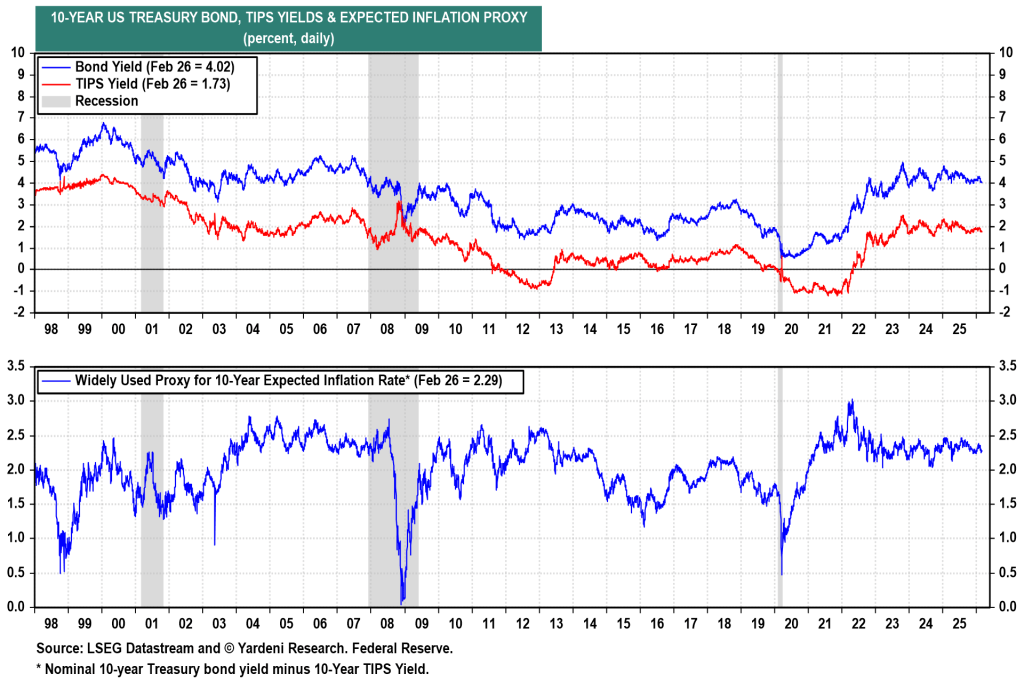
More broadly, both nominal and real 10-year yields have traded within a relatively narrow range since 2023 (see chart). In our view, that sideways pattern is likely to persist through the remainder of the year.
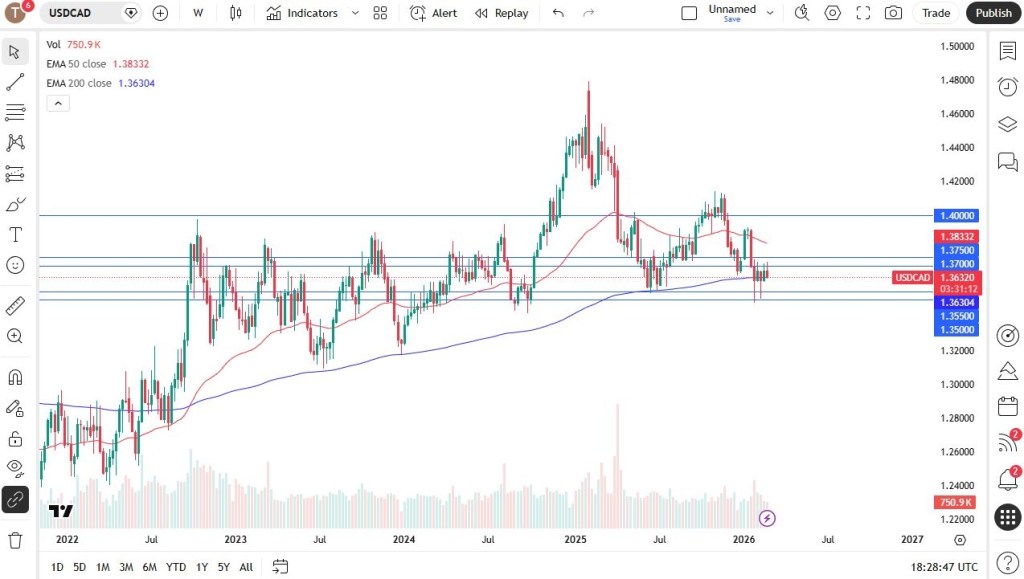
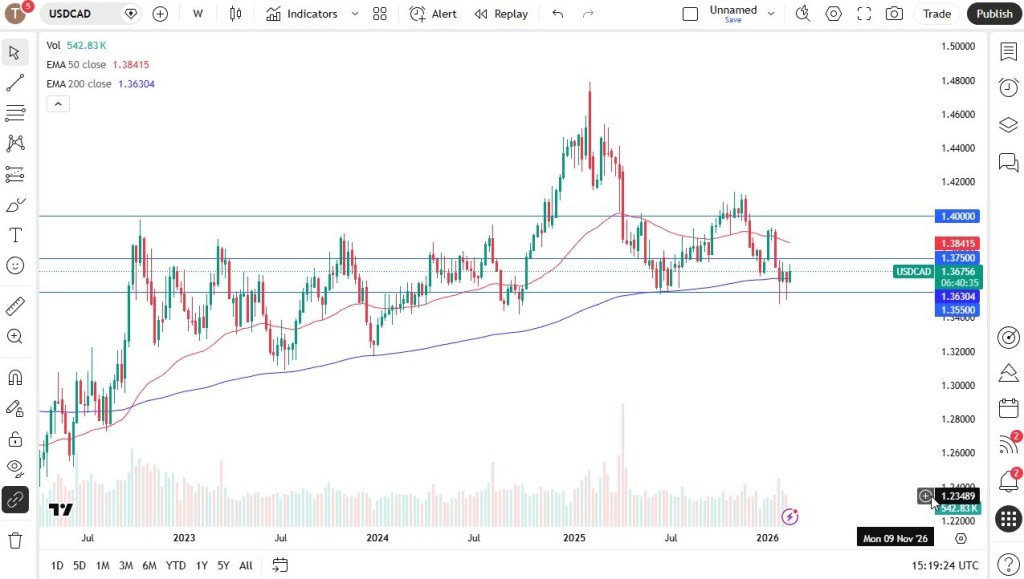
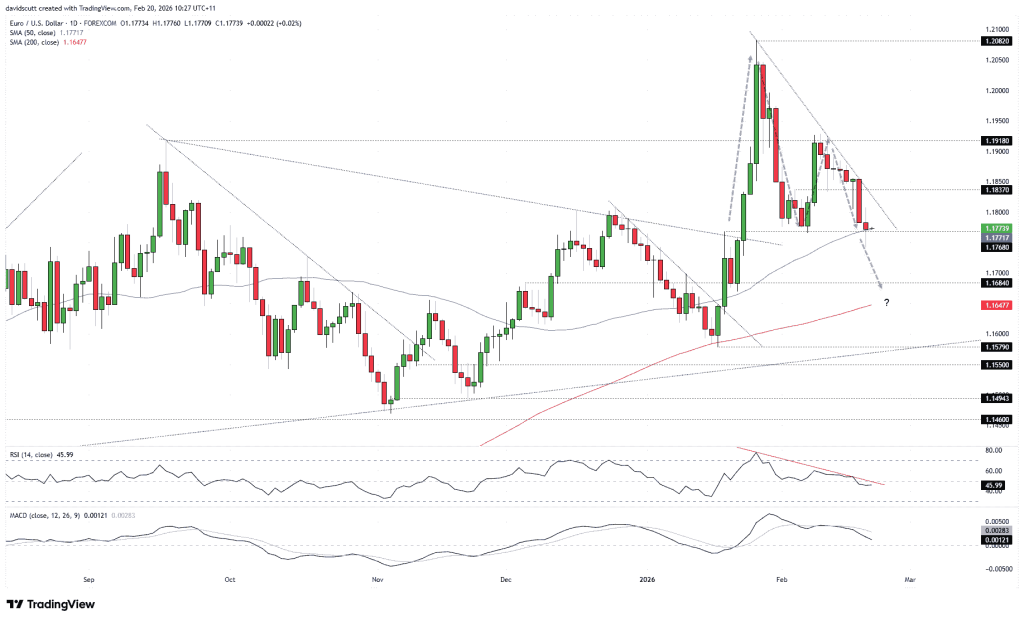
The U.S. dollar initially strengthened against the Canadian dollar over the course of the week, but has since pulled back and is now showing signs of indecision. This isn’t particularly surprising, given that the pair has been fluctuating within the same range for the past five weeks. Notably, the 1.3550 level continues to serve as solid support, while the 1.3750 area above remains a key resistance zone.
For longer-term traders, the prudent approach is likely to wait for a decisive breakout in either direction. In the meantime, short-term participants may keep trading the range, especially as the interest rate differential between the two currencies continues to narrow, encouraging back-and-forth price action.
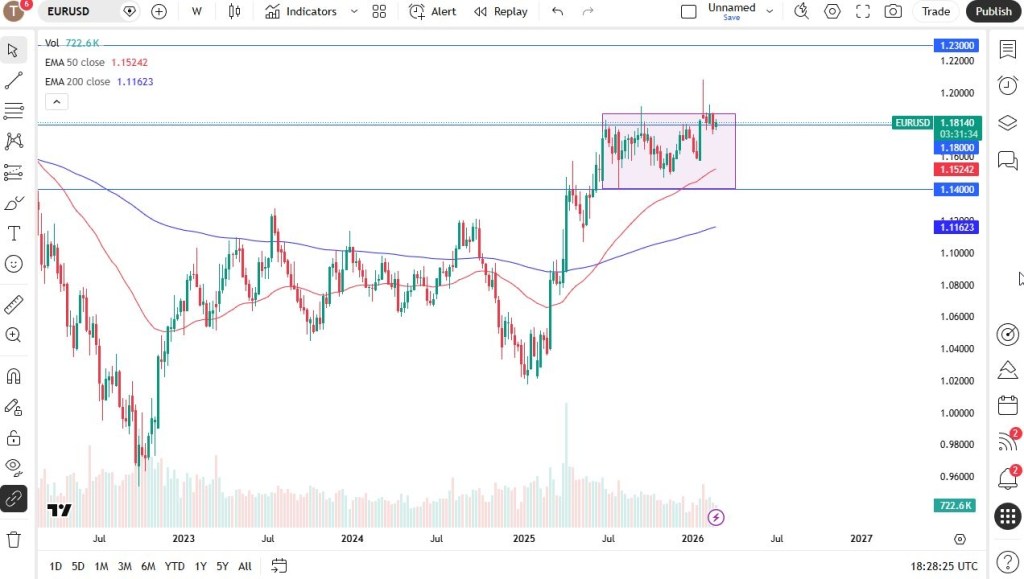
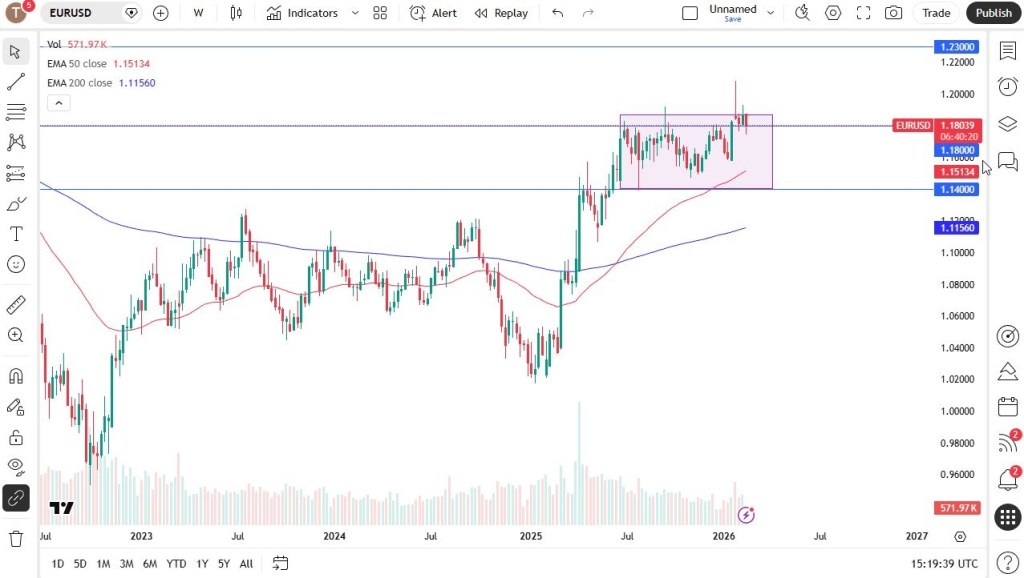
EUR/USD
The euro has traded in a choppy, sideways manner throughout the week, much like the U.S. dollar against the Canadian dollar. The interest rate differential between the euro and the dollar is relatively modest, with the European Central Bank expected to hold rates steady while the Federal Reserve may move toward cutting them.
In this kind of environment, traders are searching for a catalyst to drive price in either direction. At the moment, the 1.18 level appears to be acting as a magnet, drawing price back toward it as the market struggles to establish a clear trend.
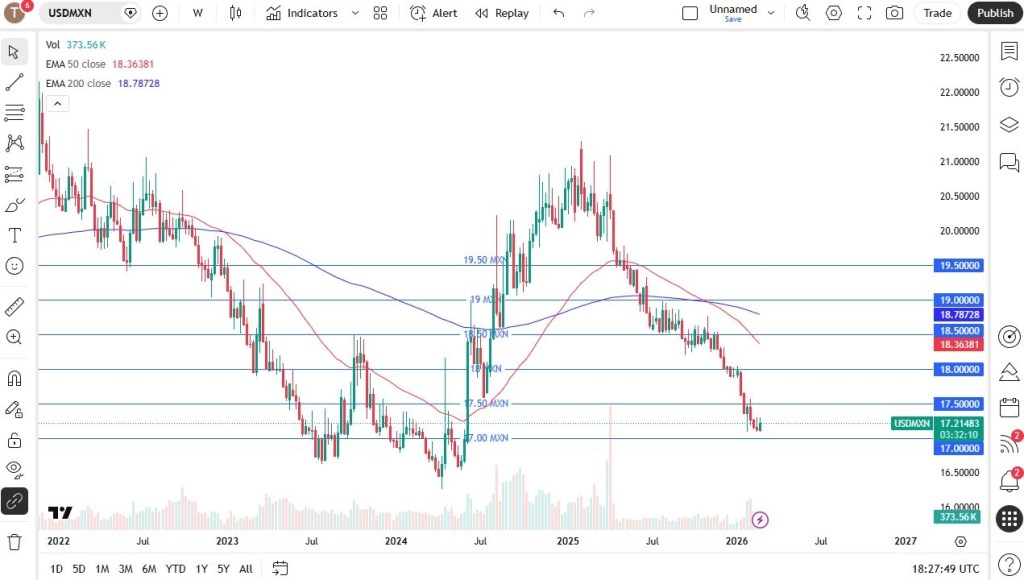
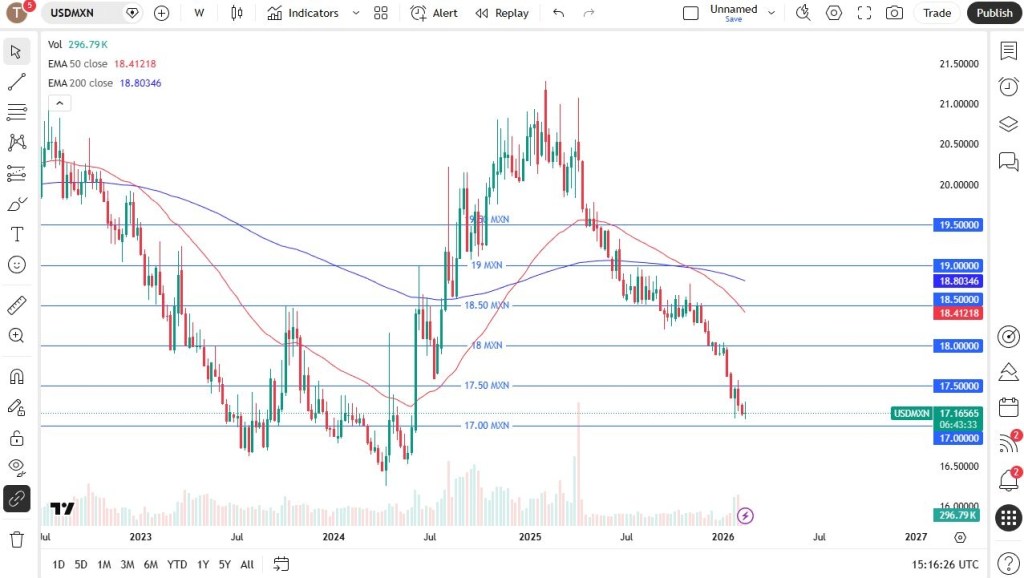
USD/MXN
The U.S. dollar moved higher against the Mexican peso over the week, which isn’t particularly surprising given how sharply it had declined beforehand. If the pair continues to rebound, the 17.50 level is likely to attract selling pressure, making it a potential area to consider short positions.
A sustained break above 18.00 would be needed before entertaining the idea of a broader trend reversal. For now, the interest rate differential continues to favor the downside, so the pair is often used to collect positive swap. I rarely look to buy this market, though sharp upside moves can occur and prove highly profitable—typically driven by strong momentum or bouts of risk aversion, which tend to override the yield advantage.
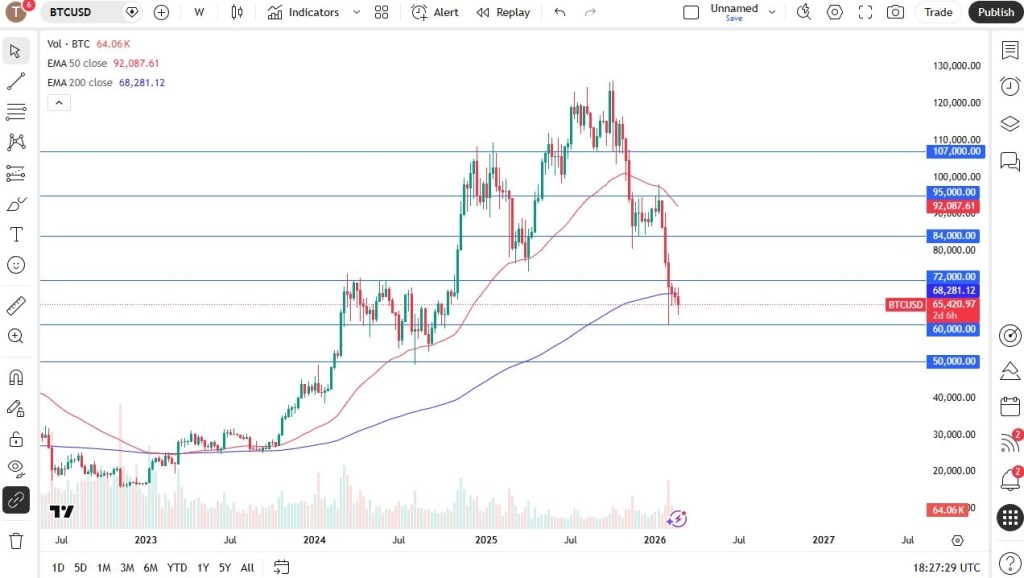
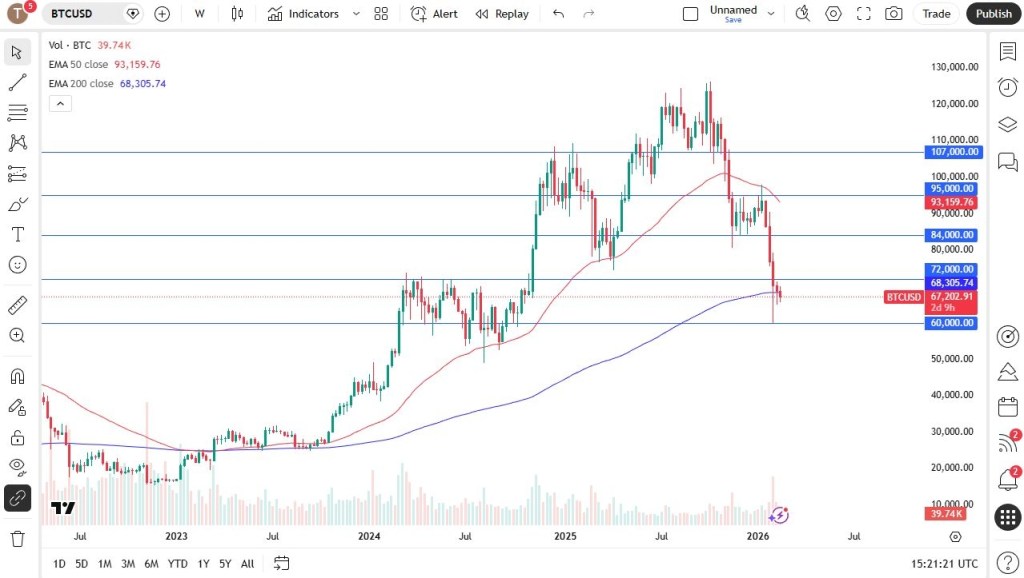
BTC/USD
Bitcoin has been highly volatile throughout the week, with price action continuing to revolve around the $60,000 level. This area is drawing significant attention, as a decisive break below it could pave the way for a swift move toward the $50,000 region.
A break above the $72,000 level would open the door for a potential rally toward $84,000. However, at this stage, the more likely scenario appears to be continued sideways consolidation. In fact, the longer Bitcoin trades within a range and builds a base, the healthier the overall structure becomes, potentially setting the stage for a more sustainable move higher later on.
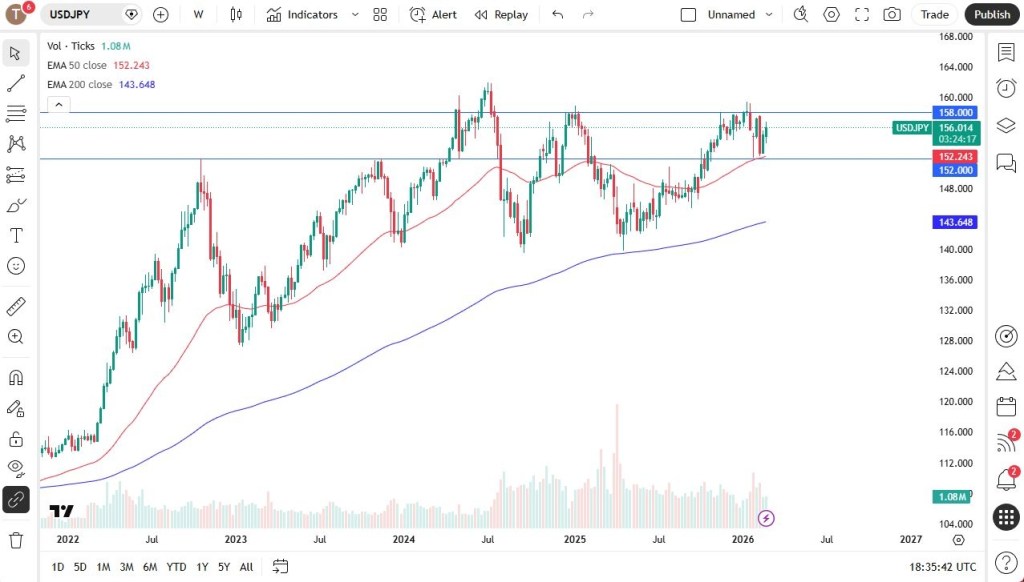
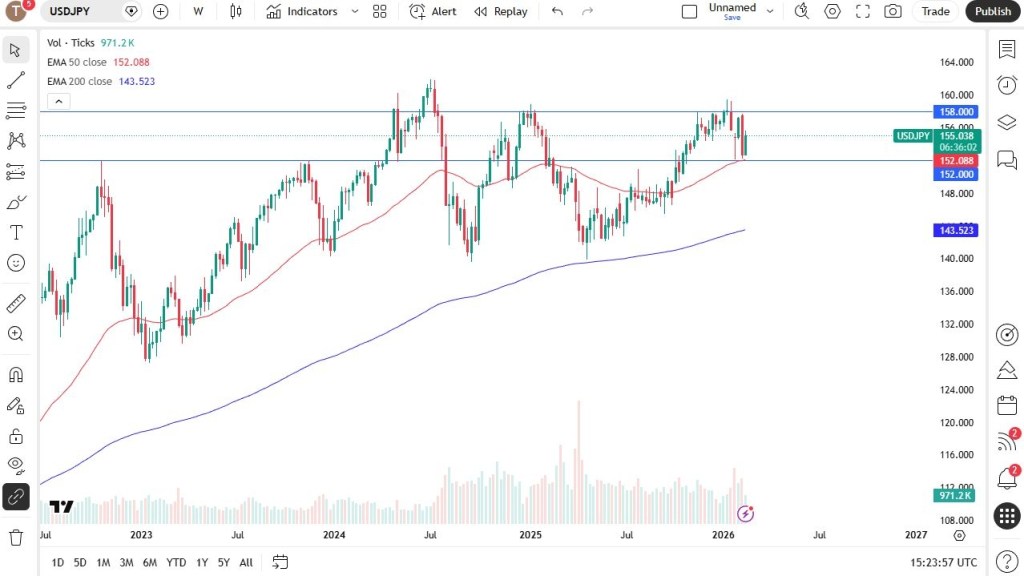
USD/JPY
The U.S. dollar edged higher against the Japanese yen over the week, though the ¥158 level continues to act as resistance. At this point, traders seem to be searching for a catalyst strong enough to push the pair beyond the key ¥160 threshold.
A sustained move above ¥160 could trigger a significant rally, as that area marks the major swing high dating back to 1990. In the meantime, short-term pullbacks are likely to be viewed as buying opportunities, supported by the wide interest rate differential and Japan’s heavy debt burden, which limits the scope for materially higher domestic rates.
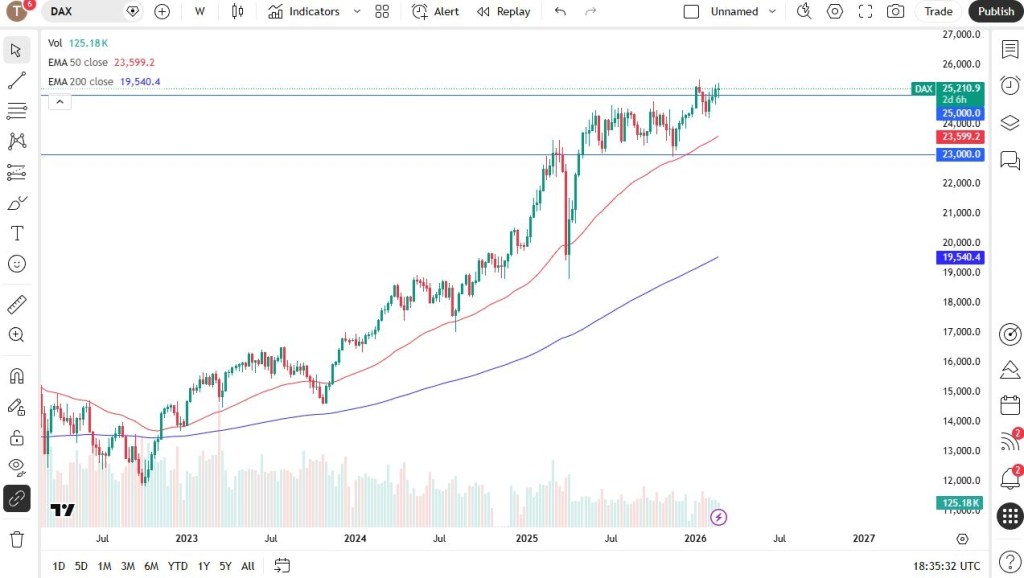
DAX
The German equity market has been somewhat erratic, with the DAX moving back and forth, though overall activity has been relatively subdued. The 25,000-euro level remains a key focus, as it represents a major round number with strong psychological significance. In the near term, minor pullbacks are likely to be viewed as buying opportunities.
There is also the potential for a push above the 25,400 level. A decisive breakout there could pave the way for a move toward the 27,000-euro region. At this stage, I have no interest in shorting the DAX, as the German economy appears to be supported by substantial government stimulus measures.
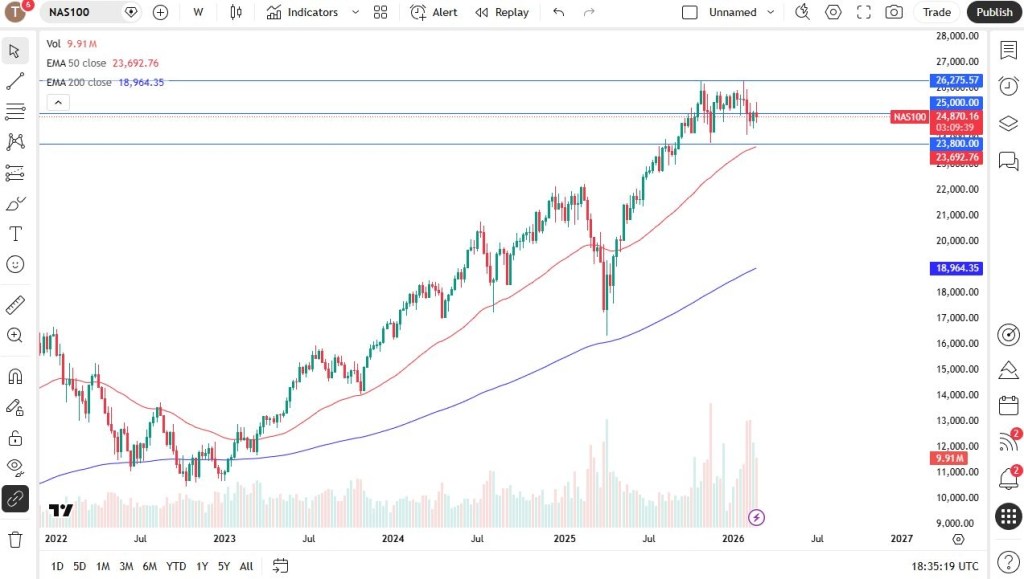
NASDAQ 100
The Nasdaq 100 has experienced significant volatility throughout the week. Despite ongoing challenges and heavy selling pressure in major stocks such as Nvidia, the index is set to close the week in relatively steady shape. The 25,000 level remains a key focus, as it represents a major psychological milestone.
A decisive move above 25,000 could open the door to the 25,500 area, which may act as the next resistance barrier. Overall, the broader outlook remains constructive, with short-term pullbacks likely presenting buying opportunities.
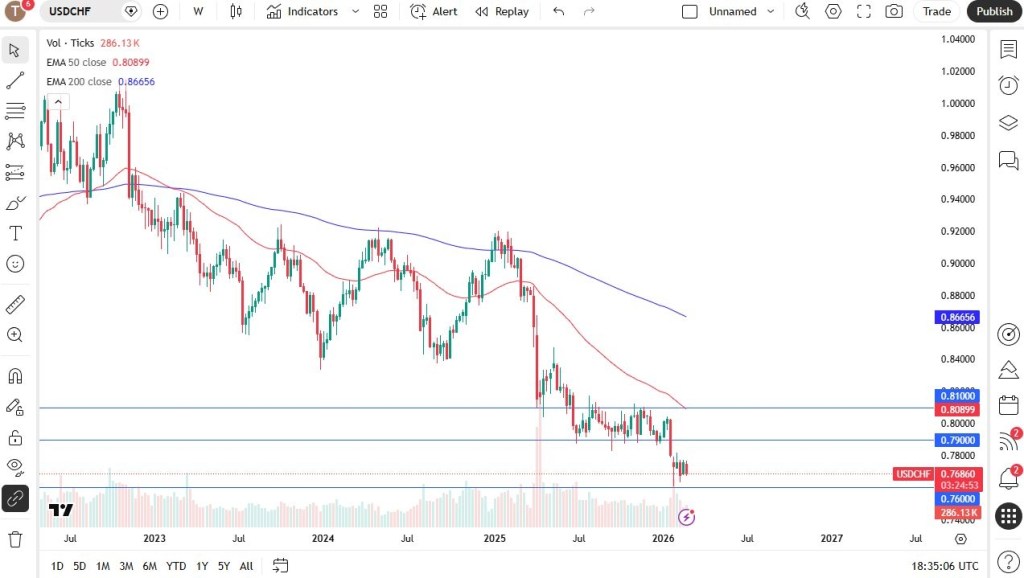
Meanwhile, the U.S. dollar has continued to weaken against the Swiss franc over the past week, making this currency pair one to monitor closely.
USD/CHF
The U.S. dollar has edged lower against the Swiss franc over the past week, making the pair particularly important to monitor. Swiss officials have expressed concern about the franc’s strength, which adds another layer of sensitivity to current price movements.
The 0.76 level appears to be providing near-term support, and the market will be watching closely to see whether it holds. A breakdown below that area could open the way toward the 0.75 level. Over the longer term, there is a strong possibility that the Swiss National Bank may step in to curb further franc appreciation, though any intervention would more likely begin in the euro–Swiss franc pair rather than in USD/CHF itself.
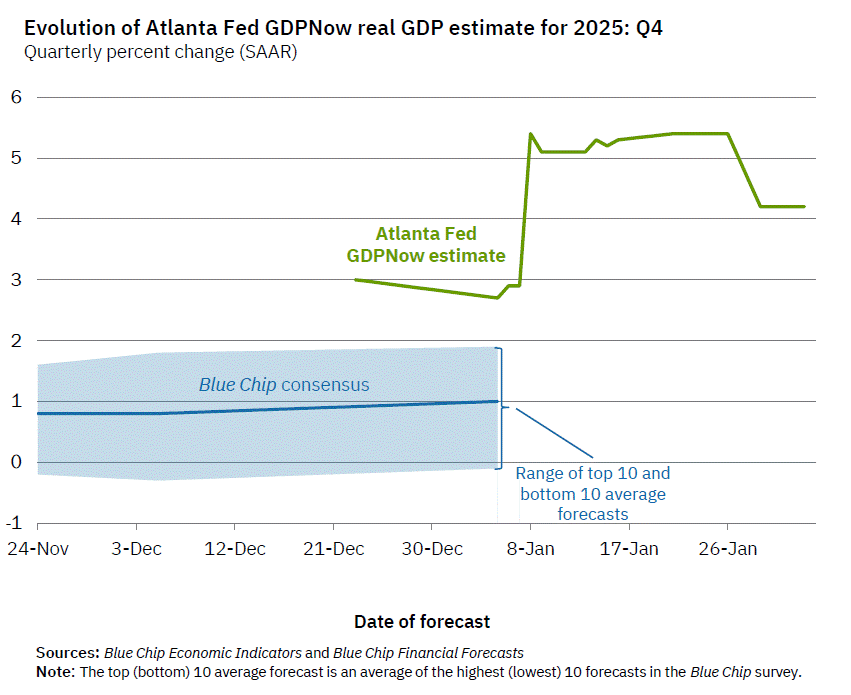
Recent U.S. growth data have pointed to notable economic resilience — but consumer sentiment tells a more cautious story.
According to the Federal Reserve Bank of Atlanta, real Gross Domestic Product is projected to have expanded at an annualized pace of 4.2% in the fourth quarter of 2025. That figure exceeded expectations and represents one of the strongest quarterly performances in the past two years.
The expansion was supported by steady consumer spending, firmer exports, and higher government expenditures. Household consumption climbed 3.5%, its fastest rate of increase this year. On the surface, these numbers portray a macroeconomy that remains firmly in growth mode.
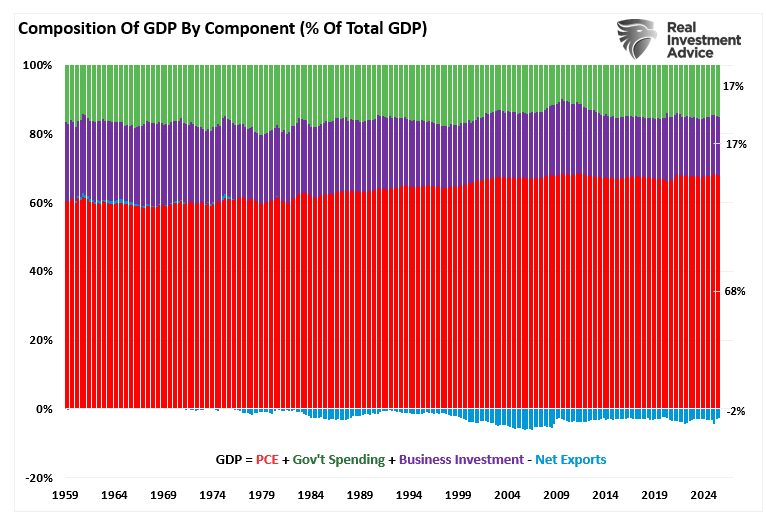
Gross Domestic Product (GDP) represents the total value of goods and services produced within the United States. Of that total, personal consumption expenditures (PCE) account for roughly 68%. Put simply, the consumer is the backbone of the U.S. economy — as household spending goes, so too goes overall economic growth.
When GDP rises, it reflects an increase in overall economic activity — stronger consumer demand that supports higher production and broader expansion. For that reason, growth rates are closely watched by policymakers, investors, and corporate leaders. Strong GDP figures are often interpreted as a signal of improving sales prospects and profit potential.
However, GDP does not tell the whole story of household financial well-being.
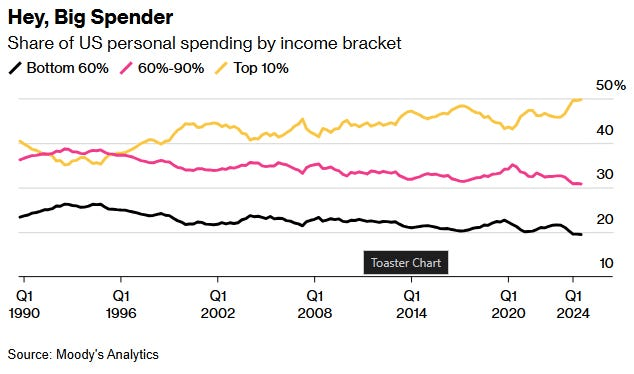
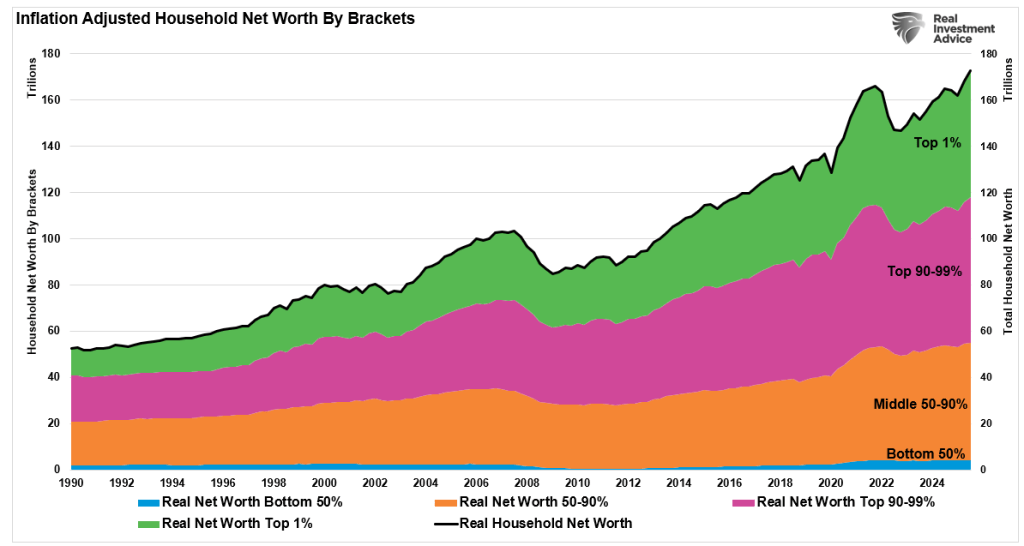
By design, economic growth data measure aggregate output. They do not reveal how income is distributed, how conditions vary across regions, or how millions of families actually experience the economy. A clear illustration is the breakdown of consumer spending by income level. At present, roughly half of all U.S. consumer spending is driven by the top 10% of earners — a share that has been increasing — while the spending contribution from the bottom 90% has been declining.
In other words, headline growth can appear solid even as the underlying breadth of participation narrows.
In short, strong headline growth can conceal areas of financial strain among households and small businesses. Expansion driven primarily by exports or government spending may not meaningfully filter through to broad segments of workers, creating a disconnect between aggregate output and lived experience.
A clear example of this distortion appeared in 2025. In the first quarter, a surge in imports aimed at front-running tariffs weighed heavily on GDP. When those trade fears subsided in the second quarter, import flows normalized, producing a sharp rebound in growth. Yet these swings in trade data had limited direct impact on most consumers. The volatility was largely statistical rather than reflective of a dramatic shift in household conditions.
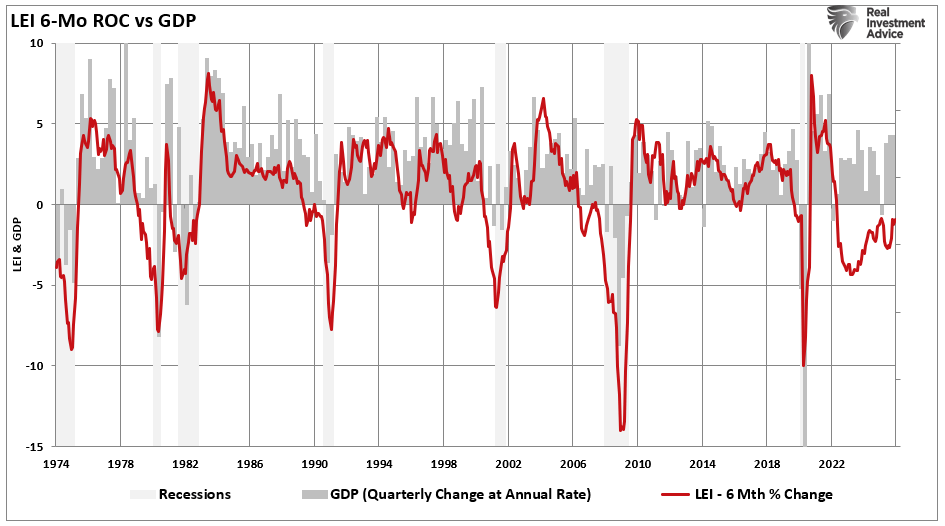
While GDP figures suggest a sturdy economic backdrop, other coincident and leading indicators tell a more cautious story. The The Conference Board Leading Economic Index (LEI), which historically leads the U.S. economy by roughly six months, has remained in contraction for an extended period. Its six-month rate of change has long been regarded as one of the more reliable signals of impending slowdowns or recessions.
Notably, however, despite the prolonged weakness in the LEI, the broader economy has not formally entered recession — underscoring the growing divergence between traditional warning signals and realized economic outcomes.
At first glance, headline growth data suggest the economy remains on firm footing. Output is expanding, spending is holding up, and aggregate indicators point to continued resilience.
But a closer examination reveals a more nuanced picture. Beneath the surface, several crosscurrents — from uneven income distribution and trade-related distortions to persistent weakness in leading indicators — point to a mixed underlying environment.
That divergence helps explain why economic sentiment can feel far weaker than the headline numbers imply. Strong aggregate growth does not automatically translate into broad-based confidence, particularly if gains are concentrated or forward-looking indicators continue to flash caution.
The Gap Between Rising Stocks and Weak Consumer Sentiment
Historically, it makes sense that stock markets and economic data would trend in the same direction over the long run. Corporate earnings ultimately derive from economic activity, and sustained growth in output and income should support higher equity valuations over time.
As discussed in “Return Expectations Are Too High,” long-term market returns are anchored to the growth of the underlying economy, productivity gains, and profit expansion — not simply short-term momentum or sentiment-driven rallies.
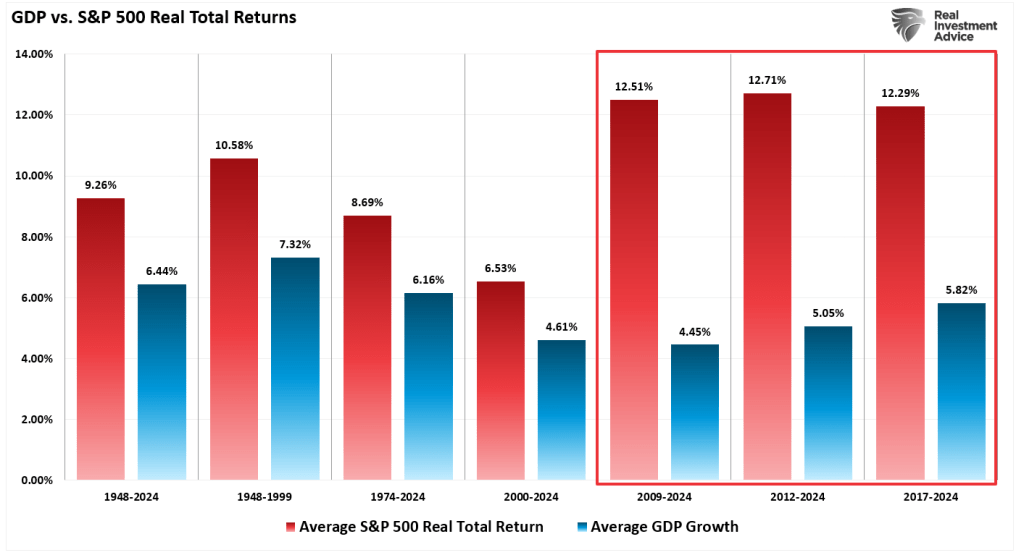
“The chart illustrates average annual inflation-adjusted total returns (including dividends) dating back to 1948, using total-return data compiled by Aswath Damodaran at the NYU Stern School of Business. From 1948 through 2024, the stock market delivered an average real return of 9.26%.
However, in the years following the 2008 financial crisis, inflation-adjusted total returns increased by nearly three percentage points across the last three measured periods.
Here’s the challenge: real (inflation-adjusted) equity returns are relatively straightforward to conceptualize. Over time, they reflect economic growth (GDP) plus dividend income, minus inflation. That relationship broadly held from 1948 to 2000.
Since 2008, though, the math has diverged. Nominal GDP growth has averaged roughly 5%, and dividend yields have hovered near 2%. Yet actual market returns have significantly exceeded what that underlying economic engine would normally justify in terms of sustainable earnings expansion.”
That 15-year divergence is not particularly surprising. As discussed in “Pavlov Rings the Bell,” markets have repeatedly been cushioned from deeper corrections by aggressive fiscal and monetary intervention.
Over the past decade and a half, major drawdowns were often met with policy stimulus — whether through deficit spending or actions by the Federal Reserve. Each episode of support was followed by market recovery, reinforcing a powerful feedback loop: intervention became associated with rising asset prices.
In effect, investors were conditioned to expect rescue during periods of stress — to buy every dip under the assumption that policymakers would step in. That conditioning ties directly to the concept of “moral hazard.”
Moral hazard (noun, economics): A reduced incentive to guard against risk when one is shielded from its consequences — as with insurance protection.
Following the Global Financial Crisis, near-zero interest rates and repeated rounds of quantitative easing strengthened the belief that a policy backstop would reappear whenever volatility increased. Over time, that expectation hardened into a reflexive behavior: assume support, assume recovery, assume higher prices.
Those sustained supports — in both the real economy and financial markets — helped drive a wedge between underlying economic fundamentals and realized financial returns. In other words, policy intervention became a key force behind the growing disconnect between economic reality and asset-price performance.
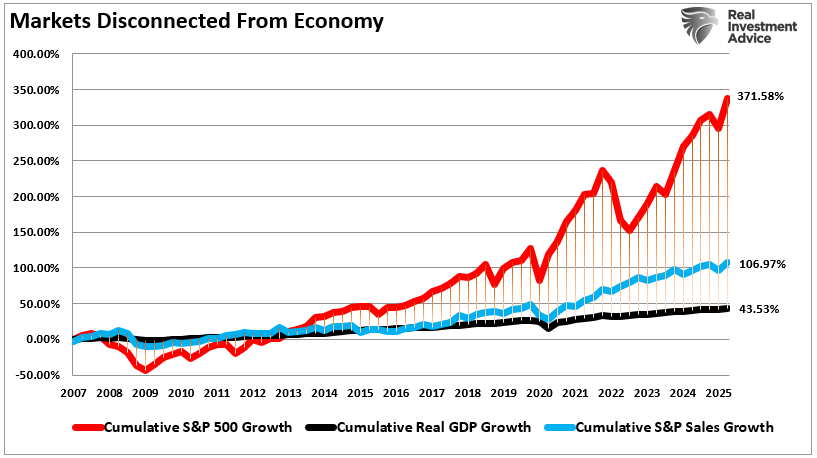
At present, GDP growth has continued to surprise to the upside, and several macro indicators reflect ongoing resilience. At the same time, major equity benchmarks such as the S&P 500 have climbed to record levels. That advance has been fueled less by current consumer sentiment and more by expectations of future earnings growth.
The challenge, however, is that equity valuations appear increasingly disconnected from underlying revenue growth. Markets are pricing in optimism about future expansion, even as broad-based income and demand trends remain uneven.
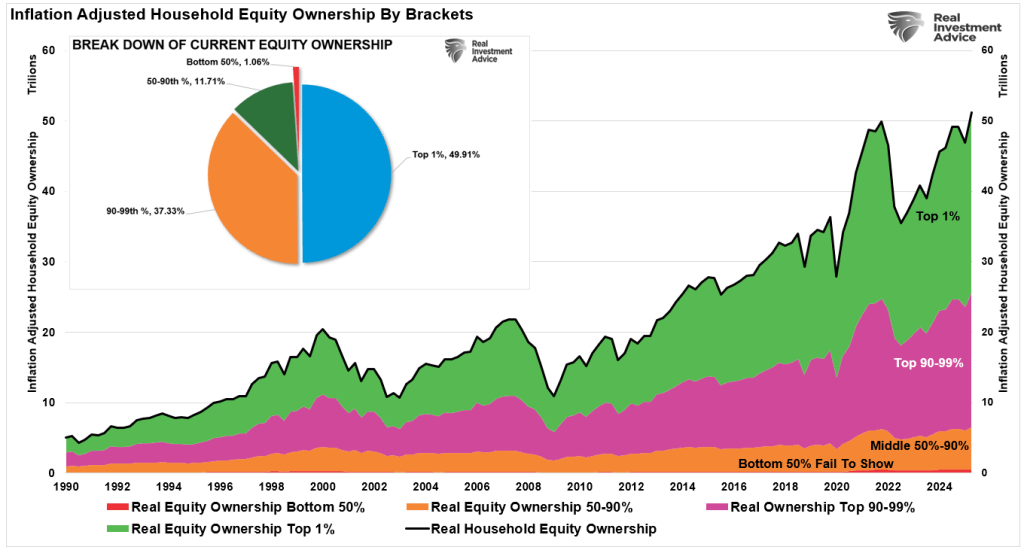
There is also a structural limitation embedded in the “wealth effect.” Rising stock prices can support consumption by boosting household net worth. Yet equity ownership in the United States is highly concentrated. Roughly 87% of equities are owned by the top 10% of households. As a result, the transmission from higher stock prices to broader economic activity is narrower than headline gains might suggest.
That concentration is reflected in spending patterns as well. The top 40% of income earners now account for approximately 80% of total consumption. Consequently, while financial asset values have surged, the macroeconomic lift from those gains is disproportionately tied to higher-income households — leaving sentiment among the broader population more subdued than market performance alone would imply.
That divergence goes a long way toward explaining the disconnect between subdued consumer sentiment and robust headline economic data.
When growth and market gains are concentrated among higher-income households — and asset-price appreciation primarily benefits those with significant equity exposure — aggregate statistics can remain strong even as large segments of the population feel financial strain.
In other words, the macro numbers reflect the strength of those driving the bulk of spending and asset ownership, while sentiment surveys capture the broader lived experience. The result is an economy that looks resilient on paper but feels far less secure to many households.
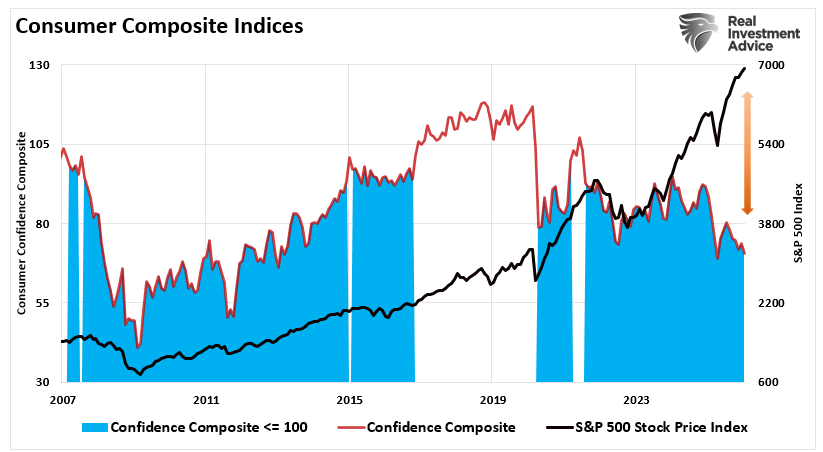
Consumer Confidence Surveys Remain Soft Even as Economic Data Stays Strong
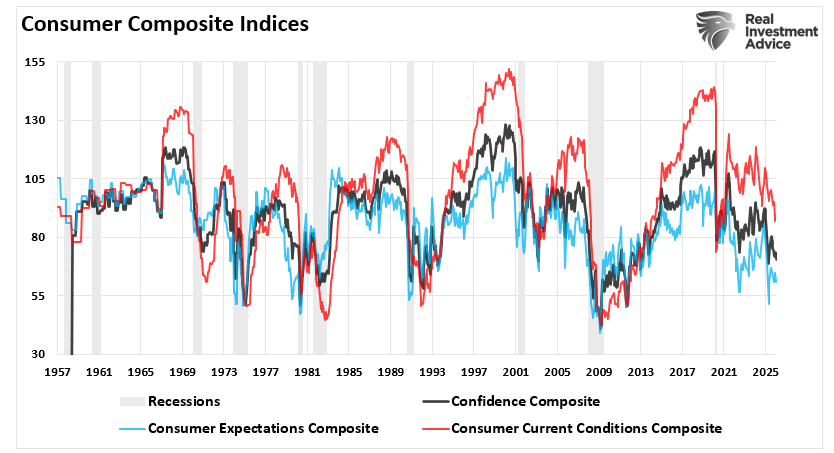
In clear contrast to upbeat macroeconomic indicators and strong equity market gains, consumer sentiment readings have deteriorated significantly. Both the Conference Board Consumer Confidence Index and the University of Michigan Surveys have fallen steeply over the past two years, even as stock prices have climbed. Historically, consumer sentiment tends to move in tandem with rising markets, which is intuitive. The chart below presents a composite measure combining these two leading sentiment indicators.
In both surveys, readings on current conditions and future outlook remain notably subdued, with the expectations component dropping to levels that have historically been linked to recession warnings.
The downturn in sentiment points to rising concerns over employment prospects, business conditions, and future income. Respondents frequently highlighted worries about inflation, elevated prices, food and energy expenses, the affordability of health insurance, and broader geopolitical and political uncertainty. Yet despite this widespread unease, GDP has continued to grow.
Importantly, the gap between soft sentiment data and hard economic figures is not unprecedented. Analysts have often observed that consumer attitudes tend to lag underlying economic performance, and sentiment could improve if expansion persists. In the near term, surveys typically capture prevailing fears and uncertainty, which can weigh on confidence even when actual spending remains relatively solid. Although nominal figures indicate that consumer spending is holding up, much of that resilience reflects paying higher prices for the same—or even fewer—goods, rather than an increase in real consumption, which helps explain the sustained weakness in sentiment readings.
Importantly, if consumer sentiment influences spending—and consumption accounts for roughly 68% of the economy—then that spending ultimately represents demand for businesses of all sizes. In a genuinely strong growth environment, we would expect improving demand to be mirrored by rising confidence across households. Yet, as the composite index illustrates, sentiment levels remain subdued. The historical relationship between confidence measures and the future trajectory of economic activity underscores why this divergence warrants attention.
Soft sentiment readings do not necessarily signal an imminent downturn. However, they do reflect a guarded mindset among both consumers and business owners. That caution can translate into more restrained spending across key components of GDP. If confidence remains depressed, a moderation in economic activity would be a reasonable outcome.
Why the Divergence Matters and What It May Signal Ahead
The gap between solid economic data, rising equity markets, and subdued consumer confidence carries meaningful implications. On the surface, macro indicators point to continued expansion, reinforcing higher stock prices and optimistic earnings forecasts. Yet beneath that strength, households and many business owners report lingering insecurity and pessimism about the future.
This disconnect prompts several key questions:
Can growth remain durable if confidence stays depressed?
Will corporate earnings hold up if consumers begin to retrench?
Could persistent pessimism eventually shape real-world behavior, leading to slower spending and softer growth?
History offers cautionary precedents where negative sentiment foreshadowed downturns—not because the hard data was inaccurate, but because sentiment ultimately influenced economic decisions.
The divergence also highlights distributional dynamics. Aggregate growth figures often mask disparities in income and wealth. Higher-income households account for roughly half of total consumption, while lower-income groups may not fully share in the benefits of expansion. That imbalance helps explain weaker sentiment readings. It also leaves markets vulnerable to any shock that prompts affluent consumers to scale back spending—particularly in an environment where the gap between economic “haves” and “have-nots” remains wide.
Investment Implications
For investors, this mixed backdrop argues for disciplined risk management. Markets may continue advancing on elevated earnings expectations, but those expectations can shift quickly as economic conditions evolve.
Scrutinize valuations. Rising indices do not preclude overpricing. Favor firms with strong balance sheets, reliable cash flows, and pricing power.
Diversify thoughtfully. Sector performance can diverge sharply. Defensive areas such as utilities, consumer staples, and healthcare often prove more resilient during sentiment-driven slowdowns.
Track leading indicators. Watch employment trends, consumer credit conditions, and forward-looking economic indices. Weak confidence can precede softer activity.
Maintain liquidity. Holding cash provides flexibility amid volatility created by divergence.
Consider hedging strategies. Exposure to bonds or volatility-linked instruments may help cushion downside risks.
Emphasize quality. Companies with durable competitive advantages are typically better positioned to navigate uncertainty.
The split between hard data, market performance, and consumer mood represents a meaningful economic signal. While there are persuasive arguments that markets can continue climbing and that pullbacks should be bought, prudence requires acknowledging alternative outcomes.
To borrow a well-known observation from Bob Farrell:
Historically, when “all experts agree,” discipline and preparation for the unexpected have often proven wise.
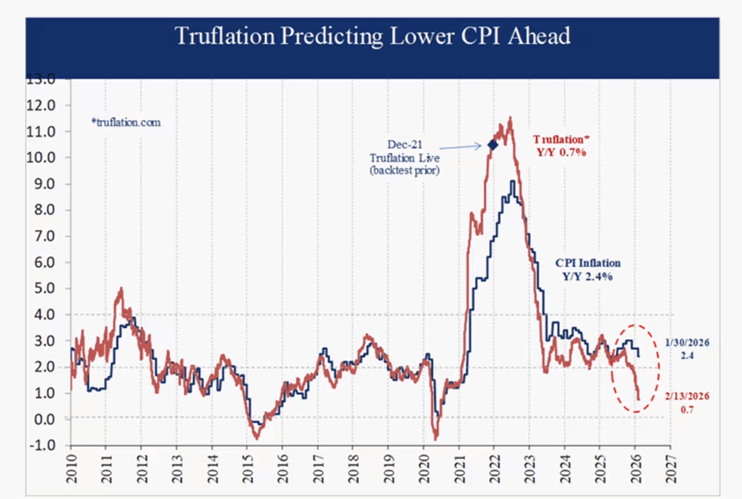
Inflation measurement sits at the core of modern macroeconomics. Interest-rate policy, asset valuations, fiscal planning, and central-bank credibility all hinge on how price pressures evolve. Yet the benchmark most policymakers rely on — the Consumer Price Index (CPI) — is a monthly government report designed for a far less digitized and fast-moving economy.
Increasingly, market participants are supplementing that traditional gauge with real-time alternatives. Among them, Truflation has emerged as the most widely cited live inflation index. Built from millions of observed prices and updated continuously, it offers a near real-time snapshot of price dynamics. In early 2026, its signal diverges meaningfully from official CPI data.
Methodology and Structural Differences
Truflation was launched in December 2021 amid frustration over the lag in official inflation reporting. While CPI is released monthly and relies heavily on surveys, sampling, and statistical smoothing, Truflation applies a bottom-up, digitally native methodology.
The index aggregates data from more than 30 million items across 30+ licensed providers — including online retailers, housing platforms, and consumer-data firms. Prices update daily and are secured through decentralized oracle infrastructure on the Chainlink network, increasing transparency and reducing the risk of retrospective revisions.
Like CPI, Truflation tracks twelve broad consumption categories. However, its category weights are recalibrated annually using observed spending patterns rather than fixed survey-based assumptions. This allows the index to adjust more quickly to shifts in consumer behavior and pricing trends.
Historically, that responsiveness has mattered. Empirical comparisons suggest Truflation has often led CPI turning points by roughly 40 to 75 days, flagging inflection points in inflation momentum well before they appear in official releases.
Institutional Validation
Skepticism toward alternative measures is natural. Still, Truflation has begun clearing some of the credibility hurdles required for broader institutional adoption.
Throughout 2024 and 2025, its short-term forecasting accuracy was notable. In many instances, its readings anticipated CPI outcomes within approximately ±0.1 percentage points. That degree of precision has encouraged growing usage among macro hedge funds and systematic trading strategies.
Institutional validation advanced further in early 2026 when Truflation was integrated into the Bloomberg L.P. terminal ecosystem — a quiet but meaningful step that elevated it from a crypto-native experiment into a recognized macro data input.
Transparency also strengthens its appeal. Daily updates, publicly documented methodology, and auditability offer advantages in markets that reprice continuously, where a 30-day lag can materially affect positioning.
The 2026 Divergence
By mid-February 2026, the spread between Truflation and official CPI readings had widened to one of the largest gaps since the index was created:
Official CPI (January 2026): 2.4% year-over-year
Truflation (Feb 1–18, 2026): ~0.7%
Core CPI: ~2.5%
Truflation core proxy: ~1.3%
Such a divergence presents a challenge: either real-time data are signaling a rapid disinflationary shift not yet captured by government statistics, or the high-frequency approach is temporarily underestimating sticky components embedded in CPI.
If historical lead times hold, markets may need to reassess the inflation trajectory sooner rather than later.
The widening gap between the two measures points to fundamentally different interpretations of current inflation momentum. The central source of divergence is housing.
Truflation incorporates real-time asking rents pulled from active market platforms, capturing the recent cooling in rental prices as it happens. By contrast, official CPI relies heavily on “Owner’s Equivalent Rent,” a survey-based estimate that typically lags actual rental-market conditions by six to twelve months.
In effect, the two gauges are measuring different time horizons. Truflation reflects present housing dynamics, while CPI still embeds rental trends from prior quarters.
The macro implications are significant. If the real-time signal is more accurate, the U.S. economy could be moving closer to disinflation — or even deflationary — conditions, historically associated with rising recession risk. Meanwhile, official data continue to portray a controlled soft landing, with inflation appearing comfortably near target.
Explaining the Reluctance
Despite its growing track record, many economists remain hesitant to incorporate Truflation into formal macro frameworks. The resistance tends to rest on three main arguments.
1. Institutional inertia. CPI has decades of embedded usage. Forecasting models, policy rules, asset-allocation frameworks, and academic research are all synchronized to its monthly release cycle. Integrating a daily inflation measure would require reworking not only projections, but established institutional workflows.
2. Volatility bias. Because Truflation updates continuously, it can display sharp short-term swings. A rapid daily decline may be dismissed as noise, even when it reflects genuine pricing shifts. By comparison, CPI’s smoothed profile feels more stable — even if that stability comes at the expense of timeliness.
3. Composition differences. Truflation assigns slightly less weight to housing than CPI. Critics argue this could understate inflation during periods of accelerating rents. Yet the reverse also holds true: when rental markets cool quickly, CPI may overstate underlying price pressure — which appears to be the present dynamic.
Ultimately, the hesitation is less about data availability and more about comfort. A measure that moves faster and smooths less inevitably challenges established interpretive habits.
Conclusion: Why the Signal Matters
If Truflation’s current reading is directionally correct, monetary-policy expectations could be misaligned with underlying inflation trends. The Federal Reserve may have greater scope to ease than prevailing consensus assumes, even as headline data suggest economic resilience.
This does not mean Truflation should replace CPI as the official benchmark. But when divergences persist and widen, dismissing the alternative becomes increasingly difficult.
More broadly, the debate underscores a structural issue: inflation cannot be treated solely as a once-a-month statistic in an economy where prices adjust continuously. Measurement tools must evolve alongside market speed.
Truflation’s importance does not rest on perfection. Its value lies in timeliness, transparency, and the growing challenge of ignoring what it is signaling.
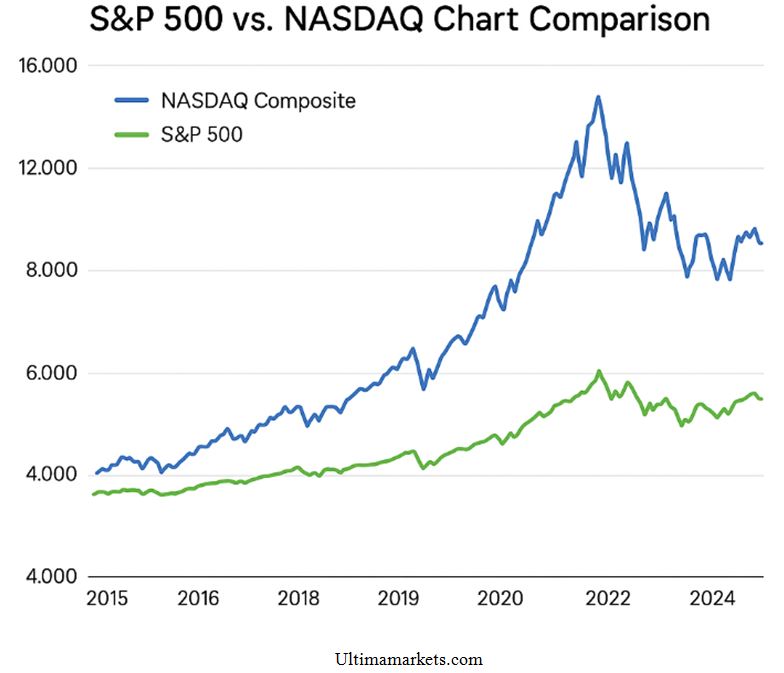
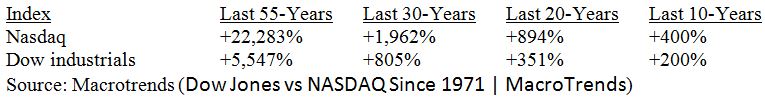
NASDAQ Composite — and technology stocks more broadly — are like a finely tuned sports car. They can easily lap your grandmother’s Oldsmobile — the Dow Jones Industrial Average — but they also require more maintenance and can stall at inconvenient moments.
Since its launch, and particularly since 2015, the NASDAQ has outperformed both the Dow and the S&P 500. Still, it’s very much a hare-and-tortoise story: the speedy rabbit occasionally takes long naps, yet ultimately wins the race — provided investors can tolerate the volatility that comes with tech-heavy exposure.
That dynamic is playing out again in the current market rotation. Since November 1, 2025, the Dow has gained 4.34%, while the NASDAQ has slipped 3.54% — a near mirror image. Once again, capital has rotated out of high-flying tech names (the flashy sports car) and into the steadier reliability of the Dow’s blue-chip stalwarts.
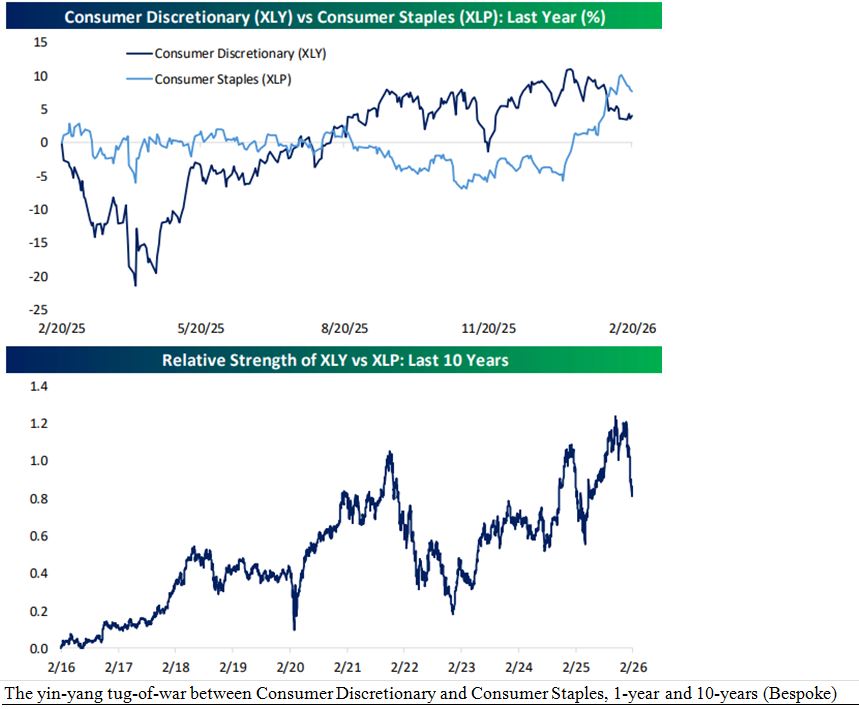
In April, Consumer Discretionary stocks tumbled during a tariff-driven selloff. Although they initially sank, they’ve since rebounded strongly. Betting against the U.S. consumer has historically been a mistake, especially when sentiment temporarily sours.
Over the past year, Consumer Discretionary shares outpaced Consumer Staples, though a recent rotation has narrowed that gap.
Yes, the NASDAQ can test your patience — even break your heart — but history suggests that endurance can pay off.
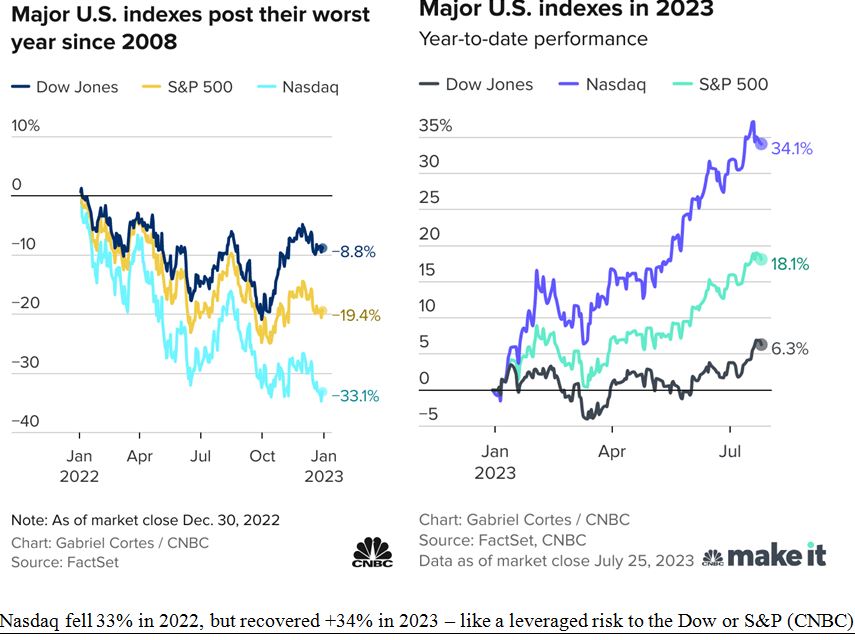
Consider late 2021. While Federal Reserve officials were still describing inflation as “transitory,” markets began adjusting. On November 19, 2021, the NASDAQ reached an all-time high of 16,057. Over the next 13 months, it plunged 36.4%, closing at 10,213 on December 28, 2022. During that same stretch, the S&P 500 fell about 19%, and the Dow declined just 7.65%.
Investors heavily concentrated in high-growth tech during 2022 likely felt significant pain. Yet those wounds healed quickly. From 2023 through 2025, the NASDAQ surged 122%, compared with a 78% gain for the S&P 500 and a more modest 45% rise for the Dow.
Short-term breakdowns in tech can be dramatic — but historically, they have often laid the groundwork for powerful long-term outperformance.
The Biggest NASDAQ Disaster – The Y2K Crash
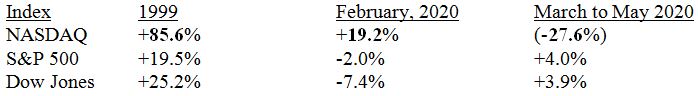
In 1999, the NASDAQ Composite was on a tear, doubling between June 1999 and March 2000, while the Dow Jones Industrial Average seemed half-asleep by comparison. That divergence flipped abruptly in March 2000. The Dow began climbing just as the NASDAQ collapsed, ultimately losing 50% or more in short order.
In February 2000, the NASDAQ experienced a classic “melt-up” even as the Dow drifted lower. By mid-April, the opposite occurred: the NASDAQ suffered its worst week, plunging while the Dow actually advanced. From the start of 1999 through the end of February 2000, the NASDAQ had soared 122%, compared with gains of just 16% for the S&P 500 and 17% for the Dow. Then came the reversal. Between March and May, the blue-chip indexes gained about 4%, while the NASDAQ tumbled 28%. In a single week — April 11–15 — the NASDAQ dropped 25.3%, even as the Dow rose 3.4%.
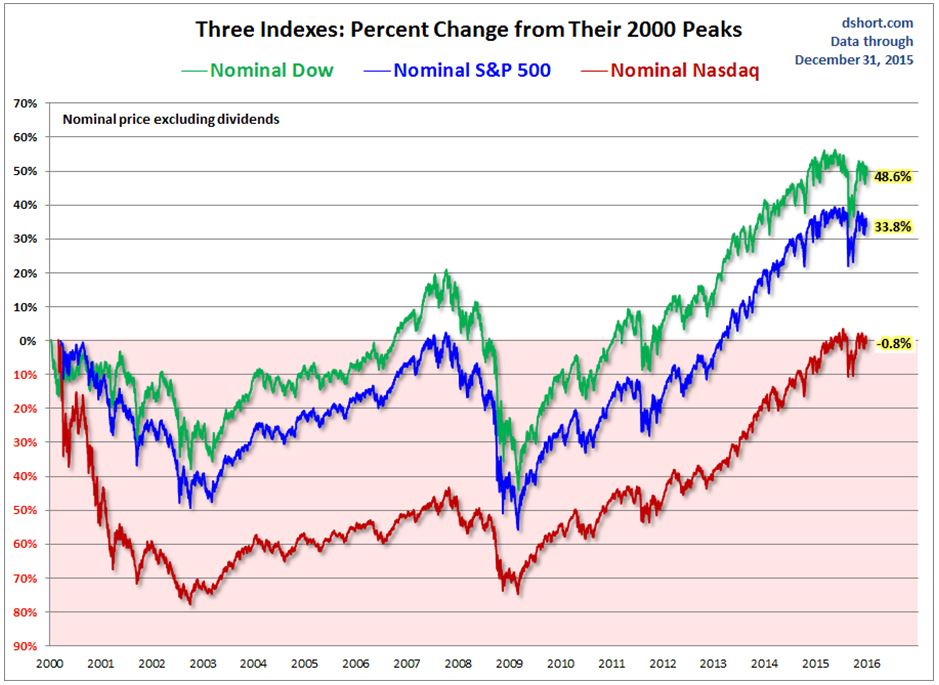
The aftermath was even more sobering. It took 16 years for the NASDAQ to reclaim its March 2000 peak. Meanwhile, the Dow and S&P 500 briefly reached new highs by 2007 and went on to establish lasting all-time highs by 2012. Over that 16-year span, the Dow climbed 48.6%, the S&P 500 gained 33.8%, and the NASDAQ was still slightly below its prior peak.
Still, comparisons between 2026 and the dot-com era can be misleading. The 1999 boom was driven largely by speculative internet companies with little or no earnings. Today’s technology leaders, by contrast, generate substantial revenues and profits, with strong forward guidance tied to tangible business applications. This is a very different foundation.
Over the long haul — since its launch 55 years ago — the NASDAQ has dramatically outperformed both the Dow and the S&P 500, often by multiples of two to four times. Since 1971, the NASDAQ has surged nearly 260-fold, rising from 89.61 to 23,242 at the start of 2026. Over the same period, the Dow has increased about 57-fold and the S&P 500 roughly 74-fold.
So while volatility can test investors’ patience, history suggests resilience. Not every four-letter ticker deserves a four-letter rebuke.
The global energy industry is preparing for its most serious upheaval since the 2022 invasion of Ukraine. As tensions in Iran intensify, the Strait of Hormuz — the world’s most vital transit route for liquefied natural gas (LNG) — has effectively come to a standstill.
Vessel-tracking data shows that at least 11 large LNG carriers have suspended their journeys. Major Japanese shipping firms, including Nippon Yusen K.K. (TYO:9101) and Mitsui OSK Lines Ltd (OTC:MSLOY), have reportedly instructed their ships to remain in safer waters. Iranian state media has characterized the passage as “virtually closed,” leaving roughly 20% of global LNG supply stranded behind what amounts to a naval blockade. Unlike oil, which can sometimes be diverted through pipelines, the immense volumes of Qatari gas moving through this narrow corridor have no viable alternative route.
Asia’s exposure and price shock
Asian nations are at the forefront of the fallout. Buyers in China, India, and Japan — the largest importers of Qatari gas — are said to be urgently seeking substitute cargoes from other suppliers. Yet in an already tight market, traders expect a sharp surge in spot LNG prices, potentially undoing a year of relative price stability within days.
The strain extends beyond spot purchases. Many long-term LNG agreements are linked to crude benchmarks, so any spike in Brent Crude would quickly drive up costs even for contracted volumes, raising energy bills for households and industrial users alike.
Supply risks and broader regional strain
The disruption is also creating operational risks for producers. LNG export terminals depend on a continuous rotation of tankers to maintain cooling systems; without outbound shipments, producers in Qatar and the UAE could face partial or full production shutdowns.
The ripple effects are spreading beyond the Gulf. With Israeli gas fields closed and Iranian pipeline exports to Turkey under pressure, countries such as Egypt are being pushed into the higher-cost seaborne LNG market.
The result is a global scramble for the limited cargoes still available, setting the stage for an international bidding war. Whether the conflict widens or remains contained, the financial burden is likely to be passed on to consumers around the world.
Bitcoin (BitfinexUSD) is rebounding from its weekend slide, trading above the $67,000 mark as investors process a dramatic shift in Middle Eastern geopolitics.
The bounce comes after intense volatility sparked by coordinated U.S. and Israeli strikes on Iran. President Donald Trump stated that the operation led to the death of Supreme Leader Ayatollah Ali Khamenei. Although Tehran initially rejected the reports, Iranian state media later confirmed his death, triggering sharp reactions across global financial markets.
As highlighted in Saturday’s analysis, Bitcoin has a consistent pattern of sharply dropping on unexpected geopolitical shocks before stabilizing. That pattern appears to be unfolding again. After falling to nearly $63,000 yesterday, the cryptocurrency has gradually attracted renewed capital flows as the initial wave of panic selling eases.
Ethereum and XRP are also participating in the broader recovery. ETH/USD has moved back toward the $2,000 level, while XRP is trading near $1.40, with investors anticipating a key March 1 deadline that could bring greater regulatory clarity in the United States.
Regime change dynamics and shifting sentiment
Khamenei’s death was a decisive and largely unforeseen development. The swift return of buyers into Bitcoin reflects a growing belief among traders that the most severe phase of military escalation may have already passed.
At the same time, optimism is tempered by uncertainty surrounding the power vacuum in Tehran. As Iran’s highest authority for decades, Khamenei’s absence leaves open questions about the country’s leadership transition and broader regional stability.
President Trump’s remarks encouraging Iranians to “reclaim their country” indicate that Washington may be aiming for structural regime change. For crypto investors, the coming days represent a critical period of observation. If Iran manages a controlled leadership transition without broadening the conflict, Bitcoin’s rebound could remain intact. However, a drawn-out internal or regional confrontation could quickly pressure the $67,000 support level once more.
Escalation risks and Bitcoin’s “safe haven” debate
Despite the recovery, the possibility of a wider regional conflict persists. Iran’s Revolutionary Guards have reportedly carried out strikes against neighboring states hosting U.S. forces, and casualties have been reported following retaliatory action involving Israel. This ongoing cycle of retaliation continues to unsettle institutional crypto participants.
The central issue now is whether Bitcoin can genuinely function as a “digital gold” hedge during geopolitical crises — or whether it will keep behaving like a high-beta technology asset that reacts sharply to shifts in global risk sentiment.
The United States and Israel carried out coordinated strikes on Iran on Saturday, killing Supreme Leader Ali Khamenei and triggering a fresh wave of conflict across the Middle East.
The attacks unsettled neighboring Gulf Arab oil producers as concerns mounted over further escalation, particularly after Iran retaliated with missile launches toward Israel.
According to four trading sources, several major oil companies and leading commodity traders temporarily halted crude and fuel shipments through the Strait of Hormuz following the strikes.
Key Reactions from Analysts
Helima Croft, Head of Commodities Research, RBC Capital:
Croft said the long-term impact on oil prices will depend on whether the IRGC retreats under sustained airstrikes or escalates further, potentially increasing the costs of what she described as Washington’s second regime-change effort in just over two months.
She added that regional leaders had cautioned Washington about the spillover risks of renewed confrontation with Iran, warning that oil prices above $100 per barrel would pose a serious threat.
Croft also emphasized that OPEC’s ability to cushion supply shocks is limited. Aside from Saudi Arabia, most OPEC+ members are already producing near capacity, meaning any announced output increase may have little practical effect.
Jorge Leon, SVP and Head of Geopolitical Analysis, Rystad Energy:
Leon noted that while alternative infrastructure exists to bypass the Strait of Hormuz, a prolonged disruption could effectively remove 8–10 million barrels per day from the market—significant in a world consuming roughly 100 million barrels daily.
He suggested countries with strategic petroleum reserves may release supplies if the disruption drags on. Absent quick de-escalation, he expects oil prices to reprice sharply higher at the start of the week.
Eurasia Group energy analysts:
They anticipate oil prices will surge when markets reopen. If fighting continues into Sunday, prices could jump $5–$10 above the current $73 level, especially given Iran’s claim that it has closed the Strait of Hormuz and reports of tanker disruptions.
Barclays energy analysts:
Barclays warned that markets may confront worst-case supply fears on Monday. Brent crude could climb to $100 per barrel as traders assess the risk of major supply interruptions amid intensifying regional instability.
Vishnu Varathan, Head of Macro Research (Asia ex-Japan), Mizuho, Singapore:
Varathan said recurring regional attacks may become the new norm, keeping oil prices elevated as both production and transit routes remain vulnerable. OPEC could face pressure to boost output, though a 10–25% risk premium on oil prices would not be excessive—even without a full blockade of the Strait of Hormuz, which he described as a potential 50% premium event.
Christopher Wong, Strategist, OCBC, Singapore:
Wong expects geopolitical risk premiums to rise as markets open. Safe-haven assets like gold are likely to gap higher, while oil could strengthen on supply concerns. Meanwhile, risk assets and high-beta currencies may experience early volatility, particularly if retaliation or regional spillover intensifies.
Nick Ferres, CIO, Vantage Point Asset Management, Singapore:
Ferres argued that energy remains undervalued and should rally at the start of the week—alongside gold.
Thunderous explosions and massive fireballs from missiles launched by Iran across the Gulf underscored a long-feared reality for regional leaders: Tehran can carry the fight directly to their territory. The attacks are likely to solidify Arab governments’ backing for joint action by the United States and Israel.
Even on the Palm Jumeirah — Dubai’s most exclusive enclave — blasts shook buildings and struck a luxury hotel, sending residents scrambling as missiles and interceptors streaked overhead. The scenes made clear that the conflict had spilled beyond Iran’s borders, just as Tehran had cautioned.
“What has now been demonstrated is that we — not the United States — are directly exposed,” said Ebtesam Al-Ketbi of the Emirates Policy Center. “When Iran attacked, it hit the Gulf first, claiming it was targeting U.S. bases.”
Analysts say Tehran’s strikes are designed to show that no American ally in the region is out of reach and to increase the price of supporting Washington’s campaign. But they warn that any error in judgment could turn calibrated signaling into full-scale war.
Gulf officials argue that by hitting oil-producing neighbors, Iran is widening the battlefield and putting global energy supplies at risk, not merely regional stability. For rapidly expanding economies such as Saudi Arabia, Qatar and the United Arab Emirates — all reliant on open skies, safe sea lanes and steady trade — a broader confrontation would be severely destabilizing.
By casting the confrontation as a campaign for regime change in Iran, President Donald Trump has raised the stakes, increasing the likelihood that Tehran could retaliate more aggressively, observers say.
If Iran were to misjudge and directly attack Gulf Cooperation Council states, the nature of the conflict would shift dramatically. Regional governments would be under intense pressure to respond as lives and strategic assets come under threat.
Some Gulf analysts contend that Iran is undermining its own strategic interests by striking neighboring states. While Tehran insists it is targeting U.S. military installations, Gulf capitals view the attacks as clear violations of sovereignty.
In recent indirect talks with Washington aimed at defusing tensions, Iran signaled willingness to negotiate over its nuclear program but refused to discuss its ballistic missile arsenal or its backing of regional militias. Tehran has suggested that such issues be handled in a regional dialogue excluding the United States — a proposal Gulf states argue would weaken rather than strengthen the existing security framework, given their longstanding reliance on U.S. protection.
From their perspective, Iran’s missile capabilities and network of proxies pose immediate threats. Without external security guarantors, they see little credibility in a regional-only arrangement.
Meanwhile, Trump’s rhetoric has shifted notably. Whereas he previously described potential U.S. strikes as leverage to secure a nuclear agreement, he has more recently framed them in terms that imply regime change. Unlike the large-scale 2003 invasion of Iraq under George W. Bush, which involved a prolonged troop deployment and occupation, the current strategy appears focused on limited air operations designed to achieve swift, visible outcomes while minimizing American casualties and domestic political fallout.
The bet is that a short, decisive campaign would yield political benefits, whereas a drawn-out war — especially one disrupting oil flows or the broader economy — could carry heavy costs.
Should the conflict expand to include U.S. bases, diplomatic missions, energy infrastructure, or the crucial maritime corridor of the Strait of Hormuz, the economic and political repercussions for the United States, the Gulf, and global markets would escalate sharply.
In a post on Truth Social, Donald Trump warned Iran not to carry out any additional retaliatory strikes against the United States or its Middle East allies. He said Tehran had threatened large-scale attacks on neighboring countries seen as aligned with Washington.
The remarks suggest that Iran’s military capabilities remain operational despite the reported killing of its Supreme Leader, Ali Khamenei. The wave of retaliatory strikes indicates that Tehran has not been deterred by his death.
Iran reportedly targeted the United Arab Emirates, striking Dubai International Airport and the Burj Khalifa, the world’s tallest building. It also launched attacks on Bahrain’s capital, as well as Qatar and Kuwait. In response, several Gulf states have warned they may retaliate against Iran.
Qatar has shut down its main airport in Doha, while Dubai International Airport has also been closed following the strikes.
It remains uncertain whether Trump’s threat to respond with significantly greater force will deter further escalation. It is also unclear what he meant by saying, “We will hit them with a force that has never been seen before.”
Impact of the Conflict on Global Trade and the Energy Sector
Earlier today, we noted that the sudden closure of Dubai International Airport caused widespread flight cancellations due to its vital role as a global transit hub. Leading Gulf airlines — Emirates, Qatar Airways, and Etihad Airways — have suspended services indefinitely.
In addition, three major Japanese shipping companies have halted operations in the Gulf following a U.S. naval warning. These include Nippon Yusen (TYO:9101), Mitsui O.S.K. Lines (OTC:MSLOY), and Kawasaki Kisen Kaisha (TYO:9107).
Analysts at RBC Capital Markets say that U.S. strikes on Iran and Tehran’s counterattacks have created a cascading effect across the Gulf. The Strait of Hormuz is now viewed as “effectively closed,” disrupting roughly 20% of global LNG exports and about 90% of Japan’s crude oil imports.
They warn that crude oil prices could spike sharply as tensions intensify and diplomatic efforts remain stalled. Investors are advised to closely track developments in the region and assess their potential implications for oil and LNG markets.
Each week, host and Zacks stock strategist Tracey Ryniec teams up with guest experts to break down the most compelling trends in stocks, bonds, and ETFs — and what they mean for investors’ everyday lives.
The era of the “Magnificent 7” may be winding down. Before that, investors rallied around the FANG stocks, which later evolved into FANGMAN. At one point, some pushed to include Tesla, transforming the group into the Magnificent 7.
Now, with several of those mega-cap names losing momentum, that once-dominant lineup appears to be fading.
Moving Past Apple and Microsoft
For years, mega-cap tech giants like Apple and Microsoft have led the market. But what if leadership shifts?
Tracey highlights five non–big tech companies that could emerge as the “new” magnificent stocks. All five are trading at fresh five-year highs and are projected to deliver double-digit earnings growth in 2026.
Are you prepared to look beyond Apple and Microsoft to discover the market’s next generation of winners?
5 New “Magnificent” Stocks to Consider for 2026
MasTec, Inc. (MTZ)
MasTec operates across communications, energy, and utilities infrastructure — positioning it as a potential AI infrastructure beneficiary. The stock has surged 225% over the past five years and is trading at fresh five-year highs.
While it has yet to report Q4 2025 results (due Feb. 26, 2026), earnings are projected to climb 61.8% in 2025 and another 28.6% in 2026. However, with a forward P/E of 33.5, the valuation is well above traditional value levels.
Does an infrastructure-focused growth name like MasTec deserve a spot on your watchlist?
Caterpillar Inc. (CAT)
Known for its construction and mining equipment, Caterpillar is benefiting from renewed infrastructure and development activity. Shares are up 262% over the past five years, also marking new five-year highs.
Earnings are expected to grow 18.9% in 2026. Yet, like MasTec, Caterpillar trades at a premium, with a forward P/E of 33.6.
Is there still upside ahead, or have investors already priced in the growth?
Walmart Inc. (WMT)
One of America’s largest retailers, Walmart has significantly expanded its online presence since 2020. The strategy appears to be paying off: shares have gained 164% over five years and sit at new highs.
Despite projected earnings growth of 11% in fiscal 2027, Walmart trades at a lofty 42.6 forward P/E — even higher than NVIDIA at roughly 25x.
Has Walmart become overheated, or is its transformation still underappreciated?
Eli Lilly & Company (LLY)
Eli Lilly, a pharmaceutical heavyweight, is riding strong momentum driven partly by its weight-loss treatments and an upcoming pill launch. The stock has soared 404% over five years, outperforming the S&P 500 and hovering near record highs.
Earnings are forecast to rise 39.6% in 2026. With a forward P/E of 30, Lilly isn’t cheap, but it’s more moderately valued compared to some peers.
Could healthcare leadership define the next “magnificent” cycle?
Howmet Aerospace Inc. (HWM)
Operating in aerospace and defense, Howmet has delivered one of the most remarkable runs of the group, climbing 798% over the past five years and reaching new all-time highs.
Earnings are projected to grow 18.8% in 2026. Still, its forward P/E of 56 signals a steep premium.
Can a high-growth defense supplier sustain its momentum at these levels?
Recent weeks have clearly shown that President Trump’s domestic, foreign, and trade policy actions continue to weigh on the US dollar. Several of his tariff measures were struck down by the Supreme Court, creating frustration within the administration and adding fresh uncertainty. The independence of the Federal Reserve may also face scrutiny under the designated Fed Chair Kevin Warsh, who is seen as politically aligned with Trump. At the same time, the risk of military tensions with Iran adds another layer of geopolitical concern. In addition, shifting relative growth dynamics and a narrowing US interest rate advantage are likely to favor the euro. Overall, we see persistent headwinds for the USD and expect further depreciation against the EUR.
Yen – Weak despite Takaichi’s decisive win
Despite Prime Minister Takaichi’s landslide election victory, the yen remains under pressure. With her coalition securing a three-quarters majority and the LDP holding two-thirds of parliamentary seats, attention now turns to whether promised stimulus measures and tax cuts — including a potential suspension of VAT on food — will be implemented. BoJ Governor Ueda reiterated that rate hikes would depend on supportive economic data. Given the current political backdrop, we expect the BoJ to keep policy rates unchanged for now. As a result, EUR/JPY is likely to move sideways.
CHF – Strength amid rising uncertainty
Amid persistent trade and geopolitical uncertainty — much of it originating from the US — defensive currencies like the Swiss franc have benefited. Switzerland’s solid structural fundamentals, including economic resilience and strong fiscal and external positions, reinforce its safe-haven status. However, we anticipate a modest depreciation of the CHF in 2026, supported by stronger eurozone growth momentum, unless equity markets correct sharply or geopolitical risks intensify again. We view the franc’s current strength as temporary. With EUR/CHF near 0.90, the risk of Swiss National Bank intervention cannot be ruled out. Further CHF appreciation would be unwelcome given inflation remains extremely low at just 0.1% year-on-year, as it would deepen imported deflationary pressures.
Gold continues to power higher like an unstoppable juggernaut, defying decades of historical precedent. After nearly tripling in just a couple of years, the metal has maintained relentless upside momentum — even as extreme overbought readings that historically triggered sharp corrections have repeatedly failed to spark a meaningful selloff.
The term “juggernaut” itself originates from the Hindu deity Jagannath, whose towering chariots are pulled during India’s Ratha Yatra festival — massive, nearly unstoppable structures once said to crush anything in their path. Gold’s current advance resembles that kind of force: powerful, slow-moving, and extraordinarily difficult to halt.
Defying half a century of cyclical behavior
Since the U.S. abandoned the gold standard in August 1971, gold has moved in well-defined cycles. Over the past 55 years, dollar-denominated gold has recorded:
32 cyclical bull markets with gains exceeding 20%
11 additional uplegs of more than 10%
17 cyclical bear markets with losses over 20%
24 corrections of at least 10%
These alternating cycles make trading possible — buying low and selling high depends on gold’s historical tendency to mean-revert after extreme moves.
Yet the latest bull market has shattered prior benchmarks. From early October 2023 to late January 2026, gold surged an unprecedented 196.4% over 27.8 months — the largest cyclical bull on record. For comparison, the famed January 1980 surge gained 127.9% in just 2.6 months.
By late January 2026, gold reached one of its most overbought levels ever, trading 43.4% above its 200-day moving average — its most extreme reading since March 1980. Historically, such conditions have reliably preceded fast and deep corrections.
Indeed, gold briefly cracked — plunging 10.3% in a single session, its third-worst daily drop since 1971, followed by a 13.3% correction over two days. Based on historical patterns, such extremes have typically led to average declines of roughly 20% over the next two months.
But this time has been different.
A historically rare rebound
Instead of cascading lower, gold rebounded swiftly, recovering more than three-quarters of its two-day plunge and returning to within 3% of its record high. Rather than a full correction, the move increasingly resembles a high consolidation — a sideways digestion of gains rather than a deep retracement.
That possibility challenges over five decades of precedent.
Market history teaches adaptability. As economist John Maynard Keynes famously observed, “When the facts change, I change my mind.” While history strongly argues for a larger correction, gold’s recent behavior suggests underlying structural demand may be altering the cycle’s dynamics.
A structural shift in demand
Unlike earlier gold bull markets driven primarily by U.S. investors and futures speculation, this surge has been powered heavily by:
Chinese and Indian investment and jewelry demand
Strong central bank accumulation
Reduced reliance on American speculative flows
That steady international buying appears to have smoothed volatility. Remarkably, from October 2023 to January 2026, gold did not experience a single correction exceeding 10% — an extraordinary deviation from historical norms.
During that stretch, gold reached extreme overbought conditions four separate times that typically would have required sharp pullbacks. Instead, it consolidated sideways, allowing technical excesses to normalize gradually rather than through panic selling.
Overbought — but not breaking
One widely used metric, “Relative Gold” (rGold), measures gold’s price relative to its 200-day moving average. Over the past five years, extreme overbought readings began near 1.18x that average. In January 2026, gold far exceeded that threshold — yet still refused to unravel.
If gold successfully transitions from its most powerful cyclical bull ever into yet another high consolidation rather than a major bear phase, it would mark the fifth such episode in recent years — an extraordinary break from long-term statistical norms.
For traders expecting mean reversion, that presents real danger. Betting against momentum in a structurally supported market can be like stepping in front of a moving chariot.
Gold may still correct — history suggests it eventually will. But for now, extreme overbought conditions alone have proven insufficient to halt this advance.
Gold’s refusal to break down from extreme overbought levels has now evolved into something historically extraordinary. What began as a powerful cyclical bull has repeatedly transitioned not into sharp corrections — as five decades of precedent would suggest — but into a series of high consolidations that preserved momentum and reset sentiment without deep damage.
Four prior high consolidations — and counting?
The first extreme-overbought episode of this monster bull emerged in mid-April 2024, when gold closed at 1.188x its 200-day moving average (200dma). That followed a 31.2% surge in just 6.4 months. Historically, that setup demanded a sharp correction. Instead, gold drifted sideways for 3.8 months, correcting only 5.7% at worst. During that span, rGold averaged 1.127x — elevated, but nowhere near oversold territory (which historically begins below 0.93x).
The second episode arrived in late October 2024, when gold again pierced extreme territory at 1.183x its 200dma, with gains reaching 53.1% over 12.9 months. Rather than collapse, gold entered another sideways drift lasting 3.0 months. The maximum pullback was 8.0%, and average rGold readings remained lofty at 1.090x.
By mid-April 2025, the bull extended to 88.0% gains, and gold reached 1.266x its 200dma — the most overbought level in 13.7 years. In prior cycles, similar extremes triggered double-digit selloffs. Instead, gold carved out a third high consolidation lasting 4.2 months. Even during that stretch, gold averaged 15.3% above its 200dma — remarkably elevated.
The fourth episode followed gold’s surge to 139.1% gains by mid-October 2025, when rGold hit 1.330x — the most extreme since 2006. An initial 9.5% drop threatened to spiral into a full correction, but aggressive Chinese buying — particularly into Mondays when Asian trading dominates price discovery — arrested the decline. That consolidation lasted just 2.0 months, the shortest yet, with rGold still averaging 1.211x.
The January 2026 blowoff — and defiance
Then came the mania phase. In just five weeks into late January 2026, gold surged another 24.3%, extending total gains to 196.4% over 27.8 months — the largest cyclical bull in modern history. rGold spiked to an astonishing 1.434x, the most overbought reading in 45.9 years.
History strongly suggested a fast 20%+ cyclical bear was imminent.
Gold did plunge 13.3% over two sessions, formally ending the bull. But once again, heavy Chinese demand — amplified by Lunar New Year buying — helped prices rebound rapidly. Rather than cascading lower, gold began what may be its fifth high consolidation from extreme levels.
As of midweek, that consolidation was just 0.9 months old, with average rGold near 1.298x — far above the 1.145x average of the prior four consolidations. By historical standards, that remains dangerously elevated and leaves meaningful downside risk intact.
Seasonal and structural considerations
Chinese demand has been the defining structural shift of this cycle. Unlike earlier bulls driven primarily by U.S. futures traders and Western investors, recent gains have been heavily supported by Chinese investors, jewelry buyers, and central bank accumulation. That steady buying pressure has dampened volatility and truncated corrections.
However, seasonality matters. Gold demand in China typically peaks into Lunar New Year and softens from late February into mid-March — historically one of gold’s weakest seasonal windows. A minimum six-week sideways period following a major peak is generally required to sufficiently reduce the odds of a serious correction. Gold is only about halfway through that threshold.
If prices can hold into mid-March, the typical spring rally — which has averaged about 4.3% gains during bull years over the past quarter century — could provide renewed upside momentum.
Risks remain asymmetric
Despite the juggernaut narrative, risks remain substantial. Gold has demonstrated it can drop 5%–10% in a single day when sentiment shifts. And gold miners amplify gold’s moves significantly: historically 2x to 3x. A 10% gold correction could translate into 20%–30% declines in miners; a 20% bear phase could mean 40%–60% drawdowns in gold equities.
Bottom line
Gold’s momentum continues to defy half a century of precedent. Extreme overbought conditions that once reliably triggered swift corrections have instead produced high consolidations — a structural shift likely driven by persistent Chinese demand and global diversification flows.
But while this fifth potential consolidation may ultimately prove successful, it remains young and statistically vulnerable. The juggernaut rolls on — yet markets can reverse suddenly.
Caution, patience, and adaptability remain essential.
The U.S. dollar weakened this week amid ongoing geopolitical tensions and renewed uncertainty over U.S. trade policy. The setback followed a ruling by the Supreme Court of the United States declaring the Trump administration’s tariffs illegal, prompting President Donald Trump to announce a fresh round of levies. Even stronger-than-expected Producer Price Index (PPI) data failed to revive the greenback.
The U.S. Dollar Index (DXY) hovered near the 97.60 area, down about 0.20% on the day and ending the week modestly lower, as traders remained cautious amid trade and geopolitical uncertainty.
EUR/USD traded around 1.1810, edging higher during the U.S. session after Germany’s flash Harmonized Index of Consumer Prices (HICP) for February came in softer than expected at 2% year-on-year (vs. 2.1% forecast) and 0.4% month-on-month (vs. 0.5%). Investors also evaluated testimony from Christine Lagarde, President of the European Central Bank, before the European Parliament. Lagarde reiterated that inflation is gradually returning to the 2% target and said she intends to complete her term, dismissing speculation about an early departure.
GBP/USD hovered near 1.3470, rebounding after nearly revisiting a one-month low earlier in February. Meanwhile, Andrew Bailey, Governor of the Bank of England, indicated there is room for rate cuts as inflation is expected to move back toward the 2% target.
USD/JPY traded near 156.00, stabilizing after recouping most of its intraday losses. Tokyo’s February CPI rose 1.6% year-on-year, with the core measure excluding fresh food falling below the Bank of Japan’s 2% target for the first time since 2024.
AUD/USD climbed back toward 0.7120, turning positive after reversing earlier declines. Attention now shifts to Australia’s TD-MI Inflation Gauge, due Monday.
USD/CAD hovered around 1.3630, marking nearly a two-week low, as markets assessed economic data from both sides of the border. According to Statistics Canada, Canada’s GDP contracted at an annualized 0.6% rate in the fourth quarter, following a revised 2.4% expansion in Q3.
Gold traded near $5,260, reaching a one-month high amid persistent geopolitical uncertainty. The precious metal is attempting to retest its all-time high of $5,598 set earlier this year.
Anticipating economic perspectives: Key voices in focus
Sunday, March 1
Joachim Nagel – European Central Bank
Monday, March 2
Frank Elderson – European Central Bank
Joachim Nagel – European Central Bank
Christine Lagarde – European Central Bank
Dave Ramsden – Bank of England
Michele Bullock – Reserve Bank of Australia
Tuesday, March 3
Kazuo Ueda – Bank of Japan
John C. Williams – Federal Reserve
Olaf Sleijpen – European Central Bank
Martin Kocher – European Central Bank
Neel Kashkari – Federal Reserve
Wednesday, March 4
Piero Cipollone – European Central Bank
Tiff Macklem – Bank of Canada
Luis de Guindos – European Central Bank
Thursday, March 5
Luis de Guindos – European Central Bank
Martin Kocher – European Central Bank
Christine Lagarde – European Central Bank
Friday, March 6
Piero Cipollone – European Central Bank
Mary Daly – Federal Reserve
Beth Hammack – Federal Reserve
Scott Paulson – Federal Reserve
Central bank meetings and key data releases set to steer monetary policy outlook
Monday, March 2
Australia: TD-MI Inflation Gauge
China: February RatingDog Manufacturing PMI
Germany: January Retail Sales
Switzerland: January Real Retail Sales
Spain: February HCOB Manufacturing PMI
Italy: February HCOB Manufacturing PMI
Germany: February HCOB Manufacturing PMI
Canada: February S&P Global Manufacturing PMI
U.S.: February ISM Manufacturing Employment Index
U.S.: February ISM Manufacturing New Orders Index
U.S.: February ISM Manufacturing PMI
U.S.: February ISM Manufacturing Prices Paid
New Zealand: January Building Permits (s.a.)
Japan: January Unemployment Rate
Tuesday, March 3
Australia: January Building Permits
Eurozone: HICP (Harmonized Index of Consumer Prices)
Gold prices rose on Friday and were on track for robust gains in February, supported by safe-haven demand amid mounting geopolitical tensions and economic uncertainty.
As of 16:33 ET (21:33 GMT), spot gold climbed 1.5% to $5,261.81 an ounce, while April gold futures gained 1.7% to $5,280.26/oz. Spot prices were up more than 8% for the month, rebounding sharply from early-February lows near $4,404.12/oz after a brief speculative pullback.
Gold heads for strong February gains
Escalating tensions between the U.S. and Iran were a major catalyst for gold’s recovery, after Washington increased its military presence in the Middle East and warned of possible action if Tehran rejected a nuclear agreement. Although recent talks ended without a deal, both sides agreed to continue negotiations, offering some cautious optimism.
Economic uncertainty in the U.S. also buoyed bullion, particularly after the Supreme Court of the United States struck down most of President Donald Trump’s trade tariffs. Trump subsequently announced new levies under a different legal framework and signaled further measures, keeping markets wary of additional economic disruption.
A broader equity sell-off, partly driven by shifting sentiment around artificial intelligence stocks, further increased gold’s appeal. Joseph Cavatoni of the World Gold Council noted that investors tend to raise gold allocations during periods of equity weakness, pointing to rising physical demand and stronger ETF inflows, particularly in the Americas and Asia. He added that uncertainty around tariffs, inflation, real yields, and overall economic policy continues to exert upward pressure on gold prices.
Bernstein raises long-term gold forecast
Brokerage firm AllianceBernstein significantly upgraded its long-term gold outlook, citing sustained institutional demand and supportive macroeconomic trends. The firm now projects gold reaching $4,800 per ounce in 2026 and climbing to $6,100 by 2030.
Analyst Bob Brackett emphasized that central bank purchases and ETF flows have been the primary drivers of recent demand. While central bank buying may moderate in 2025, it remains well above pre-2022 levels. Surveys indicate that 95% of central banks expect global gold reserves to rise over the next year, with 73% anticipating a reduced share of U.S. dollar holdings over the next five years. ETF flows, meanwhile, are seen as a key swing factor that can amplify price momentum when inflows accelerate.
Copper supported by China demand outlook
Other precious metals also posted strong February gains. Spot silver surged 6.3% to $93.8490/oz, up nearly 11% for the month, while platinum rose 6.2% to $2,379.10/oz, marking a more than 12% monthly increase.
In industrial metals, copper edged higher on Friday and was modestly positive for February, as markets looked for further signals from China, the world’s largest copper importer. COMEX copper futures rose 1% to $6.0663 per pound, up more than 1% this month.
Copper’s relatively subdued performance earlier in February reflected reduced activity during China’s Lunar New Year holiday, when mainland markets were closed for over a week. Analysts at ANZ noted that both Chinese and global copper inventories increased more than expected during the break due to mining and trade disruptions. With Chinese markets now reopened, attention has shifted back to potential demand growth, particularly as the global artificial intelligence buildout accelerates.
The U.S. dollar slipped on Friday but remained on course for its first monthly advance since October, supported by escalating geopolitical tensions and a more hawkish Federal Reserve stance.
As of 15:11 ET (20:11 GMT), the Dollar Index — which measures the greenback against a basket of six major currencies — was down 0.2% at 97.59, though it was still headed for a roughly 0.6% gain for the month.
Dollar supported by heightened geopolitical tensions
The dollar has drawn support from concerns that the U.S. military buildup in the Middle East could escalate into a conflict with Iran, even as both sides continue discussions over Tehran’s nuclear program.
While the United States and Iran reportedly made some progress in Thursday’s talks, mediator Oman said negotiations concluded without a breakthrough that might prevent potential U.S. military action.
U.S. President Donald Trump told reporters Friday that he was “not exactly happy” with how Iran was handling the negotiations. He added that Tehran had not shown willingness to meet key U.S. demands and reiterated his dissatisfaction with the pace of progress.
Analysts at ING noted that any further escalation in U.S.-Iran tensions currently poses the greatest upside risk for the dollar. They pointed out that prediction market Polymarket still assigns a relatively elevated 55% probability of a U.S. strike on Iran by the end of March, which they believe is limiting further dollar weakness for now.
The greenback has also benefited from a slightly more hawkish tone at the Federal Reserve, after several policymakers signaled at January’s meeting that additional rate hikes remain possible if inflation stays persistent.
Supporting that view, January’s U.S. Producer Price Index (PPI) data released Friday came in well above expectations.
“Near-term factors continue to favor further USD strength, though renewed tariff uncertainty has reinforced the dollar’s risk premium,” ING added, expecting the currency to stabilize barring any major geopolitical developments.
Euro slips in February
In Europe, EUR/USD rose 0.2% to 1.1822 on the day, but the single currency remained on track for a roughly 0.2% monthly decline, as markets expect the European Central Bank to keep interest rates unchanged in the coming months.
Data showed Germany’s unemployment total edged up by 1,000 in February to 2.977 million, reflecting the prolonged economic slowdown that has weighed on Europe’s largest economy over the past three years.
Meanwhile, French consumer prices increased 1.1% year-on-year in February, exceeding expectations and marking a pickup after inflation slowed to a more than five-year low in January.
Analysts at ING said the 1.180 level is likely to continue acting as a near-term anchor for EUR/USD, as heightened uncertainty surrounding Iran discourages strong directional bets.
Elsewhere, GBP/USD was little changed at 1.3485 but was poised to end a three-month winning streak, with sterling down about 1.5% for February.
UK Prime Minister Keir Starmer saw his Labour Party suffer a notable by-election defeat, losing one of its safest seats to the left-wing Green Party of England and Wales.
The result adds to political pressure on Starmer after weeks of turbulence and renewed calls for his resignation. ING noted that developments perceived as weakening Starmer’s position have recently weighed on the pound, as a stronger showing by the Greens may raise expectations of a more left-leaning successor should he step down prematurely.
Yen on track for monthly decline
In Asia, USD/JPY slipped 0.1% to 156.00 on the day, but the pair remained poised for a 0.8% gain in February, reflecting continued weakness in the Japanese currency. The yen has come under pressure as investors assess the fiscal implications of Prime Minister Sanae Takaichi’s stimulus and tax cut proposals.
Takaichi’s ruling coalition strengthened its position after securing a supermajority in Japan’s lower house, clearing the way for her fiscal agenda.
At the same time, uncertainty over the timing of the next rate hike from the Bank of Japan has weighed on the yen. Soft February consumer price data from Tokyo — often viewed as a leading indicator of nationwide inflation — showed core CPI slipping below the BOJ’s 2% annual target for the first time in nearly four years, potentially limiting the scope for further tightening.
Elsewhere, USD/CNY rose 0.3% to 6.8579 after the People’s Bank of China removed a key foreign exchange risk reserve requirement for certain forward contracts, effectively making it cheaper to buy dollars domestically.
The move followed a strong rally in the yuan in recent months, partly fueled by exporters selling dollars amid a robust trade surplus with the United States.
AUD/USD gained 0.2% to 0.7120, with the Australian dollar set for a more than 2% monthly advance, supported largely by a more hawkish policy outlook from the Reserve Bank of Australia.
Official sector demand remains the cornerstone of the gold market. Since Russia’s invasion of Ukraine in 2022, central banks—especially in emerging economies—have stepped up efforts to diversify reserves amid sanctions risks, rising geopolitical fragmentation, and a push to reduce dependence on the United States dollar. Importantly, this buying trend has been consistent and largely insensitive to price swings.
Poland, the largest reported gold buyer last year, has indicated it will continue adding to its holdings, aiming to raise its total gold reserves to about 700 tonnes from roughly 550 tonnes. Rather than targeting a fixed 30% share of reserves, authorities are focusing on increasing the absolute level of holdings—highlighting that reserve accumulation is a strategic priority rather than a short-term tactical move.
Meanwhile, China’s central bank extended its gold-buying streak to a fifteenth consecutive month in January.
With geopolitical fragmentation still in place, a significant pullback in central bank demand appears unlikely. This enduring structural support continues to provide a firm foundation for gold prices, even at elevated levels.
Central Bank Demand Stays Strong
Geopolitics Returns to Center Stage
Geopolitical tensions have once again become a key macro driver. From renewed strains in the Middle East to escalating trade frictions and tariff threats, investors are facing a more fragile and unpredictable global landscape. Policy uncertainty—particularly around trade—has added volatility across asset classes. In this environment, demand for safe-haven assets remains well supported, with gold’s role as a hedge against geopolitical and policy shocks back in sharp focus.
Potential Fed Easing as a Tailwind
A shift in the US monetary policy outlook could provide additional support for gold. Although the Federal Reserve remains cautious, risks are gradually tilting toward policy easing as economic growth moderates and inflation continues to cool.
Our US economist expects rate cuts to begin in the second quarter, with policy becoming progressively less restrictive thereafter. Even a modest easing cycle would likely benefit gold by pushing real yields lower and reducing the opportunity cost of holding non-yielding assets.
Renewed Interest in ETFs
ETF positioning remains well below its 2020 peak, suggesting room for additional inflows. Following a period of consolidation, gold ETFs are once again drawing investor interest. While central bank purchases continue to anchor the market, ETF flows have the potential to magnify price movements.
If expectations for rate cuts strengthen or geopolitical risks intensify, a fresh wave of ETF inflows could drive another leg higher in gold prices. Historically, ETF holdings tend to rise alongside prices and closely track expectations for US monetary policy—reinforcing the case for stronger inflows as the Fed pivots toward a more accommodative stance.
ETF Flows Track Changes in Fed Policy
Digital Dollars and the Evolution of Reserves
Reserve diversification is no longer limited to central banks. The rapid expansion of US dollar–backed stablecoins has introduced a new class of institutional reserve buyers.
Stablecoin issuers—most notably Tether—have emerged as meaningful purchasers of reserve assets, including US Treasuries and, increasingly, gold.
Tether alone acquired more than 70 tonnes of gold last year, ranking second only to Poland among disclosed buyers, and now holds roughly 140 tonnes across its reserves and gold-backed token. If gold continues to play a role in stablecoin reserve allocation, the sector’s growth could become an additional structural source of demand—one that behaves more like central bank accumulation than retail investment flows.
Although still smaller in overall scale, this emerging channel adds another layer of long-term support to the market.
Momentum May Cool, but the Bullish Case Endures
The advance in gold prices is unlikely to follow a straight line. At record levels, physical demand tends to become more price-sensitive, making consolidation phases or short-term pullbacks increasingly likely.
That said, the core drivers behind the rally—central bank diversification, ongoing geopolitical fragmentation, the prospect of policy easing, and renewed ETF inflows—remain firmly in place. For now, the broader macro backdrop continues to favour gold.
Indices: Tech Drags as Futures Edge Lower Before PPI
U.S. equity futures slip slightly after a weak session led by semiconductor losses. The tech-heavy Nasdaq 100 (-1.2% to 25,034) paced declines, followed by the S&P 500 (-0.5% to 6,908), while the Dow 30 (flat at 49,499) avoided closing in the red. Treasury yields eased across the curve, with the 10-year hovering near the 4% threshold, as investors await January PPI data. CME FedWatch pricing still points to rate cuts in July and October as the base case.
Stocks: Chip Selloff; Media Takeover Saga Nears Conclusion
Nvidia (-5.5%) slid despite beating earnings and revenue expectations, dragging the broader semiconductor space lower, including AMD (-3.4%), Intel (-3%), and ASML (-4.1%).
The contest for Warner Bros Discovery (-1.7% AH) appears to be wrapping up, with Netflix (+8.5% extended) stepping aside after Paramount Skydance (+10% close; +6.2% AH) presented a stronger bid.
Block (+23.6%) surged in extended trading after earnings and announcing plans to cut over 4,000 jobs.
IonQ (+21.7%) rallied on upbeat revenue guidance, with Morgan Stanley lifting its price target.
Meta (-0.7% AH) dipped after reports its in-house chip project faced hurdles and that it struck a deal to lease Google TPUs for AI development.
PayPal (-3.7%) declined after denying talks of a potential sale.
Meme stock movers included Beyond Meat (+2.9%), GoPro (+3.3%), Krispy Kreme (+27.8%), Opendoor (+8.6%), and BlackBerry (+2.6%).
Earnings Highlights:
Dell Technologies beat on both earnings and revenue; shares rose 11.6% after hours.
Zscaler missed on deferred revenue and billings; shares fell 9.5% AH.
Synopsys disappointed with full-year guidance; shares dropped 5.2%.
Rolls-Royce beat expectations, raised its profit outlook, and announced £2.5bn in buybacks; shares closed up 5.2%.
Baidu missed revenue forecasts; shares slid 5.7%.
Commodities:
Gold volatility eased as prices hovered near $5,200 but failed to sustain gains above that level, amid geopolitical uncertainty and a firmer dollar. Silver reclaimed $90, narrowing the gold/silver ratio below 58. The World Gold Council flagged stretched valuations.
WTI crude steadied around $65 after elevated intraday swings, with attention on Geneva talks and lingering U.S. military rhetoric. Traders are also focused on Sunday’s OPEC+ meeting amid speculation of a possible April output increase.
FX / Central Banks / Crypto:
Bitcoin retreated toward $68K, while Ether remained above $2K.
The U.S. Dollar Index firmed back into the 97 area, reversing prior losses on stronger labor data and reduced expectations for near-term Fed easing.
Fed officials offered mixed signals: Miran backed four quarter-point cuts this year, while Goolsbee cautioned against easing too quickly before inflation cools.
ECB President Lagarde reiterated inflation is expected to return to the 2% target over the medium term, emphasizing a data-dependent approach and monitoring — not targeting — FX markets.
Data: Stronger-Than-Expected Labor Figures
U.S. initial jobless claims came in at 212K (vs. 217K forecast), with continuing claims falling to 1.833m. Kansas Fed manufacturing improved sharply to 10 from -2.
Tokyo headline CPI rose to 1.6% y/y, though core measures eased. Retail sales rebounded 1.8% y/y, while industrial production disappointed at 2.2% growth (vs. 5.3% expected).
Ahead:
U.S. PPI, Chicago PMI, and Baker Hughes rig count data due later today.
In Europe, German preliminary CPI, import prices, and labor data.
Saturday: Earnings from Berkshire Hathaway.
Sunday: OPEC+ meeting to determine April output levels.
UK markets return to the spotlight on Friday following Labour’s surprise defeat in the Gorton and Denton by-election. Labour’s candidate finished third, while the Greens secured a commanding win over both Labour and Reform. Investors in gilts and sterling must now assess the longer-term implications of the result — including whether it signals growing traction for the radical left within UK politics — and what it could mean for Keir Starmer’s leadership.
Sterling initially strengthened earlier this morning but has since slipped to fresh lows, testing $1.3450. It is currently the weakest performer in the G10 on Friday and the second weakest over the week. Despite heightened political uncertainty, the decline in the pound has been relatively contained so far. Notably, gilts outperformed on Thursday, with yields falling sharply.
Why Starmer may remain secure — for now
Earlier this month, speculation that Starmer could face an internal challenge sparked some volatility in the gilt market. However, that uncertainty faded quickly after senior cabinet members publicly backed him. Although calls for his resignation may intensify within parts of the party, we do not expect Labour heavyweights or cabinet members to support such moves.
It seems unlikely that Starmer would be ousted on the back of this result alone. Few potential rivals would want to assume leadership ahead of next week’s Spring Statement. Moreover, possible successors such as Wes Streeting and Angela Rayner face their own challenges — Streeting could encounter a Green surge in his constituency, while Rayner continues to contend with questions surrounding the stamp duty issue. Cabinet members have already cautioned against overinterpreting the by-election outcome, suggesting Starmer’s position is stable for the time being.
Why a leftward shift may not help Labour
Some within Labour may argue for a sharper move to the left in response to this defeat. However, Gorton and Denton represents just one constituency and is not necessarily indicative of national sentiment. It is far from clear that adopting more left-leaning policies would strengthen Labour’s prospects in the May elections. According to recent YouGov data, the economy remains voters’ primary concern, and more progressive policies may do little to address rising unemployment, particularly among younger people.
Why gilt volatility may remain contained
Although the by-election presents a political test for the gilt market, it is unlikely to trigger significant volatility at week’s end. The broader impact of the May election results is likely to matter more. Additionally, there is speculation that next week’s Spring Statement could see the Office for Budget Responsibility reduce its forecast for gilt issuance this year, following strong tax receipts earlier in the year. That could help ease upward pressure on yields and offset any market reaction to Labour’s loss.
Technical focus: GBP/USD
Sterling is broadly weaker today, though the by-election result has not sparked a full-scale sell-off. GBP/USD is hovering around its 200-day simple moving average at $1.3447. A decisive break below this level would represent a significant technical deterioration and suggest downside momentum is building.
Netflix rallies after abandoning Warner Bros Discovery bid
European equity futures point to a firmer open on Friday, capping another week in which European indices are set to outperform US markets. Netflix is in focus after confirming it has withdrawn its bid for Warner Bros Discovery. The stock jumped 8% in post-market trading on Thursday and could recover much, if not all, of its roughly 10% year-to-date decline.
Investors will also monitor European inflation data, with attention on France to see whether CPI rebounds following a sharp drop earlier in the year.
Bitcoin declined on Friday, halting a recovery from its midweek lows as investor risk appetite stayed weak. The world’s largest cryptocurrency is now on track for a fifth straight month of significant losses.
The broader crypto market moved largely in line with Bitcoin and is also poised for steep losses in February, as both retail and institutional investors continued to avoid the sector.
By 00:48 ET (05:48 GMT), Bitcoin was down nearly 1% at $67,788.0.
Bitcoin on track for fifth straight monthly decline
Bitcoin was down nearly 14% in February, as the risk-off sentiment in the crypto market showed little sign of easing throughout the month.
Rising geopolitical tensions worldwide, uncertainty surrounding major global economies, and concerns over further disruptions from U.S. trade tariffs kept investors cautious and away from speculative assets like cryptocurrencies.
The digital asset dropped as much as 50% from its October record high earlier this month, though it has since staged a modest recovery from those lows.
Bitcoin has remained in a sustained downtrend since October, with purchases by major corporate holder Strategy doing little to stem the losses.
Strategy has also reportedly slowed its pace of Bitcoin acquisitions in recent months, amid mounting concerns that continued price declines could force the company to sell part of its holdings to service its debt.
MARA Holdings jumps as AI deal eclipses weak Q4 results
Shares of MARA Holdings — previously known as Marathon Digital (NASDAQ: MARA) — surged Thursday evening after the Bitcoin mining company revealed a partnership with Starwood Capital to repurpose several of its mining facilities into artificial intelligence data centers. The stock climbed as much as 17% in after-hours trading.
The announcement helped eclipse a steep $1.7 billion loss in the fourth quarter, driven by an extended slump in Bitcoin prices that severely pressured the firm’s mining profitability. Revenue also came in below expectations.
Amid continued weakness in Bitcoin and growing investor enthusiasm around AI, MARA has recently been shifting strategy, aiming to redeploy its computing infrastructure toward AI data center operations rather than focusing solely on cryptocurrency mining.
Crypto prices today: Altcoin recovery fades, February losses loom
Crypto markets retreated on Friday, giving back much of this week’s brief rebound, with most tokens on track to post steep declines for February.
The world’s second-largest cryptocurrency, Ethereum, slipped 1.2% to $2,038.21 and was heading for a monthly drop of nearly 17%. The token faced additional pressure after co-founder Vitalik Buterin sold more of his holdings, reinforcing cautious sentiment across the market.
XRP fell 2.3% and was poised to lose around 15% in February, while BNB held steady on Friday but remained down close to 20% for the month.
Solana was also nursing losses of roughly 17% in February, whereas Cardano traded largely unchanged. In the meme coin segment, Dogecoin declined 5.4% for the month, while Official Trump tumbled about 20% over the same period.
Most Asian currencies slipped on Friday as investors weighed a mixed interest rate outlook across the region. The Australian dollar was on track for a solid monthly gain, while the Japanese yen remained under pressure.
The Chinese yuan declined after Beijing lowered a key reserve requirement to make dollar purchases cheaper domestically, though the currency continued to hover near three-year highs.
Meanwhile, the dollar index and dollar index futures edged down about 0.1% in Asian trading. Despite the dip, the greenback was up 0.7% for February, supported by safe-haven demand and lingering uncertainty over the direction of interest rates.
Japanese yen subdued after weak Tokyo CPI, February decline in focus
The Japanese yen saw the USD/JPY pair slip 0.2% on Friday and was on track to gain 0.7% for February.
Pressure on the yen intensified as uncertainty grew over the timing of the Bank of Japan’s next interest rate hike. Those doubts deepened following softer-than-expected consumer price index data from Tokyo for February.
The reading—often viewed as a leading indicator for nationwide inflation—showed core CPI falling below the BOJ’s 2% annual target for the first time in nearly four years, potentially complicating the central bank’s plans for further rate increases.
The yen had weakened earlier in February amid concerns about the fiscal implications of Prime Minister Sanae Takaichi’s proposed stimulus measures and tax cuts. However, she appeared to gain momentum for advancing her fiscal agenda after her ruling coalition secured a supermajority in Japan’s lower house of parliament.
Chinese Yuan slips after PBOC lowers FX risk reserve ratio
The Chinese yuan’s USD/CNY pair rose 0.2% on Friday after the People’s Bank of China removed a key foreign exchange risk reserve requirement for certain forward contracts—a step that makes dollar purchases cheaper domestically.
The move follows a strong rally in the yuan against the dollar in recent months, partly fueled by exporters offloading the greenback amid a robust trade surplus with the United States.
However, rapid appreciation of the yuan can weigh on Chinese exporters by shrinking returns on overseas sales. Friday’s decision suggests the central bank may be aiming to curb further strength in the currency.
The yuan had approached a three-year high on Thursday before pulling back.
Australian dollar set for February gains on hawkish RBA outlook
The Australian dollar’s AUD/USD pair climbed 0.25% on Friday, ranking among Asia’s top performers for the month.
The Aussie was on track to advance 2.3% in February, largely supported by a more hawkish stance from the Reserve Bank of Australia. The central bank raised interest rates by 25 basis points earlier in the month and signaled it would tighten further if inflation fails to ease.
Stronger-than-expected January CPI data released this week reinforced expectations that the RBA could deliver additional rate hikes.
Elsewhere in the region, most Asian currencies edged lower on Friday. The South Korean won’s USD/KRW pair ticked up slightly but remained down 1.3% for February.
The Indian rupee’s USD/INR pair steadied after climbing back above the 91-per-dollar mark, though it was still 0.8% weaker this month, despite gaining support from a U.S.–India trade agreement.
Meanwhile, the Singapore dollar’s USD/SGD pair was little changed on the day and down 0.7% for February.
The U.S. dollar steadied on Thursday, recovering from earlier declines after upbeat earnings from AI heavyweight Nvidia, as investors looked ahead to further clarity on upcoming U.S. tariff measures.
As of 03:00 ET (08:00 GMT), the US Dollar Index, which measures the greenback against six major peers, was up 0.1% at 97.650. Despite the modest rebound, the index remained on course for a weekly drop of roughly 0.2%.
Dollar Holds Steady Following Strong Results from Nvidia
The dollar steadied after starting the session under pressure, as stronger-than-expected earnings from Nvidia lifted investor sentiment and reduced demand for the traditional safe-haven currency.
The world’s most valuable company reported January-quarter revenue that topped analyst forecasts and projected current-quarter sales above market expectations, reinforcing optimism around the AI theme.
“Improved sentiment has weighed on the dollar over the past 24 hours, with only the yen faring worse among G10 currencies yesterday,” analysts at ING Group noted.
Markets are also watching how the Trump administration responds to the February 20 Supreme Court decision that invalidated the president’s emergency tariffs. Meanwhile, U.S. Trade Representative Jamieson Greer said Wednesday that tariff rates for certain countries will increase to 15% or more from the newly introduced 10%, though he did not specify which trading partners would be affected.
In addition, U.S. and Iranian officials are set to meet in Geneva to discuss a potential nuclear agreement, with Donald Trump warning that “bad things” could occur if meaningful progress is not made.
According to ING, any escalation in tensions could serve as the most credible trigger for a broader dollar rally, particularly given the supportive backdrop from Nvidia’s results and the absence of major economic data releases. Overall, while the dollar may find some near-term stability, downside risks persist as the positive spillover from Nvidia’s earnings keeps investors leaning away from defensive currencies for now.
Euro edges lower
In Europe, EUR/USD slipped 0.1% to 1.1798 ahead of the latest Eurozone consumer confidence data due later in the session.
Still, both these figures and Friday’s inflation release are unlikely to move the needle much for the single currency, as the European Central Bank is widely expected to leave interest rates unchanged for the foreseeable future.
“For now, the EUR/USD short-term rate differential remains unsupportive for the pair, but we haven’t seen a sufficient rebound in dollar confidence to call for a significant downside break. We continue to view 1.1750 as solid support, absent a major escalation involving Iran,” analysts at ING Group said.
Meanwhile, GBP/USD declined 0.3% to 1.3523, with sterling failing to gain traction despite improved sentiment data from the UK’s business and professional services sector.
The latest quarterly survey from the Confederation of British Industry showed optimism in the sector rebounded sharply to -3 in February from -50 in November — its strongest reading since August 2024.
Yen Strengthens Following Interview with Kazuo Ueda
In Asia, USD/JPY slipped 0.3% to 156.01 after Kazuo Ueda, governor of the Bank of Japan, told the Yomiuri Shimbun that policymakers will внимательно assess incoming data at their March and April meetings, keeping the door open to another rate hike if inflation and wage growth remain solid.
His comments bolstered expectations that Japan will stay on a gradual path toward policy normalization.
The yen had weakened the previous day following reports that Prime Minister Sanae Takaichi adopted a cautious stance on additional rate increases, alongside news that two dovish-leaning nominees were selected for the BOJ board.
Meanwhile, USD/CNY declined 0.4% to 6.8392, hitting a fresh 34-month low amid anticipation of supportive measures ahead of China’s annual legislative gathering, the National People’s Congress. Investors are looking for growth targets and potential fiscal stimulus signals from the meeting, which typically outlines Beijing’s economic agenda for the year.
Elsewhere, AUD/USD eased 0.1% to 0.7114, while NZD/USD fell 0.2% to 0.5988.
The benchmark 10-year Treasury yield is testing critical support, with downside pressure beginning to build.
Equities and bond yields are sliding in tandem — an unusual combination that may reflect deteriorating macro-risk conditions.
A strengthening US dollar alongside declining yields could point to a broader defensive rotation across markets.
Last week, attention was drawn to the danger zone in the CBOE Volatility Index. Historically, when Wall Street’s “fear gauge” climbs into the mid-20s, equity markets have tended to experience heightened turbulence.
Now, focus shifts to the benchmark 10-year US Treasury yield. Recently, declining yields have supported the S&P 500 — particularly small- and mid-cap shares — since the so-called Liberation Day and the development of the expansive One Big Beautiful Bill Act (OBBBA). Additional fiscal stimulus or tax relief may still be forthcoming, as suggested by Donald Trump during Tuesday night’s State of the Union address.
Importantly, the surge in yields last April and May was not confined to the United States. Global bond markets reached multi-decade highs, pulling US Treasuries higher in tandem. Despite narratives around “selling America,” the primary US bond bear market unfolded between August 2020 and October 2023, when the 10-year yield climbed sharply from 0.504% to 4.997%. The past two and a half years have largely represented a consolidation phase rather than a fresh structural breakout.
The key question now: is that consolidation nearing resolution — and if so, in which direction?
10-Year Treasury Yield: A historic tightening pattern after the major bond bear market. Chart courtesy of StockCharts.com.
Treasuries Under the Spotlight
The chart below suggests that the 10-year Treasury yield could be slipping beneath a critical support level. A brief upside breakout in January quickly reversed as sellers stepped in, and now the benchmark rate is hovering near the 3% mark. It’s worth reminding traders that diagonal trendlines can be unreliable, while horizontal support and resistance levels tend to carry more weight. Additionally, log-scale charts are generally better suited for evaluating wide swings in price or yield.
With those caveats noted, what is the chart signaling? Trading below both the 50-day and 200-day moving averages, the primary trend favors Treasury price bulls (and lower yields). Meanwhile, the RSI has eased back toward the 30 level after failing to reach 70 during the fourth-quarter rate advance. The green upward-sloping support line is now pivotal — a decisive break beneath it, along with a drop below the late-2025 low of 3.947%, could push the 10-year yield down into the low 3% range.
10-Year Treasury Yield: Multi-Year Consolidation With Key Support at Risk (Log Scale). Chart courtesy of StockCharts.com.
In isolation, increasing exposure to Treasuries would be logical if yields break down and bond prices attract strong demand. But stepping back with an intermarket perspective, the bigger question becomes: what would that move signal for the broader financial markets?
A Potential Shift in the Stock–Bond Dynamic?
For stocks, a move toward 3–4% intermediate-term rates would likely coincide with softer economic conditions — perhaps a weak jobs report, sharply cooling CPI or PCE inflation, a downturn in sentiment indicators such as the ISM Manufacturing survey, or another disappointing Retail Sales release.
That said, with the fourth-quarter earnings season mostly wrapped up — including NVIDIA’s (NASDAQ: NVDA) results released Wednesday — it would probably take truly bleak off-season earnings updates or a wave of negative preannouncements to significantly rattle equities.
Another potential driver of a renewed bond bull market could be the ever-intensifying AI theme. In a “sell first, ask questions later” climate, fresh cautionary analyses or existential-impact discussions around artificial intelligence could further unsettle investors and sustain demand for safe-haven assets.
When Trading Ranges Start to Break Down
Regardless of the underlying catalyst, it’s evident that stocks and bonds are no longer moving in sync the way they did last spring and summer. The S&P 500 — like the 10-year Treasury yield — has been edging lower in recent weeks. We’re now nearly a month past the SPDR S&P 500 ETF Trust (SPY) intraday record of $697.84. Although much attention has focused on the tight trading range since late November, one could argue that a rounded-top formation is beginning to take shape.
A glance at the RSI momentum oscillator reinforces this view. Momentum has been trending lower since July. Much like a ball tossed into the air slows before changing direction, RSI often decelerates ahead of a price reversal. The unfolding narrative could be this: bond yields break down first — and equities eventually follow.
SPY: Emerging Rounded-Top Pattern, RSI Deteriorating, 200-Day Moving Average Around $650. Chart courtesy of StockCharts.com.
Don’t Overlook the Dollar
Largely flying under the radar is the US Dollar Index (USD). The greenback carved out a low near 95.55 around the same time U.S. large-cap equities peaked. Since then, the 98 level has surfaced as a potential breakout zone.
A setup featuring falling Treasury yields, declining stocks, and a strengthening dollar would reflect a classic risk-off macro environment. Based on a measured-move projection, the USD could target the 100 area — just shy of the zone where the dollar encountered resistance from May through November 2025.
US Dollar Index: Short-Term Ascending Triangle Pattern Points Toward 100. Chart courtesy of StockCharts.com.
The Bottom Line
Is this a doomsday forecast? Not at all. Market corrections are a normal part of the cycle. On average, the S&P 500 experiences an intra-year drawdown of about 14.2%, yet it has still finished higher in 35 of the past 46 years.
Rather than sounding alarms, this is simply a cross-asset check-in as we head into a month that has historically delivered heightened volatility. I tend to think of March as October’s little brother — price swings can become exaggerated. And with the CBOE Volatility Index still hovering around 20, disciplined risk management deserves to remain front and center.
The February 26–March 3 cycle represents a projected volatility expansion window. If price maintains support above the weekly mean and regains upside momentum, the next bullish targets come in at $98, $105, and potentially $120. However, a breakdown below the $85.39 daily Buy-2 level would postpone the expansion phase and shift the market back into a deeper accumulation range between $81.85 and $79.71.
Silver futures are currently trading within a structured VC PMI mean-reversion model, signalling a transition from distribution into a fresh decision phase as price oscillates around both the daily and weekly averages. Within the VC PMI framework, the mean represents equilibrium — the point where supply and demand balance. Moves toward Buy-1/Buy-2 or Sell-1/Sell-2 define statistically extreme zones, carrying a 90%–95% probability of reverting back toward the mean.
Around the $89 area, silver has pulled back from upper resistance and is now rotating toward the daily mean in the $89–$90 zone. The weekly Sell-1 level at $88.03 and Sell-2 at $93.09 frame the upper distribution band. A decisive close above $93.09 would confirm a bullish breakout into the next fractal structure, flipping resistance into support and opening harmonic upside projections toward $98–$105 based on Square of 9 geometric expansion.
On the downside, failure to sustain trade above the weekly mean near $80.22 would keep silver locked in a broader consolidation pattern. In that scenario, Buy-1 at $75.16 and Buy-2 at $67.35 define longer-term accumulation levels.
Time-cycle analysis highlights February 26 to March 3 as a pivotal rotational window — a period when corrective phases often conclude and directional momentum emerges. This timing aligns with the current consolidation around the mean, increasing the probability of volatility expansion into early March. A secondary cycle window between March 8 and 12 historically signals either continuation or reversal, depending on whether price holds above or below the mean established during the initial cycle.
These cyclical harmonics are derived from recurring liquidity patterns and repetitive market behavior rather than macro fundamentals, underscoring the quantitative foundation of the VC PMI framework.
Square of 9 geometry reinforces the current technical framework, highlighting harmonic resistance around $93 and $100 as key angular levels projected from prior lows and rotational pivot points. On the downside, support harmonics cluster near $85, $81.85, and $79.71, creating a geometric staircase of demand zones where the probability of institutional accumulation increases. When time and price harmonics converge, markets tend to generate accelerated directional moves — particularly if price pushes above the Sell-2 extreme or breaks below the Buy-2 threshold.
By integrating VC PMI, cyclical timing analysis, and Square of 9 geometry, this methodology offers a structured, rules-based trading approach. The emphasis remains on statistical probability, market structure, and disciplined execution rather than emotional decision-making.
Nvidia’s (NASDAQ: NVDA) $78bn revenue projection would once have sparked a broad rally in global equities. This time, investors paused.
The stock initially slipped before edging slightly higher in post-market trading. In this stage of the AI cycle, rapid expansion alone is no longer enough to impress the market.
Over the past two years, artificial intelligence exposure commanded a premium almost regardless of valuation. Capital flowed aggressively into the AI infrastructure layer, with Nvidia at the epicentre. Its chips became foundational to hyperscale data centres, sovereign digital strategies, and enterprise AI rollouts. Valuations climbed on expectations of sustained, exponential demand. Now, scrutiny has intensified.
A $78bn forecast confirms demand remains robust—but it also suggests expectations were already set near perfection. Markets are no longer rewarding size alone; they are evaluating the durability, quality, and profitability behind that growth.
Investors are calling for tighter operating discipline. They want clearer visibility on margins, pricing strength, and forward orders. Strong revenue growth does not automatically guarantee lasting shareholder returns when valuations assume near-flawless execution.
Nvidia’s competitive position remains strong. It continues to underpin the AI infrastructure ecosystem. Hyperscale cloud providers are spending aggressively, governments are advancing sovereign AI ambitions, and enterprise adoption is accelerating. The structural tailwinds remain intact.
What has changed is the market’s tolerance for uncertainty. Premium valuations now demand premium predictability—stable gross margins, resilient pricing power, and a more diversified revenue mix.
Markets are likely to scrutinise customer concentration, especially reliance on a limited group of hyperscale clients. They will question whether current capital expenditure by major cloud operators marks a cyclical high or the start of a sustained multi-year investment cycle.
Any indication that AI-driven capex is plateauing rather than accelerating could trigger disproportionate market reactions. Competitive pressures are also building. As large cloud providers ramp up in-house chip development, investors will increasingly assess how defensible Nvidia’s ecosystem remains amid the rise of alternative silicon architectures.
This shift does not negate the AI revolution — it sharpens its contours.
The implications stretch far beyond a single company. Semiconductor peers, advanced memory manufacturers, data-centre infrastructure providers and AI-centric software firms have largely traded in tandem with Nvidia’s rally. A more discerning market is now separating businesses that translate AI adoption into concrete earnings from those still priced primarily on long-term potential.
Dispersion within AI equities is likely to widen over the coming year. Infrastructure leaders with strong cash flow and resilient balance sheets may continue to attract support. By contrast, application-layer companies that have yet to prove sustainable monetisation could face heightened volatility.
Institutional investors are applying greater discipline to their assumptions. Portfolio managers who heavily overweighted AI leaders during the initial surge are revisiting long-term growth trajectories beyond peak deployment phases. Scenarios in which hyperscale spending moderates into 2027 are increasingly part of valuation models, with capital intensity and return on invested capital under renewed scrutiny.
AI companies are being assessed more like established enterprises than early-stage disruptors. Market psychology has matured.
For Nvidia, this phase could ultimately reinforce its leadership if operational execution remains strong. Consistent free cash flow, ongoing innovation cycles and deep integration across the AI value chain offer structural advantages. However, expectations have risen materially. Earnings announcements may drive sharper volatility as the scope for positive surprise narrows.
Markets are transitioning from thematic enthusiasm to detailed financial examination. Compelling narratives must now be backed by measurable precision.
The AI expansion is tangible. The capital investment is tangible. The demand is tangible. But investors are no longer rewarding mere participation in the theme — they are rewarding disciplined growth, sustainable margins and transparent capital deployment.
Nvidia’s $78bn revenue outlook affirms that large-scale AI expansion continues. The subdued market response underscores a parallel reality: momentum alone is insufficient to justify elevated valuations.
The next stage of the AI cycle will favour companies capable of turning market leadership into reliable profitability. Those that fall short may discover that even strong revenue growth offers limited insulation when expectations are already stretched.
Futures tied to the main U.S. stock benchmarks edged lower as investors focused on key earnings from the technology sector. Nvidia, a heavyweight in the U.S. equity market, delivered stronger-than-expected results, though investors are seeking clearer guidance on when its substantial cash flow will translate into greater shareholder returns. Salesforce shares declined after issuing a softer revenue outlook. Meanwhile, oil prices held steady ahead of crucial nuclear negotiations between U.S. and Iranian officials.
Futures Edge Lower
U.S. equity futures moved down Thursday as markets digested earnings from AI leader Nvidia.
As of 03:05 ET (08:05 GMT), Dow futures were down 122 points, or 0.3%, S&P 500 futures slipped 0.1%, and Nasdaq 100 futures also fell 0.1%. This followed gains across all major Wall Street indices in the previous session, when investors positioned ahead of Nvidia’s earnings release.
Sentiment had improved on renewed optimism surrounding artificial intelligence, marking another shift in what has been a volatile narrative around the emerging technology. The Nasdaq led prior gains as investors regained confidence that AI could eventually deliver broad economic benefits — contrasting with earlier concerns that new AI models might disrupt software firms and limit returns on heavy data center spending.
Remarks from Richmond Fed President Tom Barkin also supported equities, as he noted uncertainty over whether automation would significantly raise unemployment and suggested AI could instead improve labor market efficiency.
Nvidia Little Changed Despite Strong Results
Nvidia reported better-than-expected earnings for the January quarter and issued revenue guidance above forecasts for the current period, yet its shares were mostly flat in after-hours trading.
Some investors questioned whether the chipmaker is returning sufficient capital to shareholders. Yvette Schmitter, CEO of Fusion Collective, pointed out that while Nvidia generated $35 billion in cash during the fourth quarter, it returned just 12% to shareholders — sharply lower than 52% a year earlier.
She also raised concerns about reduced buybacks despite record cash generation, especially as Nvidia highlights strong demand for its sold-out Ampere chips.
These concerns echoed questions raised during the company’s earnings call, including from a UBS analyst who asked whether Nvidia plans to distribute more of the anticipated $100 billion in cash expected this year. CFO Colette Kress emphasized ongoing investment in the broader AI ecosystem, while CEO Jensen Huang underscored AI’s foundational role in the future of computing.
Salesforce Drops on Soft Revenue Outlook
Salesforce shares fell in extended trading after the company issued fiscal 2027 revenue guidance below Wall Street expectations, suggesting softer demand for enterprise software amid economic uncertainty and tighter corporate budgets.
The company projected full-year revenue between $45.80 billion and $46.20 billion, slightly below consensus estimates at the midpoint.
Salesforce continues to invest heavily in artificial intelligence to counter investor concerns that emerging AI models, such as those developed by startups like Anthropic, could erode demand. These pressures have contributed to stock volatility as the company works to defend its position within the software-as-a-service industry.
However, Salesforce raised its fiscal 2030 revenue forecast to $63 billion from $60 billion, citing expected growth from agentic AI offerings. Analysts at Vital Knowledge described the report as not flawless but “good enough,” highlighting strong AI product momentum, stable core performance, and solid cash flow generation.
Oil Steady Before U.S.- Iran Talks
Oil prices were largely unchanged Thursday, remaining near seven-month highs as markets prepared for a third round of nuclear discussions between Washington and Tehran.
Brent crude gained 0.2% to $70.84 per barrel, while U.S. West Texas Intermediate rose 0.2% to $65.62 per barrel.
U.S. representatives, including special envoy Steve Witkoff and adviser Jared Kushner, are scheduled to meet Iranian officials in Geneva as negotiations continue over Iran’s nuclear program. President Donald Trump has warned that failure to make meaningful progress could lead to serious consequences, raising concerns that prolonged tensions may disrupt supply from Iran, a key OPEC producer.
Gold Edges Higher
Gold prices ticked up as uncertainty surrounding U.S. trade tariffs bolstered safe-haven demand, with investors also monitoring developments in the U.S.-Iran nuclear talks.
Spot gold rose 0.6% to $5,196.55 per ounce, while U.S. gold futures dipped 0.5% to $5,200.54 per ounce.
Markets are also evaluating the implications of newly announced U.S. tariffs following a Supreme Court ruling that struck down President Trump’s sweeping reciprocal tariff measures. Attention now turns to upcoming U.S. economic data, including weekly jobless claims. So far this year, gold has remained supported by geopolitical tensions, central bank buying, and portfolio diversification trends.
Most Asian currencies traded in a tight range on Thursday as lingering uncertainty over U.S. trade policy kept sentiment cautious, though the Chinese yuan and Japanese yen stood out on domestic drivers.
The US Dollar Index slipped 0.1% during Asian trading hours, with its futures also down 0.1% as of 00:22 ET (05:22 GMT).
Chinese yuan surges to 34-month high on policy hopes
China’s onshore yuan strengthened, with USD/CNY sliding 0.5% to a new 34-month low of 6.834 ahead of the country’s annual parliamentary session, the National People’s Congress. Markets are betting on fresh policy backing as investors look for growth targets and potential fiscal stimulus signals that will shape Beijing’s economic agenda for the year.
The offshore yuan also advanced, with USD/CNH touching its weakest level since mid-April 2023.
Elsewhere in the region, currencies were mostly subdued as concerns over U.S. tariffs persisted. President Donald Trump’s 10% global tariffs came into force earlier this week, with plans underway to raise them to 15%.
The South Korean won was little changed after the Bank of Korea kept its benchmark rate steady at 2.5%, in line with expectations. The Singapore dollar edged 0.1% higher against the greenback, while the Indian rupee gained 0.1%. The Australian dollar rose 0.2%.
Yen rebounds on BOJ rate hike expectations
The Japanese yen strengthened, with USD/JPY falling 0.4%, after Kazuo Ueda, Governor of the Bank of Japan, said policymakers would carefully assess incoming data at their March and April meetings, leaving room for another rate hike if inflation and wage growth remain solid.
His comments bolstered expectations that Japan will stay on a gradual path toward policy normalization.
The yen had weakened a day earlier following reports that Prime Minister Sanae Takaichi adopted a cautious stance on further tightening and after two more dovish-leaning members were nominated to the BOJ board.
Analysts at ING said the addition of new board members would broaden the range of views in policy discussions, though no single perspective is likely to dominate. They added that a June rate hike appears more likely than one in April, pending confirmation of strong spring wage gains and April inflation data.
GBP/USD extended its advance for a fourth straight session, hovering near 1.3510 in Wednesday’s Asian trading. The pair is benefiting from continued softness in the US Dollar after US President Donald Trump delivered the first State of the Union address of his second term before a joint session of Congress.
Technical Analysis
GBP/USD continues to draw support near the 200-period Simple Moving Average (SMA) on the four-hour chart, around the 1.3550 area, which now serves as an important short-term pivot. The MACD histogram remains in negative territory, reflecting that the MACD line is still below the Signal line near the zero threshold. Meanwhile, the RSI stands at 40 — leaning neutral-to-bearish — after bouncing from earlier lows, indicating that upside moves may lack strong conviction.
As long as price holds above the upward-sloping 200-period SMA, the near-term bias remains constructive. However, a decisive break back below this level would tilt momentum in favor of sellers. A turn of the MACD histogram into positive territory would signal easing bearish pressure. For a stronger recovery outlook, the RSI would need to climb back above 50; remaining below that mark would likely keep rallies contained and shift focus toward consolidation rather than a sustained advance.
Fundamental Analysis
The GBP/USD pair edges lower for a second consecutive session on Tuesday, sliding to its weakest level in over a week — around the mid-1.3500s — during early European trading after the release of the UK labor market data.
Figures from the UK Office for National Statistics showed the ILO unemployment rate rose to 5.2% in the three months to December, up from 5.1% previously and marking the highest reading since early 2021. Meanwhile, jobless claims increased by 28.8K in January, signaling further softening in the labor market at the start of 2026.
Wage growth also cooled notably. Average Earnings Excluding Bonus rose 4.2% in the three months to December, easing from 4.6% in the prior quarter and hitting the slowest pace in nearly four years. Earnings Including Bonuses likewise slowed to 4.2% from 4.6%. Unless UK inflation data due Wednesday delivers an upside surprise, the latest employment figures reinforce expectations that the Bank of England could cut rates as soon as March, adding pressure on the British Pound.
At the same time, the US Dollar strengthens to a one-week high, further weighing on GBP/USD. However, the greenback’s upside appears limited by dovish Federal Reserve expectations. Following softer US inflation data last Friday, markets increased bets that the Fed may begin easing policy in June. Current pricing suggests at least two rate cuts in 2026, and lingering concerns about the Fed’s independence also restrain bullish USD momentum.
With traders hesitant to take aggressive positions ahead of clearer guidance on the Fed’s path, attention now shifts to the FOMC Minutes on Wednesday and the US Personal Consumption Expenditure (PCE) Price Index on Friday. These releases will be pivotal for shaping expectations around US monetary policy and, in turn, the direction of the dollar. Additionally, Wednesday’s UK CPI report could inject fresh volatility into GBP/USD as the week progresses.
Bitcoin’s latest decline is unfolding amid mounting macroeconomic headwinds and crypto-specific pressures, fueling fears that the downtrend could deepen, with some analysts eyeing a potential floor near $45,000.
Trump’s 15% Global Tariff Weighs on BTC
On Saturday, February 21, US President Donald Trump unveiled a 15% blanket tariff on imports, jolting global financial markets — cryptocurrencies included. The move followed a decision by the US Supreme Court to overturn his earlier sweeping tariff measures. The revised levy, initially proposed at 10% before being lifted to 15%, officially comes into force today, February 24, 2026.
Activated under Section 122 of the Trade Act of 1974, the new tariff covers the majority of imported goods for an initial 150-day period, with any extension subject to congressional approval. Although intended to narrow trade imbalances, the measure has heightened economic uncertainty, triggering a widespread retreat from risk-sensitive assets.
Within the crypto market, the development has reinforced a risk-off mood, as investors rotate out of volatile positions into safer havens. Bitcoin holders are increasingly realizing losses, with on-chain figures indicating more than $2.3 billion in realized losses over the past week.
Crypto analyst IT Tech described the move as one of the most significant capitulation phases in Bitcoin’s history, comparing it to the 2021 market crash, the 2022 Luna/FTX collapse, and the mid-2024 correction. In a post on X, he noted that the scale of losses ranks among the top three to five worst drawdowns ever recorded, adding that only a few moments in Bitcoin’s history have witnessed such intense capitulation.
The reaction reflects mounting concerns that higher import costs could reignite inflationary pressures, potentially forcing the Federal Reserve to delay rate cuts and keeping financial conditions tighter for longer.
Markets sold off swiftly following the announcement, with Bitcoin sliding intraday to below the $63,000 mark.
Spot Bitcoin ETFs Extend Outflow Streak to Five Weeks
Adding to the tariff-driven volatility, U.S.-listed spot Bitcoin ETFs have now recorded five consecutive weeks of net outflows — the longest stretch of withdrawals since February 2025.
Data from SoSoValue shows that nearly $3.8 billion has exited these funds over the five-week period, including $316 million in redemptions last week alone.
BlackRock’s iShares Bitcoin Trust (IBIT) accounted for the largest share of the withdrawals, losing roughly $2.1 billion during the streak. Fidelity Investments’ Fidelity Wise Origin Bitcoin Fund (FBTC) and several other products also saw notable outflows.
The sharp reversal from the strong inflows seen in late 2024 highlights a cooling in institutional appetite, as portfolio managers trim crypto exposure amid heightened macro uncertainty and broader market turbulence.
The persistent ETF withdrawals are intensifying sell-side pressure on Bitcoin, as fund managers are forced to offload underlying BTC holdings to satisfy investor redemptions.
With total net outflows reaching $4.5 billion so far in 2026, much of the earlier inflow momentum has been erased. Analysts describe the environment as a “risk-off stress test,” where macro headwinds — including tariffs and geopolitical tensions — are discouraging fresh allocations into crypto.
Sentiment indicators reflect the strain. The Crypto Fear & Greed Index has plunged to one of its most extreme fear readings on record, reinforcing the ongoing wave of liquidation. Unless ETF flows stabilize or reverse, downside momentum may continue, particularly if institutional distribution remains dominant.
Bear Pennant Signals $45K Target for Bitcoin
From a technical perspective, Bitcoin’s chart structure remains bearish, with a well-defined bear pennant forming on the daily timeframe.
A bear pennant is a continuation pattern that follows a steep decline (the flagpole), then consolidates within a tightening symmetrical triangle before typically breaking lower.
The BTC/USD pair fell below a major support level at $80,117 — its November 2025 low — and slid to $60,000 on February 6, forming the flagpole. A rebound toward $72,000 followed, before price retreated again to around $63,100.
The pattern confirmed on Monday when Bitcoin broke beneath the pennant’s lower trendline near $67,000. Based on the measured-move technique — projecting the height of the flagpole from the breakout point — the downside target falls in the $45,000–$50,000 range.
A drop toward $45,000 would imply roughly a 28% decline from current levels, underscoring the risk of further capitulation if macro and flow dynamics fail to improve.
The bearish outlook is reinforced by strengthening downside momentum, with the RSI sliding from overbought territory near 70 on January 15 to around 29 currently — signaling growing selling pressure and near-oversold conditions.
Bitcoin continues to trade below key moving averages, keeping the broader technical structure fragile. A decisive break beneath the $60,000 threshold could intensify losses, opening the door toward the $52,450 realized price level — a historically significant support area.
On the other hand, a sustained move above $72,700 would invalidate the bear pennant setup and could shift momentum back in favor of the bulls, paving the way for a broader recovery.
US stock futures stabilized on Tuesday following a shaky start to the week, as renewed selling linked to AI disruption concerns unsettled investors. Sentiment was also dented by fresh uncertainty around US President Donald Trump’s tariff agenda. Anxiety over artificial intelligence’s potential to disrupt software and wider industries intensified after a bearish report from Citirni Research highlighted AI-related risks extending beyond the tech sector.
While the intensity of the “AI scare” trade appears to be easing and traders are stepping back into some beaten-down tech names, markets remain cautious amid ongoing tariff confusion. This comes after Friday’s turbulence triggered by the US Supreme Court’s decision to overturn President Trump’s sweeping tariff measures.
The US100 is trying to stabilize after sliding 1.13% in the previous session, breaking below a medium-term ascending trendline drawn from the August lows. The index is trading just beneath the 38.2% Fibonacci retracement of the October 30–November 21 decline from the record peak of 24,757. Immediate support is seen at the 23.6% Fibonacci level around 24,400, while a recovery could prompt a retest of the short-term SMAs near 25,075 and 25,300.
Tariff uncertainty and US-Iran tensions support Gold
Gold is retreating from a three-week high near 5,250 as a firmer US dollar and profit-taking pressure prices after a rally fueled by tariff uncertainty and geopolitical risks in the Middle East. Investors are awaiting further clarity on President Trump’s trade policy after the Supreme Court invalidated his earlier global tariff framework. The administration has since introduced temporary 15% tariffs aimed at addressing what it describes as a balance-of-payments crisis, a characterization questioned by many economists.
Attention also remains on escalating US-Iran tensions ahead of a third round of talks, as the White House signals it may be edging closer to potential military action related to Iran’s nuclear program, including additional naval deployments. Later today, President Trump’s State of the Union address could add another layer of volatility.
Technically, gold has snapped a four-day winning streak and is testing firm support at 5,141 — the 61.8% Fibonacci retracement of the January 29–February 2 decline from its record high. Further support lies near the 20-day SMA around the key 5,000 mark. Despite the pullback, the broader bias remains positive, with both MACD and RSI still in bullish territory, albeit turning cautious. A rebound could target 5,342, with scope for fresh highs above 5,420.
Yen ahead of CPI
The yen extended its decline against a stronger dollar as tariff concerns resurfaced and reports suggested Japanese Prime Minister Sanae Takaichi voiced caution about additional Bank of Japan rate hikes during discussions with Governor Kazuo Ueda. The yen’s rebound following the February 8 election has faded, reviving the so-called “Takaichi trade” amid fears that fiscal expansion could further weaken the currency.
Yen weakness also shifts attention to Friday’s Tokyo CPI data. Current fiscal measures may struggle to keep inflation anchored at the BoJ’s 2% target, while recent figures indicate earlier cost-push pressures are easing. Continued currency softness could bring forward expectations for the next BoJ rate hike from December to as early as April.
Technically, USD/JPY is approaching an upside breakout from a symmetrical triangle pattern, testing two-week highs around 156.30. Momentum remains modest, with the RSI hovering near the neutral 50 level and the MACD still below zero. A daily close above the 50-day SMA — coinciding with the triangle’s upper boundary — could pave the way toward 157.60. On the downside, a move below the 20-day SMA may expose the psychological 154.00 level.
Bitcoin fell again on Tuesday, deepening its recent slide and now trading roughly 50% below its October record high, as uncertainty surrounding U.S. tariff policy dampened risk appetite for digital assets.
The world’s largest cryptocurrency slipped 0.9% to $64,169.6 by 17:35 ET (22:35 GMT), after touching an intraday low of $62,650.1.
Broader crypto markets also remained under pressure, with both institutional and retail investors continuing to reduce exposure. Escalating geopolitical tensions involving Iran, along with an AI-driven selloff on Wall Street, further weighed on sentiment.
Bitcoin down 50% from peak
With Tuesday’s losses, Bitcoin is now trading about half below its early-October all-time high of $126,186.
The cryptocurrency has been in a sustained downturn since that peak, as fresh U.S. regulatory measures and ongoing purchases by major corporate holder Strategy failed to meaningfully support prices.
On Monday, Strategy revealed it had acquired an additional 592 Bitcoin. However, the firm is currently facing significant unrealized losses, as Bitcoin trades below its reported average purchase price of $76,020.
On-chain data from CryptoQuant and Coinglass indicated that large holders—commonly known as “whales”—continued transferring substantial amounts of Bitcoin to exchanges, suggesting further selling pressure.
Meanwhile, major buyers appear scarce. Data from Glassnode showed institutional investors recorded a fifth straight week of net outflows from U.S. spot Bitcoin ETFs as of Monday.
Iliya Kalchev of Nexo Dispatch noted that U.S. spot Bitcoin ETFs saw around $203 million in net outflows on Monday alone. At the same time, derivatives markets still show demand for downside hedging, while long-term holders have not signaled broad capitulation—leaving Bitcoin in what he described as a fragile balance between visible pressure and underlying structural conviction.
He highlighted the $60,000–$72,000 range as the key near-term zone. If ETF flows stabilize and macro volatility subsides, the range could form a base. But if outflows continue, focus may shift toward the realized price area near $55,000 as the next major reference point.
Tariff uncertainty adds pressure
Bitcoin’s latest weakness was largely driven by renewed uncertainty over U.S. trade policy after the Supreme Court struck down much of President Donald Trump’s tariff framework.
In response, Trump announced new universal tariffs of 15% under a different legal authority, though the initial rate implemented at midnight Tuesday was 10%. The president now faces additional legal hurdles in expanding tariffs but has shown little intention of retreating from his trade agenda, even warning that countries seeking to renegotiate trade deals could face higher duties.
Although cryptocurrencies are not directly tied to trade flows, they are highly sensitive to shifts in global risk sentiment. The uncertainty surrounding U.S. tariffs has triggered broader risk aversion across financial markets, spilling over into digital assets.
Altcoins follow Bitcoin lower
Most altcoins tracked Bitcoin’s decline, with the broader market showing little sign of relief from the ongoing downturn.
Ethereum slipped 0.1% to $1,857.78, hovering near early-February lows. XRP and BNB fell 0.2% and 1.9%, respectively, while Cardano declined 1.4%. Solana bucked the trend, rising 0.9%.
Among meme tokens, Dogecoin dropped 1.1%, while TRUMP gained 1.3%.
The U.S. dollar recovered on Tuesday after the prior session’s slide, supported by upbeat economic data, while investors stayed cautious amid fresh volatility tied to President Donald Trump’s tariff policies.
At 15:24 ET (20:24 GMT), the Dollar Index—measuring the greenback against six major currencies—rose 0.2% to 97.86, after falling as much as 0.5% a day earlier.
Strong data underpin dollar
Encouraging economic releases lent the dollar some backing. ADP reported a gain of 12.8K in private payrolls last week, exceeding the previous reading. In addition, the Conference Board’s consumer confidence index for February surprised to the upside at 91.2.
According to José Torres, senior economist at Interactive Brokers, the stronger-than-expected figures nudged both the dollar and yields modestly higher, with a bear-flattening move led by shorter-dated maturities that are more sensitive to monetary policy.
He noted that firmer labor data are pushing rates up, as improving employment conditions weaken the case made by dovish Federal Reserve members for interest rate cuts based on softening job trends.
Trade tensions cloud outlook
Despite the rebound, uncertainty surrounds the U.S. currency as Trump’s revised tariff plans take shape following a Supreme Court ruling that his use of a 1977 emergency law to impose tariffs overstepped his authority.
In response, Trump said he would lift a temporary import tariff from 10% to 15% on goods from all countries. The move has cast doubt on the reliability of trade agreements reached prior to the ruling. Reflecting this uncertainty, the European Parliament delayed a vote on the European Union’s trade pact with the United States due to the new import tax.
Trade concerns have resurfaced at a time when questions are also emerging over the durability of heavy investment in artificial intelligence and the resilience of the U.S. economy after last week’s weak growth data.
Euro steady; Yen under pressure
In Europe, EUR/USD slipped 0.1% to 1.1779, with the euro largely steady after ECB President Christine Lagarde reiterated in Washington that the European Central Bank’s rate policy remains in a “good place,” while emphasizing the need for flexibility.
GBP/USD edged up 0.1% to 1.3501 ahead of parliamentary testimony from four Bank of England rate-setters, which may shape expectations before the March policy meeting.
In Asia, USD/JPY jumped 1% to 155.76 as expectations for near-term tightening by the Bank of Japan softened. The yen was also pressured by a Nikkei report suggesting U.S. authorities led recent rate-check efforts aimed at supporting Japan’s currency.
USD/CNY fell 0.4% to 6.8830 after the People’s Bank of China kept its one-year and five-year loan prime rates unchanged, signaling Beijing’s preference for calibrated support while balancing growth and financial stability. Chinese markets reopened Tuesday following the Lunar New Year holiday.
Elsewhere, AUD/USD rose 0.1% to 0.7060, while NZD/USD advanced 0.2% to 0.5967.
Gold edged higher in Asian trading on Wednesday, recovering slightly after the prior session’s pullback driven by profit-taking, as markets weighed the effects of newly enacted U.S. tariffs and looked ahead to upcoming U.S.–Iran negotiations later this week.
Spot gold climbed 0.8% to $5,184.55 per ounce as of 21:08 ET (02:08 GMT), while U.S. gold futures advanced 0.5% to $5,203.10 an ounce. The metal had dropped 1.6% on Tuesday, ending a four-day winning streak.
On Tuesday, the U.S. began enforcing a temporary 10% blanket import tariff, with the Trump administration aiming to raise it to 15%. The move has heightened concerns about global trade disruptions and inflationary pressures. This action came after a U.S. Supreme Court decision last week invalidated earlier broad tariffs introduced under emergency powers, prompting the government to reinstate duties using alternative legal grounds.
Investors also monitored geopolitical developments, as Washington and Tehran are scheduled to hold a third round of nuclear discussions in Geneva on Thursday.
Despite the rebound, gold’s upside remained limited amid expectations that U.S. interest rates will stay higher for longer. Two Federal Reserve officials indicated on Tuesday that there is little urgency to adjust monetary policy, reinforcing a rate outlook that tends to weigh on non-yielding assets like gold.
Additional pressure came from a firmer U.S. dollar, which makes commodities priced in dollars more expensive for foreign buyers. The U.S. Dollar Index was broadly unchanged after rising 0.1% in the previous session.
Among other precious metals, silver gained 1.6% to $88.59 per ounce, while platinum surged 2.3% to $2,224.60 an ounce.
Oil price
Oil prices stayed close to seven-month peaks on Wednesday, as fears of potential U.S.–Iran military confrontation that could disrupt crude supplies kept investors cautious ahead of fresh talks scheduled for Thursday.
Brent crude rose 43 cents, or 0.6%, to $71.20 per barrel by 0400 GMT, while WTI gained 38 cents, or 0.6%, to $66.01. Brent touched its highest level since July 31 last week, and WTI reached its strongest point since August 4 earlier this week. Both benchmarks have remained elevated as Washington deployed additional military assets to the Middle East in an effort to pressure Tehran into negotiations over its nuclear and ballistic missile programs.
A prolonged conflict could threaten exports from Iran—the third-largest producer within Organization of the Petroleum Exporting Countries—as well as other key producers in the region. Analysts at ING noted that persistent uncertainty is likely to keep a significant geopolitical risk premium embedded in prices, leaving markets highly responsive to new developments.
U.S. representatives Steve Witkoff and Jared Kushner are expected to meet Iranian officials in Geneva on Thursday for a third round of negotiations. Iran’s Foreign Minister Abbas Araqchi said a deal is achievable, provided diplomacy takes precedence. Meanwhile, Donald Trump has warned of “very bad consequences” if no agreement is reached, with uncertainty remaining over whether Iran’s potential concessions would satisfy Washington’s demand for zero uranium enrichment, according to IG analyst Tony Sycamore.
Heightened tensions have also coincided with reports that Iran and China are advancing discussions over the purchase of Chinese anti-ship cruise missiles, which could pose a threat to U.S. naval forces stationed near Iran’s coastline. Experts say such weapons would significantly bolster Tehran’s strike capabilities.
Trump is set to address Congress in his State of the Union speech on Tuesday evening, where he is expected to outline his Iran strategy, though specific details have not been disclosed.
Beyond geopolitics, traders are monitoring supply-demand dynamics. The American Petroleum Institute reportedly showed a sharp 11.43-million-barrel increase in U.S. crude inventories for the week ended February 20, even as gasoline and distillate stocks declined. Official data from the U.S. Energy Information Administration is due later Wednesday.
The purpose here isn’t to make a forecast, but to stay open-minded about money as both a social construct and a carrier of utility value.
The prevailing view argues that the US dollar is destined to collapse, steadily declining toward worthlessness. According to this narrative, the United States will keep creating new dollars to sustain the illusion of stability, until excessive money printing ignites hyperinflation and erodes what little value the dollar has left.
This outlook draws heavily from historical episodes such as the Weimar Republic, where large-scale money creation ultimately destroyed the currency. It’s possible the dollar could follow a similar path.
But money behaves in complex ways. Because it is fundamentally a social agreement, its potential outcomes are broader than we often assume. So instead of assuming collapse, let’s imagine a case for continued dollar dominance.
Consider two hypothetical types of money. The first is a globally recognized currency backed by a basket of industrial commodities—metals like silver and copper, fuels like oil, and other tangible resources. Its value stems not from scarcity alone but from the practical utility of the assets supporting it. Since it is tied to a physical reserve, new units can only be issued if that reserve grows. It cannot be created through lending by banks.
The second type of currency expires after a set period and must be spent before it loses all value. This resembles “scrip” money. Together, these two examples illustrate money’s dual role: a store of value and a medium of exchange.
Naturally, we would save the first form for long-term security—its value rests on enduring real-world utility. The expiring currency, by contrast, would be spent quickly on goods and services.
Now consider another scenario: traveling abroad and collecting small amounts of foreign cash. Each note is valuable within its home country but useless elsewhere until exchanged. The same logic applies to precious metals. If you try to pay for a bowl of noodles with silver, the vendor must convert it into local currency, incurring transaction costs. And if taxes are owed, the government will not accept silver—only its own currency.
This highlights a frequently misunderstood aspect of fiat money. It isn’t “backed by nothing.” Its value lies in granting access to participate fully in the issuing country’s economy.
If that seems abstract, think of a work or residency permit. Without it, economic participation is limited and costly. With it, participation becomes smoother, safer, and more efficient. Currency functions similarly.
Now ask yourself: which currency would most likely be accepted almost anywhere in the world—from a remote market to a major city?
A crisp $100 US bill would probably be welcomed in more places than most alternatives. This isn’t because the paper itself has special intrinsic value. It reflects the network effect: what is already widely recognized and used carries greater practical utility than lesser-known options.
No single form of money perfectly combines store of value, ease of exchange, universal acceptance, and low friction. Searching for one flawless form is probably futile. Instead, currencies that provide:
Access to the largest economic sphere,
The strongest network effect and recognition, and
Reliable price discovery with relatively stable value
That will tend to have higher utility and lower transaction costs than competing alternatives.
Demand for a currency arises from multiple sources: the desire to preserve value, the need to transact, and the appeal of participating in the broadest economic network.
State-issued money has another distinctive trait: its supply can expand or contract. If supply grows more slowly than demand, purchasing power can rise—just as with any other commodity.
Supply is easier to measure than demand, which reflects the collective decisions of millions seeking safety, liquidity, efficiency, and opportunity.
The argument for continued US dollar dominance rests on its imperfect but still advantageous blend of features: relatively transparent pricing, low-friction transactions, powerful global network effects, and access to the world’s largest economic system.
These strengths are not merely products of short-term central bank policies. They reflect the broader framework of governance, institutions, economic depth, social trust, and cultural influence behind the issuing state.
If global uncertainty increases, demand for such a currency could outpace supply. As demand rises and network effects strengthen, a self-reinforcing cycle may emerge—supporting, rather than undermining, the dollar’s supremacy.
Money behaves in peculiar ways. We often assume we fully understand it, and even when we’re convinced a currency is about to collapse, it somehow endures—and sometimes even outperforms expectations.
The goal here isn’t to make a prediction. Rather, it’s to remain open-minded about currency as both a social construct and a vessel of utility value.
Gold is consolidating after climbing to a monthly peak of $5,250 during Tuesday’s Asian session. The U.S. dollar is attracting renewed demand as liquidity improves and risk appetite stabilizes, even as uncertainty surrounding U.S. tariffs persists.
Despite the pullback, bullion is holding above the 61.8% Fibonacci retracement level at $5,142, which is now acting as key support. Meanwhile, the daily Relative Strength Index (RSI) continues to signal bullish momentum, suggesting the broader uptrend remains intact for now.
XAU/USD Technical Overview
The 21-day Simple Moving Average has climbed above the 50-, 100-, and 200-day averages, and all four are trending higher, highlighting a solid bullish outlook. Price action remains above these key indicators, with the 21-day SMA at $5,029.61 acting as immediate dynamic support. Meanwhile, the 14-day RSI stands at 59.50, slightly above the midpoint, signaling sustained upside momentum.
From the swing high at $5,597.89 down to the low at $4,401.99, the market is consolidating between the 61.8% Fibonacci retracement level at $5,141.05 and the 78.6% level at $5,341.96, which is currently limiting further advances. A decisive daily close above the 78.6% retracement would pave the way for a retest of the previous high, whereas failure to break higher could trigger a decline toward the 50-day SMA at $4,742.30. As long as prices stay above the short-term moving averages, the near-term bias supports continued movement within the retracement range before a clearer breakout emerges.
Fundamental Overview
As trading resumed in China and Japan, liquidity returned to the markets, helping the US Dollar (USD) stabilize after recent pressure.
Investors had previously leaned into “sell America” positions following tariff-related confusion triggered by US President Donald Trump over the weekend, which dented overall market confidence.
Wall Street’s slide continued on Monday amid persistent uncertainty surrounding Trump’s tariff agenda, escalating geopolitical tensions, and caution ahead of AI heavyweight Nvidia’s earnings release on Wednesday.
Gold ended its four-session rally as the USD staged a modest rebound, with prices retreating from monthly peaks to test key support near $5,142.
Market participants remain highly sensitive to tariff developments, particularly after The Wall Street Journal reported early Tuesday that the Trump administration is considering fresh national security tariffs on several industries. The report followed a recent Supreme Court ruling that struck down a number of second-term levies.
At the same time, geopolitical concerns persist, with tensions between the United States and Iran continuing to simmer.
Ongoing expectations that the Federal Reserve will deliver at least two interest rate cuts this year should help limit deeper losses in Gold, which remains a traditional safe-haven asset.
Further underpinning prices, investment demand from India has stayed resilient despite record-high levels, according to Money Metals Exchange.
Bitcoin Cash slipped below the $500 mark on Tuesday, extending losses after plunging 13% in the previous session.
Hyperliquid fell another 1% on Tuesday, marking its fourth straight day of declines following Monday’s sharp 9% drop.
Pump.fun also came under pressure, sliding beneath a key psychological support level after tumbling 11% on Monday.
Altcoins such as Bitcoin Cash (BCH), Hyperliquid (HYPE), and Pump.fun (PUMP) have led declines over the past 24 hours as Bitcoin slipped below the $64,000 level on Tuesday. Technical indicators for BCH, HYPE, and PUMP point to further downside risks amid broad-based market selling.
The wider cryptocurrency market remains under strain as Donald Trump explores new legal avenues, citing national security concerns, to introduce additional tariffs. Meanwhile, U.S. equities ended Monday’s session in negative territory, adding to the cautious tone across risk assets.
CoinMarketCap’s Fear and Greed Index has dropped to 11, signaling extreme fear in the market and underscoring that sellers remain firmly in control.
Bitcoin Cash slips beneath the $500 mark
Bitcoin Cash was trading below the $500 level on Tuesday, extending losses after plunging 13% in the prior session. The altcoin has slipped beneath its 200-day Exponential Moving Average (EMA) at $544, while the 50-day EMA — now trending lower at $555 — is approaching a potential death cross formation.
Technically, the path of least resistance appears tilted to the downside, with the next key support seen around $443, corresponding to the October 17 low.
Daily chart indicators reinforce the bearish momentum shift. The Relative Strength Index (RSI) has dropped to 36, edging closer to oversold territory as selling pressure intensifies. Meanwhile, the Moving Average Convergence Divergence (MACD) has crossed below its signal line, signaling a bearish crossover.
BCH/USDT
If Bitcoin Cash reclaims the $500 psychological barrier with a strong daily close above it, selling pressure could begin to fade, potentially paving the way for a rebound toward the 200-day EMA near $544.
Hyperliquid was trading below $26 on Tuesday, extending losses after falling 9% in the previous session. The HYPE token has now declined for a fourth straight day and remains well under both its 50-day EMA at $29.08 and 200-day EMA at $32.37, reinforcing a bearish outlook.
On the daily chart, the Relative Strength Index (RSI) stands at 38 and continues to trend lower, with further room before entering oversold territory. Meanwhile, the Moving Average Convergence Divergence (MACD) and its signal line are steadily declining, with widening bearish histogram bars signaling strengthening downside momentum.
Immediate support levels are seen at $23.58, marking the December 21 low, followed by $20.82, the October 10 low.
HYPE/USDT
On the upside, Hyperliquid would need to break back above its 50-day EMA at $29.08 to revive short-term bullish momentum and signal the start of a potential recovery.
Pump.fun slides toward all-time low amid heavy selling
Pump.fun was trading around $0.001800 at the time of writing on Tuesday, after tumbling 11% in the previous session. The meme-coin launchpad token has continued its broader downtrend since late September and is now eyeing support at $0.001678 — a level that previously sparked a rebound on February 6.
A firm break and close below this support could open the door to further losses toward the S2 pivot at $0.001199.
Momentum indicators point to mounting downside pressure. The Relative Strength Index (RSI) sits at 37, hovering just above oversold territory and reflecting persistent selling interest. Meanwhile, the Moving Average Convergence Divergence (MACD) and its signal line have resumed a downward trajectory following a bearish crossover on Monday, indicating renewed negative momentum.
PUMP/USDT
If Pump.fun climbs back above the S1 pivot at $0.001945, it may pave the way for a move toward the 50-day EMA near $0.002300, potentially easing near-term bearish pressure.
The U.S. dollar weakened on Monday as investors assessed the implications of the Supreme Court of the United States decision to strike down tariffs introduced by Donald Trump, along with the administration’s subsequent response.
Traders were also monitoring renewed nuclear negotiations between Washington and Tehran.
As of 14:12 ET (19:12 GMT), the Dollar Index — which measures the greenback against a basket of six major currencies — was down 0.2% at 97.65. The currency had posted a gain of roughly 1% last week, marking its strongest weekly advance in more than four months.
Dollar pressured by mounting trade uncertainty
The Supreme Court of the United States ruled on Friday that sweeping tariffs introduced by Donald Trump exceeded his authority. In response, Trump criticized the court and unveiled a blanket 15% levy on imports.
The new duties are set to remain in place for 150 days, but it remains unclear whether the U.S. government must reimburse importers for tariffs already collected, as the Court did not address that issue.
The uncertainty could trigger prolonged legal battles and further confusion as Trump explores alternative mechanisms to reinstate broad-based global tariffs on a more permanent footing.
Thierry Wizman, global FX and rates strategist at Macquarie, said the firm’s bearish U.S. dollar outlook for 2026 was based on the view that tariffs signal U.S. “disengagement” from the rules-based order underpinning free trade. He added that tariff conflicts themselves generate uncertainty centered on the United States — a negative for the dollar.
“In that sense, while the Supreme Court ruling may have strengthened institutional checks, it also heightens uncertainty, as Trump is likely to revive the tariff war through different — and more legally grounded — channels that have yet to be detailed. We see no reason to revise our broader expectation for a weaker USD in 2026,” Wizman said.
Beyond trade policy, investors are also watching a U.S. military buildup in the Middle East aimed at pressuring Iran to abandon its nuclear ambitions, with further talks between Washington and Tehran expected later this week.
Euro advances as confidence in Europe strengthens
In Europe, EUR/USD rose 0.2% to 1.1799, with the single currency drawing support from trade-driven weakness in the dollar.
Growing confidence in the region’s economic outlook also underpinned the euro, following data on Friday showing eurozone business activity expanded faster than expected this month, as manufacturing returned to growth for the first time since October.
Momentum was reinforced on Monday as Germany’s Ifo business climate index climbed to 88.6 from 87.6 the previous month, signaling improving sentiment in Europe’s largest economy.
Meanwhile, GBP/USD added 0.1% to 1.3497, with sterling firming ahead of key event risks this week — including testimony before the Treasury Committee by Andrew Bailey, governor of the Bank of England, and Thursday’s UK by-election in Gorton and Denton.
Yen edges higher
In Asia, USD/JPY fell 0.4% to 154.48, with the Japanese yen supported by its traditional safe-haven appeal as investors remained cautious about the economic impact of higher U.S. tariffs. Trading volumes were thinner due to a public holiday in Japan.
USD/CNY was little changed at 6.9087, with Chinese markets shut for New Year holidays. Elsewhere, AUD/USD declined 0.3% to 0.7060, while NZD/USD also dropped 0.3% to 0.5961.
Thierry Wizman of Macquarie said that while the dollar could remain under pressure amid persistent U.S.-driven uncertainty, some currencies — such as the yuan and the euro — may outperform, whereas others, including the Canadian and Mexican pesos, could lag. He added that even in the face of potential credit rating actions, long-term U.S. Treasury yields might rise due to uncertainty over revenue replacement, and equities could come under strain if higher yields lead to valuation compression.
U.S. stock index futures edged higher on Monday night after growing uncertainty surrounding Donald Trump’s tariff policies and concerns about AI-related disruption in the software sector triggered steep losses on Wall Street.
Lingering unease over a potential U.S.-Iran conflict, along with caution ahead of this week’s closely watched earnings from NVIDIA Corporation (NASDAQ: NVDA), also kept sentiment restrained.
As of 19:30 ET (00:30 GMT), S&P 500 Futures were up less than 0.1% at 6,855.0 points. Nasdaq 100 Futures gained 0.1% to 24,781.0 points, while Dow Jones Futures added nearly 0.1% to 48,873.0 points.
FedEx sues U.S. government to recover tariff payments
FedEx Corporation (NYSE: FDX) filed a lawsuit against the U.S. government on Monday evening, seeking a “full refund” of emergency tariffs it paid over the past year.
The action comes only days after the Supreme Court of the United States ruled the levies illegal, with the tariffs scheduled to be lifted from midnight Tuesday.
FedEx is the first company to formally pursue reimbursement following the Court’s decision, joining a broader wave of firms mounting legal challenges against tariff measures introduced under Donald Trump.
However, the ruling did not clarify how the more than $160 billion in revenue already collected from the invalidated tariffs will be handled.
Wall Street battered by tariff uncertainty and AI concerns
Wall Street’s major indexes each dropped more than 1% on Monday as uncertainty surrounding Donald Trump’s tariff policies and mounting concerns about artificial intelligence disrupting the software industry kept investors in a risk-off mood.
Technology sentiment remained fragile ahead of quarterly results from NVIDIA Corporation (NASDAQ: NVDA), scheduled for Wednesday. Widely viewed as a key gauge of AI demand, the world’s most valuable company is expected to post robust earnings growth compared with last year.
Markets also grappled with renewed tariff worries after Trump unveiled a 15% universal tariff under a different legal authority. A report from The Wall Street Journal indicated the administration is considering additional levies on at least six more sectors.
The president appeared to double down on his trade agenda, even as several countries that recently reached agreements with Washington sought greater clarity on the scope and implementation of the tariffs. He also cautioned that nations retreating from newly negotiated trade deals could face steeper duties.
The S&P 500 declined 1%, while the NASDAQ Composite fell 1.1%. The Dow Jones Industrial Average led losses, tumbling 1.7%.
Technology stocks continued to lag, with software names hit by renewed selling pressure amid rising anxiety over AI-driven disruption. Part of the concern stemmed from a speculative note by Citrini Research envisioning a June 2028 scenario in which rapid AI adoption leads to widespread displacement of white-collar jobs.
Oil prices edged higher during Asian trade on Tuesday, remaining just under the seven-month peaks reached in the prior session, as markets looked ahead to upcoming U.S.–Iran discussions later this week. Ongoing uncertainty surrounding trade tariffs continued to temper investor sentiment.
At 22:22 ET (03:22 GMT), Brent crude futures climbed 0.8% to $72.04 per barrel, while U.S. West Texas Intermediate (WTI) crude futures also advanced 0.8% to $66.81 per barrel.
Both benchmarks had approached seven-month highs in the previous session before ending slightly lower.
Market participants are holding back ahead of US – Iran talks scheduled for later this week.
Markets stayed tense ahead of a third round of nuclear talks between Washington and Tehran set for Thursday in Geneva. Strains have persisted since last week amid indications that the situation could escalate. The U.S. pulled some non-essential embassy staff from Beirut, underscoring concerns that diplomacy might collapse and spark conflict.
President Donald Trump warned in a social media post on Monday that it would be a “very bad day” for Iran if no agreement is reached.
“In the event of a deal, we would likely see a significant unwinding of the risk premium currently built into prices — though securing such an agreement is far from straightforward,” analysts at ING noted.
A failure in negotiations could heighten worries about stricter sanctions enforcement or potential disruptions in the Strait of Hormuz, a crucial corridor for global crude shipments. Fears of a possible military clash contributed to a 6% surge in oil prices last week.
Tariff tensions under Donald Trump weigh on demand outlook
Oil markets are also contending with wider macro uncertainty after the Supreme Court of the United States invalidated an earlier round of tariffs introduced under emergency powers.
Donald Trump has since sought to reinstate duties of up to 15% using alternative legal provisions and cautioned that countries that “play games” in trade negotiations with the U.S. could be hit with steeper tariffs.
The risk of renewed trade tensions has darkened the global growth and fuel demand outlook, limiting oil’s advance even as geopolitical concerns continue to lend support to prices.
U.S. PPI inflation data and Nvidia’s earnings will take center stage in the coming week.
Nvidia appears set to post another standout quarter.
Meanwhile, Intuit is confronting mounting fundamental and technical pressures ahead of its results.
U.S. equities closed higher on Friday after the Supreme Court invalidated President Donald Trump’s tariffs. Trump criticized the decision as a “disgrace” and said in a Truth Social post on Saturday that he would introduce a new 15% global tariff, just one day after announcing a 10% levy.
After Friday’s gains, the 30-stock Dow Jones Industrial Average finished the week up about 0.3%. The S&P 500 advanced 1.1%, while the tech-heavy Nasdaq Composite broke a five-week slide with a 1.5% surge. The small-cap Russell 2000 added nearly 0.7%.
Markets may see heightened swings in the days ahead as investors weigh prospects for growth, inflation, interest rates, and corporate earnings against a backdrop of renewed trade frictions.
With a relatively light economic calendar, attention will center on Friday’s January U.S. producer price index report. As of Sunday morning, traders are pricing in slightly better than even odds that the Federal Reserve will lower rates by its June meeting.
On the earnings front, Nvidia’s (NASDAQ: NVDA) report will headline the week as the season winds down. Beyond Nvidia, investors will be tracking several major tech names, particularly software companies facing pressure from concerns that AI could disrupt their core businesses, including Salesforce (NYSE: CRM), Intuit (NASDAQ: INTU), Snowflake (NYSE: SNOW), Zscaler (NASDAQ: ZS), and Zoom Video Communications (NASDAQ: ZM).
AI infrastructure providers Dell Technologies (NYSE: DELL) and CoreWeave (NASDAQ: CRWV) are also set to post results. Outside the tech space, prominent retailers such as Home Depot (NYSE: HD), Lowe’s Companies (NYSE: LOW), and TJX Companies (NYSE: TJX) are scheduled to report.
At the same time, markets will be parsing President Trump’s State of the Union address on Tuesday and monitoring any developments involving the U.S. and Iran.
No matter which way markets move, below I outline one stock that could attract buying interest and another that may face renewed downside pressure. Keep in mind, this outlook covers only the week ahead—Monday, February 23 through Friday, February 27.
Stock to Buy: Nvidia
Nvidia heads into its earnings report with analysts anticipating another “beat-and-raise” performance, fueled by robust demand for AI infrastructure. Fourth-quarter results are scheduled for release after Wednesday’s market close at 4:20 p.m. ET, followed by a 5:00 p.m. ET conference call with CEO Jensen Huang.
According to an InvestingPro survey, profit forecasts have been lifted 36 times in recent weeks, compared with just one downward revision—highlighting growing optimism around Nvidia’s earnings outlook. In the options market, traders are pricing in a potential move of roughly ±6% in NVDA shares following the announcement.
Wall Street expects the AI powerhouse to deliver earnings of $1.52 per share, up 71% from a year earlier. Revenue is forecast to climb 67% to $65.6 billion, underscoring the company’s ongoing strength in the AI chip space.
Citi recently suggested that January-quarter revenue could exceed $67 billion, with projections pointing to even stronger results in the April quarter.
Another solid showing in data-center sales, along with widening margins and healthy free cash flow, would bolster the view that Nvidia remains firmly in the midst—not at the tail end—of an AI supercycle.
NVDA shares ended Friday at $189.82, consolidating after a strong advance but still positioned to move higher on favorable catalysts. Across multiple timeframes—from intraday charts to the monthly view—technical indicators and moving averages continue to signal a “strong buy.”
A beat-and-raise report could ignite another leg up, particularly if management emphasizes longer-term visibility into 2026–2027 growth driven by next-generation architectures such as Rubin.
Trade Setup:
Entry: Near current levels (around $190)
Target: $210 (approximately 10% upside)
Stop-Loss: $184 (roughly 3.5% downside risk)
Stock to Sell: Intuit
Intuit—the parent company of TurboTax, QuickBooks, Credit Karma, and Mailchimp—heads into earnings week facing mounting pressure. Concerns have escalated in early 2026 that generative AI tools could weaken its competitive moat across tax prep, accounting, and financial software by enabling free or lower-cost alternatives, custom AI agents, or in-house solutions for small businesses and consumers.
This anxiety has fueled broader “SaaSpocalypse” sentiment, with the software sector shedding trillions in market value. INTU shares have been particularly hard hit in recent months, sliding sharply alongside peers such as Salesforce.
Analyst sentiment has also turned more cautious ahead of the report, with 23 of the last 25 estimate revisions moving lower—signaling growing skepticism around near-term performance.
Wall Street expects Intuit to post earnings of $3.68 per share, up roughly 11% year over year, on revenue of about $4.5 billion. The bigger concern, however, centers less on the headline numbers and more on the narrative surrounding AI-driven disruption.
Although Intuit has made significant investments in artificial intelligence, investors seem to view these efforts as largely defensive—designed to protect its existing franchises rather than meaningfully expand them or counter broader competitive threats. TD Cowen recently cut its price target, pointing to doubts about the strength of Intuit’s AI strategy and intensifying competition.
Any remarks about rising competitive pressures, decelerating growth in key segments, or conservative forward guidance could amplify downside risks—particularly in a stock that may be technically oversold but remains vulnerable in a sentiment-driven market.
Shares of Intuit have fallen 42.5% over the past three months and are now hovering just above their 52-week low of $375.40. Technical signals remain decisively negative: across timeframes—from hourly charts to the monthly view—both moving averages and momentum indicators continue to flash “strong sell.”
With management’s outlook likely to face intense scrutiny, any earnings miss or cautious commentary reflecting a more competitive, AI-driven environment could deepen the selloff.
Bitcoin falls beneath the lower boundary of its consolidation range on Monday, and a decisive close below this level could open the door to a more pronounced correction.
Ethereum drops under $1,900, marking a continuation of its six-week decline.
XRP dips below $1.40, unable to hold support at the lower edge of its trendline channel.
Bitcoin (BTC), Ethereum (ETH), and Ripple (XRP) continue to weaken on Monday after posting modest losses last week. BTC has slipped beneath the $65,000 consolidation floor, while ETH has fallen under $1,900, both marking a sixth consecutive week of declines. Meanwhile, XRP drops below $1.40, failing to hold support at its lower trendline — collectively signaling the risk of a deeper correction across the top three cryptocurrencies.
Bitcoin breaks below consolidation support
Bitcoin had been trading within a sideways range between $65,729 and $71,746 since February 7. On Monday, BTC moved below the lower boundary of this range, changing hands near $64,700.
A confirmed daily close beneath $65,729 would strengthen the bearish case and could open the path toward the next major support around $60,000.
On the daily chart, the RSI stands at 31, hovering close to oversold territory and reflecting strong downside momentum. Meanwhile, the MACD lines are tightening, suggesting growing indecision in the market.
BTC/USDT
However, if BTC manages to reclaim and hold above the $65,729 level, a rebound toward the upper boundary of the range at $71,746 remains possible.
Ethereum extends its correction
Ethereum continued to edge lower last week, prolonging its slide that began in mid-January. As of Monday, ETH is down 4.77%, trading around $1,864.
A daily close beneath the lower consolidation boundary at $1,747 would reinforce the bearish outlook and could drive prices toward the next key support at $1,669.
Similar to Bitcoin, Ethereum’s RSI points to strengthening downside momentum, while the MACD lines are narrowing, reflecting growing uncertainty among market participants.
ETH/USDT
On the flip side, a recovery from current levels could see ETH rebound toward the upper end of its consolidation range near $2,149.
XRP deepens its pullback after breaking below key lower trendline support.
XRP is hovering below $1.40 on Monday after slipping beneath the lower boundary of a falling wedge pattern.
Should the pullback persist, the token may slide further toward the weekly support around $1.30.
Similar to Bitcoin and Ethereum, XRP’s RSI points to building bearish pressure, while the MACD lines are tightening, signaling trader uncertainty.
XRP/USDT
On the other hand, if price manages to reclaim and hold the lower trendline as support, a rebound toward the psychological $1.50 level could follow.
Gold extended its rally for a fourth consecutive session, supported by a mix of favorable drivers.
Ongoing trade uncertainties and escalating geopolitical tensions continued to bolster demand for the safe-haven metal.
Expectations of Federal Reserve rate cuts, along with a broadly softer U.S. dollar, offered further support to the non-yielding asset.
Gold (XAU/USD) posted its strongest-ever weekly close above the $5,100 level on Friday and carried that momentum into the new week. The metal has now advanced for a fourth consecutive session, climbing past $5,150 during the Asian session to reach a fresh monthly high. Persistent trade-war concerns and escalating geopolitical tensions in the Middle East continue to channel safe-haven flows into bullion.
U.S. President Donald Trump introduced a new trade framework after a Supreme Court ruling blocked his earlier sweeping tariff plan, announcing a 15% global tariff on imports—the maximum permitted under the law. The move heightened fears of retaliatory action and broader economic fallout from supply chain disruptions, dampening risk appetite and reinforcing demand for gold as a defensive asset.
On the data front, Friday’s release showed the U.S. Personal Consumption Expenditures (PCE) Price Index rose 2.9% year-over-year in December, while the core measure increased 3.0%, tempering expectations of a March rate cut by the Federal Reserve. Even so, markets continue to anticipate the possibility of two 25-basis-point reductions later this year.
Those expectations were supported by weaker U.S. growth figures, with GDP expanding at a 1.4% annualized pace in the fourth quarter—slowing sharply from 4.4% in Q3—amid the longest government shutdown on record. Combined with trade-related uncertainty, the softer growth backdrop has pulled the U.S. dollar back from last week’s highs, adding further support to non-yielding gold.
Additionally, the risk of military confrontation between the U.S. and Iran has contributed to the metal’s upward momentum. Officials from both sides are scheduled to meet in Geneva on Thursday after Iran submitted a detailed nuclear proposal. Reports indicate that President Trump is weighing potential military action if diplomatic efforts fail to restrain Tehran’s nuclear ambitions, further underpinning safe-haven demand.
XAU/USD H4 chart
Gold buyers remain in control, with Friday’s surge beyond the $5,100 level still holding firm.
From a technical standpoint, the solid upside continuation at the beginning of the week confirms last Friday’s breakout above the $5,100 horizontal resistance, reinforcing the bullish outlook for XAU/USD. The MACD remains above both the Signal line and the zero level, while the expanding positive histogram points to building upward momentum.
In addition, gold is trading comfortably above the ascending 200-period EMA, which underpins the current advance and keeps the near-term bias skewed to the upside. However, the RSI at 73.23 signals overbought conditions, suggesting that immediate gains could be capped.
As long as prices stay above the rising 200-period EMA at $4,864.04, the broader bias remains constructive, with dips likely to be limited. The MACD continues to support the bullish case, though a narrowing histogram would indicate fading momentum. With the RSI stretched into overbought territory, a period of consolidation or mild pullback may emerge before the uptrend resumes. Still, holding above the 200-period EMA would preserve the overall recovery structure, even if short-term consolidation unfolds.
Oil prices fell more than 1% in Asian trading on Monday, taking a breather after last week’s sharp rally, as investors assessed the likelihood of a third round of U.S.-Iran nuclear negotiations and renewed uncertainty around U.S. trade policy.
By 20:50 ET (01:50 GMT), Brent crude for April delivery dropped 1% to $71.03 a barrel, while WTI crude declined 0.9% to $65.75 a barrel.
Both benchmarks had climbed nearly 6% last week amid signs of a potential U.S.-Iran confrontation and an unexpected drawdown in U.S. crude inventories, which supported prices.
Traders watch third round of U.S.- Iran nuclear talks
Iran and the United States are expected to hold a third round of nuclear discussions on Thursday in Geneva, raising hopes that tensions may ease.
Iranian Foreign Minister Abbas Araghchi told CBS’s “Face the Nation” on Sunday that there is a strong possibility of reaching a diplomatic resolution, adding that an agreement is within reach. Markets viewed the remarks as a signal of potential compromise.
Iran is a major producer within OPEC and possesses some of the largest proven oil reserves globally. The country also borders the Strait of Hormuz, a vital chokepoint that handles about one-fifth of the world’s seaborne oil. Any escalation involving Iran could disrupt shipments and drive up freight and insurance costs.
Trump raises global tariffs to 15%
Meanwhile, U.S. President Donald Trump unveiled new global tariffs, initially imposing a 10% duty on imports for 150 days after the U.S. Supreme Court invalidated his previous, broader tariff plan.
The administration increased the rate to 15% on Saturday—the maximum permitted under the applicable law—adding fresh uncertainty to global trade and demand prospects.
Higher tariffs can strain supply chains and prompt retaliatory actions from trade partners. Slower trade activity and weaker industrial production typically weigh on fuel consumption.
Gold extended its rally for a fourth consecutive session on Monday, building on last week’s advance as new global tariff measures from U.S. President Donald Trump and softer U.S. economic data boosted demand for safe-haven assets.
Spot gold climbed 0.8% to $5,143.55 an ounce by 19:53 ET (00:53 GMT), while U.S. gold futures jumped 1.7% to $5,165.86.
Bullion gained more than 1% last week as escalating geopolitical tensions between the U.S. and Iran encouraged a risk-off tone across markets.
Late last week, Trump announced a 10% tariff on global imports for 150 days under Section 122 of U.S. trade law, following a decision by the Supreme Court of the United States to strike down a broader tariff framework. The administration subsequently increased the levy to 15%—the maximum permitted under the statute—heightening fears of retaliatory actions and disruptions to global supply chains.
The tariff move dampened investor sentiment, driving flows into traditional safe havens such as gold and U.S. Treasuries. Ongoing uncertainty about how long the tariffs will remain in place, along with potential legal and congressional challenges, added to market volatility.
Gold also found support in recent U.S. data. The economy expanded at an annualized 1.4% pace in the fourth quarter, a notable slowdown from the prior quarter. Meanwhile, the Personal Consumption Expenditures (PCE) price index—the inflation measure favored by the Federal Reserve—rose 2.9% year-on-year in December, with core inflation near 3.0%, still above the central bank’s 2% target.
The mix of moderating growth and persistently elevated inflation strengthened gold’s role as both a hedge against economic uncertainty and a store of value.
The US dollar at one stage surged sharply against the Mexican peso, but by week’s end it had given back some of those gains. The 17.00 area below continues to act as a key support zone, and a decisive break beneath it could open the door for a move toward 16.50.
While short-term bounces are possible, the broader setup suggests selling into strength. The 17.50 region remains a significant resistance barrier, and the wide interest rate differential still strongly favors the Mexican peso.
S&P 500
The S&P 500 pulled back early in the week but appears to be stabilizing as it continues to trade within a broader consolidation range. Since early December, price action has been confined between 6,800 and 7,000, suggesting a market building momentum for its next major move.
The bias still leans to the upside. A decisive daily close above 7,000 could trigger a stronger breakout and accelerate gains. On the other hand, a breakdown below 6,800 would signal a shift in tone and mark a more bearish development.
EUR/USD
The euro declined notably over the course of the week, but it continues to find buyers near the 1.18 level, making that area especially important to watch. Given the current structure, caution is warranted when trading this pair.
Price action appears largely range-bound, with 1.18 acting as a central pivot or magnet. Resistance stands near 1.1850, while solid support can be found around 1.1750, reinforcing the broader sideways pattern.
USD/CAD
The US dollar has advanced against the Canadian dollar, but price action remains choppy around the 1.3750 zone — an area that has repeatedly proven significant. The pair appears to be oscillating as traders assess whether momentum can build for a sustained move higher.
A decisive push and hold above 1.3750 would signal renewed strength for the US dollar. Conversely, a breakdown below 1.35 would represent a notably bearish shift in sentiment.
Major Technical Support and Resistance Levels
Gold (XAU/USD)
Gold remains choppy, initially easing back during the week, yet buyers continue to emerge on dips, stepping in whenever prices soften. The 4,800 level appears to be firm support, while the 5,000 mark is likely to act as a psychological magnet for price action.
The broader bias still favors buying pullbacks, with the expectation of an eventual move higher. However, volatility may persist after the sharp turbulence seen in recent weeks, following what had previously been a near one-way surge. Over the longer term, a retest of the highs seems plausible, though it will likely require patience amid ongoing fluctuations.
Bitcoin (BTC)
The Bitcoin market is still searching for renewed upside momentum, but the encouraging development is that price action has at least stabilized. Given the prolonged weakness seen in recent periods, simple stability is a constructive step forward for the market.
The $60,000 level remains a crucial support zone and a major psychological benchmark. Holding above this area is essential if Bitcoin is to maintain any realistic prospect of a sustained recovery.
USD/JPY
The US dollar posted solid gains against the Japanese yen over the week, with the ¥152 level continuing to provide strong support. The 50-week EMA is positioned just beneath that area, reinforcing the floor and encouraging dip-buying as the interest rate differential remains in favor of the US dollar.
With the Bank of Japan maintaining its current policy stance, there appears to be little immediate catalyst for a structural shift. As a result, the pair may be entering a consolidation range between ¥152 on the downside and ¥158 on the upside. A decisive move above ¥160 would represent a significant breakout, clearing a resistance zone that has been in place since 1990.
GBP/USD
The British pound declined sharply during the week, dropping to test the 1.35 level — a large, round psychological threshold that has proven important on multiple occasions. The fact that buyers are attempting to defend this area is at least a constructive short-term signal.
However, recent UK economic data has been somewhat underwhelming. As a result, sterling may currently be one of the weaker major currencies against the US dollar. This pair deserves close monitoring, as broader dollar strength could translate into pronounced downside pressure here, potentially making GBP/USD particularly vulnerable.
Cryptocurrency markets moved within a tight range late in the week as traders remained cautious ahead of important U.S. inflation and growth releases. According to Nexo analyst Iliya Kalchev, broader macro uncertainty continues to guide investor sentiment.
Bitcoin held just above the $68,000 mark, while Ethereum struggled to push past $2,000, signaling selective positioning rather than a broad return to risk appetite. A more guarded macro tone has emerged in recent days, with hawkish cues from the Federal Reserve’s January meeting minutes pressuring risk assets and strengthening the view that interest rate cuts may come later than previously anticipated.
Geopolitical concerns have further shaped market behavior. Heightened tensions involving the U.S. and Iran have driven demand for traditional safe havens such as the U.S. dollar and gold, while capping gains in liquidity-driven assets like cryptocurrencies.
Kalchev highlighted that U.S.-listed Bitcoin ETFs posted around $165 million in net outflows, and Ethereum ETFs saw roughly $130 million withdrawn. These flows reflect a broader sense of institutional caution as investors recalibrate exposure amid persistent macro volatility.
Bitcoin remains in a consolidation phase following its early-February pullback, even as underlying network metrics improve. Mining difficulty has risen notably, and hashrate levels have recovered, pointing to structural strength despite muted price action. Still, analysts note that the asset remains highly responsive to macro signals—particularly inflation data that could influence Federal Reserve policy expectations.
Outside of crypto, financial markets have displayed uneven risk appetite. Gold is trading near record highs, and the dollar is on course for a strong weekly advance as investors hedge against geopolitical instability and interest rate uncertainty.
Looking ahead, market participants are closely watching upcoming U.S. Core PCE inflation data and GDP figures. These releases could determine whether digital assets break out of their current consolidation range or continue moving sideways. While regulatory progress on stablecoin legislation may serve as a longer-term structural driver, Kalchev emphasized that near-term price movements will likely remain tied to macro developments and investor positioning.
The artificial intelligence trade faces its biggest test of the year this week as three cornerstone companies in the AI infrastructure ecosystem prepare to deliver quarterly earnings. With tech stocks showing signs of fatigue, investors want more than simple earnings beats. They’re looking for proof that heavy capital expenditure is translating into the successful deployment of next-generation hardware. All attention will turn to the after-market close (AMC) on Wednesday and Thursday to see whether the AI rally still has momentum.
NVIDIA: The undisputed AI infrastructure leader
NVIDIA (NVDA) is set to report fiscal Q4 2026 results on Wednesday, Feb. 25, after market close. As the dominant supplier of GPUs powering large language models, NVIDIA remains the clearest gauge of the AI trade’s health. Wall Street is anticipating a “beat and raise,” with consensus revenue estimates around $65.6 billion — an impressive 67% year-over-year increase.
Investors are especially focused on the production ramp of its Blackwell architecture chips. Any updates on supply chain constraints or the development timeline for the upcoming Rubin platform could influence not only tech stocks but the broader S&P 500. Options markets imply a potential 6.5% swing in either direction, making NVIDIA’s earnings the week’s must-watch event for global investors.
Hardware and cloud players: CoreWeave and Dell under the spotlight
On Thursday, Feb. 26, AMC, attention shifts to the physical backbone of AI infrastructure. CoreWeave (CRWV), a specialized cloud provider and key NVIDIA partner, will report against high expectations driven by its sizable revenue backlog. Analysts project Q4 revenue of roughly $1.53 billion, but the more significant figure is its $56 billion backlog — a forward-looking signal of how much computing capacity AI firms and tech giants are securing
Also reporting Thursday is Dell Technologies (DELL), which has repositioned itself as a major supplier of AI-optimized servers. Consensus forecasts call for earnings of $3.53 per share on $31.6 billion in revenue. Dell recently earned a spot on Evercore’s “Tactical Outperform” list, supported by a sharp rise in AI server orders and an $18.4 billion backlog exiting last quarter. The key question for Dell will be whether it can preserve margins while rapidly scaling production to meet surging demand for AI infrastructure.
The Australian government has pledged to “consider every possible response” after President Donald Trump raised the standard import tariff to 15%. The abrupt increase came just a day after an initial 10% rate was announced, surprising global markets.
Trade Minister Don Farrell described the decision as “unjustified” and suggested it could strain relations between the long-standing strategic partners. The move follows a U.S. Supreme Court ruling that invalidated the administration’s earlier targeted tariff system as unlawful.
In reaction, the President shifted to a universal global tariff. The first 10% duty is scheduled to take effect at 12:01 a.m. EST on February 24, but the implementation date for the additional 5% remains uncertain, leaving exporters with goods already in transit facing heightened uncertainty.
Economic repercussions and Australia’s reaction
For Australia, the implications are significant. As a leading exporter of iron ore, LNG, and agricultural commodities, a 15% tariff could erode the competitiveness of Australian products in the U.S. market. Trade Minister Don Farrell confirmed that officials are coordinating closely with Australia’s embassy in Washington to evaluate the potential impact.
Analysts note that keeping “all options on the table” may involve filing a formal complaint with the World Trade Organization (WTO) or imposing reciprocal, tit-for-tat duties on American imports. Such action would represent an unusual trade clash between AUKUS allies.
The across-the-board 15% tariff reflects a broad, uniform policy that overlooks customary bilateral arrangements. Should Canberra proceed with countermeasures, it could affect multi-billion-dollar energy and defense agreements that are currently being negotiated.
Market turbulence and the investor outlook
Investors are already responding to the uncertainty. The Australian Dollar (AUD) came under immediate pressure as traders assessed the potential blow to the nation’s trade balance, while mining and energy shares adopted a more cautious tone.
Should the full 15% tariff be implemented without carve-outs, Australian exporters may have to accelerate their shift toward Asian markets, potentially deepening the divide between Western trading partners.
Attention is now fixed on the February 24 deadline. If the White House does not clarify whether allies will receive exemptions, the risk of a formal trade conflict increases. Analysts caution that much of the added cost could ultimately be passed on to American consumers, heightening concerns about renewed inflation.
Money — everyone wants it, yet relatively few build lasting wealth. Recent data show the U.S. wealth gap continuing to widen, with the top 10% of earners controlling roughly two-thirds of total assets, while the bottom half owns only a small fraction. The frustration this creates fuels many narratives — corporatism, financial nihilism, inflation, stagnant wages, student debt, policy failures. These factors matter.
But they are not the root cause of individual financial outcomes.
At the personal level, wealth creation has always rested on a small set of enduring principles:
Spend less than you earn.
Save consistently.
Invest intelligently.
These rules are not new. They worked before the internet, before credit cards, and before retail trading apps. Most importantly, they still work — regardless of background, education, age, or economic cycle. Wealth is not a viral trend or a lucky break. It is a disciplined process repeated over time.
That does not dismiss today’s challenges. Inflation remains elevated compared to early-2000s norms. Real wage growth has struggled to outpace living costs. Mortgage rates have constrained affordability. Yet history shows that disciplined financial behavior, applied consistently, can overcome difficult macro environments.
Many people can articulate why the system feels unfair. Fewer commit to the habits that compound into independence. The difference between chronic financial stress and gradual wealth accumulation is often not luck or privilege alone — it is adherence to a workable framework.
This framework is neither radical nor controversial. It is the same path generations have followed to build stability and prosperity.
One uncomfortable truth is that we have largely failed to teach foundational money skills. Not advanced portfolio theory — but basics: budgeting, understanding credit, living below one’s means, and managing cash flow responsibly.
With that foundation in mind, here are the 10 Immutable Laws of Money.
10 Fundamental Principles of Money
Wealth Isn’t Created Effortlessly
Growing up, my father loved to share stories that, over time, I realized were slightly exaggerated. A few of his classics were:
“When I was your age, I walked uphill to school in the snow — both ways.” “I could see two movies, eat all the popcorn and drink all the soda I wanted for a nickel — and still get change back!” And, of course: “Where do you think money comes from? It doesn’t grow on trees!”
That last line stuck with me the most. What he was really trying to teach was respect — respect for the time, energy, and sacrifice required to earn a living. He often worked two jobs, sometimes even three, to provide for our family. We always had what we needed, though not always everything we wanted. As a child, I didn’t fully grasp the weight of that lesson. It wasn’t until I had a family of my own that I truly understood.
Most people work incredibly hard for their income. Yet it’s surprising how casually many treat the money they earn. They undermine their own efforts by overspending, living beyond their means, or making careless investment choices. If you value the work it takes to earn money, you should value how it’s managed.
One practical way to build that respect is by using the “envelope system” for a few months.
The idea is simple: cash your paycheck and divide the money into separate envelopes labeled for expenses — rent or mortgage, car payments, groceries, utilities, entertainment, and so on. Then live normally. When an envelope runs out, that category is done for the month. No borrowing from another envelope.
This method quickly reveals where money is leaking away and forces awareness around spending habits. More importantly, it restores discipline and respect for the effort behind every dollar earned.
Note: The envelope system should cover about 80% of your overall budgeting approach, which we’ll explore shortly. The remaining 20% should be directed toward savings — but we’ll tackle that part step by step.
Desires Always Outpace Necessities
When I sit down with people to talk about financial planning, I’m always struck by the reaction the word “budget” triggers. The moment it’s mentioned, you’d think I had suggested something drastic — like giving up a limb.
But the reality is simple: financial success requires one fundamental rule — spend less than you earn.
I constantly hear people justify breaking this rule: “You don’t understand — I needed a new car.” “We needed a bigger house.” “We have to take our annual vacation.”
The line between a “want” and a “need” can occasionally blur, but most of the time they are worlds apart. Did you truly need a brand-new car — or could a reliable two-year-old model have saved you 20% in depreciation? Did you genuinely require more space, or could you have managed in your current home?
These are uncomfortable but necessary questions.
If your goal is to build wealth, your true needs are very limited:
Food
Shelter
Utilities
Taxes
That’s it. Everything else is a want.
Learning to control your wants is one of the most powerful steps toward financial stability. Before making a purchase, pause and ask yourself: Is this a need — or just a desire?
Here’s a practical guideline:
Your life should cost no more than 70–80% of your income.
When creating a budget, review your spending patterns and aim to keep your committed expenses at or below 70–80% of your gross income. That means 20–30% remains uncommitted — and that margin is where financial freedom begins.
This percentage isn’t a rigid law, but it’s a realistic and effective starting point. Once you structure your finances this way, constant expense tracking becomes less necessary. Your account balance itself becomes your guide. The real discipline lies in keeping those fixed obligations under control — and refusing to let wants quietly turn into “needs.”
What About the Remaining 20–30%?
That portion is what you “pay yourself first.”
Let’s break it down with a simple example.
Joe earns $100,000 per year and falls into a 25% tax bracket. If his goal is to save 30% of his income, he needs to set aside $22,500 annually.
Here’s how he does it:
$20,000 goes directly into his employer-sponsored retirement plan on a pre-tax basis.
He then contributes an additional $2,500 each year into a Roth IRA.
Just like that, Joe has hit his savings target.
After taxes and retirement contributions, the paycheck that lands in Joe’s bank account represents roughly 70% of his gross income. And here’s the beauty of the system: Joe is free to spend what’s in that account. He doesn’t have to think about saving — it’s already been handled.
Because the money moves into savings before he ever sees it, he adapts to living on the remaining amount. He never feels deprived because he never mentally counted that savings money as spendable income in the first place.
That’s the real secret to a budget that actually works.
Tracking every dollar you spend isn’t the magic solution — just like obsessively counting calories isn’t the true key to weight loss. The real power lies in building a financial structure that automatically balances income and spending, prioritizes saving, and leaves enough flexibility to absorb life’s inevitable surprises.
When the system is designed correctly, discipline becomes automatic — and wealth becomes a byproduct of structure, not willpower.
The Poor Owe — The Wealthy Own
This principle is straightforward: you cannot borrow your way to wealth — period.
There’s no late-night seminar teaching people how to become rich by shuffling balances between low-interest credit cards. Debt is not a wealth-building tool for consumers — it’s a wealth transfer mechanism, usually in the wrong direction.
For many people, high monthly credit card payments are the very reason their expenses feel suffocating. If you’re carrying significant non-mortgage debt, consider redirecting the 20% earmarked for long-term savings toward aggressively paying it down — but only after you eliminate access to more borrowing.
Every dollar of interest you don’t pay is equivalent to earning a guaranteed, risk-free, tax-free return equal to the interest rate on that debt. Few investments offer that kind of certainty.
And once the debt is gone — which can happen faster than you think if you apply 20% of your gross income toward it — immediately redirect that same money back into savings.
Signs You’re Damaging Your Financial Future
You may be off track if you:
See credit card balances rising while income is shrinking.
Pay only minimums — or less.
Shift balances or take cash advances to cover other cards.
Carry more credit cards than you can track.
Stay near your credit limits.
Charge more monthly than you repay.
Work overtime just to keep up with payments.
Avoid calculating your total debt.
Receive delinquency notices.
Use credit cards for essentials like food or gas.
Rely on credit because you lack cash.
Dip into savings or retirement accounts to cover bills.
Hide purchases from your spouse.
Open every unsolicited card offer.
Fear job loss because your debt load feels unmanageable.
The first step toward wealth is eliminating dependence on credit cards — for any reason. That may sound extreme, but you can’t break a habit while continuing the behavior. There’s no middle ground.
The Credit Card Roll-Up Strategy
If you’re serious about becoming debt-free, this structured approach works:
Cut up all your credit cards. Every single one.
List balances from largest to smallest, along with minimum payments.
Pay minimums on all cards — but pay five times the minimum on the smallest balance.
Repeat monthly. Ignore interest rates for now; the goal is quick psychological wins.
Once the smallest card is paid off, roll that full payment (including its former minimum) onto the next smallest balance.
Continue rolling payments upward until you attack the largest balance with significant monthly firepower.
Momentum builds quickly. What starts small becomes powerful.
When you eliminate your final credit card balance, reward yourself modestly — perhaps with two months’ worth of what used to be your debt payments.
Then immediately return to discipline.
Every dollar that once serviced debt now goes into savings and investment. You’ll have ground to make up — but you’ll also have the structure and momentum to build real wealth.
Debt keeps you working for your past. Savings and investment put your money to work for your future.
You Are Not Immune to Moral or Physical Risk
I remember watching Fear Factor hosted by Joe Rogan and realizing something simple: people will do almost anything for fast, easy money.
“Sure, I’ll eat those South American hissing cockroaches for $50,000.”
Yet many of those same people won’t consistently skip luxuries, reduce spending, or sacrifice short-term comfort to save $50,000 the slow and responsible way.
We’ve been conditioned to look for shortcuts. Instead of discipline, we gamble. The lottery — essentially a tax on poor financial judgment — becomes the dream strategy. Yet roughly 80% of lottery winners end up broke within a decade because sudden money cannot compensate for weak financial habits.
If I borrowed a page from David Letterman, I’d create a segment called “Financially Stupid Human Tricks” — highlighting the so-called “smart” financial moves that often create long-term damage.
Borrowing From Your 401(k)
Many employer-sponsored retirement plans allow loans. It feels harmless. After all, you’re “paying interest to yourself,” right?
Technically true.
But here’s what gets overlooked:
If you lose your job, the loan usually must be repaid within about 60 days.
If you can’t repay it, the balance is treated as a distribution — taxed and penalized.
Depending on your bracket, penalties and taxes can reach 40% or more.
And it gets worse: you can’t restore the lost compounding.
If you borrowed $7,000 and that money could have compounded at 8% annually, over time that single decision could cost tens of thousands — even $75,000 or more — in retirement value.
Your retirement account and your home equity should be financial “break glass only in absolute emergency” assets. If everything else in life goes wrong, those two pillars protect your shelter and your dignity.
Stretching to Buy a House
Homebuyers face enormous pressure.
Real estate agents earn more when you spend more. It’s no accident that you’re often shown a home slightly beyond your range first. Once you’ve walked through the upgraded kitchen and spa bathroom, the affordable house feels like a compromise.
Friends and family may encourage the stretch: “It’s an investment.” “You’ll earn more later.” “Real estate always goes up.”
Maybe. Maybe not.
Being “house poor” is real. When too much of your income goes toward housing, everything else suffers — vacations disappear, dining out shrinks, retirement contributions stall, college savings fade. Instead of cutting lifestyle, many simply layer on more debt to preserve appearances.
A house should support your life — not dominate it.
The common thread in all of this is risk blindness. People assume bad outcomes won’t apply to them. They believe they’ll keep the job, the market will cooperate, income will rise, and nothing unexpected will happen.
But wealth isn’t built on optimistic assumptions. It’s built on margin, discipline, and respect for risk.
Quick money excites. Structured money endures.
The Most Valuable Things in Life Don’t Cost Money
Too often, we confuse “quality time” with “costly activity.” We assume that spending meaningful time with family or loved ones requires tickets, reservations, travel, and swiping a credit card.
But isn’t the real goal connection?
You don’t need a weekend getaway to build memories. You need presence.
Learn to be creative:
Board games at home
Playing sports in the yard
A walk in the park with music or an audiobook
Movie nights with homemade popcorn
Sitting around talking, gaming, or reading together
The activity matters far less than the interaction. Some of the best moments in life cost absolutely nothing.
Laugh at the Joneses (Just a Little)
Petty? Maybe. Effective? Absolutely.
Trying to “keep up with the Joneses” is one of the fastest paths to financial stress. The irony is that the Joneses often aren’t thriving — they’re financing appearances.
As of mid-2025, the average American household carried over $100,000 in consumer debt, including mortgages, credit cards, auto loans, personal loans, and student debt. Since that’s an average, half of households owe even more. Meanwhile, non-mortgage consumer debt has climbed to historic highs, while income growth hasn’t kept pace.
In other words, the lifestyle you envy may be leveraged.
Recognizing that reality makes it much easier to stop competing. Financial peace rarely comes from outward display — it comes from internal margin.
The best things in life — laughter, conversation, friendship, time, health — cannot be financed. And the more you understand that, the less tempted you’ll be to borrow in order to simulate happiness.
Wealth isn’t about looking rich. It’s about being free.
If a little harmless comparison keeps you disciplined, use it.
Watching your neighbor finance every new car, remodel, and vacation can actually reinforce your own commitment to smart money management. Quietly appreciating that your lower debt load earned you a better mortgage rate — or that you sleep better at night — can be motivating.
Is it a bit petty? Sure. Is it effective? Often.
This isn’t really a “law of money” as much as a psychological trick. Humans are wired for comparison. If observing someone else’s overextension strengthens your resolve to stay disciplined, that’s not the worst thing — just keep it internal. You still want the dinner invitations.
At the end of the day, frugality isn’t about deprivation. It’s about peace of mind.
You’re choosing restraint today to gain freedom tomorrow.
Whether you’re eliminating debt, increasing savings, or simply refusing to live beyond your means, the real goal is avoiding the anxiety and stress that come from financial chaos. That clarity — knowing you’re in control — is what sustains long-term discipline.
When you remember that financial stability equals emotional stability, it becomes much easier to avoid burnout, stay consistent, and reach your goals faster.
Wealth is not about impressing others. It’s about sleeping well at night.
Money Cannot Purchase Happiness
That familiar cliché is often dismissed as something people say to justify not pursuing financial success. And while it’s technically true that money cannot directly purchase happiness, it can certainly acquire many of the things that make happiness easier to experience.
Money doesn’t guarantee joy. But neither do debt, stress, anxiety, or 20% credit card interest.
Financial security won’t fix every challenge in life. It won’t repair broken relationships or create purpose. But it does eliminate many of the pressures that drain your mental energy — surprise expenses, medical bills, job uncertainty, emergencies.
A strong financial foundation buys breathing room.
And breathing room reduces stress. Reduced stress improves relationships, decision-making, and overall well-being.
A healthy bank balance is far more valuable than another gadget, another upgrade, or the newest phone release. Financial stability may not buy happiness — but it buys freedom, options, and peace of mind.
And those are often much closer to happiness than most purchases ever will be.
There’s No Such Thing as “Five Easy Payments”
Don’t fall for flashy financing tricks. People often justify using a certain credit card or payment plan because it advertises 0% interest — but that’s beside the point. A good rule of thumb: if you can’t pay for it in cash right now, you probably shouldn’t buy it. Chances are, it’s a “want,” not a necessity.
Debt is still debt, no matter how attractive it looks. In the end, it’s the fine print that catches you off guard and pulls you further away from your financial goals.
Cash in your pocket beats being stretched too thin.
About half of marriages in the U.S. end in divorce, with two leading causes often cited: infidelity and money problems. Financial pressure can strain relationships, and many of our spending choices are driven more by emotion than logic. If you want to eliminate debt and the stress that comes with it, here are seven hard truths to help you regain control and build real financial cushion:
1) Cut Housing Costs. Do you really need the pool or those extra bedrooms filled with clutter? Many people buy more house than they actually use. Downsizing and lowering your mortgage payment can free up significant monthly cash flow.
2) Reduce Car Expenses. Consider going from two cars to one, carpooling, or using alternative transportation. Even trading in for a reliable two- or three-year-old vehicle could shrink your monthly payment, insurance, fuel, and maintenance costs.
3) Take on Extra Income (Temporarily). A part-time job bringing in an additional $1,000 per month adds up to $12,000 a year toward debt repayment. It doesn’t have to be permanent — just long enough to reset your finances.
4) Eliminate Costly Habits. Smoking, frequent dining out, and impulse spending drain money quickly. Cooking at home and cutting unnecessary indulgences may not feel convenient, but it’s both financially smart and often healthier.
5) Live Below Your Means. Adjusting priorities, expectations, and even location can help you scale your lifestyle to something sustainable.
6) Reconsider Private School. Private education can cost around $15,000 per year, while you’re already funding public schools through taxes. Supplementing public education with involvement at home can strengthen both your child’s learning and your relationship — at little to no financial cost.
Getting out of debt requires tough choices, but each decision moves you closer to financial freedom and peace of mind.
7) Turn Clutter into Cash. Garage sales, eBay, and countless online marketplaces make it easier than ever to unload the stuff you’ve accumulated over the years. What’s collecting dust in your home could translate into extra money to put toward paying down debt.
You might resist some of these ideas at first — and they are only suggestions. But once you begin applying even a few of these principles, you’ll likely uncover additional ways to live within your means and take meaningful steps toward a less stressful, more financially secure life.
Dress with purpose, not pressure.
Millionaires with $2–$5 million in assets tend to look very different from the flashy stereotype.
Research by Thomas J. Stanley found:
Modest Homes: Among estates valued at $3.5 million or more, the median home value was about $469,000.
Small Share of Net Worth: Their primary residence typically represented less than 10% of total net worth.
Broader Trend: About 90% of millionaires live in homes worth $1 million or less, and nearly a third live in homes valued at $300,000 or less.
Income-Producing Assets First: They invest more in businesses and income-generating real estate than in luxury personal residences.
Stanley’s rule of thumb: your home’s market value should ideally be less than three times your annual realized household income. Even affluent households ($1M–$10M+) often stay in the same, practical homes for decades.
Other Key Patterns
Entrepreneurial Roots: Many built wealth by starting businesses and carving out profitable niches. They’re driven by building enterprises — wealth is the byproduct.
Comfortable, Not Flashy: They buy quality items but avoid waste. For example, they may purchase expensive shoes — but they resole them instead of replacing them.
Stable Households: They’re often married to financially responsible partners who run efficient homes — clipping coupons, buying in bulk, and managing spending carefully.
Simple Formula: They consistently spend less than they earn.
Investing Habits
Once their businesses mature, they turn to the stock market for steady capital growth. They are rarely speculators, seldom gamble, and almost never buy lottery tickets.
You might assume they avoid speculation because they’re already wealthy — but more likely, they became wealthy because they avoid speculation.
And if you think wealth comes from flashy appearances or shortcuts, you might as well put pantyhose over your head and ask strangers for cash — it’s about as effective.
Money Law #9: Dress for success — but build wealth quietly.
Start Living Differently from Everyone Else Today
As Dave Ramsey often says:
“If you live like no one else today, you’ll be able to live like no one else tomorrow.”
Building wealth isn’t complicated. Retiring comfortably isn’t reserved for the lucky. It starts with committing to disciplined money habits and consistent saving. That path may put you at odds with credit card companies, frustrate the banks, and make you stand out from the “keep up with the Joneses” crowd—but that’s the point.
Sacrifice isn’t suffering. It’s a calculated move.
Pass on the new car today, and you keep more cash. Save that cash, and you can invest in assets that appreciate. Invest steadily, and your money begins working for you. Compound growth drives the engine—but your savings fuel it.
That’s how ordinary people build extraordinary retirements.
Stop blaming circumstances. Start making intentional decisions. Your future won’t be shaped by what you post, wish for, or complain about.
It will be shaped by what you actually do.
And one day, you may find yourself financially secure—with cash reserves, a solid emergency fund, reliable investment income, and peace of mind.
Looking back, the early sacrifice won’t feel like loss.
Thursday’s headline from the United States Department of Commerce showed the U.S. trade deficit widening sharply to $70.3 billion in December and reaching $901.5 billion for full-year 2025. December imports jumped 3.6% to $357.6 billion, while exports fell 1.7% to $287.3 billion. Economists had projected a $55.8 billion gap, making the release a significant downside surprise that prompted many to cut fourth-quarter GDP forecasts. Following the data, the Federal Reserve Bank of Atlanta lowered its Q4 GDP estimate to 3% from 3.6%.
The Commerce Department’s preliminary report showed the economy expanded at just a 1.4% annualized pace in Q4, well below the 2.8% consensus estimate. Federal government spending dropped 16.6% during the quarter — largely due to the shutdown — subtracting roughly one percentage point from growth. The wider trade deficit further weighed on output. For all of 2025, GDP rose 2.2%. Treasury yields drifted lower after the report, increasing expectations that the Federal Reserve may move toward another rate cut.
One potential obstacle to near-term easing is inflation. The Personal Consumption Expenditures (PCE) index rose 0.4% in December and 2.9% year-over-year. Core PCE, excluding food and energy, also climbed 0.4% on the month and 3% annually. On a positive note, consumer spending advanced 0.4% in December, offering some support for future growth momentum.
In financial markets, private credit came under scrutiny after Blue Owl Capital permanently restricted redemptions from one of its retail vehicles, Blue Owl Capital Corp II. The move triggered declines in alternative asset managers including Ares Management, Apollo Global Management, KKR, Blackstone, and TPG. Adding to concerns, BlackRock recently marked down portions of its private credit portfolio. Former PIMCO CEO Mohamed El-Erian publicly questioned whether this could signal a broader stress point for the sector.
In a separate development, The Wall Street Journal reported that President Donald Trump ordered the release of government files related to UFOs and unidentified aerial phenomena following heightened public interest. The directive reportedly came after comments by former President Barack Obama referencing extraterrestrial topics. Christopher Mellon, who previously helped publicize the “Tic Tac” military footage, suggested the move could have far-reaching implications.
Taken together, the combination of a widening trade deficit, softer GDP growth, persistent inflation, and emerging private credit strains presents a complex macro backdrop — one that leaves markets balancing expectations of further rate cuts against lingering structural risks.
When President Donald Trump returned to the White House in January 2025, he reaffirmed tariffs as the core instrument of his economic strategy — a blend of leverage, protectionism, and industrial revival. That strategy is now facing meaningful strain.
The recent ruling by the Supreme Court of the United States that Trump exceeded his authority in imposing sweeping global tariffs without congressional approval represents more than a procedural setback. It challenges the legal scaffolding underpinning a trade agenda that has shaped U.S. economic and foreign policy over the past year.
Markets have taken note — but without panic.
The contrast is notable. A defining pillar of presidential economic policy has been curtailed, yet equity markets remain resilient. Volatility has surfaced intermittently, but capital has not fled risk assets. Understanding this requires separating political drama from financial mechanics.
In theory, tariffs were meant to rebalance trade and accelerate reshoring. In practice, they largely operated as a cost-transfer mechanism. Importers absorbed part of the burden; consumers absorbed another portion through higher goods prices. Manufacturers dependent on global inputs faced margin compression. Retailers recalibrated pricing strategies. Supply chains, already strained in prior years, became more complex.
Economic data reflect this friction. Growth momentum has slowed from last year’s pace. Manufacturing surveys show uneven demand. Trade-sensitive capital expenditure has cooled. Meanwhile, inflation remains sticky — particularly in services — and goods categories exposed to import costs have seen renewed firmness. The anticipated mix of rapid expansion and stable prices has not materialized.
Markets, however, trade forward expectations — earnings trajectories and liquidity conditions — rather than political symbolism.
Large-cap U.S. equities continue to attract global capital, particularly in AI and advanced technology. Investment in semiconductors, cloud infrastructure, and computing capacity remains strong despite macro uncertainty. Earnings concentration in these sectors offsets weakness in more cyclical areas.
Investors see deceleration, not collapse. Corporate balance sheets remain broadly healthy. Employment is moderating but not deteriorating sharply. Financial conditions are tighter than in prior cycles, yet not restrictive enough to signal systemic stress.
Against this backdrop, a potential scaling back of tariffs introduces nuance rather than shock.
If trade barriers are diluted or subject to firmer congressional oversight, input costs could ease over time. That may gradually relieve goods-based inflation pressures. Supply chain planning could improve. Corporate forecasting may gain clarity — and clarity reduces risk premiums.
Bond markets reflect this balance. Treasury yields have fluctuated as investors weigh persistent inflation against moderating growth. Should tariff-driven price pressures fade, longer-term yields may stabilize. However, fiscal deficits and wage resilience continue to exert upward pressure. The tension remains unresolved.
Currency markets face competing forces. Reduced trade escalation could temper safe-haven demand for the dollar. Yet relative U.S. growth and yield differentials still offer structural support. Conviction remains limited.
Emerging markets are unlikely to move uniformly. Economies closely tied to U.S. demand may feel slower export momentum if domestic growth softens. Commodity exporters could benefit if inflation expectations anchor raw material prices at elevated levels. Capital allocation is becoming more selective.
None of this implies smooth conditions ahead.
Political backlash to the court’s decision could generate renewed volatility. Legislative countermeasures remain possible. Trade partners will recalibrate strategy in response to shifting U.S. authority.
Markets tend to resist escalation but adapt to adjustment.
Trump’s tariff strategy was presented as transformative. The measurable economic payoff has been less decisive. Growth has moderated, inflation has persisted, and structural trade imbalances remain largely intact.
Investors are pragmatic. A policy losing legal footing does not automatically trigger liquidation. If the outcome is reduced uncertainty and steadier price dynamics, equities can continue advancing even as political narratives fragment.
Cautious optimism defines the current tone.
Risk appetite remains conditional. A renewed acceleration in inflation would alter expectations quickly. A material deterioration in employment would challenge confidence. Fiscal expansion without corresponding growth would intensify long-term sustainability concerns.Markets are not celebrating policy unraveling — they are recalibrating probabilities.
The assessment is sober: an economy that is softer but not broken; inflation that is persistent but not runaway; profitability concentrated but durable in structurally advantaged sectors.Trade authority may now face clearer constitutional limits. Structural investment in innovation continues.
Capital ultimately flows toward earnings visibility and long-duration growth themes. Tariffs have dominated headlines. Technology and AI dominate capital expenditure.
Investors are adjusting exposure and preparing for volatility — but not retreating.The tariff agenda is under pressure. Financial markets, for now, are looking past it.
For more than a year, Donald Trump has operated in Washington with sweeping confidence, exercising power in ways critics said resembled monarchical authority. On Friday, however, the Supreme Court of the United States sharply redirected that momentum.
By invalidating his administration’s cornerstone economic policy, the court handed down a rare and highly visible rebuke, signaling that even a dominant president faces constitutional limits. The 6–3 ruling, written by Chief Justice John Roberts, rejected Trump’s expansive claim that he could impose broad tariffs under emergency powers to safeguard U.S. economic security.
Trump reacted swiftly and angrily. According to Delaware Governor Matt Meyer, the president told governors at the White House that he was “seething” and needed to respond to the courts. Later, speaking to reporters, he criticized the justices who ruled against him — including two he had appointed — calling them weak and an embarrassment. Still, he maintained that the decision ultimately clarified his authority and insisted he could pursue even higher tariffs through alternative legal avenues.
Few issues have defined Trump’s second term more than tariffs, which he has frequently described as his “favorite word.” He used them not only as trade tools but as leverage in disputes over agriculture, foreign investment, narcotics trafficking, prescription drug pricing, and industrial policy. While Congress holds constitutional authority over taxation, the Republican-controlled legislature largely refrained from challenging his approach, and the conservative-leaning court had often bolstered executive power in prior rulings.
This decision, however, marked a boundary. Historians and legal scholars described it as a direct blow to Trump’s broad interpretation of emergency authority under the International Emergency Economic Powers Act. Although the president suggested he could rely on other statutes — and even impose a temporary global tariff — such paths would likely involve stricter procedural requirements and time constraints.
Legal experts noted that no previous president had used the disputed law as aggressively. As University of Virginia scholar Saikrishna Prakash put it, the ruling leaves the presidency “definitely weaker,” underscoring that even assertive executive power remains subject to judicial review.
The U.S. Supreme Court’s decision on Friday to overturn trade tariffs introduced by President Donald Trump last year could ease financial pressure on certain oil producers and drilling firms, though analysts say it is unlikely to significantly reshape global energy trade flows in the near term.
By striking down the tariffs, the Supreme Court of the United States may lower the cost of constructing LNG facilities and other major energy projects that depend on foreign-made modules and components. For instance, Venture Global assembles parts of its LNG plants in Italy before shipping them to the U.S. for completion — a process that had become more expensive under the tariff regime. U.S. crude producers and oilfield service firms also faced higher costs for imported equipment and materials, with some absorbing the impact and others attempting to pass it along to customers.
Cam Hewell, CEO of Premium Oilfield Technologies, said his company had expected to pay $5–6 million in tariff-related taxes in 2026 — a figure that may now decline. He noted that most of the added costs had been absorbed internally, meaning customer pricing would see little change, but improved cash flow could support research, employee compensation, and shareholder returns.
Kirk Edwards, president of Latigo Petroleum in Texas, added that the ruling could improve budgeting clarity and cost visibility for drilling projects.
However, the decision does not eliminate the 50% tariffs on steel and aluminum imposed last year, and some executives remain cautious that the administration could pursue alternative measures to maintain similar trade barriers. Trump himself indicated he may introduce a 10% global tariff for 150 days, signaling that policy uncertainty remains.
Despite the potential cost relief for LNG infrastructure, experts believe global LNG trade patterns are unlikely to shift materially. Ira Joseph of Columbia University’s Center on Global Energy Policy said China has stronger economic incentives to continue redirecting U.S. LNG cargoes to Europe for arbitrage or to import cheaper oil-indexed LNG from the Middle East.
Alex Munton of Rapidan Energy added that Beijing increasingly views LNG purchases as strategic leverage in its relationship with Washington, making new buying commitments unlikely even if tariff pressures ease. Samantha Santa Maria-Hartke of Vortexa echoed that view, suggesting China — which halted U.S. crude and LNG imports after imposing retaliatory tariffs — is unlikely to reverse course in the near term.
The U.S. dollar edged lower on Friday as investors digested the impact of the Supreme Court’s decision to invalidate President Donald Trump’s broad tariff measures. Despite the pullback, the greenback remained on track for its strongest weekly advance since November, supported by a more hawkish tone from the Federal Reserve and ongoing geopolitical tensions between the U.S. and Iran.
As of 17:31 ET (22:31 GMT), the Dollar Index slipped 0.2% to 97.72, though it was still poised to post a weekly gain of around 1%, its best showing in nearly three months.
The Supreme Court ruled 6–3 that Trump lacked authority under the International Emergency Economic Powers Act (IEEPA) to implement sweeping reciprocal tariffs. The president criticized the decision as “deeply disappointing” and indicated that tariffs would remain in effect through alternative legal channels, alongside a new 10% global levy.
According to Jeff Buchbinder of LPL Financial, removing the tariff overhang eliminates a drag on economic growth that had been expected to lift costs and pressure corporate margins. With that risk easing, growth may stabilize and inflation expectations embedded in bond markets could cool more quickly, potentially prompting a modest reassessment of Fed rate-cut expectations and weighing slightly on the dollar.
Even so, the dollar had attracted demand earlier in the week, underpinned by resilient U.S. economic data, hawkish Fed meeting minutes, and heightened Middle East tensions.
Friday’s data, however, delivered mixed signals. Core PCE — the Fed’s preferred inflation measure — rose 0.4% month-over-month and 3.0% year-over-year in December 2025, marking the highest annual reading since November 2023 and remaining well above the 2% target. Meanwhile, preliminary fourth-quarter GDP growth came in at 1.4%, falling short of the 2.8% consensus forecast.
In Europe, EUR/USD ticked up 0.1% to 1.1781, though the euro was still headed for a 0.7% weekly decline amid uncertainty surrounding ECB President Christine Lagarde’s tenure and softer German producer price data. Analysts at ING noted that while sentiment indicators such as the ZEW survey disappointed, the eurozone composite PMI is expected to stay above the 50 threshold, limiting downside pressure on the euro.
GBP/USD rose 0.1% to 1.3474, but sterling hovered near a one-month low and was set for a weekly loss of about 1.3%. Strong January retail sales — up 1.8% month-over-month and 4.5% year-over-year — failed to provide sustained support. ING analysts said markets are pricing in a Bank of England rate cut in March, with another possible move in June, while political risks continue to weigh on the pound.
In Asia, USD/JPY held steady at 155.06 after data showed Japan’s inflation slowed to 1.5% in January, slipping below the Bank of Japan’s target for the first time in nearly four years. Core inflation excluding fresh food and fuel also moderated, reinforcing uncertainty over the timing of the next rate hike. Separate data showed Japanese factory activity expanded at its fastest pace in over four years in February.
USD/CNY was unchanged at 6.9087, with Chinese markets closed. Meanwhile, AUD/USD climbed 0.5% to 0.70892, although the Australian dollar trimmed some gains after unemployment held at 4.1% in January, signaling a still-tight but gradually cooling labor market.
After a powerful rally in large-cap technology shares, investors are once again asking whether smart money is beginning to rotate.
With AI enthusiasm pushing tech valuations higher and energy names still trading at comparatively modest multiples, there are early signs that capital flows may be shifting beneath the surface. Here’s a closer look at the current landscape — and where institutional positioning may be headed.
The Case for Tech: Structural Growth Still Intact
Companies such as Nvidia (NASDAQ: NVDA), Microsoft (NASDAQ: MSFT), and Apple (NASDAQ: AAPL) remain central pillars of institutional portfolios.
Technology continues to lead in earnings expansion, fueled by AI infrastructure investment, cloud migration, and ongoing software monetization.
Why capital is still favoring tech:
Revenue growth outpacing the broader market
High operating margins and robust free cash flow
Sustained AI-driven capex cycles
Strong balance sheets with significant liquidity
Mega-cap tech remains a structural core holding for institutional investors. Even during brief pullbacks, dip-buying has been persistent — a sign that long-term conviction in the sector remains strong.
That said, valuations in select segments have stretched beyond historical norms. If earnings momentum moderates, the probability of sector rotation increases, particularly as investors reassess risk-reward at elevated multiples.
The Case for Energy: Undervalued and Cash-Generative
Integrated majors such as Exxon Mobil (NYSE: XOM) and Chevron (NYSE: CVX) are drawing renewed attention as investors reassess sector allocations.
Energy equities typically trade in cycles influenced by crude prices, global demand dynamics, and geopolitical developments. After extended periods of relative underperformance, the sector often becomes a magnet for value-oriented capital.
Why institutional money may rotate toward energy:
Lower forward P/E multiples compared to technology
Strong and visible free cash flow generation
Dividend yields frequently above the broader market average
Ongoing share repurchase programs
If crude prices remain stable or trend higher, integrated oil majors can produce substantial cash flows, offering a mix of income, capital return, and relative defensiveness.
In an environment where parts of the technology sector appear valuation-stretched, energy provides a compelling contrast on both multiples and yield.
Sector ETF Signals: Tracking Institutional Flows
Sector ETFs can offer valuable insight into how institutional capital is rotating beneath the surface. Two key vehicles to monitor are the Technology Select Sector SPDR Fund (NYSE: XLK) and the Energy Select Sector SPDR Fund (NYSE: XLE).
ETF performance and fund flow data often act as real-time indicators of positioning shifts:
If XLK continues to outperform, it suggests growth leadership remains firmly in place.
If XLE begins to show sustained relative strength versus XLK, it may signal that rotation into energy is gaining traction.
Historically, sector leadership transitions tend to coincide with:
Shifts in interest rate expectations
Narrowing earnings growth differentials
Sharp moves in commodity prices
Monitoring the relative strength ratio between XLE and XLK can provide early confirmation of whether capital is merely rebalancing tactically — or whether a broader structural rotation is unfolding.
Macro Forces Driving Sector Rotation
1. Interest Rates Elevated yields tend to weigh more heavily on high-multiple technology stocks, as future cash flows are discounted at higher rates. In contrast, energy companies—often valued on nearer-term cash generation—can prove more resilient. If bond yields move higher, defensive value sectors may attract incremental capital at the expense of growth.
2. Commodity Prices Oil prices remain a primary earnings driver for energy producers. A sustained rally in crude can rapidly alter sector performance dynamics, drawing capital into integrated majors and upstream names as profit expectations improve.
3. Earnings Revisions Institutional allocation models closely track forward earnings revisions. If analyst upgrades begin to slow in technology while turning more constructive for energy, portfolio rebalancing flows may follow.
4. Risk Appetite Technology typically outperforms in strong risk-on environments characterized by abundant liquidity and growth optimism. Energy, by contrast, can gain relative strength during inflationary phases or periods of geopolitical tension, when commodity exposure and cash yield become more attractive.
What Institutional Capital Is Likely Doing Now
Rather than making an outright “either/or” shift, institutional investors typically adjust exposure more subtly. That can mean trimming extended technology positions, selectively adding energy holdings, or rotating within sectors—such as moving from mega-cap AI leaders into second-tier beneficiaries of the theme.
The real driver is relative earnings momentum, not headlines.
Which Sector Offers More Upside?
Tech Upside Scenario
Continued acceleration in AI-related spending
Consistent earnings beats from mega-cap leaders
Declining bond yields that support higher valuation multiples
Energy Upside Scenario
Oil prices establish a sustained uptrend
Inflation concerns re-emerge
Technology valuations compress
In the near term, technology remains the structural growth narrative, supported by AI infrastructure, cloud expansion, and software monetization. However, energy presents potential asymmetric upside if commodity dynamics shift in its favor.
Sector rotation is rarely abrupt. More often, it unfolds gradually through portfolio rebalancing rather than wholesale liquidation.
While tech continues to dominate leadership, energy’s relative valuation discount and strong cash generation could attract incremental capital if macro conditions evolve.
Key indicators to monitor:
Relative strength between the Energy Select Sector SPDR Fund and the Technology Select Sector SPDR Fund
Forward earnings revisions
Oil price trends
Bond yield movements
The critical question is not whether rotation will occur — but whether it is already quietly underway beneath the surface.
Macro uncertainty is intensifying just as EUR/USD and GBP/USD test pivotal technical zones. With interest-rate expectations shifting and tail risks mounting, the next directional move may depend more on macro catalysts than chart patterns.
Both pairs are hovering near critical support and resistance levels, while a dense lineup of U.S. and European data raises the prospect of increased volatility. The dollar continues to trade in close correlation with Treasury yields and evolving Federal Reserve rate pricing, reinforcing the macro-driven backdrop.
At the same time, tariff developments and geopolitical tensions are injecting additional tail risk ahead of the weekend, leaving markets vulnerable to sharp, sentiment-driven swings.
Summary
As the week moves into its final stretch, both Europe and the United States face a heavy slate of economic releases—and this is unlikely to be mere background noise for markets. Recent price action has already underscored how reactive EUR/USD and GBP/USD are to changes in relative rate expectations across the U.S., U.K., and euro area.
With both currency pairs now positioned near critical technical thresholds, the incoming data flow carries the potential to do more than simply inject volatility. It may ultimately determine whether the latest directional moves gain traction—or begin to lose momentum and reverse.
Heavy Data Calendar Lifts Volatility Threat
Flash PMIs rarely fail to generate movement in EUR/USD and GBP/USD, largely because European participants tend to respond far more decisively to the releases than traders elsewhere. In the euro area, the focus is likely to center on price components and new orders, especially in light of the recent resilience in the single currency. In the UK, attention may gravitate toward price pressures, employment trends, and overall activity, reflecting the economy’s persistent softness.
The more consequential headline risk, however, lies in the United States. The advance Q4 GDP print stands out. While backward-looking and heavily estimate-based, it still carries the potential to influence how the dollar closes the week. An upside surprise would reinforce the narrative of U.S. exceptionalism. A downside miss, on the other hand, could reignite expectations for Federal Reserve rate cuts—expectations that have recently been scaled back after generally firm data and relatively hawkish FOMC minutes.
December’s core PCE deflator rarely delivers genuine surprises these days. Enhanced data mapping has largely diminished its shock factor, shifting attention toward the consumption and income components instead. Markets will scrutinize the consumption data for signs that recent weakness in goods demand has spilled into services, while income figures should provide a clearer indication of households’ capacity to sustain spending.
US flash PMIs, meanwhile, have produced inconsistent market reactions and are often overshadowed when more significant releases land on the same day. Broadly speaking, they have tended to exaggerate the signal seen in ISM surveys. As a result, a stronger market response may emerge if there are clear signs of softening—particularly within the services sector.
Weekend Risk Premium Builds
Beyond the dense data schedule, traders also face mounting tail risks heading into the weekend. A ruling from the Supreme Court of the United States on the legality of tariffs imposed under the International Emergency Economic Powers Act (IEEPA) could arrive around 10 a.m. U.S. time, although there is no certainty a decision will be issued today. Even the possibility is sufficient to keep markets cautious, given the potential implications for Treasury yields and overall risk sentiment.
At the same time, Donald Trump has set a 10-day deadline for Iran to reach a deal or face potential military action. Considering the risks to global energy supply—and the United States’ position as a major energy producer—any pre-emptive strike would likely support the dollar against European currencies, particularly if it sparks a renewed wave of risk aversion.
Regarding tariffs, the market reaction may remain relatively muted regardless of the court’s decision—unless investors begin to question whether any shortfall in government revenues can be covered through alternative channels. Should doubts arise on that front, both the dollar and longer-dated Treasuries could face meaningful downside pressure as fiscal concerns move to the forefront.
Dollar Catalysts Return to Center Stage
Underscoring the significance of the upcoming data and event risk, the US Dollar Index (DXY) has shown a notably tight correlation over the past week with Fed rate-cut expectations, front-end yield differentials, US two-year Treasury yields, and even Brent crude, as illustrated in the middle panel of the chart above. In practical terms, the dollar has reverted to trading primarily as a rates-and-yields narrative, with an added layer of sensitivity to energy prices.
Yet the 20-day correlation metrics shown on the right paint a much less compelling picture. Over the past month, these relationships have been weak and statistically insignificant, serving as a reminder that the recent alignment may prove temporary rather than structural.
GBP/USD Faces Growing Downside Pressure
As discussed in earlier analysis this week, the release of key UK labour market and inflation figures acted as the catalyst that pushed GBP/USD out of its consolidation phase. Combined with firm U.S. data, the move triggered a decisive break below multiple technical markers, including the November uptrend and the 50-day moving average, before finding support at the 200-day moving average. Whether assessed through pure price action or momentum indicators, the bias now tilts toward increasing downside risk.
The 14-period RSI continues to trend lower below the 50 mark, while MACD has crossed beneath its signal line and moved into negative territory—both reinforcing the build-up of bearish momentum. As a result, selling rallies appears more favorable than buying dips. That said, the pair’s proximity to the 200DMA provides a clearly defined reference point for structuring trades as incoming data and headlines shape sentiment.
A sustained break below the 200DMA would strengthen the bearish case, opening the door for short positions with stops placed just above the average. Initial downside targets would sit at 1.3371, followed by 1.3300 and 1.3250. Conversely, if price manages to hold above the 200DMA, the setup could shift tactically. Long positions above the level, with stops placed beneath, would target 1.3535—a zone where several technical indicators, including the 50DMA, currently converge. A reclaim of that area would undermine the newly established bearish bias and shift directional risks back toward a sideways-to-higher outlook.
Triangle Formation Brings Breakout Levels Into View
With EUR/USD coiling within a descending triangle and momentum indicators drifting lower, downside risks appear to be gradually building. A decisive break beneath the confluence of the 50-day moving average and horizontal support at 1.1768 may prove pivotal in unlocking further weakness. Thursday’s doji candle aligns with that narrative, highlighting a degree of indecision among market participants at a technically sensitive juncture.
While the bearish case in GBP/USD looks more straightforward—given recent UK data and the repricing of Bank of England rate expectations—the outlook for the euro is less clear-cut. That ambiguity reinforces the importance of upcoming data and headlines in shaping near-term direction. RSI (14) has slipped just below 50, offering a neutral-to-soft signal, while MACD has rolled over but remains marginally above zero, underscoring the lack of decisive momentum so far.
The descending triangle structure keeps the downside break scenario firmly in focus, but confirmation is still required. A sustained break and close below the 50DMA/1.1768 area would strengthen the bearish case, with short positions targeting 1.1684 initially, followed by the 200-day moving average. Stops could be placed just above the broken support zone for protection.
Conversely, if the pair manages to hold this confluence area, a tactical long setup may be considered with tight stops below, initially targeting the January downtrend line. Should price test but fail to clear that trendline convincingly, it may favor squaring positions or re-establishing shorts with stops above, aiming for a retest of the 50DMA/1.1768 region. A clean upside breakout, however, would alter the landscape, opening scope toward 1.1837 and potentially 1.1918, shifting directional risks back toward a sideways-to-higher bias.
Gold futures are presently moving within a defined VC PMI mean-reversion structure, signaling a market positioned at a pivotal balance point between accumulation and expansion. The price hovering near 5,030 coincides exactly with the weekly VC PMI mean, reinforcing the idea that value and momentum are in equilibrium as traders wait for a clear directional trigger.
When prices consolidate around the mean, the probability outlook turns neutral. A decisive breakout above resistance or a pullback into lower value zones is needed to generate the next high-probability trading opportunity.
Under the VC PMI framework, a sustained close above the 5,030 weekly mean and the daily Sell-1 resistance around 5,036 shifts probabilities in favor of continued upside. That confirmation opens the path toward the daily Sell-2 level near 5,075 and the weekly Sell-1 target at 5,160. A firm break and close above 5,160 would mark the start of a volatility expansion phase, transitioning the market from consolidation into a directional trend, with former Sell-1 and Sell-2 levels converting into support.
In that bullish scenario, momentum could extend toward the weekly Sell-2 objective around 5,275, signaling stronger institutional flows and momentum-based participation. Historical probability metrics suggest that once price closes above the mean and sustains it, there is roughly a 70–80% chance of continuation toward the next resistance zone.
On the other hand, failure to hold above the VC PMI mean—particularly a close below 5,000—would tilt probabilities toward a corrective retracement into the daily Buy-1 level near 4,965 and Buy-2 around 4,933. These represent statistically extreme value areas, where the model identifies a 90–95% probability of reversion back toward equilibrium after being tested.
As long as price remains above the weekly Buy-1 level at 4,916, the broader technical structure stays constructive, implying pullbacks are corrective in nature rather than trend reversals. However, a decisive break below the weekly Buy-2 level at 4,785 would negate the current bullish outlook and point to a deeper cyclical correction.
Time-cycle analysis heading into late February and early March highlights critical inflection windows around February 24–26 and March 3–7—periods that historically coincide with shifts from consolidation to expansion phases.
These timing cycles correspond with Square-of-9 harmonic resistance in the 5,075–5,160 range and support clusters between 4,965 and 4,916, forming a technically balanced and mathematically aligned trading range.
When time and price harmonics converge in this manner, the probability of volatility expansion increases significantly, often leading to directional breakouts accompanied by stronger momentum and broader market participation.
Here’s what you need to know for Friday, February 20:
The US Dollar Index (DXY) maintains its upward momentum, hovering near 98.00 after reaching a near one-month high on Thursday. The economic agenda for Friday features preliminary February Purchasing Managers’ Index (PMI) data from Germany, the Eurozone, the UK and the US. The spotlight, however, will be on the first estimate of fourth-quarter Gross Domestic Product (GDP) growth and the December Personal Consumption Expenditures (PCE) Price Index, both to be released by the US Bureau of Economic Analysis.
The US Dollar outperformed major peers on Thursday amid a risk-off market tone fueled by rising tensions between the US and Iran. According to BBC, US President Donald Trump warned that Iran must strike a deal or face serious consequences. Iran, in communication with UN Secretary-General Antonio Guterres, stated it does not seek conflict but would not tolerate military aggression. Iranian officials also reportedly cautioned that any US military move over the nuclear issue would be met with a decisive response. Early Friday, US stock index futures were modestly higher.
The US economy is expected to have expanded at an annualized pace of 3% in Q4, following a 4.4% increase in the prior quarter. Meanwhile, the core PCE Price Index — the Federal Reserve’s preferred inflation gauge — is forecast to rise 2.9% year-over-year in December, up slightly from 2.8% in November.
EUR/USD, which closed lower on Thursday, remains under pressure early Friday, trading near 1.1750. PMI figures from Germany and the Eurozone are anticipated to continue signaling expansion in private-sector activity for February.
GBP/USD extended its decline for a fourth straight session on Thursday and trades below 1.3450, marking its weakest level since late January. Data from the UK’s Office for National Statistics showed that Retail Sales climbed 1.8% month-over-month in January, significantly beating the 0.2% consensus estimate.
USD/JPY continues its weekly advance and holds comfortably above 155.00 in early Friday trading. Japan’s Prime Minister Sanae Takaichi stated that necessary expenditures would largely be financed through the initial budget, adding that efforts would be made to gradually reduce the debt-to-GDP ratio and restore fiscal discipline. Japan’s National Consumer Price Index rose 1.5% in January, down from 2.1% in December.
Gold benefited from safe-haven demand on Thursday but struggled to build momentum amid broad USD strength. XAU/USD edges higher during the European session on Friday, trading above $5,000.
In Australia, flash data from S&P Global showed the Composite PMI easing to 52 in February from 55.7 in January. AUD/USD largely brushed off the release and was last seen slightly lower on the day near 0.7050.
The United Kingdom is set to release its preliminary February Purchasing Managers’ Index (PMI) figures, with the data scheduled to be published by S&P Global on Friday at 09:30 GMT.
The Services PMI is forecast at 53.6, slightly lower than January’s reading of 54.0, signaling a modest slowdown in services sector growth.
Potential Impact on GBP/USD
If the Services PMI prints in line with expectations, GBP/USD could face pressure, as a softer services reading may counterbalance the recent strength seen in UK Retail Sales.
UK Retail Sales rose 1.8% month-over-month in January, well above December’s 0.4% gain and surpassing the 0.2% market forecast. Core Retail Sales increased 2.0% over the same period, improving from a 0.3% rise previously and exceeding expectations for a 0.2% uptick.
However, the pair may remain under strain as the US Dollar stays firm following the release of the January meeting minutes from the Federal Open Market Committee. The minutes revived speculation that the Federal Reserve could consider further rate hikes if inflation proves persistent. Although most officials favored holding rates steady, only a minority supported a cut, and policymakers suggested easing could be appropriate if inflation slows as projected.
From a technical standpoint, GBP/USD has stabilized after rebounding from daily losses, hovering near 1.3460 at the time of writing. Daily chart analysis points to a developing bearish tone, with the pair trading below an ascending channel formation. Immediate support is located near the two-month high of 1.3344. On the upside, resistance is seen at the 50-day EMA around 1.3524, followed by the nine-day EMA near 1.3548.
Gold (XAU/USD) remains tilted to the upside for a third consecutive session on Friday, though gains appear restrained amid a mixed fundamental backdrop. Traders are largely staying on the sidelines ahead of key U.S. data releases — the Advance fourth-quarter GDP report and the Personal Consumption Expenditures (PCE) Price Index — before committing to fresh directional positions. These readings are expected to shape expectations for the Federal Reserve’s rate-cut trajectory, which in turn will influence the U.S. dollar and the outlook for the non-yielding yellow metal.
Heightened geopolitical tensions are offering some support. U.S. President Donald Trump warned Iran that it must reach a nuclear agreement within 10 to 15 days or face severe consequences. In response, Iran told UN Secretary-General Antonio Guterres that while it does not seek conflict, it would respond to any military aggression and consider hostile forces’ regional bases legitimate targets. The escalating rhetoric has revived fears of a broader Middle East confrontation, underpinning safe-haven demand for gold and helping sustain its modest advance into the end of the week.
However, upside momentum remains capped by shifting interest-rate expectations. Minutes from the January FOMC meeting indicated policymakers are not in a rush to ease policy further and even discussed the possibility of additional tightening should inflation remain persistent. Strong U.S. labor market data, coupled with hawkish remarks from Fed officials, has prompted investors to scale back expectations for aggressive rate cuts.
This repricing has lifted the U.S. dollar to its highest level since January 23, limiting further gains in gold and suggesting bulls may remain cautious until clearer signals emerge from incoming economic data.
XAU/USD H1 chart
Gold buyers stay in control above the 100-hour SMA; range breakout still pending.
On Thursday, XAU/USD successfully held above the 100-hour Simple Moving Average (SMA), which has shifted from resistance to support, and staged a modest rebound from that level. However, the absence of strong follow-through buying and the largely range-bound movement seen over the past couple of sessions suggest bulls should remain cautious. The 100-hour SMA, currently positioned at $4,965.41, continues to provide nearby dynamic support.
From a momentum standpoint, the Moving Average Convergence Divergence (MACD) remains below both its Signal line and the zero mark, although the narrowing negative histogram points to easing bearish pressure. Meanwhile, the Relative Strength Index (RSI) hovers around 53, reflecting neutral conditions and a tentative recovery bias.
As long as price action stays above the rising 100-period SMA, short-term risks remain tilted to the upside. A bullish MACD crossover accompanied by a move back above the zero line would reinforce the case for further gains. On the other hand, if MACD momentum weakens further and the RSI turns lower from the mid-50 region, the rebound could lose traction, potentially leading to another test of the moving average before a clearer directional move emerges.
Bitcoin edged higher on Friday, drawing some support from dip-buying after recent losses, though overall sentiment toward cryptocurrencies remained weighed down by uncertainty over U.S. interest rates and rising geopolitical tensions.
The world’s largest digital asset was still on track for a weekly decline, as a short-lived rebound from last week quickly lost momentum. Bitcoin has also fallen roughly 25% so far in 2026.
Bitcoin climbed to $67,843.1 by 01:21 ET (06:21 GMT). Despite the modest uptick, it was down 2.8% for the week and poised to register losses in five of the past seven weeks.
Rate uncertainty intensifies ahead of PCE, GDP data
Bitcoin and the broader crypto market extended declines this week as demand for speculative assets weakened amid growing doubts about the U.S. rate outlook.
Concerns escalated after minutes from the Federal Reserve’s January meeting revealed that several policymakers supported keeping the door open to further rate hikes to counter inflation risks — a backdrop that typically pressures high-risk assets.
A string of mixed inflation and labor market reports has further clouded expectations for monetary policy. Cryptocurrencies are particularly sensitive to higher interest rates, as they tend to perform better in environments flush with liquidity.
Investors are now awaiting December’s Personal Consumption Expenditures (PCE) price index — the Fed’s preferred inflation measure — due later Friday, along with fourth-quarter gross domestic product data, both of which could shape longer-term rate expectations.
Iran tensions dent risk appetite
Risk sentiment was also dampened by escalating geopolitical strains between the U.S. and Iran. President Donald Trump reiterated threats of military action if Tehran fails to agree to a nuclear deal, while multiple reports indicated Washington is weighing several military options and has increased its regional presence.
The heightened tensions curbed appetite for riskier assets such as Bitcoin, prompting some traders to favor traditional safe havens including the U.S. dollar and gold.
Altcoins head for weekly losses
Broader crypto markets traded in a narrow range on Friday, with most major altcoins also facing another week of declines.
The second-largest cryptocurrency, Ethereum, slipped 1.5% to $1,954.09 and was set for a 6.2% weekly drop.
XRP and BNB were down around 6% and 3% for the week, respectively, while Cardano and Solana were on track for losses of roughly 5% to 7%.
Among meme tokens, Dogecoin was headed for an 11% weekly decline.
Most Asian equities declined on Friday as mounting uncertainty over the U.S. interest-rate outlook and escalating tensions surrounding Iran dampened appetite for risk assets.
South Korea stood out as a bright spot, with the KOSPI surging to fresh record highs on sustained optimism in domestic markets following a recent tech-led rally.
Regional bourses tracked overnight losses on Wall Street, where a wave of risk-off sentiment pressured stocks. S&P 500 Futures edged up 0.16% by 22:37 ET (03:37 GMT), as investors awaited key inflation and growth data due later in the session. Chinese markets remained shut for the Lunar New Year holiday.
Japan slides despite mixed data; Hong Kong retreats after break
In Japan, the Nikkei 225 and TOPIX were the region’s weakest performers, falling 1.4% and 1.2%, respectively.
Shares came under pressure following mixed economic releases. Data showed Japan’s headline consumer price index slowed to its lowest level in nearly four years in January, while core inflation also eased but remained above the Bank of Japan’s 2% annual target.
Meanwhile, purchasing managers’ index figures indicated factory activity expanded to a four-year high in February, supported by firm overseas demand.
Hong Kong’s Hang Seng Index fell 0.6% as trading resumed after a three-day holiday, with local technology stocks mirroring earlier global declines.
Among the laggards were Alibaba Group and Baidu Inc, which tumbled between 4% and 6% after being briefly named on a U.S. government list of firms allegedly linked to the Chinese military. BYD Co, also cited in the list, slipped 1.6%.
Elsewhere, markets were subdued. Australia’s S&P/ASX 200 dipped 0.2%, Singapore’s Straits Times Index edged up 0.1%, and India’s Nifty 50 was little changed, with local tech shares remaining cautious despite reports of new artificial intelligence ventures.
Risk sentiment remained fragile after U.S. President Donald Trump gave Iran a 10–15 day deadline to reach a nuclear agreement or face potential U.S. action, with multiple reports suggesting further strikes were under consideration.
South Korea outperforms as KOSPI hits record
South Korea’s KOSPI bucked the regional trend, climbing more than 1.6% to a record 5,768.61 points and marking its second straight session at an all-time high.
While Thursday’s gains were driven by technology stocks, Friday’s advance was led by strong performances in brokerage, defense, and insurance names.
Local media reported a surge in buying by retail investors, even as foreign investors continued to pare holdings.
Separately, South Korea’s top court on Thursday sentenced former President Yoon Suk-Yeol to life imprisonment over charges linked to an attempted insurrection in late 2024.
Oil prices moved modestly higher in Asian trading on Friday, building on strong gains from the prior two sessions and putting major benchmarks on course for roughly a 6% weekly advance, as rising tensions between the U.S. and Iran heightened concerns about potential supply disruptions in the Middle East.
By 22:41 ET (03:41 GMT), Brent for April delivery climbed 0.2% to $71.81 a barrel, while West Texas Intermediate (WTI) crude rose 0.5% to $66.78 a barrel.
Both contracts were hovering near their highest levels since early August and were set to record weekly gains of more than 6%.
Oil near six-month high on US-Iran tensions
Investor anxiety has intensified after U.S. President Donald Trump warned Tehran that “bad things” could follow if a nuclear agreement is not reached within roughly 10–15 days, raising the possibility of military action.
According to a Wall Street Journal report, Trump is considering a limited strike on Iranian targets to pressure Tehran into accepting a nuclear deal.
Any escalation involving Iran — a key OPEC producer — could jeopardize shipments through the Strait of Hormuz, a vital passageway that handles about one-fifth of global oil trade, thereby increasing the market’s sensitivity to geopolitical risk.
This week’s rally also marked a rebound from earlier losses, when prices slipped at the start of the week on hopes that U.S.-Iran negotiations were making progress. The renewed tough rhetoric has since restored a geopolitical risk premium, pushing crude back toward multi-week highs.
US crude inventories drop sharply – EIA
Data from the U.S. Energy Information Administration on Thursday showed crude stockpiles fell by around 9 million barrels last week, defying expectations for a 1.7 million-barrel increase.
The report also indicated declines in gasoline and distillate inventories, both coming in below forecasts, suggesting solid demand from refiners and consumers.
Markets are now awaiting the release of the U.S. Personal Consumption Expenditures (PCE) Price Index later on Friday — the Federal Reserve’s preferred measure of inflation.
Following recent hawkish Fed minutes that signaled policymakers are in no rush to cut interest rates, the PCE data could offer additional insight into the central bank’s policy trajectory.
Inflation came in cooler than anticipated in January, though markets still largely expect the Federal Reserve to hold its benchmark rate steady until June. However, the bond market appears ready to test that timeline, increasingly factoring in the possibility of a rate cut arriving sooner.
According to government data released Friday, the Consumer Price Index (CPI) rose 2.4% year over year in January, down from 2.7% in December and marking the lowest reading in eight months. Core CPI—which excludes volatile food and energy prices and is considered a clearer gauge of underlying inflation—also eased to 2.5% annually, its slowest pace since 2021.
While the slowdown in headline inflation is a welcome development, a deeper dive into the data suggests it may be premature to relax concerns about where prices are headed next. Persistent increases in tariff-sensitive goods remain one pressure point. Food prices are another, climbing 2.9% year over year—elevated by historical standards.
Energy costs rose even more sharply, and both homeowners’ and renters’ insurance premiums continued to increase. Moreover, inflation is still running above the Federal Reserve’s 2% target, reinforcing the likelihood that policymakers will proceed carefully.
Although it’s too soon to claim inflation has been fully tamed, the broader trend of moderating price growth strengthens the argument that the worst may be behind us. The Capital Spectator’s ensemble forecast has long projected continued disinflation in core CPI, a view that has so far aligned reasonably well with actual data. The model still anticipates further easing, with core CPI’s 12-month rate expected to edge down to around 2.4% in the upcoming February report.
Fed funds futures continue to indicate that the first rate cut won’t arrive until the June meeting. In contrast, the Treasury market appears to be probing the possibility of an earlier move. The policy-sensitive 2-year Treasury yield has fallen to about 3.45%—near its lowest level since 2022—and now sits below the Federal Reserve’s current target range of 3.50% to 3.75%, signaling that bond investors may be anticipating a faster shift in policy.
In short, Treasury market sentiment is tilting toward the idea that a rate cut could come sooner than previously anticipated. Other market-based indicators are reinforcing that view by assigning higher odds to continued disinflation.
The average of two Treasury-derived inflation gauges now projects five-year inflation in the low 2% range—the mildest reading in a month and not far from the Federal Reserve’s 2% objective. The surge in inflation expectations seen in January has since unwound, signaling that investors have grown less worried about upside inflation risks in recent weeks.
Markets are not infallible, but it would likely require a meaningful upside surprise in the economic data—pointing to renewed inflationary pressure—to overturn the prevailing disinflation narrative. For now, investors show little appetite for betting on a reflationary turn.