The US Dollar Index strengthened after April Retail Sales rose 0.5% month-over-month, surpassing market expectations. Meanwhile, Stephen Miran’s resignation from the Fed Board has paved the way for Kevin Warsh to take over as Federal Reserve Chair. At the same time, President Trump said US-China relations could become “better than ever,” while Chinese President Xi signaled a willingness to help ease tensions surrounding the Iran conflict.
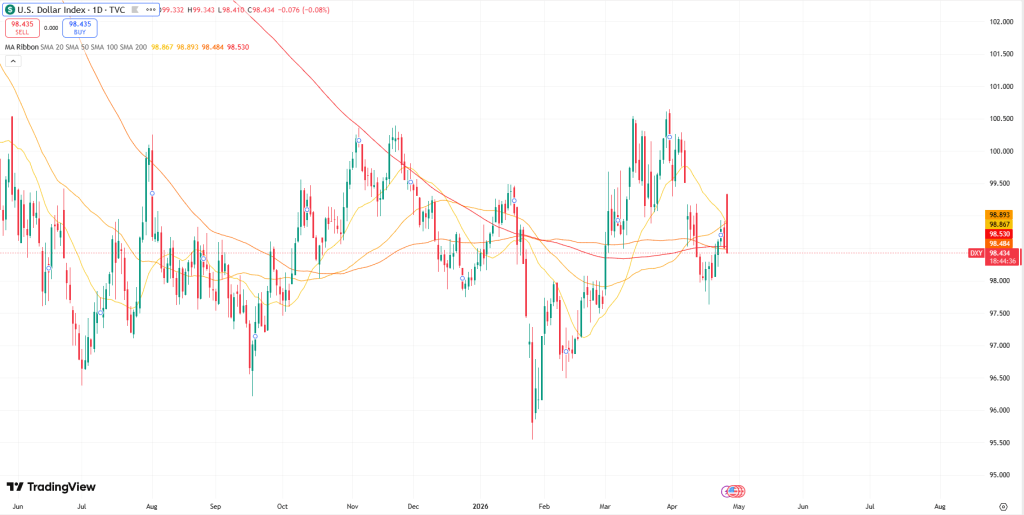
The US Dollar Index (DXY), which tracks the US Dollar (USD) against a basket of six major currencies, extended its rally for a fifth straight session, trading near 99.10 during Friday’s Asian session.
The Greenback strengthened after the release of solid US Retail Sales data, which showed a 0.5% month-over-month increase in April, highlighting the resilience of US consumer spending despite persistently high borrowing costs.
Support for the US Dollar also came from developments within the Federal Reserve, as Stephen Miran’s resignation from the Board of Governors has opened the door for Kevin Warsh to become the next Fed Chair.
At the same time, rising inflationary pressures tied to escalating Middle East tensions have strengthened expectations that the Fed could keep interest rates elevated for longer or potentially raise them further.
Meanwhile, US President Donald Trump said on Thursday that he hopes relations with China will become “stronger and better than ever before,” adding that President Xi had offered support in helping ease tensions surrounding the Iran conflict. The improving diplomatic tone boosted market risk sentiment, which typically limits demand for the US Dollar’s safe-haven appeal.
WTI edged lower after Iranian media reported that 30 vessels had successfully passed through the Strait of Hormuz. Still, crude remains on track for a weekly gain of more than 6% as stalled US-Iran negotiations continue to disrupt traffic through the key shipping route. Meanwhile, the White House noted that President Xi could increase purchases of US oil, potentially helping China reduce its dependence on the Strait of Hormuz.
West Texas Intermediate (WTI) crude remained under pressure on Friday during Asian trading, hovering near $97.60 per barrel after posting modest gains in the previous session. Despite the pullback, WTI is still set for a weekly increase of more than 6%, as diplomatic negotiations aimed at ending the conflict between the United States and Iran continue to stall, leaving the critical Strait of Hormuz effectively shut down.
Oil prices eased slightly after Iranian state media reported that 30 ships had successfully passed through the Hormuz Strait. Nevertheless, investor concerns remain elevated amid ongoing vessel seizures and attacks in the region.
The so-called “dual blockade” of the strategic waterway has become a major obstacle in peace discussions. US President Donald Trump recently described the ceasefire as being on “massive life support” after rejecting Tehran’s latest response to his proposed peace framework.
Meanwhile, a possible change in global energy trade dynamics emerged after a two-hour meeting in Beijing between Presidents Trump and Xi Jinping. According to the White House, Xi signaled interest in increasing Chinese purchases of US crude oil in an effort to diversify energy imports and reduce dependence on the unstable Strait of Hormuz route.
Still, the broader supply outlook remains concerning. The International Energy Agency (IEA) said oil and fuel shipments through the Strait fell by roughly 4 million barrels per day during March and April. The agency also cautioned that even if the conflict is resolved next month, global oil markets may continue facing significant supply shortages through October.
The market mood has shifted dramatically since late March. Back then, soaring oil prices, rising bond yields, and falling equities created a difficult environment for investors. Retail sentiment weakened, and Wall Street analysts faced growing pressure to reconsider their ambitious year-end targets for the S&P 500.
AI Reignites the Rally
Artificial intelligence once again became the market’s driving force. Semiconductor stocks rebounded sharply, with the VanEck Semiconductor ETF gaining more than 60% since its March 30 low. Volatility, as always, proved capable of moving markets in both directions.
Interestingly, the rally has not been led solely by the market’s usual AI giants. While NVIDIA has surpassed its October 2025 highs, some of the strongest gains have come from more traditional chipmakers and memory producers. Micron Technology is approaching a trillion-dollar valuation, while Intel has delivered enormous gains tied to government-backed support. Meanwhile, Asian leaders such as Samsung Electronics and SK Hynix have reinforced the global nature of the AI boom.
Bubble Concerns Return
AI dominates conversations at investor and industry conferences across sectors. Themes such as automation, scalability, and productivity improvements are everywhere, but concerns are growing as well. Investors are increasingly debating workforce reductions, weaker free cash flow in parts of the tech sector, and whether current valuations resemble the speculative excesses of the late 1990s tech bubble.
Portfolio concentration has also become a major concern. With semiconductor stocks accounting for much of the market’s outperformance, generating broad-based alpha has become increasingly difficult.
Leadership Changes Across Corporate America
Beyond macro trends, executive turnover has emerged as another defining theme. Tim Cook recently announced plans to hand leadership of Apple to John Ternus, signaling the beginning of a new era for the company. At Adobe, Shantanu Narayen also indicated plans to step away from the CEO role.
Leadership changes have been especially visible in retail, with major transitions taking place at Walmart, Target, and Lululemon. Even the investment world felt the shift, as Berkshire Hathaway’s annual meeting — often called “Woodstock for Capitalists” — took place without Warren Buffett for the first time.
The Fed Enters a New Chapter
Another major transition is happening at the Federal Reserve. Jerome Powell is set to hand leadership to Kevin Warsh, marking a potentially important turning point for U.S. monetary policy. Markets currently expect the Federal Open Market Committee to remain cautious, with interest-rate cuts largely priced out for now.
This environment has weighed heavily on financial stocks, making Financials the weakest-performing sector in the S&P 500 so far in 2026. As a result, banking conferences may carry a more subdued tone compared with the enthusiasm surrounding technology, industrials, and communication services events.
A Strong Earnings Season
Despite these uncertainties, corporate America has delivered one of its strongest earnings seasons in years. First-quarter profit growth has been impressive, and upward earnings revisions have expanded well beyond the “Magnificent Seven” and leading AI firms. Investors will now closely watch how CEOs and CIOs revise their long-term outlooks as stronger estimates are incorporated into future guidance.
Key Investor Conferences Into Mid-Year
The coming weeks feature a packed calendar of investor conferences spanning technology, healthcare, consumer, financials, industrials, energy, materials, and regional markets. Notable events include:
Apple Worldwide Developers Conference
Morningstar Investment Conference
BloombergNEF Summit Amsterdam
JP Morgan Global Technology, Media, and Communications Conference
Goldman Sachs Utilities & Clean Energy Conference
Together, these events are expected to shape market narratives around AI, monetary policy, executive leadership changes, earnings momentum, and sector rotation through the middle of the year.
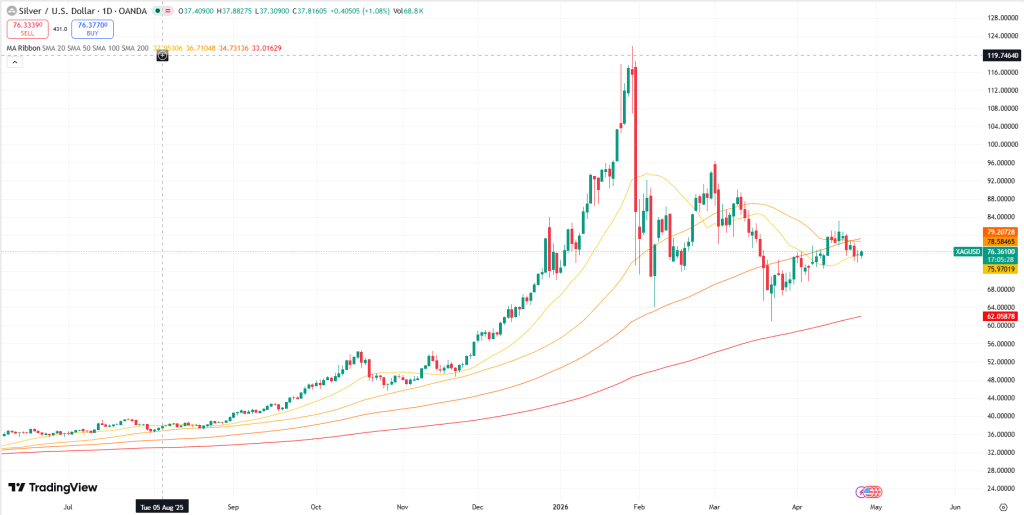
Silver surged above $85 this week after two separate single-session rallies of more than 6% — first on May 7 amid optimism surrounding Iran peace developments, and again on May 11 ahead of the anticipated Trump-Xi summit. The compression in the gold-silver ratio to 55.46, while gold itself remained relatively stable, makes the driver of the rally clear: markets were repricing industrial demand rather than reacting to fear. Around 60% of silver consumption comes from industrial use, much of it tied to supply chains dependent on US-China trade. Investors bid silver higher in anticipation that an extension of trade détente between Washington and Beijing would benefit industries with heavy silver demand.
Beneath the headline rally, however, a more important structural shift emerged on April 29 — one that could have greater implications for silver over the coming year than any individual price spike.
In the April 15 report, it was noted that March’s 3.3% CPI reading reinforced the stagflationary conditions this newsletter has been monitoring. April’s CPI, released on May 12, climbed further to 3.8% — the highest since May 2023 — confirming that the previous month’s inflation surge was not an isolated event. The Federal Reserve is now confronting a difficult combination of persistent inflation and a weakening labor market, and the events of April 29 highlighted how sharply divided policymakers have become over the appropriate response.
The Fed’s Deepest Division in 34 Years — and Why It Matters for Silver
On April 29, the Federal Open Market Committee voted 8-4 to keep interest rates unchanged at 3.50%–3.75%. The breakdown of votes was revealing: three governors argued rates should rise further, while one believed rates should already be cut. During what may be his final press conference as Fed Chair, Jerome Powell described policy as being “at the high end of neutral or perhaps mildly restrictive.” The statement reflected uncertainty rather than conviction — a central bank divided not only on policy direction, but on the broader outlook for the economy itself.
That same day, the Senate Banking Committee advanced Kevin Warsh’s nomination to replace Powell in a narrow 13-11 party-line vote, marking the first fully partisan committee vote for a Fed Chair nomination in modern history. Powell also announced he would remain on the Board of Governors after stepping down as Chair, positioning himself as a potential counterbalance to his successor. The combination of a fractured committee, a politicized leadership transition, and an outgoing Chair staying on the Board has little historical precedent.
A Federal Reserve unable to cut rates without risking higher inflation — yet unable to raise them without damaging growth — is effectively trapped. Historically, periods of monetary paralysis combined with political uncertainty at the central bank have often created favorable conditions for silver outperformance. The historical pattern is compelling enough to warrant close attention.
Three Periods of Fed Paralysis — and Three Major Silver Bull Runs
From 1978 through January 1980, the Federal Reserve repeatedly swung between tightening policy to combat inflation and easing to avoid recession, ultimately failing to fully address either problem. During that period, silver surged from $6.08 to $49.45 — a gain of more than 700% that cannot be explained solely by the Hunt Brothers’ speculative activity. Inflation exceeded 11% in 1974 and climbed above 14% by 1980, according to Federal Reserve data. The key dynamic, as documented by Fed historians, was that policymakers could not raise interest rates aggressively enough to contain inflation without severely damaging employment. Each delay further weakened confidence in the US dollar and pushed capital toward hard assets such as silver.
A similar pattern emerged between 2008 and 2011. The Fed maintained near-zero interest rates while inflation expectations increased and real yields fell into negative territory. Silver climbed from roughly $8.50 at the depths of the financial crisis to nearly $50 by April 2011, marking a gain of around 480%. Although the context differed — this time the Fed was attempting to stimulate a post-crisis economy rather than contain inflation — the underlying mechanism remained the same: a central bank unable to respond decisively contributed to dollar weakness and stronger silver prices.
The 2020–2022 period offered another example. Massive fiscal stimulus collided with a Federal Reserve that reacted slowly to accelerating inflation pressures. Silver rallied from approximately $12 in March 2020 to above $29 by August, more than doubling within five months. The Fed’s delayed tightening response allowed what was initially viewed as temporary inflation to become more persistent, while silver reflected both growing monetary instability and rising industrial demand.
Across all three episodes, the decisive factor was not simply the level of interest rates, but the Fed’s inability to commit firmly in either direction. During the stagflationary 1970s alone, silver gained roughly 1,546% over the decade as inflation averaged 7.4% annually and policymakers consistently lagged behind price pressures.
Today’s environment has not yet reached the extremes of 1979, but the structural similarities are increasingly difficult to ignore. Inflation remains elevated at 3.8%, wage growth has softened to 0.2% monthly, the US fiscal deficit has expanded to $2.065 trillion, and the Fed’s institutional independence is now openly being challenged.
The market reaction on May 8 underscored this shift. Despite a jobs report that exceeded expectations by 85%, the US dollar weakened rather than strengthened. Normally, stronger economic data supports a currency by attracting capital inflows. When a currency declines on positive economic news, markets may be signaling concern that the broader monetary framework is deteriorating faster than headline employment data suggests.
What This Could Mean for Silver
Even after climbing to $85, silver remains roughly 30% below its all-time high of $121.67 reached on January 29. While prices have risen sharply, the underlying structural backdrop remains largely intact. Metals Focus and the Silver Institute forecast a sixth consecutive annual silver market deficit of 46.3 million ounces. Meanwhile, COMEX registered inventories stand at 79.88 million ounces, with the coverage ratio holding at 13.4% — below the 15% stress threshold for a seventh straight month. The World Silver Survey 2026 also projects global silver supply to decline 2% in 2026 even as industrial demand remains above 650 million ounces annually.
The outcome of the Trump-Xi summit remains uncertain, and geopolitical tensions involving Iran are unresolved. After a nearly 13% rally in just two weeks, a short-term correction from the $85 level would not be unusual. Markets rarely move in straight lines.
However, the broader Federal Reserve dynamic described above appears less like a temporary trading catalyst and more like a structural shift in the monetary system — one that has historically created highly supportive conditions for silver. The April 29 FOMC split vote and the partisan confirmation battle surrounding Kevin Warsh did not immediately trigger a silver rally. Instead, they may have altered the long-term framework through which future market movements will be interpreted.
We are revisiting this chart due to its relevance to the current market rally. The upper panel displays the five-period Relative Strength Index (RSI), while the lower panel shows the daily chart of the SPDR S&P 500 ETF Trust (SPY). Historically, it has been viewed as a bullish signal when the RSI (5) climbs to +90 following a market low. With the indicator currently at 84.75, momentum remains strong and points to the potential for further gains. The green shaded areas highlight prior lows in the SPY, while the blue lines indicate previous instances when the RSI (5) reached the +90 level.
Over the past three years, and across the market’s last three major bottoms, the RSI (5) reached the +90 level at least twice during each recovery phase. In the current setup, the indicator has only recorded one such reading so far, though another could emerge in the near term. Historically, repeated RSI (5) readings above +90 have signaled that the rally may only be at the midpoint of a broader upward move.
The RSI (14) could climb toward the 80 level during the current advance, potentially paving the way for further upside. The indicator is currently at 76.85. As noted in yesterday’s commentary, the upper panel shows the 14-period RSI dating back to 2002, with blue dotted lines highlighting previous occasions when the RSI (14) reached 80. Historically, an RSI reading of 80 has reflected exceptionally strong market momentum and has never coincided with the final peak of a bull move.
Since 2002, the RSI (14) has touched 80 only eight times — roughly once every three years — making it a relatively rare event. Yesterday’s reading stood at 76.52, just 3.5 points below the 80 threshold. The significance of approaching 80 is that, in past cycles, it has often marked the midpoint rather than the end of a market advance. If the RSI does move up to 80 in the near term, it could provide a basis for projecting higher price targets for the ongoing rally. We will continue monitoring this chart closely going forward.
Yesterday, we highlighted the long-term outlook using the monthly RSI of the HUI/Gold ratio. A monthly RSI reading above 50 typically signals that HUI is in an uptrend, while a reading below 50 points to a downtrend. At present, the monthly RSI remains above 50, indicating that the longer-term trend for HUI — along with related indices such as GDX and XAU — remains bullish.
The chart above focuses on the intermediate-term outlook for GDX, which can weaken temporarily even within a broader long-term uptrend. The second panel from the bottom tracks the daily cumulative advance/decline line, while the panel above it shows the daily cumulative up/down volume, both for GDX. When both indicators trade above their mid Bollinger Bands, the intermediate-term trend is considered positive and is highlighted in green. Conversely, when both fall below their mid Bollinger Bands, the intermediate-term trend is viewed as negative and is shaded in pink.
Although the intermediate-term trend currently leans bearish — or more likely sideways in our view — we continue to focus on the longer-term picture, which remains constructive and bullish.
Gold prices traded sideways during Thursday’s Asian session as investors remained cautious ahead of the Trump–Xi summit in Beijing. US President Donald Trump arrived in China for talks with Xi Jinping, with trade tensions and the Iran conflict expected to dominate discussions. Meanwhile, US producer inflation surged at its fastest yearly pace in four years, lending support to the US Dollar.
Gold prices remained largely unchanged during Thursday’s Asian session as investors stayed cautious ahead of the summit between US President Donald Trump and Chinese President Xi Jinping in Beijing. Market attention is also turning to the upcoming US April Retail Sales data due later in the day.
According to Bloomberg, Trump arrived in Beijing on Wednesday for the first state visit to China by a US president in nine years. The meeting comes as Washington and Beijing attempt to stabilize relations amid ongoing geopolitical tensions linked to the Iran conflict.
The US and China are reportedly exploring a framework that would allow both countries to reduce tariffs on approximately $30 billion worth of goods without compromising national security concerns.
Meanwhile, US producer inflation rose at its fastest annual pace in four years, strengthening expectations that the Federal Reserve will keep interest rates elevated to contain persistent inflation pressures.
Data from the US Bureau of Labor Statistics released on Wednesday showed that the Producer Price Index (PPI) climbed 6.0% year-over-year in April, up from 4.3% in March and above market forecasts of 4.9%. On a monthly basis, PPI increased 1.4% after a 0.7% gain in March, significantly exceeding expectations of 0.5%.
Wholesale inflation reached its highest level since December 2022, largely driven by surging oil prices amid Middle East tensions. The stronger inflation data reinforced expectations that the Federal Reserve will maintain higher interest rates for longer, which could pressure Gold prices. Although Gold is often viewed as a safe-haven asset during geopolitical uncertainty, higher interest rates reduce its appeal because the metal does not offer yield.
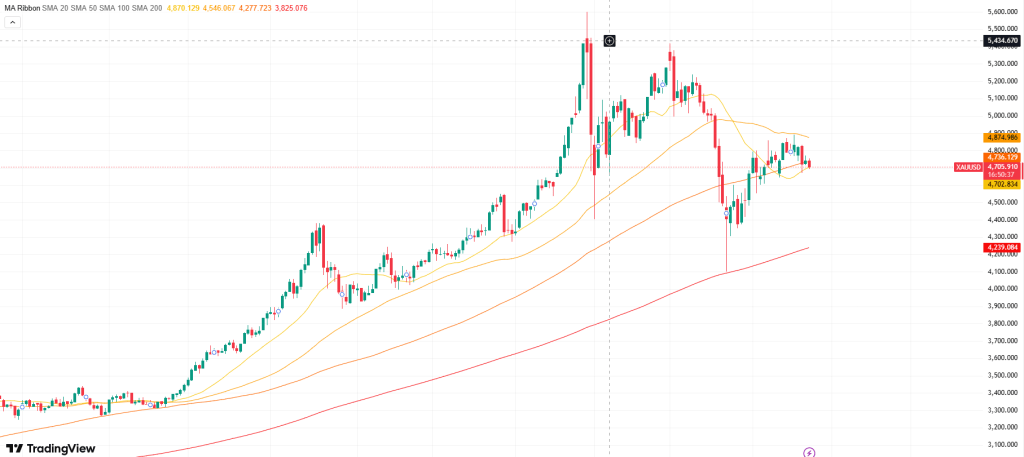
Gold Daily Chart
Technical Analysis
On the daily chart, XAU/USD is trading near $4,690 and continues to show a slightly bearish tone while remaining below the 100-day simple moving average (SMA). The metal is hovering just above the Bollinger Band midpoint, indicating short-term support within the current trading range. Meanwhile, the Relative Strength Index (RSI) stands at 49.65, reflecting neutral momentum and signaling consolidation rather than a strong directional move.
To the upside, the first resistance level is located near the 100-day SMA around $4,790. Additional gains could face resistance near the upper Bollinger Band at roughly $4,838 if bullish momentum strengthens further. On the downside, initial support is found around the Bollinger midpoint near $4,680, followed by a stronger support area close to the lower Bollinger Band around $4,518, where any deeper correction may begin to stabilize.
AUD/USD eases to near 0.7250 during Thursday’s Asian trading session.
US producer inflation unexpectedly posted its sharpest increase in four years.
Donald Trump is set to meet with Xi Jinping in China for a closely watched high-level discussion.
The AUD/USD pair declines toward 0.7250 during Thursday’s Asian session as stronger-than-expected US inflation figures lend support to the US Dollar against the Australian Dollar. Investors are also keeping a close eye on the summit between US President Donald Trump and Chinese President Xi Jinping in Beijing, along with the upcoming release of US April Retail Sales data later in the day.
US producer inflation recorded its strongest annual increase in four years in April, reinforcing demand for the Greenback. According to data published by the US Bureau of Labor Statistics on Wednesday, the Producer Price Index (PPI) climbed 6.0% year-over-year, up from 4.3% previously. On a monthly basis, PPI advanced 1.4% in April after rising 0.7% in March, significantly exceeding market expectations of 0.5%.
Market participants are now turning their attention to Thursday’s US Retail Sales report. Economists forecast retail sales growth of 0.5% month-over-month in April, following a 1.7% increase in March. Stronger-than-anticipated data could further strengthen the US Dollar and weigh on the AUD/USD pair.
Meanwhile, Bloomberg reported Wednesday that Trump arrived in Beijing for an official state visit, where he is expected to meet Xi Jinping to discuss trade relations and the conflict involving Iran. The trip marks the first state visit to China by a US president in nearly a decade. Any constructive outcomes from the US-China discussions may support the Australian Dollar, given Australia’s close trade ties with China.
A Bitcoin investor regained access to almost $400,000 worth of BTC after leveraging Claude AI to unlock a wallet that had remained inaccessible since 2015.
The recovery process involved AI-assisted analysis of legacy wallet files and mnemonic information to help identify the correct password.
Blockchain records later confirmed the transfer of the recovered funds, fueling broader conversations about the expanding role of artificial intelligence in cryptocurrency recovery efforts.
A Bitcoin (BTC) holder reportedly regained access to around 5 BTC — valued at nearly $400,000 — after recovering a forgotten wallet password, according to a viral post on X shared Wednesday.
The user, known on X as cprkrn, said the breakthrough came with the help of Claude AI after years of unsuccessful attempts to recover the wallet.
Crypto community reacts to AI-assisted wallet recovery
According to the post, the wallet became inaccessible after the owner changed the password and later forgot the updated credentials. Over the years, he allegedly tested countless password combinations, hired several recovery experts, and searched through old notes in an effort to regain access to the funds.
The turning point came when the user uploaded files from an old college computer into Claude AI. By combining the data with a recovered mnemonic seed phrase, he was ultimately able to decrypt the wallet and recover the Bitcoin.
“Tried ~3.5 trillion passwords + none worked, ended up matching an old seed phrase found in a college notebook with an old wallet file,” he wrote.
The user later publicly disclosed the forgotten password, triggering widespread reactions throughout the crypto community. In a follow-up post, he admitted he “would’ve been too dumb to figure it out” without the AI’s help.
Blockchain activity appears to support the claim. Wallet records linked to the address show BTC deposits dating back to April 2015, along with recent transactions consistent with a recovery and transfer of the funds to a new wallet, according to data from Blockchair.
The story quickly attracted attention from several notable figures in the crypto space, including Nic Carter, Laura Shin, and Jesse Pollak.
Importantly, the recovery depended on AI-assisted analysis of files and credentials already owned by the wallet holder, helping ease concerns about broader threats to Bitcoin wallet security.
The incident highlights an emerging use case for artificial intelligence in crypto recovery efforts. However, it does not suggest that AI can crack Bitcoin’s encryption, as the recovery relied on existing seed phrases and legacy wallet data rather than bypassing cryptographic protections.
The case also contrasts with other high-profile stories involving lost Bitcoin holdings, including the 2025 attempt by James Howells to recover a hard drive containing thousands of BTC from a landfill.
April’s CPI report delivered mixed signals. On Tuesday, the Labor Department reported that the Consumer Price Index (CPI) climbed 0.6% in April and 3.7% over the past year. Core CPI, which excludes food and energy, increased 0.4% for the month and 2.8% annually. Food prices rose 0.5%, while energy costs jumped 5.6%. Although core inflation came in slightly above expectations, Treasury yields remained relatively stable.
Shelter expenses, particularly owners’ equivalent rent, advanced 0.6% after easing in recent months. Analysts attribute much of this increase to disrupted data collection during the federal government shutdown, which may have distorted the figures.
Despite the uncertainty surrounding the report, inflation has continued to cool since the sharp rise seen in March, leading many investors to shift their attention back toward strong corporate earnings. Historically, equities have served as an effective hedge against inflation.
In periods of uncertainty, investors are often best served by focusing on fundamentally strong companies. Following an impressive earnings season, attention is now turning to upcoming results from NVIDIA and Micron Technology. Their performance could help drive first-quarter earnings growth for the S&P 500 above 20%. With demand continuing to rise for data centers and AI-related infrastructure, forecasts for the next quarter are becoming even more optimistic.
President Donald Trump is also set to begin a high-profile trip to China on Thursday, accompanied by senior officials including Treasury Secretary Scott Bessent and major business leaders such as Jensen Huang, Tim Cook, Elon Musk, and executives from ExxonMobil. The visit is widely viewed as an effort to strengthen commercial ties and reinforce U.S. economic influence amid shifting global power dynamics.
Many investors have compared today’s AI expansion to the dotcom boom of the late 1990s, when the infrastructure powering the internet was rapidly developed. The comparison makes sense given the enormous amount of capital now being invested to commercialize transformative, potentially world-changing technology. It also feels familiar because technology stocks fueled one of the strongest market rallies in history more than 25 years ago, and similar optimism is now surrounding AI, with investors aggressively raising valuations for companies expected to benefit from the trend.
The Strengths and Weaknesses of the Comparison
Although we don’t view the analogy as perfect — for several reasons discussed below — it is still useful to compare the trajectory of the tech-heavy Nasdaq-100 during the rise of AI with its performance during the early internet era, marked by the launch of Netscape, the first mainstream web browser.
As shown in the chart titled “Based on the Dotcom Era Comparison, the AI Bull Market Seems Fairly Reserved,” the recent climb in the Nasdaq-100 has been far more gradual than the explosive surge seen over a comparable four-year stretch in the late 1990s. From this perspective, the current AI-driven bull market — now approaching four years in duration — could still have significant upside ahead. Since the release of OpenAI’s ChatGPT, the Nasdaq-100 has gained more than 140%, whereas the index soared over 1,090% from Netscape’s debut to the peak of the dotcom bubble in March 2000.
We’re not suggesting history will repeat itself or that the Nasdaq-100 is destined to surge another 900% before collapsing. The broader point is that the market’s current trajectory may be more rational than many assume, and the present environment could resemble 1997 more than the euphoric conditions of late 1999 or early 2000.
Why This Cycle May Be Different
We recognize that “this time is different” can be dangerous language in investing. Still, every historical cycle has unique characteristics. While the AI boom shares some similarities with the dotcom era from a market perspective, the differences may be even more important.
Stronger market leaders.
Today’s dominant AI companies are largely financing the AI buildout through internal cash flow rather than speculative fundraising. Their business models are broader and more durable than the website-centric companies of the dotcom era, while their balance sheets are significantly healthier than those of the fiber-optic equipment firms that led the late 1990s rally. Certain AI niches may display speculative behavior, but those are not the primary drivers of the public markets.
More grounded valuations.
At the peak of the dotcom bubble in March 2000, the technology sector traded at roughly 58 times forward earnings estimates, versus about 25 times today. Back then, investors often focused on “clicks” and “eyeballs” instead of financial fundamentals. In contrast, today’s AI leaders are generally being valued based on revenue growth, earnings potential, and cash flow generation.
More mature IPOs.
Technology IPOs today tend to be larger, supported by established business models and meaningful revenue streams. Even companies that are not yet profitable often have a clearer and more believable path toward profitability than many internet startups did during the dotcom boom.
AI adoption is still in its early stages.
The current phase is centered on building AI infrastructure, while mass AI adoption has only just begun. During the late 1990s, speculative enthusiasm shifted heavily toward consumer internet companies that ultimately struggled to monetize their user bases, even after the infrastructure was built. Today, the eventual winners of the AI adoption phase remain uncertain. However, the financial strength of the infrastructure providers creates a stronger foundation for future AI-driven businesses to emerge.
Summary
There are undeniable parallels between the current AI-driven bull market and the dotcom boom of the late 1990s. Technology stocks are again leading the market, valuations are elevated, speculative pockets exist, and the underlying technological advances could reshape everyday life.
At the same time, there are key differences in the quality of market leadership, valuation discipline, the scale of speculation, and the stage of the technology cycle. Those distinctions suggest the current environment may be more sustainable than the final stages of the dotcom bubble.
Overall, the view remains constructive: this bull market may still have further room to run, with the technology sector continuing to lead. Industrials are also expected to benefit as AI infrastructure expands and adoption accelerates.
In the currency markets, Tuesdays have historically tended to favor government-issued fiat currencies over gold — though not consistently — and today happens to be Tuesday.
Fiat currencies may experience periods of strength — even lasting for years — but in the long run, they have consistently underperformed gold.
The weekly chart of gold versus fiat currencies continues to display a flag-like consolidation pattern, one that still appears to favor the bullish side.
The projected breakout target from this formation is estimated to be in the $8,000–$9,000 range.
Analysts across the gold market are debating both the origin of the flag pattern and the catalyst that could ignite the next major rally. The prevailing narrative from mainstream media and bank analysts has been that escalating US military involvement in Iran has pushed oil prices higher, increasing expectations that the Federal Reserve could raise interest rates. Because gold yields no interest while fiat currencies do, this dynamic has temporarily supported fiat over gold.
Some observers also argue that further downside pressure has come from the central banks of Iran and Russia, which may be selling gold reserves to offset declining fiat revenues and the financial strain caused by ongoing conflict.
Meanwhile, the Indian government has introduced additional taxes on bullion bank imports, encouraged citizens to reduce gold purchases, and is reportedly considering another increase in import duties.
Although the Federal Reserve has implemented some quantitative easing this year, the scale has been relatively limited.
It is worth noting that during 2010–2011, the Fed’s balance sheet expanded only modestly, yet gold prices surged sharply. In contrast, throughout 2024–2025, the Fed’s balance sheet actually contracted, but gold still dramatically outperformed fiat currencies. Why?
Commercial “QE” in the form of bank lending continues at an aggressive pace and far exceeds government-led quantitative easing. The expansion of private credit and money supply remains one of the key forces driving fiat currencies into a long-term decline against gold.
In the end, gold is an exceptionally complex form of money influenced by many different factors. Asian import duties, seasonal festivals, geopolitical conflicts, interest rates, and bank credit growth all play a role in determining gold’s fiat price.
A strong argument can be made that gold is not consistently predictable. Many analysts spend enormous effort trying to forecast movements that, in reality, may be inherently difficult — if not impossible — to predict accurately.
That uncertainty itself is one of the main reasons why millions of experienced gold investors across Asia and the West concentrate less on short-term forecasting and more on accumulating what they view as the “ultimate form of money” whenever prices weaken.
Maintaining focus on the broader macro picture is increasingly important as investors navigate persistent inflation, tariffs, the 2021–2025 geopolitical conflict cycle, elevated stock market valuations, debt ceiling concerns, and the ongoing shift in global economic power.
Although gold’s short-term direction is often unpredictable, key buying and selling zones can still be identified for both investors and traders. No one can know with certainty whether gold will reach a particular level, but if those zones are tested, market participants in the precious metals space are expected to accumulate aggressively. Historically, such phases have often led to dramatic outperformance by gold mining stocks relative to bullion itself.
I’m frequently asked, “When will mining stocks outperform gold?” My response is simple: “Whenever they enter a major buy zone. That’s where the strongest outperformance begins.”
Expecting long-term dominance from high-flying Nasdaq growth stocks over the Dow isn’t always realistic. However, when those stocks are purchased during pullbacks that bring the broader market into major support areas, they can generate remarkable gains within just a month or two — returns that the overall market might otherwise take years to produce.
The same principle applies to precious metals miners, often to an even greater degree. As a general rule, gold, silver, and copper mining stocks can deliver unleveraged fiat gains of 20% or more within one to two months after being bought at the right zones.
This year, the VanEck Gold Miners ETF has already experienced two strong periods of outperformance relative to gold bullion, and a third wave — potentially underway now — could produce even larger gains for gold-stock traders and investors.
Silver mining stock investors have also enjoyed exceptional gains this year, with the two major buy zones delivering rallies of 20% or more.
The rapid expansion of AI infrastructure and robotics is transforming copper into what some investors now call the “new oil.” The old slogan, “Drill, Baby, Drill!” may eventually evolve into, “Drill, Bonehead, Drill” — unless the drilling is for copper.
For copper stock investors, the key buy zones closely mirror those seen in gold and silver mining shares. The gold $4,400 support zone and the Dow 45,000 support zone were highlighted as attractive accumulation areas for miners before prices moved into those levels.
Historically, mining-stock ETFs and individual mining companies tend to stabilize around major support zones in both gold and the Dow. From those areas, they have often launched into powerful rallies.
The bottom line is straightforward: gold remains, in the eyes of many investors, the world’s premier form of money, while gold, silver, and copper mining stocks can become exceptional vehicles for outperformance — provided they are accumulated with patience, discipline, and careful timing.
The BTC/USD pair has delivered several strong and technically reliable price swings in recent years, creating attractive trading opportunities for both investors and short-term traders.
As a result, market participants continue watching Bitcoin closely, anticipating another significant move ahead. However, Bitcoin’s recent climb to a fresh multi-month high lacked the strength and momentum seen in equities and other risk-sensitive assets during the same period. Combined with fading bullish momentum, this has raised questions about whether Bitcoin may be losing some of its long-standing market appeal, either temporarily or for a longer period.
One key reason traders are paying close attention now is that Bitcoin appears to be approaching a critical technical turning point. A closer examination of the chart shows bulls and bears are currently in near equilibrium. When price action compresses into a tightening consolidation phase like this, it often precedes a breakout that can trigger a stronger directional move, either continuing the existing trend or reversing it.
Additional factors adding to Bitcoin’s importance at the moment include:
Uncertain price action in the US Dollar, suggesting Bitcoin’s own dynamics may drive the next move;
Today’s US CPI inflation report, which could surprise markets and spark volatility.
The clearest sign that Bitcoin may be nearing a decisive move is the formation of a narrowing triangle pattern on the chart. The converging trend lines connecting recent highs and lows indicate increasing indecision and the possibility of a breakout in either direction.
That said, the pattern is not perfectly symmetrical, which slightly weakens its reliability. The ascending support trend line is noticeably steeper than the descending resistance line, making the setup less balanced than a classic triangle formation.
Another technical aspect worth noting is that, despite some softness in the broader long-term uptrend, Bitcoin still maintains a meaningful bullish structure after recently reaching fresh multi-month highs. This could strengthen the argument for an upside breakout, particularly if the price manages to break above the recent swing highs and establish itself beyond the $82,500 level.
AUD/USD Technical Analysis
One of the clearest signs that AUD/USD may be approaching a pivotal move is the formation of a tightening triangle pattern on the chart. The converging trend lines connecting recent highs and lows highlight growing market indecision and suggest that a breakout in either direction could soon emerge.
While the pair has remained confined within this narrowing structure for several sessions, the setup is not a perfectly symmetrical triangle. The ascending support line is steeper than the descending resistance line, making the formation slightly uneven and therefore somewhat less reliable as a classic consolidation signal.
Another technical factor worth monitoring is the broader trend structure. Although the longer-term bullish momentum remains relatively modest, AUD/USD has still managed to post fresh multi-month highs recently. This underlying strength may increase the probability of an upside breakout, particularly if buyers succeed in pushing the pair above nearby swing highs and sustaining momentum beyond key resistance levels.
At the same time, traders should remain cautious ahead of major macroeconomic catalysts, especially US inflation data and broader US Dollar movements, as these could determine whether the pair breaks higher or reverses lower from the current consolidation zone.
Watch Closely for US CPI Inflation Data
The primary risk for USD-related currency pairs today is the release of the US Consumer Price Index (CPI) data, widely regarded as one of the most influential monthly indicators in the Forex market.
This inflation report has the potential to trigger sharp volatility, particularly if the figures differ significantly from market expectations. Current forecasts suggest annual inflation could rise from 3.3% to 3.7%. Any meaningful deviation from that estimate is likely to have a direct impact on the US Dollar’s direction.
For instance, if inflation prints at 3.9% or higher, traders may anticipate a more hawkish Federal Reserve stance, which could strengthen the US Dollar and push this currency pair sharply lower. On the other hand, a softer reading of 3.5% or below could weaken the Dollar and fuel a strong upside move in the pair.
During major economic releases like this, market sentiment can shift rapidly, often overpowering existing technical setups and making chart patterns temporarily less reliable.
Could the Triangle Pattern Lose Its Importance?
Today’s analysis is largely based on the expectation that a breakout from the current triangle formation could trigger a decisive — or at least tradable — move in Bitcoin. However, there are several reasons why this pattern may ultimately prove less significant than expected.
First, the broader market trend still leans bullish. For traders who prefer to follow the prevailing trend, or at least avoid trading aggressively against it, a downside break from the triangle could turn into a false breakout that quickly reverses higher.
In addition, the triangle itself is not an especially convincing formation. As noted earlier, the structure lacks the balance and symmetry typically associated with stronger consolidation patterns, which reduces confidence in its predictive value.
There are also major macroeconomic and geopolitical risks that could easily overpower technical signals. Today’s US CPI inflation data has the potential to create sharp volatility across financial markets, while any unexpected developments involving tensions between the United States and Iran could rapidly shift investor sentiment.
In situations like these, strong fundamental catalysts can drive price action straight through technical levels and chart patterns, making formations such as the current triangle temporarily irrelevant.
Outlook on BTC/USD
The key focus for Bitcoin today is likely to be the direction of the eventual breakout from the tightening triangle formation. The first trend line tested could become the market’s main decision point for the session.
If price reacts positively from the ascending support trend line with a strong bullish rebound, it may present an attractive long opportunity — particularly if the nearby support level around $80,558 is also firmly defended. Such a move would suggest buyers are still in control despite recent consolidation.
On the other hand, a rejection from the upper resistance trend line could create a favorable short setup, especially if the psychologically important $82,000 level is rejected at the same time. That combination would reinforce the possibility that bullish momentum is fading near resistance.
As price action remains compressed within the triangle, traders will likely watch closely for confirmation signals before committing to a directional move.
Today’s BTC/USD Trading Signals
Risk per trade: 0.50%
Trade validity: Positions should be opened before 5:00 PM Tokyo time on Wednesday.
Long Trade Setups
Consider long positions after a bullish price action reversal on the H1 chart following a test of the following support levels:
$80,558
$79,440
$77,858
For risk management:
Place the stop loss $100 below the most recent swing low.
Once the trade gains $100 in profit, move the stop loss to breakeven.
Secure partial profits by closing 50% of the position after the first $100 gain, while allowing the remaining portion to continue running.
Short Trade Setup
Consider short positions after a bearish rejection or reversal signal on the H1 timeframe following a test of:
$81,343
Trade management guidelines:
Set the stop loss $100 above the latest swing high.
Move the stop loss to breakeven once the trade reaches $100 profit.
Take profit on half the position after a $100 favorable move and leave the rest open for a larger potential move.
Identifying Price Action Reversals
Common reversal confirmations on the hourly chart include:
Pin bars
Doji candles
Outside candles
Engulfing candles with a stronger close
These candlestick formations can help traders confirm whether support or resistance levels are being respected before entering a position.
Key Events to Watch
There are no major Bitcoin-specific events scheduled today. However, broader market volatility could increase due to important US economic developments, including:
US CPI inflation data release at 1:30 PM London time
Later remarks and developments involving the Federal Reserve Chair
These events could significantly influence US Dollar strength and indirectly impact Bitcoin price action.
Silver gains support from its critical use in solar panels, electronics, and automotive manufacturing.
However, the precious metal could face pressure as escalating geopolitical tensions and possible disruptions in the Strait of Hormuz push oil prices and inflation higher.
Meanwhile, stronger-than-expected US inflation data has reinforced expectations that the Federal Reserve may keep interest rates elevated for longer to contain persistent inflationary pressures.
Silver prices (XAG/USD) extended their rally for a sixth consecutive session, trading near $86.80 per troy ounce during Wednesday’s Asian session. Growing industrial demand continues to support the metal, as Silver remains widely used in the manufacturing of solar panels, electronics, and automotive components.
Despite the strong upward momentum, geopolitical tensions could pose a major challenge to Silver’s advance. Concerns over a prolonged closure of the Strait of Hormuz may keep oil prices elevated, intensifying inflation pressures worldwide. This environment could encourage central banks to maintain higher interest rates for longer, reducing the attractiveness of non-yielding assets such as Silver as investors shift toward yield-bearing investments.
Tensions in the Middle East remain heightened after comments from US President Donald Trump, who stated that Iran is “under control” while warning that the situation could end either with a new agreement or complete “decimation.” Meanwhile, Iranian Deputy Foreign Minister Kazem Gharibabadi reiterated that any credible peace deal must involve compensation payments, recognition of Iran’s sovereignty over the Strait of Hormuz, and the removal of all US sanctions.
On the economic front, inflation concerns intensified after the US Bureau of Labor Statistics released stronger-than-expected April Consumer Price Index (CPI) data on Tuesday. Headline CPI rose 0.6% month-over-month, lifting annual inflation to 3.8%, the highest reading since May 2023. Core CPI, which excludes food and energy prices, also climbed 2.8% year-over-year. The data strengthened expectations that the Federal Reserve will likely keep interest rates elevated for an extended period in an effort to curb persistent inflation.
The US Dollar Index remained steady as President Trump’s remarks on the Middle East fueled geopolitical uncertainty and market volatility. Hotter-than-expected CPI figures reinforced expectations that the Federal Reserve may keep interest rates elevated for longer to contain persistent inflation pressures. Investors are now turning their attention to upcoming producer inflation data for further clues on how the conflict with Iran is affecting the broader US economy.
The US Dollar Index (DXY), which tracks the Greenback against a basket of six major currencies, held steady near 98.30 during Wednesday’s Asian session after posting gains over the previous two days. The US Dollar continued to draw support from escalating geopolitical tensions in the Middle East following recent remarks by President Donald Trump. Although Trump stated that Iran was “under control,” he warned that the situation would ultimately end either with a new agreement or with complete “decimation.” Meanwhile, Iranian Deputy Foreign Minister Kazem Gharibabadi reiterated that any acceptable peace deal must involve reparations, recognition of Iran’s sovereignty over the Strait of Hormuz, and the full removal of US sanctions.
Additional support for the Greenback came from stronger-than-expected US inflation data, which reinforced hawkish expectations for the Federal Reserve. Investors increasingly believe the Fed will keep interest rates elevated for longer in an effort to contain persistent inflationary pressures. According to data released by the Bureau of Labor Statistics on Tuesday, the US Consumer Price Index (CPI) rose 0.6% month-over-month in April, lifting annual inflation to 3.8%, the highest reading since May 2023. Core CPI, which excludes food and energy prices, also increased, posting a 2.8% annual gain.
With expectations for a Fed rate cut this year largely fading, markets are now pricing in the possibility of a quarter-point rate hike by December. Attention is now turning to upcoming producer inflation figures, which could offer further insight into how the ongoing conflict involving Iran is affecting the broader US economy.
Bitcoin’s recovery pauses while the $80,000 support level remains intact, as optimism surrounding a final US-Iran peace deal begins to fade.
Market participants are also staying cautious ahead of key US economic data releases, particularly Tuesday’s CPI report.
Meanwhile, the US Senate Banking Committee is scheduled to conduct its markup hearing on the Clarity Act this Thursday.
On the supply side, roughly $159 million worth of token unlocks — led by Solana’s $40 million and Pump.fun’s $21 million — may add further volatility to the crypto market.
The cryptocurrency market started the week on a subdued note, with Bitcoin (BTC) finding it difficult to maintain support above $80,000 as optimism over a final US-Iran peace agreement weakened due to growing complications in the negotiations.
Altcoins also showed signs of fading momentum, with Ethereum (ETH) retreating from its weekly peak of $2,375, while Ripple (XRP) revisited support around $1.45 after facing rejection near the $1.50 resistance zone.
Trump rejects Iran’s peace proposal
US President Donald Trump has rejected Iran’s latest proposal to end the conflict, calling it “totally unacceptable.” The proposal, reportedly delivered to the White House through Pakistani mediators, was presented as a counteroffer to a one-page US memorandum outlining a phased framework for ending the war — a conflict that has severely disrupted the Strait of Hormuz, one of the world’s most strategically important shipping routes.
Under the proposal, Iran demanded the complete removal of US sanctions, an immediate end to the military blockade around the Strait, and concessions related to its nuclear program, including a shorter moratorium on uranium enrichment. Tehran also sought sovereignty rights over the Strait of Hormuz, including authority to coordinate maritime traffic passing through the route.
Trump has continued to maintain a firm stance on Iran’s nuclear ambitions, insisting that the country’s nuclear program must be fully dismantled.
Meanwhile, global markets remain tense as hopes for a lasting peace agreement continue to weaken amid the fragile diplomatic environment. Oil prices also remain elevated, with West Texas Intermediate (WTI) crude holding near the $95.00 level.
Caution ahead of US macroeconomic data
The US Bureau of Labor Statistics (BLS) is scheduled to release the Consumer Price Index (CPI) report on Tuesday. The CPI is the US’s main inflation gauge, tracking changes in the average prices consumers pay for goods and services such as food, housing, and transportation over time.
For investors, CPI data plays a critical role in shaping expectations for interest rates. A stronger-than-expected inflation reading could further reduce hopes for Federal Reserve rate cuts in 2026, while softer inflation data may strengthen the bullish outlook for risk assets like Bitcoin, as markets anticipate a more accommodative monetary policy stance from the Federal Reserve.
March inflation data came in above expectations, with headline CPI rising to 3.3% year-over-year, compared to 2.4% in February. Core CPI — which excludes volatile food and energy prices — increased to 2.6% in March from 2.5% previously.
Markets are now forecasting April CPI to climb further to 3.7% YoY, while Core CPI is expected to edge up to 2.7%.
Investors will also closely monitor Wednesday’s Producer Price Index (PPI) release, which measures inflation from the producer side by tracking changes in the prices businesses receive for goods and services.
Clarity Act advances to US Senate markup hearing
The Senate Banking Committee is expected to hold its long-awaited markup hearing for the Digital Asset Market Clarity Act of 2025 — commonly known as the Clarity Act — on Thursday.
The legislation had remained largely stalled after Coinbase CEO Brian Armstrong announced in January that the exchange was withdrawing its support over concerns related to stablecoin yield provisions and other aspects of the bill.
However, momentum appears to have returned following the release of a compromise draft by Senators Thom Tillis and Angela Alsobrooks. The revised text reportedly proposes banning crypto firms from offering yield on static stablecoin reserve holdings, while still permitting rewards tied to stablecoin assets actively used in certain activities. The compromise helped move the legislation forward to the next stage of the process.
At the same time, banking industry groups indicated that several concerns with the compromise proposal remain unresolved. According to a report from CoinDesk, industry representatives said they would continue providing feedback in an effort to reach a framework that supports digital asset innovation while also strengthening consumer protections.
Large token unlocks could fuel market volatility
Several cryptocurrency projects are set to unlock additional token supply into the market this week, potentially increasing short-term volatility. The schedule began on Monday with a notable $5 million unlock from Based.
According to data from DefiLlama, Tuesday’s unlocks are expected to be significantly larger, led by Solana with roughly $40 million in tokens entering circulation, followed by Pump.fun at around $21 million and Aptos with nearly $13 million.
Additional sizable unlocks later in the week include approximately $9 million from Sei on Thursday, around $18 million from Connex on Friday, and roughly $13 million from Arbitrum on Saturday.
Token unlocks often increase selling pressure as newly released assets become available for trading, which can lead to heightened price swings, particularly during periods of cautious market sentiment.
Technical outlook: Bitcoin rally loses momentum as support remains intact
Bitcoin is trading around $81,246, maintaining a cautious tone as price action remains below the 50-week and 100-week Exponential Moving Averages (EMAs), as well as the weekly SuperTrend indicator.
Despite the near-term weakness, the 200-week EMA near $68,125 continues to support the broader bullish structure. Momentum indicators also point to consolidation rather than a sharp bearish reversal.
The Moving Average Convergence Divergence (MACD) histogram remains in positive territory, signaling that bullish momentum has not completely faded. Meanwhile, the Relative Strength Index (RSI) on the daily timeframe is hovering near the neutral 50 level, indicating that momentum is stabilizing instead of showing a decisive move higher at this stage.
On the upside, the first major resistance level appears near the 100-week EMA at $82,381, while the 50-week EMA around $85,634 strengthens a heavy supply zone overhead. A stronger bullish recovery would likely require a weekly close above the SuperTrend resistance at $91,753.
On the downside, the 200-week EMA near $68,125 remains the key structural support level for Bitcoin’s broader trend. A sustained move below this area would significantly weaken the medium-term technical outlook.
WTI prices climb toward $95.70 during Tuesday’s early Asian trading session, supported by rising US-Iran tensions and growing concerns over potential disruptions in the Strait of Hormuz. Meanwhile, markets are also watching as Trump is expected to arrive in Beijing later this week.
West Texas Intermediate (WTI), the US crude oil benchmark, is trading near $95.70 during Tuesday’s early Asian session, extending gains as renewed geopolitical tensions in the Middle East support oil prices.
According to CNN, US President Donald Trump has become increasingly dissatisfied with Iran’s approach to negotiations aimed at ending the conflict. Some of Trump’s advisers reportedly believe he is now more open to restarting major military operations than at any point in recent weeks.
At the same time, Iranian Parliament Speaker Mohammad Bagher Ghalibaf stated that Iran’s military is fully prepared to respond to any future attacks. The remarks followed Trump’s rejection of Tehran’s latest peace proposal over the weekend, describing it as “simply unacceptable.” Concerns over a potential prolonged disruption of the Strait of Hormuz — a key global energy shipping corridor — continue to provide support for WTI prices.
Meanwhile, Trump and Chinese President Xi Jinping are expected to meet on Thursday and Friday during Trump’s first visit to China since 2017. The two leaders are set to hold their first in-person talks in more than six months as both sides attempt to ease tensions linked to trade disputes, the US and Israeli conflict with Iran, and broader geopolitical disagreements.
Market participants are also awaiting the release of the American Petroleum Institute (API) crude oil inventory report later on Tuesday. A larger-than-expected decline in inventories could signal stronger demand and further support WTI prices, while a surprise increase in stockpiles may point to weaker demand or oversupply, potentially pressuring crude prices.
USD/CAD advances as escalating Middle East tensions strengthen the US Dollar’s appeal as a safe-haven currency.
President Trump has expressed growing frustration over the lack of progress in peace negotiations, raising concerns about a possible change in the region’s conflict approach.
Meanwhile, higher oil prices provide support for the Canadian Dollar, though they also create challenges for the Bank of Canada by adding to ongoing inflation pressures.
USD/CAD edges higher after closing nearly unchanged in the previous session, hovering around 1.3690 during Tuesday’s Asian trading hours. The pair is regaining upward momentum as the US Dollar strengthens amid escalating geopolitical tensions.
Investor sentiment has shifted toward safe-haven assets following reports of worsening diplomatic conditions in the Middle East. Markets are increasingly pricing in the risk of renewed large-scale military conflict, a development that typically drives demand for the Greenback against more risk-sensitive currencies.
A CNN report published Monday stated that US President Donald Trump has become increasingly dissatisfied with the lack of progress in negotiations aimed at ending regional hostilities. Sources close to the administration indicated that Washington is now giving more serious consideration to renewed military operations. Adding to market concerns, Iranian Parliament Speaker Mohammad Bagher Ghalibaf said, according to Reuters, that Iran’s armed forces are fully prepared to respond to any future attacks, placing the already fragile ceasefire under additional pressure.
Despite broad USD strength, the Canadian Dollar continues to receive support from rising oil prices. As Canada is the largest crude supplier to the United States, the CAD tends to benefit from gains in energy markets. Concerns that escalating regional tensions could disrupt global supply flows and reduce Middle Eastern exports have pushed crude prices sharply higher, helping cap further upside in USD/CAD.
At the same time, surging energy prices are reviving inflation concerns in Canada. March inflation data already reflected the impact of volatile oil prices, with annual CPI rising to 2.4%, the highest level seen in a year. While elevated crude prices generally strengthen the CAD, they also complicate the Bank of Canada’s policy outlook. Although the BoC recently kept interest rates unchanged and suggested that energy-related inflation may remain temporary, a prolonged geopolitical conflict could eventually force policymakers to reconsider their current stance.
Gold advocates often argue that an expanding supply of dollars automatically weakens the currency: more money in circulation means each dollar buys less, prices rise, and gold serves as the ultimate hedge against this erosion of purchasing power. From this perspective, growth in the money supply is treated as inherently inflationary.
However, this view is overly simplistic for two main reasons. First, it strips away important context around how and why money supply expands. Second, it ignores a crucial driver of inflation that is just as important as supply itself: the velocity of money.
A recent commentary by Michael Oliver of Momentum Structural Analysis prompted a closer look at this debate. He points out that M2 has increased by roughly 45% since 2020, implying a steady erosion in the real value of cash “year by bloody year,” while reinforcing gold’s role as a preferred alternative store of value. While this is a persuasive narrative, the link between money supply expansion and inflation is not as direct or mechanical as often implied, and requires a more nuanced interpretation of M2 dynamics.
It is also worth noting that Oliver’s bullish stance on gold is not based solely on M2 growth. He also cites several additional factors, including the long-term debasement of fiat currencies by central banks, supportive technical structures, declining confidence in central bank credibility, geopolitical tensions increasing safe-haven demand, and persistent fiscal deficits that necessitate continued monetary accommodation.
Context Matters
Simply pointing to M2 growth in isolation is not meaningful without proper context. To clarify this point, we can refer back to a recent Commentary.
If inflation is the key reason for buying or selling gold, then what truly matters is how money supply growth compares to economic growth. On that basis, the picture changes significantly. During 2020 and 2021, M2 expanded far more rapidly than the real economy. However, in the years since, money supply growth has slowed considerably. Over the broader six-year period referenced by Oliver, GDP growth has actually modestly outpaced M2 expansion.
Assuming, for simplicity, that monetary velocity remains stable (a topic we address separately below), the implication is clear: M2 growth was strongly inflationary during 2020–2021, but in the current environment it is, at best, neutral—and may even be disinflationary or deflationary.
The intuition is straightforward. If an economy produces 10% more goods and services, but the money supply only expands by 5%, there is relatively more supply of goods than purchasing power. That imbalance forces either price reductions or rising unsold inventories. In both cases, the pressure on prices is downward rather than upward.
In that sense, if gold is being held primarily as a hedge against inflation, then relying on M2 growth alone may have been a reasonable argument during the pandemic-era monetary surge. But under current conditions, that same rationale is far less convincing without additional supporting factors.
Monetary Velocity Also Matters
Consider a simple thought experiment.
What if the government secretly printed an enormous amount of money, locked it away in a vault, and permanently lost the key? Would that sudden increase in the money supply drive prices of goods and services higher?
The answer is no—it would have virtually no impact.
Now imagine a different scenario: rumors of that hidden stockpile begin to circulate. Even though the money still isn’t being spent, expectations shift. People start to anticipate future spending, and that change in behavior alone could begin to influence prices.
The distinction here is important. Inflation is not determined solely by how much money exists “on paper.” It also depends on how actively that money is used—how quickly it circulates through the economy. This is what economists refer to as monetary velocity.
In other words, price levels are shaped not just by the supply of money, but by the willingness and ability of households, businesses, and institutions to spend it. When velocity is high, money changes hands quickly and exerts more upward pressure on prices. When velocity is low, even a large money supply may have limited inflationary impact.
This is why analyzing inflation through M2 alone can be misleading: without considering velocity, the picture is incomplete.
What Is Monetary Velocity
According to the Federal Reserve Bank of St. Louis, the velocity of money refers to the rate at which a single unit of currency is used to purchase domestically produced goods and services over a given period of time. In simpler terms, it measures how often each dollar is spent within the economy.
Put differently, it reflects how many times one dollar changes hands to facilitate transactions during a specific timeframe. When monetary velocity rises, it indicates that more economic transactions are taking place between individuals and businesses, signaling a more active flow of spending.
Velocity is therefore influenced by both economic activity and the money supply. A shrinking money supply does not necessarily imply lower prices if economic activity is strong and money is circulating rapidly—velocity can rise and still exert upward pressure on prices. Conversely, even if the money supply expands significantly, inflation may remain muted if that money is not actively being spent, meaning demand for goods and services stays weak and price pressures remain limited.
In short, monetary velocity helps explain why the relationship between money supply and inflation is not mechanical: it is the interaction between how much money exists and how quickly it is used that ultimately matters for price dynamics.
What Impacts Velocity?
Monetary velocity doesn’t move randomly—it reflects how people, businesses, and financial systems behave. A range of economic and psychological factors can either accelerate or slow the rate at which money changes hands.
Factors typically associated with higher velocity
These conditions encourage spending, investing, and faster circulation of money:
Lower interest rates — reduce the incentive to hold cash, encouraging spending and investment instead
Strong consumer and business confidence — optimism about the future leads to higher spending activity
Rising inflation expectations — if people expect prices to increase, they tend to spend sooner rather than later
Easy credit conditions — abundant lending increases effective purchasing power and transaction volume
Technological innovation — new products, services, and platforms create additional channels for spending
Income and wage growth — higher earnings support more frequent and larger transactions
Economic expansion — growing output naturally leads to more economic exchanges per unit of money
Factors typically associated with lower velocity
These conditions encourage saving, caution, or reduced spending:
Recessions or economic uncertainty — fear leads households and firms to defer spending
Expectations of falling prices (deflation) — consumers delay purchases in anticipation of cheaper goods later
Debt reduction (deleveraging) — paying down loans removes credit-driven money from active circulation
Aging populations — older demographics generally spend less and save more
Financial or banking stress — tighter credit conditions reduce lending and the “multiplier” effect of money
The key takeaway
Velocity is ultimately a behavioral and structural variable. It reflects confidence, incentives, credit conditions, and demographics—not just monetary policy or money supply figures. This is why two economies with similar M2 growth can experience very different inflation outcomes depending on how actively money is being used.
M2 and Core CPI
With a clearer understanding of monetary velocity, we can re-examine the common claim among gold advocates that M2 growth and inflation move closely together.
To test this more rigorously, a regression analysis is conducted using quarterly data on M2 and monetary velocity against Core CPI since 2010.
In this context, Core CPI is used instead of headline CPI because it excludes volatile food and energy components. These categories are often influenced by short-term shocks such as geopolitical events or weather conditions, which can obscure underlying inflation trends. By focusing on Core CPI, the analysis aims to capture a more stable and statistically meaningful relationship.
The first step of the analysis examines how M2 alone relates to Core CPI, allowing us to quantify the direct association between money supply growth and underlying inflation over time.
The results suggest that M2 growth, in isolation, has a very weak and statistically insignificant relationship with Core CPI. The R-squared value of 5.13% implies that changes in M2 explain only a small fraction of the variation in Core CPI over the sample period. In practical terms, most inflation dynamics are driven by other factors outside the money supply variable alone.
The negative t-statistic (-1.771) further indicates that the estimated relationship is not only weak but also inversely signed in this model specification—meaning that, within this dataset, higher M2 growth is associated with slightly lower Core CPI. However, this relationship is not statistically robust and should not be interpreted as causal.
Using the regression equation to forecast Core CPI from M2 alone therefore produces unreliable results. As expected from the low explanatory power of the model, the output has little predictive value and is effectively not useful for practical forecasting.
Overall, the takeaway is that M2 by itself is a poor standalone indicator of inflation dynamics, reinforcing the importance of incorporating additional variables—such as velocity, credit conditions, and broader economic activity—when analyzing price pressures.
M2, Velocity, and CPI
Next, we extend the analysis by incorporating monetary velocity into the multiple regression framework alongside M2.
The R-squared value indicates that the relationship becomes substantially stronger when both M2 and monetary velocity are included in the model, with the combined variables explaining more than half of the variation in Core CPI.
In addition, the F-statistic’s near-zero p-value suggests that the overall model is highly statistically significant, meaning there is a very low probability that these results are due to chance.
Finally, when the model’s implied Core CPI is plotted against actual Core CPI, the comparison shows that the combination of money supply and velocity tracks inflation much more closely than M2 alone. This supports the view that inflation dynamics are better understood as a function of both liquidity (M2) and its rate of circulation (velocity), rather than money supply in isolation.
Summary
There are valid reasons to buy and hold gold, but for short-term traders, it is important to understand the narratives that often drive gold price action.
The idea that rising money supply alone explains inflation—and therefore supports higher gold prices—can be misleading. As discussed, this relationship needs to be placed in proper context relative to economic growth. Equally important is not just the quantity of money in circulation, but the rate at which it circulates through the economy, or monetary velocity.
Many widely accepted macro narratives appear intuitive at first glance, but lose explanatory power once examined more closely. It is in these gaps between narrative and reality that investors can better understand the true drivers of asset prices—and reduce the risk of being caught offside when simplified stories fail to hold up in practice.
Most traders assume price moves are driven by news, indicators, or chart patterns.
But after spending enough time watching the market—especially in futures like NQ, ES, or Gold—you start to see a different driver at work:
Price moves because of liquidity.
Understanding liquidity isn’t just useful; it can be one of the strongest edges in trading. It helps explain why stops are often taken out before the real move begins, and why some breakouts fail while others accelerate aggressively.
Let’s break down two key concepts: liquidity sweeps and liquidity runs.
What Is Liquidity?
Before looking at specific setups, it’s important to understand this basic idea:
The market requires orders in order to move.
Large participants can’t simply enter huge positions at will—they need counterparties. They need liquidity on the other side of their trades.
So where does liquidity exist?
Above prior highs
Below prior lows
Around clear support and resistance levels
Near stop-loss clusters and breakout entry zones
These are exactly the areas where retail traders tend to place their orders. And these are also the zones that larger institutional players often target.
Liquidity Sweep: The Market Trap
A liquidity sweep occurs when price deliberately moves into areas where stop orders are concentrated, triggers them, and then sharply reverses.
This is often referred to as a “stop hunt.”
What it typically looks like:
Price pushes beyond a recent high or drops below a recent low Breakout traders get activated and stops are triggered Price quickly reverses in the opposite direction
Why it happens:
Large participants use this burst of liquidity to fill their own orders. Instead of chasing breakouts, they take advantage of the liquidity created by those breakout attempts.
Example (NQ or ES):
Price breaks above the morning high Retail traders enter long positions Shorts are stopped out as price moves higher Then price reverses sharply downward
That move above the high is the liquidity sweep.
How traders approach it:
Wait for price to take out a key level Watch for rejection signals (wicks, momentum shift) Enter in the opposite direction Target liquidity on the other side of the range
It’s essentially a reversal setup built around mean reversion after a liquidity grab.
Liquidity Run: The True Price Move
A liquidity run is the other side of the move.
Instead of reversing after grabbing liquidity, price continues in the same direction.
This is where strong trending moves form.
What it looks like:
Price breaks through a key level
Absorbs available liquidity
Then accelerates further in the same direction
Why it happens:
Once liquidity has been taken, there are fewer opposing orders left.
Stops are cleared
Resistance is weakened or gone
Momentum takes over
Example:
Price breaks out of a consolidation zone
Sweeps stops and triggers breakout entries
Then continues pushing in the same direction for an extended move
That’s a liquidity run.
How traders approach it:
Enter on breakout or retest setups
Confirm with momentum (volume, speed, market structure)
Trail stops as price expands
This is essentially a momentum/trend strategy.
The key is knowing which environment you’re in.
How to distinguish in real time:
Speed & follow-through
Slow rejection after breakout → likely a sweep
Fast continuation → likely a run
Market structure
Break and immediate failure → sweep
Break and hold above level → run
Time of day
Sweeps often occur at session highs/lows
Runs often develop during active sessions like London or New York opens
Market context
Choppy/range conditions → more sweeps
Trending conditions → more runs
Key idea:
Liquidity drives price action. Sweeps and runs are just different outcomes of the same process—price seeking orders.
Understanding this helps you stop reacting blindly and start reading intent.
In prop trading terms, that difference often separates inconsistency from passing evaluations.
Key macro drivers for the coming week include U.S. inflation figures, retail sales data, geopolitical developments between the U.S. and Iran, and the anticipated Trump–Xi summit.
In this context, Applied Materials is highlighted as a buy, supported by its strong exposure to semiconductor equipment demand, which continues to benefit from accelerating AI infrastructure investment.
Conversely, Alibaba is flagged as a sell, with its upcoming earnings expected to underscore persistent headwinds from intense competition and a challenging regulatory environment.
U.S. equities finished the week on a strong note Friday, with both the S&P 500 and Nasdaq setting fresh record highs. Gains were led by AI-linked semiconductor names such as Micron, Sandisk, and Intel, while upbeat labor data reinforced expectations of continued resilience in the U.S. job market.
All three major U.S. equity benchmarks ended the week higher. The Nasdaq Composite surged 4.5%, while the S&P 500 climbed 2.3%. Both indices extended their winning streak to six consecutive weeks, the longest since October 2024. The Dow Jones Industrial Average added a modest 0.2% over the same period.
Looking ahead, market sentiment is expected to be shaped by key catalysts including inflation data, consumer spending trends, geopolitical developments in the Iran conflict, and a closely watched summit between the United States and China.
U.S. President Donald Trump is scheduled to visit Beijing on May 14–15 for a meeting with Chinese President Xi Jinping, marking the first visit by a sitting U.S. president to China in nearly a decade.
On the economic front, attention will center on Tuesday’s U.S. Consumer Price Index report, which is expected to show headline inflation rising 3.7% year-on-year in April.
The upcoming week features a dense macro calendar, with CPI data on Tuesday followed by producer price figures on Wednesday and retail sales on Thursday, all of which will shape expectations for inflation trends and consumer demand.
On the corporate side, earnings activity slows but remains notable. Key reports include Cisco Systems, Applied Materials, Nebius, Oklo, Hims & Hers Health, Circle Internet Group, Klarna, Barrick Mining, and Alibaba Group.
Overall, the outlook remains highly event-driven, and regardless of market direction, attention is centered on identifying one stock likely to attract buying interest versus another that could face renewed selling pressure over the Monday, May 11 to Friday, May 15 trading week.
Stock to Buy: Applied Materials
Applied Materials, the world’s largest semiconductor equipment supplier, is positioned for a potentially strong quarterly performance, driven by sustained demand for advanced chip manufacturing tools amid ongoing AI infrastructure expansion.
The company is set to report fiscal second-quarter results on Thursday at 4:00 PM EST. Market expectations imply a relatively large post-earnings swing, with options pricing in an approximate move of around ±8.7%.
Given its exposure to the semiconductor capex cycle and AI-related investment trends, Applied Materials is likely to remain in focus into the report and could see heightened trading activity around the earnings release.
Applied Materials is expected to report adjusted earnings of $2.68 per share for the March-ended quarter, representing roughly 12% year-over-year growth. Revenue is projected to increase 8% to about $7.68 billion.
Sentiment heading into the results is strongly positive, with analyst revisions skewing decisively upward. According to InvestingPro data, all 23 recent estimate revisions have been raised, underscoring growing confidence in the company’s momentum and continued expansion within the semiconductor equipment cycle.
Applied Materials, a leading provider of semiconductor manufacturing equipment and services, continues to benefit from strong industry capital expenditure, especially tied to advanced chip technologies.
Demand remains particularly supported by ongoing investment in artificial intelligence infrastructure, where advanced semiconductors are a key enabling layer, helping reinforce the company’s positioning in a structurally growing end-market.
Applied Materials has rallied to near its all-time high, closing at $435.44 on Friday. The technical picture remains firmly bullish, with SuperTrend support intact, the Ichimoku cloud still green, and MACD momentum continuing to expand in favor of buyers.
Recent analyst action has further supported sentiment, including HSBC initiating coverage at Buy with a $517 price target, driven by expectations of sustained demand for wafer fabrication equipment linked to AI investment cycles.
Markets will now be watching this week’s earnings closely, as a beat or stronger-than-expected guidance—particularly around AI-related orders—could act as a catalyst for another leg higher.
Trade setup summary:
Entry: around $436.00
Target: $462.00 (≈ +6%)
Stop-loss: $419.00 (≈ -3.9%)
Sell Recommendation: Alibaba Group
In contrast, Alibaba Group is viewed as a potential sell heading into its March-quarter earnings release on Thursday. Despite its strong scale in e-commerce and cloud services, the company continues to face challenges such as margin pressure from ongoing heavy investment in AI and cloud infrastructure, weaker momentum in its core businesses, and a difficult macroeconomic backdrop in China.
Sentiment among analysts has also turned more cautious ahead of the results, with 13 of the last 14 estimate revisions moving lower. Meanwhile, options markets are currently pricing in an expected post-earnings share move of about ±7.3%.
Consensus estimates expect the Alibaba Group to report earnings per share of ¥7.11 ($1.05) on revenue of about ¥247.20 billion ($36.3 billion) for the quarter.
Although the stock may look inexpensive on a valuation basis, it is facing pressure from several directions. Competition in China’s e-commerce space is intensifying, particularly from players such as PDD Holdings, while the domestic economic recovery remains uneven and consumer demand relatively muted. In addition, regulatory oversight from Beijing continues to be a structural overhang.
Its cloud business—previously seen as a key long-term growth driver—has also come under strain, with rising domestic rivals eroding momentum and market share. On top of that, recurring concerns around potential delisting risk for U.S.-listed Chinese companies continue to weigh on investor sentiment, limiting valuation expansion even when operational performance stabilizes or improves.
Alibaba Group is currently trading around $140.06 and is pressing into a technically significant resistance zone. This area is defined by the lower boundary of the Ichimoku cloud ($135.74–$140.06) as well as a key Fibonacci retracement cluster between 50% and 61.8% ($138.33–$143.14) drawn from its February–April decline.
While the broader analyst outlook remains constructive—with consensus implying roughly 27% upside and a generally “Buy” rating—the short-term technical picture appears more fragile, with price action stalling at a heavy confluence of resistance.
Trade structure implied:
Suggested entry: around $140.00
Target: $129.00 (roughly +7.8% move if short is realized)
After reaching a peak near 1.36450 on Wednesday, GBP/USD closed the week around 1.36274. The pair has largely mirrored broader FX market movements, tracking shifts in USD-driven sentiment across different trading sessions.
With WTI crude oil volatility easing and market risk appetite improving, the US dollar has remained under mild pressure. This USD weakness has helped support GBP/USD, which continues to hold above levels seen prior to the early-March Iran-related escalation.
From a technical standpoint, the pair is now approaching territory last traded around the 16–17 February period, suggesting a potential retest of earlier resistance zones as broader sentiment and risk conditions evolve.
Dynamic Range in GBP/USD
The opening of trading for GBP/USD on Monday is likely to be shaped by prevailing market sentiment surrounding the Middle East conflict, which remains relatively calm but still fragile. Alongside this, attention may also turn to reactions from the UK local elections held late last week.
In those results, the Labour Party performed poorly, a development that reflects negatively on its current leadership and raises questions about internal stability. Market participants and financial institutions could respond to these political outcomes at the start of the week, potentially adding an additional layer of volatility to GBP/USD price action on Monday.
Although the leadership of the Labour Party may come under renewed scrutiny, it will also be important to observe whether financial institutions interpret the election outcome as validation of their existing expectations about the UK’s political trajectory.
For short-term traders, the key takeaway is that GBP/USD could see heightened volatility at the start of Monday’s session. As London markets open, price action may become more dynamic as participants react to both political developments and broader sentiment shifts.
Higher Marks in GBP/USD and Correlation Outlook
The GBP/USD may continue to trade with an upward bias in the coming sessions if broader market sentiment keeps the US dollar in a relatively weaker phase across the global FX space. Under such conditions, dollar softness would likely continue to support additional buying interest in the pound.
From a technical perspective, traders may look back toward early-February price levels as potential reference points or interim targets. However, the 1.37000 region still appears to be a more distant objective rather than an immediate trading focus.
For intraday participants, restraint remains important. Rather than chasing extended upside moves, it may be more practical to focus on nearer, more realistic price zones that sit within the day’s typical volatility range, helping to avoid exposure to sharp reversals.
There is also a case for caution around the London open, where institutional flows can introduce abrupt price adjustments, particularly as market participants reassess positioning in light of recent UK political developments.
Although the current government remains in place, market sentiment increasingly reflects speculation about potential political change ahead. Still, GBP/USD pricing is likely to remain anchored in medium-term expectations, which continue to incorporate the existing policy direction and mandate of the current administration.
GBP/USD Weekly Outlook
The current conditions shaping GBP/USD continue to create active two-way price dynamics that appeal to short-term traders. The pair offers frequent opportunities for positioning, though volatility remains a defining feature rather than a stabilizing force.
After the initial activity of Monday’s open fades, trading conditions may settle somewhat. However, market participants still need to account for the risk of sudden catalysts, including developments related to Middle East tensions and ongoing domestic political uncertainty in the UK, both of which could quickly shift sentiment.
From a technical standpoint, GBP/USD holding above the 1.36300–1.36400 area in early Monday trade would likely be viewed as constructive. Sustained stability above this zone could encourage larger market participants to maintain or extend bullish positioning in the days ahead.
That said, even institutional flows remain vulnerable to abrupt sentiment shifts. With global FX conditions still influenced by uneven risk appetite and intermittent geopolitical headlines, the market is unlikely to settle into a smooth trend environment just yet.
The US Dollar Index strengthened as rising risk aversion followed the rejection of each other’s latest peace proposals by President Trump and Iran.
President Trump dismissed Iran’s latest peace offer, describing it as “totally unacceptable.”
Meanwhile, US Nonfarm Payrolls increased by 115K in April, surpassing market expectations despite easing from March’s revised 185K gain.
The US Dollar Index (DXY), which tracks the US Dollar (USD) against a basket of six major currencies, remained firm after posting modest losses in the previous session, trading near 98.10 during Monday’s Asian session.
The Greenback continued to strengthen amid heightened risk aversion after US President Donald Trump and Iran rejected each other’s latest peace efforts aimed at easing tensions in the Middle East. According to Bloomberg, Trump dismissed Iran’s recent peace proposal on Sunday, calling it “totally unacceptable.” Meanwhile, Iranian state television cited an Iranian official as saying Tehran’s response focused on ending the conflict across all fronts, especially in Lebanon, while also addressing the security of shipping lanes through the strait, although no specifics were given regarding the reopening of the crucial waterway.
Ongoing tensions in the Middle East, along with the fragile ceasefire between the US and Iran, are likely to sustain safe-haven demand for the US Dollar, which could continue to pressure major currency pairs in the near term.
Data released by the US Bureau of Labor Statistics on Friday showed that Nonfarm Payrolls (NFP) increased by 115K in April, slowing from March’s revised 185K gain but still beating market expectations of 62K. Meanwhile, the Unemployment Rate held steady at 4.3% in April, in line with analyst forecasts.
The gold market initially pulled back during the week but later rebounded and regained strength. The $4,600 level remains a key area to watch closely, as it has repeatedly acted as both support and resistance in the past.
Gold still appears to have solid potential to gradually move higher, although interest rate markets continue to create headwinds. In this environment, gold is likely to remain volatile and range-bound in the short term. Despite that, the longer-term outlook still looks strongly bullish, and I believe the market could eventually reach the $5,000 level. However, that would likely require several supportive factors to align, including a de-escalation of tensions in the Middle East.
USD/CHF
The US dollar initially strengthened against the Swiss franc but has since pulled back quite sharply. The pair is now testing a potential support zone around the 0.7750 level. Among the major currency pairs, this is one where I still favor the US dollar over the longer term. However, falling interest rates and growing concerns that geopolitical conflicts could escalate are boosting demand for safe-haven assets like the Swiss franc.
Ironically, if geopolitical tensions ease and peace returns, interest rates in the United States may decline, but demand for the safe-haven Swiss franc would likely weaken as well. As a result, this pair is expected to remain heavily influenced by headlines and market sentiment. Over the longer term, however, I still believe USD/CHF has room to move higher.
EUR/USD
The euro initially moved lower before rebounding and showing renewed strength. However, the pair continues to face strong resistance around the 1.18 level, extending up to 1.1850. The 1.1850 zone has remained a significant area of selling pressure, keeping the market contained since the summer of last year.
Going forward, we will need to see whether EUR/USD can finally break above this resistance zone, especially since the pair has attempted to do so several times already. Each breakout attempt, however, has been met with heavy selling pressure that quickly pushes the market back down. For now, I suspect the broader trading range will continue to hold.
BTC/USD
Bitcoin moved higher during the week but later surrendered part of its gains. Even though the latest candlestick resembles a shooting star, it is important to note that the previous candle formed a hammer pattern. This combination suggests that Bitcoin could enter a period of sideways consolidation in the near term.
A break above the $84,000 level would be a strong bullish signal and could pave the way for a much larger upward move. In the meantime, I believe short-term pullbacks will likely continue to attract buyers, with many traders viewing dips as potential buying opportunities.
USD/ZAR
If you were searching for volatility, the South African rand certainly delivered during the week. The pair initially attempted to move higher, but later turned lower as the US dollar continued to weaken. That remains the key theme in this market — traders are likely to keep selling into short-term rallies, especially as the interest rate differential continues to favor South Africa and is expected to do so for the foreseeable future.
With that in mind, I believe the market will likely drift back toward the 16.20 level over time, although the move is expected to be gradual rather than aggressive. In the end, this remains more of a carry trade environment, where traders are primarily focused on earning positive swap returns.
NASDAQ 100
The Nasdaq 100 continues to defy gravity and now appears extremely overbought. The index remains locked in a remarkably strong uptrend, but sooner or later, a sizable pullback is likely to occur — one that could catch overly aggressive or greedy traders off guard.
That said, I believe the 28,000 level will be a key area to watch, as many traders are likely to look for signs of support and renewed buying interest if the market pulls back toward that zone.
USD/MXN
The US dollar has remained weak against the Mexican peso for quite some time. The 17.50 level continues to act as a significant resistance barrier, as it has repeatedly attracted strong selling pressure in the past. Overall, the pair still appears to be trapped within a broader trading range, with support near 17.20 and resistance around 17.50.
Ultimately, I believe that if USD/MXN can break above the highs of the last two weekly candlesticks, it could open the door for a move toward the 18.00 level. However, such a rally would likely require a broader risk-off or fear-driven market environment. For now, the overall setup still appears to favor a “sell the rally” approach rather than a sustained bullish trend.
USD/JPY
The US dollar traded in a highly volatile manner against the Japanese yen throughout the week, following last week’s intervention by the Bank of Japan.
That said, the pair is beginning to form a candlestick pattern that suggests stabilization, indicating there is a genuine possibility of another move higher. A breakout above the 160.50 level — or potentially even the 162.00 region — could pave the way for fresh multi-decade highs, with resistance levels stretching back to 1990.
USD/JPY is trading in a subdued manner near 157.00 during Friday’s Asian session, extending its overnight recovery in line with the US Dollar’s rebound. However, gains remain limited as markets stay cautious about the risk of Japanese FX intervention. Investors are also holding back ahead of the US April employment report due later in the day.
USD/JPY Technical Analysis Overview
On the 15-minute chart, USD/JPY is trading around 159.62, staying above the session open at 159.36. This keeps a slight intraday bullish tone intact as price continues to edge higher within a narrow consolidation range. The Stochastic RSI is positioned near the mid-50s, indicating improving upward momentum without entering overbought territory, which suggests buyers still retain short-term control.
Immediate support is located at 159.36, the day’s open. A break below this level could trigger a deeper pullback toward earlier intraday lows. Although no major moving averages are active on this timeframe, the pattern of higher closes continues to favor buying on dips as long as the pair holds above 159.36.
On the daily chart, USD/JPY also trades at 159.62 and maintains a constructive bullish outlook. Price remains firmly above the 50-day EMA at 158.44 and the 200-day EMA at 155.10, preserving the broader uptrend structure. The Stochastic RSI has recovered toward mid-range levels, reflecting renewed upside momentum after a phase of consolidation within the ongoing bullish trend.
Key support is seen at the 50-day EMA around 158.44, where a pullback would still be consistent with the broader uptrend as long as the 200-day EMA at 155.10 holds. A daily close below the 50-day EMA would signal a potential shift toward a deeper correction, while sustained trading above current levels keeps the bullish structure intact and leaves room for another attempt at recent highs.
Fundamental Analysis Overview
Recent comments follow a series of warnings from Japan’s Ministry of Finance. Finance Minister Satsuki Katayama reiterated last week that authorities are prepared to act against excessive speculative movements in the yen. This stance has kept markets alert after recent sharp swings in USD/JPY, which many participants interpret as possible signs of official intervention.
At the same time, the Bank of Japan’s (BoJ) March meeting minutes, released on Thursday, revealed that several policymakers see room for further interest rate hikes if the energy shock from the US-Iran conflict persists and leads to broader inflationary pressures. Some members also suggested that Japan may need to gradually move away from deeply negative real interest rates.
This increasingly hawkish tone from the BoJ has strengthened expectations for a potential rate increase as early as June. However, analysts remain cautious, noting that sustained support for the yen would likely require either lower US Treasury yields or easing oil prices in addition to tighter domestic policy.
Strategists at OCBC, including Sim Moh Siong and Christopher Wong, suggest that recent USD/JPY fluctuations resemble intervention activity, with the perceived intervention threshold now around 158 rather than 160. They also note that further action could drive the pair toward the 150–155 range, though they emphasize that intervention alone may not be sufficient to change the broader trend without a stronger shift in BoJ policy.
In the US, attention is shifting to Friday’s April employment data. Forecasts point to around 60,000 new Nonfarm Payrolls, with unemployment expected to remain steady at 4.3%. Weekly Initial Jobless Claims, due earlier on Thursday, will also be closely monitored for additional labor market signals.
Meanwhile, the US Dollar Index (DXY) remains under pressure, hovering near two-month lows around 97.90. Markets continue to anticipate a more dovish Federal Reserve outlook, which is limiting the dollar’s upside potential against the yen.
The precious metal has been supported by speculation of a potential de-escalation in Middle East tensions.
At the same time, markets are also reacting to reports that the US and Japan could pursue coordinated currency intervention.
The US dollar recovered from earlier selling pressure amid lingering uncertainty over a rapid resolution to the Middle East conflict, alongside stronger-than-expected US economic data. ADP reported a 109K increase in private sector employment in April, marking the strongest reading since the beginning of 2025. The resilience in the labour market, combined with persistent inflation pressures, helped the DXY rebound 0.5% from its intraday lows, recovering roughly half of its earlier losses on Wednesday. However, the recovery proved short-lived.
Markets are also focused on renewed US–Iran diplomatic efforts, with talks expected to resume by 15 May. As often seen in geopolitics, markets tend to price in outcomes ahead of confirmation. Rumours of de-escalation initially pushed EUR/USD to its highest level since February near 1.1800, before subsequent uncertainty triggered a pullback.
At the same time, geopolitical risks are increasingly seen as more damaging for Europe than for the US. Additional pressure comes from renewed tariff threats by Donald Trump, including potential increases on European auto imports from 15% to 25%. Slowing growth combined with inflationary pressure from higher energy costs is raising stagflation concerns in the eurozone, forcing the ECB into a more cautious policy stance. Even if further rate hikes occur, they are expected to be limited, leaving interest rate differentials supportive of the US dollar and capping EUR/USD upside.
Beyond geopolitics, currency markets are also reacting to developments in Japan. While fundamentals favour a stronger US dollar versus the yen, any coordinated effort to weaken the dollar could impose significant strain on Tokyo. Discussions around possible joint intervention—drawing comparisons to the 1985 Plaza Accord—have resurfaced, with US officials expected to meet Japanese counterparts to discuss foreign exchange stability.
Meanwhile, gold has benefited from easing Middle East tensions, posting its strongest daily gain since late March. The metal is also supported by shifting inflation expectations following the decline in oil prices, which reduces the likelihood of aggressive Fed tightening into 2026. However, upcoming US data releases remain a key catalyst, and any downside surprise could provide fresh momentum for further upside in gold.
GBP/USD rose to 1.3599 on Thursday, with the pound briefly touching its strongest levels since mid-February. Sterling’s advance was supported by ongoing US dollar weakness, as demand for the greenback’s safe-haven status eased amid increasing optimism over a potential US–Iran agreement.
Axios reported that the White House is nearing a framework memorandum with Iran, which could open the door to ending the conflict and beginning nuclear negotiations. Tehran is expected to respond within 48 hours, though a final deal has not yet been reached.
Meanwhile, investors are watching UK local elections closely, with polling indicating potential setbacks for Keir Starmer’s party.
On the monetary policy side, expectations for the Bank of England have been adjusted, with markets now pricing in around 50 basis points of tightening by year-end—roughly two rate hikes—down from earlier expectations of up to three increases.
Market technical review
On the H4 timeframe, GBP/USD is moving within a wide consolidation band above 1.3515, with price action currently stretching toward 1.3650. A pullback toward 1.3344 is still on the table before any further range-bound movement resumes. A decisive break to the upside would expose the 1.3650 area again, while a break lower could accelerate declines toward 1.3344. The MACD also aligns with this outlook, as the signal line remains above the zero line but is turning downward, suggesting weakening bullish momentum.
On the H1 timeframe, GBP/USD is consolidating in a tight range around 1.3615. Price has recently extended lower toward 1.3578 and is now attempting a recovery back to 1.3615 for a potential retest from below. This rebound may be short-lived, with a further decline toward 1.3565 still likely. The Stochastic oscillator supports this bearish short-term bias, with the signal line below 50 and trending down toward 20, indicating rising downside pressure.
Conclusion
The pound continues to find support from improved global risk sentiment and weaker demand for the US dollar as a safe-haven asset. However, ongoing political uncertainty in the UK, along with evolving expectations for Bank of England policy, may cap further gains. In the near term, GBP/USD is expected to remain highly reactive to geopolitical developments and shifts in broader market sentiment.
USD/JPY slips toward 156.85 in Friday’s Asian session, pressured by renewed reports of Japanese FX intervention during the May holidays. Market attention now shifts to the US April employment report, which is expected to be the key macro driver for the session.
USD/JPY weakened to around 156.85 during Friday’s Asian session as the Japanese yen gained strength after reports of another round of FX intervention by Japanese authorities. Traders also turned cautious ahead of the upcoming US April employment data.
According to Reuters, citing a familiar source, Japanese officials reportedly intervened in the FX market during the early May holiday period, following yen-buying operations on April 30. The source noted that “the intervention since the start of May was timed to coincide with the holiday period, when market liquidity was thin.”
Expectations of further intervention may continue to support the yen and weigh on USD/JPY. Japan’s top foreign exchange official Atsushi Mimura also stated on Thursday that authorities stand ready to respond to speculative currency moves across all fronts.
Attention now shifts to the US April jobs report, due later on Friday. Markets expect around 62,000 new jobs, a notable slowdown from March’s 178,000 increase, while the unemployment rate is forecast to remain unchanged at 4.3%.
Silver extends its rally for a third consecutive session and stays poised to post weekly gains.
The broader technical outlook continues to support bullish momentum and suggests further upside potential.
Any notable pullback is likely to attract dip buyers and could remain relatively limited.
Silver (XAG/USD) rebounds after an Asian-session dip below $78.00, reversing part of the previous session’s late decline from a near three-week peak. The metal regains the $80.00 psychological level and remains set for strong weekly gains.
From a technical standpoint, the bias stays constructive as price holds above the 100-period SMA and has recovered the 50% Fibonacci retracement of the March decline. Momentum signals also support the bullish view, with RSI near 68 and MACD remaining above the zero line—indicating buyers still dominate despite emerging overbought conditions.
That said, a sustained break above the 61.8% Fibonacci level and a move beyond $83.00 would be needed to confirm the next leg higher. If achieved, upside targets shift toward the 78.6% retracement near $88.83 and the previous swing high around $96.44.
On the downside, initial support sits at $78.66 (50% retracement), followed by the 100-period SMA near $76.26 and the 38.2% level around $74.47, where dip-buying interest may re-emerge before the broader uptrend is challenged.
Nonfarm Payrolls are forecast to increase by 62K in April, while the Unemployment Rate is expected to remain unchanged at 4.3%. The USD could face elevated volatility ahead of the weekend.
The United States Bureau of Labor Statistics is set to release the April Nonfarm Payrolls (NFP) report on Friday at 12:30 GMT, with markets closely watching the data for clues on the Federal Reserve’s interest-rate path later this year.
Economists expect the US economy to add 62K jobs in April, a sharp slowdown from March’s stronger-than-expected 178K gain. The Unemployment Rate is forecast to remain steady at 4.3%, while annual wage growth, measured by Average Hourly Earnings, is seen accelerating to 3.8% from 3.5%.
Analysts at TD Securities expect signs of stabilization in the labor market after several volatile months. They forecast payroll growth of around 80K, driven mainly by hiring in healthcare and leisure & hospitality, while government employment may decline slightly. They also expect monthly wage growth to stay modest at 0.2%.
Additional labor indicators released earlier this week painted a mixed picture. ADP reported that private-sector employment rose by 109K in April, improving from March’s revised 61K increase. Meanwhile, the Employment Index in the Institute for Supply Management Services PMI climbed to 48 from 45.2, signaling that service-sector hiring is still contracting, though at a slower pace.
What impact will the US March Nonfarm Payrolls have on EUR/USD?
EUR/USD is likely to remain highly sensitive to the upcoming US Nonfarm Payrolls (NFP) report, as investors reassess the outlook for the Federal Reserve and the broader direction of the US Dollar.
Despite the Fed’s relatively hawkish April meeting, the USD has struggled to gain traction amid improving global risk sentiment and easing geopolitical tensions in the Middle East. Comments from Fed Chair Jerome Powell reinforced a data-dependent approach, while Austan Goolsbee acknowledged that labor market conditions have softened, even if they remain broadly stable.
Markets currently expect the Fed to keep rates unchanged through the end of 2026, though traders still see some probability of either a rate hike or cut depending on incoming data. A weak NFP reading — particularly below 30K alongside a higher Unemployment Rate — could strengthen expectations for rate cuts later this year. In that scenario, the USD may weaken further, allowing EUR/USD to extend gains.
On the other hand, a stronger-than-expected payrolls figure could reduce expectations for monetary easing and help the USD stabilize. This would likely cap EUR/USD upside, although a sustained dollar rally may remain limited if risk appetite stays strong heading into the weekend.
From a technical perspective, FXStreet analyst Eren Sengezer notes that EUR/USD maintains a bullish near-term bias. The pair continues to trade above its 100-day and 200-day Simple Moving Averages, while the Relative Strength Index trends toward bullish territory.
Key resistance is seen around 1.1800–1.1810, followed by 1.1900–1.1910 and the psychological 1.2000 level. On the downside, major support stands in the 1.1710–1.1680 zone, with further downside targets at 1.1650 and 1.1560 if selling pressure intensifies.
The conclusion of Operation Epic Fury is lifting risk sentiment.
Japan is expected to keep cracking down on speculators.
The US Dollar weakened after the White House announced the end of the two-month “Operation Epic Fury” and highlighted progress in talks with Iran. Markets are interpreting the developments as a sign of easing tensions in the Middle East, triggering a selloff in Brent crude and pushing the dollar index back toward two-month lows amid improving risk sentiment.
The more optimistic backdrop could support further gains in EUR/USD, though much will depend on how quickly oil prices decline. Damage to energy infrastructure across the Persian Gulf is expected to keep Brent and WTI well above the $65–70 range seen before the conflict erupted, maintaining underlying inflationary pressure.
US services PMI data continues to point to the strongest price pressures since 2022, while futures markets are increasingly pricing in the possibility of additional Fed tightening. That complicates any effort by Kevin Warsh to deliver the aggressive policy easing sought by Donald Trump. For now, however, traders remain focused almost entirely on developments in the Middle East.
The prospect of a ceasefire has already lifted EUR/USD toward 1.1760, and the pair could extend gains if de-escalation continues. On the other hand, a collapse in negotiations or renewed friction between the US and Iran would likely trigger a reversal, especially as Washington continues expanding its military presence in the Persian Gulf despite softer rhetoric.
Meanwhile, Wednesday’s sharp drop in USD/JPY has fuelled speculation that Japanese authorities intervened in the currency market again. Tokyo appears determined to discourage speculative dollar buying during periods of USD weakness.
Gold has also surged more than 3% on hopes of easing geopolitical tensions, climbing above $4,700. Lower oil prices reduce the risk of persistent inflation and lessen pressure on central banks to tighten policy further, potentially reviving demand for gold as a debasement hedge.
Huge swings across USD/Asia as Japan’s MOF keeps intervening in USD/JPY, while Axios continues to publish reports pointing to progress on an Iran deal. It’s difficult not to view the headlines with some skepticism, but markets react sharply to every update, making them impossible to ignore. Regardless of how the probabilities around an Iran resolution are assessed, the market response has been so significant that questioning the credibility of the news flow becomes secondary.
My long USD/CHF position has taken a heavy hit as the US Dollar tumbles alongside a sharp decline in oil prices. USO, the oil ETF, is down 11% today after Monday’s attacks on the UAE had traders positioned for a bullish breakout in crude that ultimately never materialized.
There still appears to be plenty of downside room before crude finds meaningful support. I’m using USO as the reference here, though the broader oil futures curve shows a very similar setup. Fresh optimism over a potential end to active conflict in the Middle East has fueled another rally in AI capex-related names, though it hasn’t translated into stronger USD demand as Japan’s MOF remains active and concerns over stagflation-driven rate hikes from the ECB and other central banks continue to ease.
Apparently, the launch of the DRAM ETF was not the top for memory stocks after all.
SanDisk has now turned into a 35-bagger over the past year, soaring from $40 to $1,400 in just 12 months.
USD/JPY
Interesting setup in USD/JPY. My initial strategy — selling into the 157.19–157.94 area in anticipation of MOF-driven upside exhaustion — turned out to be the correct call, but I got thrown off by a competing view that nonfarm payrolls would likely surprise to the upside. In hindsight, that was probably something to focus on Thursday rather than Monday. The chart still shows the former major low zone around 157.30–157.80 acting as resistance, and the repeated interventions suggest the MOF is serious about defending the area.
Here’s the 5-minute chart. It’s hard to say with certainty that every sharp drop was driven by the MOF, but several of them likely were.
I’m staying on the sidelines for now. Going long here makes little sense regardless of one’s NFP outlook, while shorting at the bottom of the range is equally unattractive. At this point, the MOF simply needs to keep hovering above 157.50 while hoping for lower yields and softer oil prices.
With the VIX sitting at 16.4 and oil down 10%, the hawkish Trump mean-reversion trade — long oil and long USD — probably offers positive expected value. The problem is that there’s still no concrete timeline attached to the latest “deal” or MOU narrative, making risk management on long oil positions extremely difficult.
In hindsight, I was too focused on NFP too early, if it even deserved attention at all in this environment. With oil and MOF activity overwhelmingly driving FX flows, concentrating on payrolls four days ahead of the release now feels misplaced.
Extend this analysis
In recent weeks, a 50/50 barbell trade pairing semiconductors and oil has gained traction, with several bank strategists and Substack writers pitching it as a modern alternative to the traditional 60/40 stocks-and-bonds risk parity framework. In hindsight, the trade has delivered exceptional performance and offers some attractive characteristics: it largely sidesteps direct exposure to the U.S. consumer while remaining relatively resilient to stagflation pressures and tightening financial conditions.
That said, assuming the strategy will continue to work simply because it has worked recently feels like a dangerous exercise in extrapolation. Much of the enthusiasm may reflect performance chasing rather than a durable structural edge.
The following charts take a simplified approach by comparing a portfolio of 100*XLE + SOX against the Advance Research Risk Parity Index (RPARTR). I chose this particular risk parity benchmark because its data extends back to 1998, though using more sophisticated methodologies would likely produce a broadly similar picture.
The SOX+XLE barbell began outperforming after Russia’s latest invasion of Ukraine and continued to hold up even as oil prices eased post-Ukraine, largely because ChatGPT accelerated the AI capex boom. Still, after two wars and three years of markets pricing in the LLM theme, it’s difficult to argue that the trade still offers especially attractive risk/reward. Time will tell.
Traditional risk parity, meanwhile, outperformed across nearly every longer-term horizon except the past few years. The chart on the right indexes both strategies to January 1999 = 1, while the second chart highlights the performance gap between the two indexed series.
Worth keeping in mind.
Closing thoughts
EUR/USD is basically trading like oil.
Check who took the mound for the Cardinals on May 3 — Dustin May, wearing No. 3.
USD/GBP has remained under pressure since early April, driven mainly by uncertainty among central banks over how the conflict in Iran could affect inflation and energy prices. On Thursday, April 30, a fresh batch of economic data reinforced the cautious stance adopted by both the Federal Reserve (Fed) and the Bank of England (BoE).
Over the past month, the pair has fallen 2.8%, with ongoing tensions in the Middle East continuing to fuel market volatility.
While recent inflation data from both the United States and the United Kingdom drew attention, markets remained focused on the broader energy risks linked to the closure of the Strait of Hormuz, which has become a key factor behind the cautious outlook.
Energy driving USD/GBP
For currency traders, USD/GBP has increasingly behaved like a proxy for crude oil rather than reacting primarily to interest rate differentials, though energy market disruptions have also directly influenced monetary policy expectations on both sides of the Atlantic.
Over the past week, the pair has maintained a notably strong correlation with Brent crude, ranging between 0.96 and 0.97. In practical terms, this suggests that USD/GBP tends to rise alongside oil prices and fall when crude declines. Since correlations closer to 1 indicate an almost perfect relationship, the current pattern highlights the extent to which oil prices are steering movements in the pair.
Recent volatility in crude — which briefly surged nearly 7% to a four-year high of $126 per barrel — was largely triggered by reports that the US military was preparing to brief President Donald Trump on potential new actions involving Iran.
“We saw oil prices climb on fears over supply disruptions, making energy one of the few sectors to post gains,” Wealthify said in its monthly market summary. “Equity markets declined broadly, with losses across the US, Europe, the UK, and Asia, leaving investors with limited regional shelter.”
“The Federal Reserve kept rates unchanged in March, but rising oil prices and inflation concerns cast uncertainty over future rate cuts, pressuring bond prices lower. In the UK, mounting inflationary pressures alongside a softer labour market strengthened expectations that the Bank of England may keep rates elevated for longer, with the possibility of another hike later this year.”
The connection between energy markets and USD/GBP has therefore become a dominant force shaping sentiment, often overshadowing corporate earnings and other macroeconomic drivers. At the same time, interest rate expectations themselves are increasingly being influenced by the Middle East conflict, with recent central bank guidance offering key clues about the future direction of both the US Dollar and the British Pound.
Rates fuel cautious optimism
Thursday, April 30, 2026, brought a wave of central bank updates with important implications for USD/GBP.
The Bank of England (BoE) began the day by keeping its benchmark interest rate unchanged at 3.75%, while warning that the conflict in Iran could eventually trigger further inflation pressures and potentially require additional rate hikes.
The decision to hold rates passed by an 8–1 vote, though policymakers signaled that future tightening remains possible, including the prospect of more aggressive increases if inflation risks intensify.
Meanwhile, the United States released its March Personal Consumption Expenditures (PCE) Price Index data. Headline inflation came in slightly below expectations at 3.5%, versus forecasts of 3.6% from economists.
Excluding volatile food and energy prices, the Federal Reserve’s preferred core inflation measure rose 3.2%, matching market expectations and once again underscoring the uncertain influence of geopolitical tensions in the Middle East.
Additional US economic data released Thursday showed weekly jobless claims falling to 189,000 — the lowest level in more than 50 years — signaling ongoing resilience in the labor market and strengthening hopes for continued economic recovery.
While strong US labor data would normally support the Dollar against the Pound, expectations that the BoE may raise rates further are emerging as a key bullish factor for Sterling.
Markets now appear to be pricing in a more hawkish outlook for the UK, whereas sentiment in the United States is becoming comparatively more cautious despite elevated inflation linked to the Iran conflict. Although the Federal Reserve also left rates unchanged recently, several major financial institutions — including Capital One Financial, Synchrony Financial, and Marcus by Goldman Sachs — have already reduced yields on high-yield savings accounts.
These developments highlight growing differences in the monetary policy outlook between the two sides of the Atlantic, a divergence that forex traders are likely to monitor closely in the months ahead.
What’s next for USD/GBP?
The prospect of a more hawkish stance from the Bank of England, fueled by rising energy-driven inflation, could place further downward pressure on USD/GBP in the coming weeks. However, the key factor shaping the pair’s direction will remain developments surrounding the conflict in Iran and the continued closure of the Strait of Hormuz.
If the conflict drags on and keeps energy markets under strain, the BoE may be forced to respond with more aggressive rate hikes to contain inflationary pressures. In contrast, the Federal Reserve could continue facing political pressure from the US administration to lower interest rates, even as higher oil prices complicate the inflation outlook.
Against this backdrop of heightened volatility and uncertainty, a prolonged Middle East conflict could potentially drive USD/GBP toward the 0.71 level. At the same time, expectations for future US rate cuts may extend the Dollar’s broader long-term weakness against major global currencies.
WTI struggles to build on the previous day’s rebound from a more than two-week low as traders await further clarity on a potential US-Iran peace deal. A weaker US Dollar, however, helps cushion downside pressure on the commodity.
West Texas Intermediate (WTI), the US crude oil benchmark, trades sideways during Thursday’s Asian session after rebounding modestly from a more than two-week low below $87.00 in the previous session. The commodity hovers around the mid-$92.00s, down roughly 0.65% on the day, as traders weigh mixed market signals.
Oil prices remain pressured by optimism surrounding a possible US-Iran peace agreement and the reopening of the Strait of Hormuz after US President Donald Trump said a deal with Iran was highly possible. However, losses are limited as investors continue to question the likelihood of a final agreement. Additional support for crude comes from a broadly weaker US Dollar, which tends to benefit dollar-denominated commodities.
Iranian state-linked media rejected reports suggesting a broader agreement had been reached, while the Iranian Students’ News Agency stated that the US proposal contains terms Tehran has already refused. The BBC also reported that Iran is still reviewing the US proposal aimed at ending the conflict and lifting the American blockade on Iranian ports. At the same time, Trump warned that Iran could face attacks “at a much higher level and intensity” if it refuses a peace deal.
On the macro side, the positive impact of the stronger-than-expected US ADP private employment report faded quickly as markets continued to scale back expectations for a Federal Reserve rate hike in 2026. Softer hawkish expectations have kept the US Dollar under pressure after its rebound from a near three-week low, discouraging traders from making aggressive bearish bets on crude oil and prompting caution over further downside.
The US Dollar Index softens as optimism surrounding a potential US-Iran agreement dampens safe-haven demand. Lower oil prices are also easing inflation worries, reducing expectations that the Fed will maintain a hawkish stance for longer. Meanwhile, Fed official Austan Goolsbee cautioned that inflation has picked up since the conflict began, moving further away from the central bank’s 2% target.
The US Dollar Index (DXY), which tracks the Greenback against six major currencies, is stabilizing around 98.00 during Thursday’s Asian session after declining nearly 0.5% in the previous trading day.
The US Dollar remains under pressure as optimism over a possible US-Iran agreement reduces safe-haven demand. The prospect of easing tensions has driven oil prices sharply lower, helping to ease inflation concerns and diminishing expectations that the Federal Reserve will maintain a hawkish policy stance for an extended period.
Still, Chicago Fed President Austan Goolsbee warned that inflation has failed to continue moderating toward the Fed’s 2% target and has instead accelerated since the conflict started.
According to the BBC, Iran said on Wednesday that a US proposal aimed at ending the conflict is “still being considered,” despite growing speculation that both sides could be approaching a deal. Reports suggest Washington submitted a one-page memorandum of understanding that would gradually reopen the Strait of Hormuz and ease the US blockade on Iranian ports, while discussions on Tehran’s nuclear program would take place later. However, no final agreement has yet been reached.
Meanwhile, Donald Trump told CNBC that Iran would face bombing “at a much higher level” if it refuses to accept a peace deal. In a post on Truth Social, Trump added that the US military operation known as “Operation Epic Fury” would end if Iran “agrees to give what has been agreed to.”
EUR/USD remains flat near 1.1750 as traders stay cautious over Iran’s response to the US peace proposal. Risk appetite continues to improve amid growing optimism surrounding a potential US-Iran agreement, while investors focus on upcoming remarks from ECB President Christine Lagarde and the US April Nonfarm Payrolls report for fresh market direction.
EUR/USD moves within a narrow range near 1.1750 in Thursday’s early European session as investors await Iran’s response to the US peace proposal, which includes restrictions on Tehran’s uranium enrichment activities and the reopening of the Strait of Hormuz.
Market sentiment remains broadly positive after reports suggested the US and Iran are nearing a potential agreement. Although S&P 500 futures trade little changed in Europe, the index rallied nearly 1.5% in the previous session.
Meanwhile, the US Dollar Index (DXY), which measures the Greenback against a basket of six major currencies, stays cautious around the 98.00 level.
Traders are now turning their attention to Friday’s key events, including remarks from ECB President Christine Lagarde and the US April Nonfarm Payrolls report. Both releases are expected to provide fresh signals on the future monetary policy paths of the ECB and the Federal Reserve.
EUR/USD: Technical outlook points to cautious consolidation
EUR/USD continues to consolidate near 1.1750 at the time of writing. The pair has hovered around the 20-period Exponential Moving Average (EMA), currently at 1.1708, for nearly a month, signaling a lack of clear directional momentum.
Meanwhile, the Relative Strength Index (RSI) remains trapped within the 40.00–60.00 range, highlighting ongoing market indecision.
On the downside, immediate support is seen around the 20-day EMA at 1.1708. A daily close below this level could weaken the near-term bullish outlook and trigger a deeper correction towards the April 1 peak at 1.1627. On the upside, a breakout above the May 6 high of 1.1797 may pave the way for a move towards the April 17 high near 1.1850.
Gold draws buyers for a second consecutive session as optimism over a potential US–Iran peace agreement weakens the US dollar. Easing inflation concerns also dampen expectations of aggressive Fed tightening, supporting demand for the metal, while traders await the US ADP report for fresh direction ahead of Friday’s Nonfarm Payrolls release.
Gold (XAU/USD) holds firm near a more-than-one-week high, staying above $4,650 as the European session begins on Wednesday. A broadly weaker US Dollar—pressured by growing optimism over a potential US–Iran peace agreement—has supported the metal’s rebound from Monday’s one-month low around $4,500. At the same time, falling crude oil prices are easing inflation concerns and reducing expectations of a more aggressive Federal Reserve, further boosting demand for the non-yielding asset for a second consecutive day.
On the geopolitical front, US President Donald Trump announced a temporary pause in “Project Freedom,” the military effort to escort commercial vessels through the Strait of Hormuz, to allow room for negotiations with Iran. He noted meaningful progress toward a comprehensive deal, echoing earlier remarks from Defense Secretary Pete Hegseth that the US is not seeking renewed escalation and that the ceasefire with Iran remains intact. Additionally, Secretary of State Marco Rubio confirmed the conclusion of “Operation Epic Fury,” a joint US–Israel campaign launched on February 28.
These developments have strengthened expectations of a peace agreement that could end the US-Israeli conflict involving Iran and reopen the strategically crucial strait, lifting investor sentiment while weighing on the dollar’s appeal. Meanwhile, oil prices have dropped to a one-week low, helping to curb fears of rising inflation and allowing the Fed to maintain a more cautious policy stance. Still, according to CME Group’s FedWatch Tool, markets are pricing in more than a 35% chance of a rate hike by year-end, which may limit further downside in the USD and cap gold’s near-term upside.
Given this backdrop, traders may wait for stronger follow-through buying before confirming that gold has formed a bottom near $4,500 and positioning for additional gains. Attention now turns to the US ADP private employment report later in the North American session, along with remarks from key FOMC officials and ongoing geopolitical updates. The primary focus, however, remains Friday’s closely watched US Nonfarm Payrolls report, which is expected to play a decisive role in shaping the near-term outlook for both the dollar and gold.
Gold H4
Gold bulls remain in control as long as prices hold above the 200-period SMA breakout level on the H4 chart. The metal’s solid rebound from the $4,500 region—near the 50% retracement of the March–April rally—combined with a move above $4,600, supports a bullish outlook. Prices are now approaching the 200-period SMA at $4,651.69, which serves as the next key resistance.
Momentum indicators reinforce the positive bias. The RSI sits around 59, suggesting steady strength without entering overbought territory, while the MACD histogram remains positive and continues to rise, pointing to building bullish momentum as gold tests overhead resistance.
On the downside, immediate support is located at the 38.2% Fibonacci retracement level around $4,588.83. Further declines could find buying interest near the 50% level at $4,495.62, followed by the 61.8% retracement around $4,402.41. A decisive break below this last level would invalidate the bullish setup and shift the near-term outlook back in favor of the bears.
MUFG’s Michael Wan says Brent crude has slipped below US$110 per barrel after President Trump halted a US-backed operation to assist vessels leaving the Strait of Hormuz, as negotiations with Iran continue. He emphasizes that disruptions in the Strait go beyond oil prices, potentially triggering wider shortages in products such as energy, petrochemicals, and fertilizers—placing import-reliant economies at greater risk.
Hormuz tensions pressure Brent Oil
“Brent crude dropped under US$110/bbl and the Dollar weakened after President Trump announced a pause in a US-led mission to help stranded ships leave the Strait of Hormuz, allowing time to see whether a deal with Iran to end the conflict can be reached.”
“More broadly, as we’ve noted over the past two months, the implications of disruptions in the Strait of Hormuz extend beyond oil, raising the risk of shortages across a wide range of goods, including energy, petrochemicals, and fertilizers.”
“Countries that rely heavily on Middle Eastern oil, have limited ability to shift to domestic energy sources, and depend more on imported energy and food are generally more exposed to various risk scenarios.”
Commerzbank’s Antje Praefcke maintains that geopolitical tensions surrounding the Iran conflict continue to be the dominant force driving EUR/USD, overshadowing upcoming US indicators such as ADP and Nonfarm Payrolls (NFP). She highlights that recent US labor data has been inconsistent and is unlikely to meaningfully influence the dollar. As a result, EUR/USD is expected to remain within its recent range unless there is a clear escalation or easing of tensions in the Middle East, which is currently acting as a cap on major price movements.
Praefcke notes that attention will still turn to incoming US macro data, beginning with JOLTS job openings—which came in somewhat soft—followed by the ADP report and the official payrolls release. While a strong ADP reading might offer the dollar modest support, a weaker NFP figure could exert downward pressure.
However, given the recent volatility and lack of clear direction in employment data, she believes these figures will likely remain inconclusive. April job growth is expected to be moderate, suggesting little chance of a decisive signal emerging. Consequently, unless there are significant surprises, the data is unlikely to drive the USD in any meaningful way.
In her view, the broader narrative remains unchanged: until there are concrete signs of either de-escalation or escalation in the Middle East conflict, other factors—including US economic data—will take a back seat. Only a clear shift in the geopolitical backdrop is likely to push EUR/USD out of its established range.
Narrowing market breadth. Overextended positioning. The weakest seasonal stretch of the year. The most challenging phase of the political cycle. And a conflict with no clear end in sight. The ingredients for a market correction are piling up.
The S&P 500 notched another record high last week, yet the typical stock in the index remains about 13% below its 52-week peak. That gap isn’t trivial—it’s one of the clearest warning signs seen since the dot-com era, and it’s emerging at a particularly unfavorable time in the calendar. Correction risks are building, now layered with several forces that rarely align all at once.
Decades of observing market cycles suggest the most dangerous periods are when conditions appear stable on the surface but are weakening underneath. That’s the current setup. The risk of a summer correction isn’t tied to a single bearish signal, but to multiple red flags appearing simultaneously—and overlooking any one of them could prove costly.
Breadth Divergence Is at an Extreme
The current rally’s narrowness isn’t a matter of interpretation—it’s simply the math.
The S&P 500 has climbed about 14% from its late-March selloff to reach a new high near 7,125. But beneath the surface, the market tells a very different story. The equal-weight version of the index is actually down roughly 1% over the same stretch. Meanwhile, the “Magnificent Seven” have gained around 10%, and semiconductor stocks have surged close to 30%, leaving much of the broader market behind.
This level of dispersion has been rare since 1980. Analysts at Goldman Sachs recently highlighted that such weak breadth has often been followed by deeper-than-average declines over the next six to twelve months. They’re not alone in raising concerns. Hedge funds are heavily skewed toward momentum trades, with net positioning near multi-year highs, while overall leverage sits toward the top of its five-year range. When positioning becomes this crowded and leadership is so concentrated, any reversal tends to be abrupt rather than orderly.
While market breadth grabs the headlines, the underlying technical signals are just as concerning.
The 14-day relative strength index (RSI) on the S&P 500 has remained above 70 for much of the past three weeks—a level typically associated with overbought conditions. More importantly, a classic negative divergence has emerged: prices pushed to a new high last week, while RSI failed to confirm and instead formed a lower high.
This exact setup has appeared before at key turning points, including the January 2018 peak, the February 2020 top, and the late-2021 high—and in each case, the aftermath was far from benign.
The advance-decline line for the broader NYSE has started to roll over even as the index continues to push higher. At the same time, the share of S&P 500 stocks trading above their 200-day moving average has slipped to around 56%, despite the index itself setting new highs.
We saw a similar deterioration in breadth during a rising market just ahead of the “Liberation Day” selloff in 2025—a reminder that weakening participation beneath the surface often precedes sharper corrections.
The Volatility Index is hovering in the mid-teens, which might seem comforting—until you recall it sat around 12 in January 2020 and near 15 just before the market unraveled. Low realized volatility tends to foster complacency; complacency encourages leverage; and leverage, in turn, sets the stage for sharp unwinds. Right now, all three conditions are in place.
On their own, none of these indicators can precisely time a correction. But taken together, they point to a market that has largely exhausted its margin of safety.
As noted previously:
“Markets don’t typically unravel from euphoric peaks—they tend to break from periods of complacency. And right now, we’re looking at a complacent backdrop marked by weakening breadth, deteriorating technical signals, and the most unfavorable stretch of the seasonal calendar directly ahead.”
Summer Seasonality Is Real—And This Year Looks Even Tougher
The old “sell in May and go away” saying is often brushed off, usually by those who haven’t examined the historical data closely. But the numbers are hard to ignore.
Since 1950, the S&P 500 has delivered an average return of about 1.7% from May through October, compared to more than 7% during the November-to-April period. Much of that underperformance is concentrated in the summer months—June through September. More importantly, in years when the market enters May at or near record highs, the seasonal weakness has tended to be even more pronounced than the long-term average.
Statistical evidence reinforces the seasonal pattern: a $10,000 investment held from November through April has historically far outperformed the same capital deployed from May through October. Notably, the largest drawdowns also tend to cluster in the “Sell in May” window, with major market breaks occurring in October 1929, 1987, and 2008.
That said, seasonality isn’t a guarantee. There have been plenty of exceptions where markets rallied through the summer months. In 2020 and 2021, for instance, aggressive Federal Reserve support helped drive equities higher well beyond April. By contrast, April 2022 marked a sharp downturn as the Fed pivoted to an aggressive rate-hiking cycle the month prior, underscoring how macro policy can override typical seasonal trends.
To be clear, seasonality on its own isn’t a sell signal—it’s context, not a catalyst. But when a weak seasonal backdrop aligns with deteriorating breadth and crowded positioning, the market loses one of its key shock absorbers.
During the summer months, liquidity tends to thin out, trading volumes decline, and it takes less to move prices. With fewer buyers stepping in, even modest negative catalysts can trigger outsized volatility. That’s the environment the market now appears to be heading into.
Midterm Election Years Tend to Be the Most Volatile
One underappreciated reality is that midterm election years have historically been the weakest and most volatile phase of the four-year presidential cycle for equities.
On average, the S&P 500 posts its softest performance from May through October during these years, with larger drawdowns and a higher frequency of corrections compared to non-election periods.
Looking back to 1962, midterm election years have seen average peak intra-year drawdowns of around 17%—notably worse than the roughly 13% typical in other years. The most difficult stretch tends to fall between spring and autumn: from April through October, the S&P 500 has historically experienced an average peak-to-trough decline close to 19% in midterm cycles. Then, almost like clockwork, markets have often found a bottom in late October before staging a strong rebound into year-end and over the following year.
This pattern isn’t random. As November approaches, policy uncertainty ramps up. Companies grow more cautious in their guidance, while political maneuvering and fiscal debates dominate the narrative. Markets generally struggle with uncertainty, and few periods in the four-year cycle carry more of it than the months leading into midterm elections.
With roughly six months until the next vote, the combination of polling dynamics, policy ambiguity, and geopolitical tensions suggests a more contentious backdrop than usual. History indicates that this is precisely the window when correction risk tends to be at its highest.
Iran, Oil, and the Inflation Pipeline
The market has, so far, managed to compartmentalize the conflict in the Persian Gulf—but that kind of detachment rarely lasts indefinitely.
Brent crude is trading above $109 per barrel, roughly 40% higher than before the conflict began. WTI has followed a similar path, hovering near $102. At the center of the risk is the Strait of Hormuz, a critical chokepoint that handles about 20% of global oil supply. Any escalation that seriously disrupts this passage would represent a step-change risk for energy prices.
Up to this point, markets have absorbed the impact of higher oil without major disruption. But that resilience has limits. The longer energy prices stay elevated, the more pressure builds across the inflation pipeline, eventually feeding into broader economic and market stress.
As noted in Bull Bear Report: “The duration of the conflict—specifically how quickly the Strait of Hormuz returns to normal shipping conditions—is the single most important variable for downstream economic and market outcomes. From there, we frame three potential scenarios…”
The risk intensifies over time because energy prices transmit into inflation more directly than almost any other input. A sustained $10 rise in oil typically lifts headline CPI by about 0.2–0.3 percentage points within a few months. Shortly after, some of that pressure filters into core inflation as higher transportation costs ripple through the pricing of goods.
That dynamic helps explain why the Federal Reserve has remained cautious about cutting rates. If tensions escalate further and oil climbs toward $130 or even $140, the argument for easing this year likely disappears—and the possibility of renewed rate hikes could come back into focus.
That scenario isn’t reflected in current pricing. Equity valuations are still built on the expectation that inflation will continue to ease and that the Fed will begin cutting rates later this year. Remove those assumptions, and the foundation under multiples weakens quickly—leaving valuations vulnerable to a sharp repricing.
Managing Market Correction Risk
The most credible counterargument is fairly simple. The surge in AI-driven capital expenditure represents one of the largest corporate spending cycles in decades. According to Q1 2026 GDP data, roughly 75% of overall growth was driven by capital investment, helping to offset softness in personal consumption—which itself makes up about 70% of the economy.
On top of that, hyperscaler earnings are still beating expectations. While narrow breadth is a concern, it doesn’t automatically require leaders to fall—there’s a plausible path where lagging sectors simply catch up instead. That’s a legitimate counterpoint, and it deserves to be taken seriously.
There’s a flaw in the “catch-up” argument. For laggards to close the gap, you need a supportive catalyst—and the current macro setup isn’t providing one. Consumer stocks, which carry the largest weight outside of tech, are directly pressured by elevated oil prices acting as a tax on disposable income. Industrials and materials depend on improving global growth, yet ongoing conflict is pulling in the opposite direction. Financials would benefit from a steeper yield curve and tighter credit spreads, neither of which are in place today. In short, a smooth rotation into laggards would require a macro improvement that doesn’t appear likely in the near term.
That said, narrow leadership can persist. Research from Goldman Sachs suggests the typical narrow-breadth phase lasts around three months, though extreme cases—like the late 1990s—can stretch much longer.
To be clear, this isn’t a call for an imminent crash. It’s a recognition that the ingredients for a sharp and disorderly drawdown are as aligned as they’ve been in quite some time—and they’re showing up during the least forgiving part of the seasonal calendar.
The response doesn’t need to be complicated. It’s about sticking to fundamentals and applying them with discipline.
None of these steps depend on calling the exact top, and they don’t require an outright bearish stance. They simply reflect an understanding that the current risk-reward balance is skewed unfavorably—and adjusting positioning with that reality in mind.
As noted earlier, markets rarely unravel from euphoric peaks—they tend to break from periods of complacency. That complacency is increasingly visible today, with weakening breadth, deteriorating technicals, the least favorable seasonal and political backdrop, and an active geopolitical conflict pushing energy prices to multi-year highs. Any one of these factors would be worth monitoring on its own. Taken together, they create one of the most elevated correction risk environments seen since early 2022, particularly heading into the November election window.
This isn’t a call to exit the market entirely, but it is a case for taking measured action now to reduce exposure to potential downside. Rebalancing portfolios, locking in gains, and modestly increasing cash positions are all ways to regain control on your own terms rather than reacting under pressure later.
It’s important to distinguish between elevated risk and certainty. None of this guarantees a correction. Markets can defy logic—rallies can extend, geopolitical tensions can ease quickly, and seasonal patterns can fail. But the real risk lies in inaction when the warning signs are this aligned.
If markets continue grinding higher into year-end, trimming risk may lead to a period of underperformance. That’s manageable. Performance gaps can be recovered over time with disciplined participation. Permanent capital loss is far harder to repair. A 30% decline requires a 43% rebound just to get back to even—and the deeper the drawdown, the steeper the climb.
That asymmetry should guide decision-making. Investors who endure across cycles aren’t those who capture every rally—they’re the ones who avoid being significantly impaired when conditions turn against them.
A $2 trillion IPO doesn’t emerge in isolation. Long before SpaceX lists on a public exchange, the technology stack behind its reusable rockets and AI-powered systems is already being built by a select group of publicly traded firms—and according to Dylan Jovine, founder of Behind the Markets, most investors are looking in the wrong place.
“SpaceX doesn’t exist without chips,” Jovine argues. The company’s ability to autonomously land rockets and expand its Starlink satellite network depends heavily on semiconductor technology—designed, fabricated, packaged, and delivered by companies investors can access right now.
Here are the five stocks Jovine sees as best positioned to gain from this trend.
Taiwan Semiconductor: The Foundry Powering Every Player on This List
No matter which company designs the next breakthrough in AI chips—whether it’s NVIDIA, AMD, Intel, or even Elon Musk’s rumored AI5—Taiwan Semiconductor Manufacturing Company (TSMC) is almost always the one that brings those designs to life in silicon.
Jovine calls TSMC the backbone of the entire AI chip ecosystem, a view reinforced by its latest earnings results.
“TSMC benefits regardless of who wins the chip race,” he notes. “They’re positioned to succeed across the board.”
The company commands a leading role in advanced semiconductor manufacturing—one that rivals, and in some respects even surpasses, SpaceX’s dominance in orbital launches.
That advantage only deepens as chip designs grow more complex. With next-generation GPUs, AI5, and emerging agentic AI processors demanding increasingly advanced fabrication, TSMC’s technological edge becomes more difficult—not easier—for competitors to match.
Intel: A CPU Revival the Market Is Only Beginning to Recognize
The rise of agentic AI—systems capable of taking action, not just generating responses—is quietly reshaping demand across the semiconductor landscape.
In the early phase of the AI boom, GPUs dominated, with roughly eight GPUs sold for every CPU. According to Jovine, that ratio has already tightened to around four-to-one, and Intel’s CEO has indicated it could eventually move closer to parity.
For Intel, whose core strength has long been CPU design, that shift represents a major tailwind. “It’s like a comeback story,” Jovine suggests, likening it to a powerful return rather than a fading legacy.
The stock has already begun to reflect this changing narrative, climbing more than 100% in the past month. Still, Jovine argues the opportunity is rooted in structural demand, not short-term hype. With the so-called “Magnificent Seven” expected to pour nearly $200 billion into AI infrastructure, the need for CPUs—especially for agentic workloads—is scaling faster than the industry was built to handle.
That gap between demand and supply is exactly where pricing power tends to emerge.
For those concerned about entering after a sharp rally, Jovine takes a balanced view: periods of consolidation are both natural and necessary. The broader trend, he believes, is still in its early stages.
AMD: Positioned to Capture Both Ends of the AI Boom
Advanced Micro Devices is benefiting from the same surge in CPU demand that’s boosting Intel, while also gaining from its exposure to GPUs.
The stock has jumped करीब 70% over the past month, fueled by the broader wave of enterprise spending on AI infrastructure.
Microsoft has indicated that around 90% of Fortune 500 companies are now exploring agentic AI solutions—and AMD plays a key role in enabling that shift.
The investment case is clear: as businesses push cloud providers to integrate more autonomous, agent-driven capabilities, that demand cascades down to chipmakers. AMD is right in the middle of that flow.
NVIDIA: “Cheap” on a Different Scale
It’s not a word most investors would use for NVIDIA—but Jovine does: cheap, at least in relative terms.
While Intel and AMD have surged on the CPU narrative, NVIDIA has been moving sideways, consolidating as it waits for the next phase of its growth story.
The initial GPU-driven rally may have cooled, but the rise of agentic AI is setting the stage for a fresh wave of demand in high-performance computing.
Jovine points to research suggesting a potential $24 trillion valuation for NVIDIA—a figure that naturally invites skepticism, yet is argued on the basis of the company’s dominant market position and exceptional pricing power in GPUs.
With the Magnificent Seven collectively committing massive capital to AI infrastructure, the question becomes less about if demand materializes and more about where that spending ultimately flows—and NVIDIA remains a primary destination.
Amkor Technology: The Overlooked Link in the Semiconductor Chain
The least recognizable name on the list may offer one of the more compelling opportunities.
Amkor Technology operates in semiconductor packaging—a segment that was historically viewed as a low-margin, commoditized business.
That perception is shifting. As chip architectures grow more complex, companies like Taiwan Semiconductor Manufacturing are increasingly producing “chiplets”—modular components that must be precisely assembled before they can function as a complete system.
This is where Amkor comes in. Modern chip packaging now involves highly advanced processes, requiring precision engineering at microscopic scales. As complexity rises, so does the value—and strategic importance—of companies providing these services.
Jovine highlights a key signal: when TSMC built its major fabrication plant in Arizona, Amkor followed by establishing its own facility just seven miles away. That proximity isn’t accidental—it reflects a tightly linked supply chain, with Amkor’s performance increasingly tied to TSMC’s production volumes.
After rallying about 65%, the stock saw a modest pullback in late April. Jovine views this not as a red flag, but as a typical consolidation phase following a sharp repricing—suggesting the broader investment thesis remains intact.
AI Spending Keeps the Momentum Alive
SpaceX may be capturing the spotlight, but the real enablers are already trading in public markets. From chip design and fabrication to advanced packaging, the backbone supporting what could be the most anticipated IPO in history runs through these companies—and the Magnificent Seven’s record-level AI spending continues to reinforce that demand.
This trend has staying power. The cycle doesn’t fade until the capital behind it does.
As the U.S. conflict with Iran moves into its third month, markets have largely steadied following early fears of disruption to the energy sector and oil prices. Still, the evolving political landscape—including a ceasefire that has been in place since early April—continues to inject a high degree of uncertainty. Should the truce break down and tensions escalate again, investors could see renewed volatility.
One approach to navigating this uncertainty is through exchange-traded funds (ETFs), which offer exposure to sectors that may benefit from shifting conditions. Below are two funds to consider, depending on whether your outlook on developments in the Middle East is more optimistic or cautious.
A Cost-Effective, Highly Liquid Way to Gain Crude Oil Exposure
The United States Oil Fund LP is among the most widely used exchange-traded products for investors seeking exposure to oil. Structured as a commodity pool, USO invests in oil futures contracts to mirror daily price movements of light, sweet crude—an oil type that dominates production in the U.S., making the fund closely linked to the domestic energy market.
USO carries an expense ratio of 0.60%, which is relatively low compared to many similar funds. It also stands out for its strong liquidity, with an average monthly trading volume exceeding 27 million shares. Although it isn’t the largest fund by assets—managing roughly $1.9 billion—it remains highly active in the market.
These characteristics make USO especially appealing for short-term traders. Its ability to capture near-term price swings in crude oil is a key advantage, though its reliance on futures contracts exposes it to contango, which can erode returns over time. As such, it may not be the best choice for long-term, buy-and-hold strategies tied to developments in the Iran conflict.
That said, if oil prices continue climbing—something that could happen if the ceasefire collapses and tensions escalate—USO offers a practical way for investors to capitalize on that upward movement.
An Airline-Focused ETF Positioned to Rebound if Fuel Markets Stabilize
Investors anticipating a de-escalation in geopolitical tensions may turn their attention to one of the sectors hit hardest by the conflict: aviation. Airlines have faced mounting challenges, from volatile jet fuel costs and supply constraints to disruptions in routes and operations driven by regional instability.
The U.S. Global Jets ETF tracks a basket of companies tied to the air travel industry, encompassing not just airlines but also firms involved in aircraft manufacturing, maintenance, and related services.
While the fund has global exposure, it leans heavily toward U.S.-based companies and includes many of the world’s largest carriers. Major holdings such as Delta Air Lines, American Airlines, and United Airlines together account for roughly one-third of its portfolio.
JETS stands out for its pure focus on aviation, unlike broader transportation ETFs. This specialization could make it particularly attractive to investors who expect improving diplomatic relations between the U.S. and Iran. However, its year-to-date performance—down around 8% in 2026—suggests that tensions have yet to ease meaningfully.
The fund carries an expense ratio comparable to that of USO and manages a relatively modest asset base of about $725 million, along with lower trading volumes—typical for a niche ETF. It also pays a dividend, though with a yield of roughly 0.5%, income generation is more of a secondary benefit than a primary draw.
More broadly, a sustained ceasefire or an end to the conflict could lift a range of ETFs. Industries with high sensitivity to oil prices would likely see the strongest upside. Even diversified funds focused on developed or emerging markets could benefit if key shipping routes like the Strait of Hormuz reopen and global trade flows return to normal, helping stabilize both energy markets and the wider economy.
WTI weakens as concerns over supply disruptions subside, with the US Navy taking steps to reopen the Strait of Hormuz.
Maersk reported that its US-flagged vehicle carrier, Alliance Fairfax, successfully transited the strait under US military escort.
Meanwhile, Iran launched drone and missile attacks on the UAE, and the US stated it had destroyed Iranian boats in the Hormuz region.
West Texas Intermediate (WTI) crude edges slightly lower during Tuesday’s Asian session, hovering near $101.80 per barrel after posting modest gains a day earlier. Prices are under pressure as immediate supply disruption fears ease, with the United States Navy working to restore traffic through the crucial Strait of Hormuz following Iran’s attempted shutdown.
On Monday, Washington initiated a fresh operation to reopen the waterway, and Maersk later confirmed that its US-flagged vehicle carrier, Alliance Fairfax, successfully exited the strait under US military escort.
According to Reuters, Tim Waterer, chief market analyst at KCM Trade, noted in an email that the incident demonstrates limited safe passage is still possible under current conditions, easing worst-case supply concerns. However, he cautioned that it appears to be an isolated case rather than a sign of a full reopening.
Even so, tensions remain elevated after Iran launched drone and missile strikes on the United Arab Emirates (UAE). CNBC reported that the US also destroyed Iranian boats in the Strait of Hormuz. US President Donald Trump warned that Iran would face severe consequences if it targeted American ships protecting commercial traffic in the area.
Meanwhile, Iran’s Foreign Minister Abbas Araghchi stated that the situation in the Strait of Hormuz underscores the absence of a military solution to what he described as a political crisis. He added on X that as diplomatic efforts—supported by Pakistan—continue, the US should avoid being drawn deeper into conflict, warning that “Project Freedom is Project Deadlock.”
Gold edges higher with modest gains, but the broader fundamentals suggest caution for bullish traders.
Persistent inflation concerns are reinforcing expectations of more hawkish central bank policies, weighing on the metal.
Meanwhile, rising US-Iran tensions bolster the US dollar’s safe-haven appeal, adding further pressure on gold.
Gold (XAU/USD) picks up some buying interest during Tuesday’s Asian session, partially recovering from the previous day’s drop to around the $4,500 level—its lowest in over a month. However, the rebound lacks a clear fundamental driver and could fade quickly, suggesting traders should remain cautious before expecting any sustained upside. Ongoing US-Iran tensions continue to stoke inflation fears and reinforce expectations of higher interest rates, which, alongside a stronger US Dollar (USD), is likely to cap gains in the non-yielding metal.
The fragile ceasefire between the US and Iran appears close to breaking down after renewed violence in the Persian Gulf on Monday. Both the United Arab Emirates (UAE) and South Korea reported attacks on vessels in the critical shipping lane, while the UAE confirmed a fire at the Fujairah oil port following Iranian missile and drone strikes. US President Donald Trump warned that Iran would face devastating consequences if it targeted American ships escorting vessels through the region under the “Project Freedom” initiative.
These developments heighten the risk of further escalation in the Middle East, pushing crude oil prices higher and reinforcing concerns that rising energy costs could reignite inflation. This, in turn, strengthens expectations that major central banks—including the US Federal Reserve (Fed)—may adopt a more hawkish policy stance. Data from CME Group’s FedWatch Tool now shows the probability of a Fed rate hike by year-end at around 35%, up sharply from below 10% last Friday.
The outlook supports higher US Treasury yields, which continue to underpin the USD. Additionally, tensions around the Strait of Hormuz further enhance the dollar’s appeal as a global reserve currency, adding to the bearish near-term outlook for gold. As a result, any upward moves in the metal are likely to attract selling interest, and traders may prefer to wait for stronger, sustained buying before concluding that gold has formed a bottom.
Gold (XAU/USD) 4-hour timeframe chart
Gold may find it difficult to build on its intraday gains given the prevailing bearish technical structure.
From a chart standpoint, XAU/USD continues to show a short-term negative bias as it remains below the 200-period Simple Moving Average (SMA) at $4,655.02. The metal is also constrained by the 38.2% Fibonacci retracement of the March–April rally, keeping prices trapped beneath a strong resistance zone despite a slight rebound from the $4,500 region, which aligns with the 50% retracement level.
Momentum signals are still weak, with the Relative Strength Index (RSI) staying below the neutral 50 mark at 39.84 and the Moving Average Convergence Divergence (MACD) lingering in negative territory. This suggests the current recovery attempt could lose steam near the 38.2% Fibonacci level at $4,595.23. Any further upside is likely to face resistance around the 200-period SMA at $4,655.02, followed by the 23.6% retracement at $4,711.12.
On the downside, immediate support is seen near the 50% retracement at $4,501.57, ahead of the 61.8% level at $4,407.90. If selling pressure intensifies, deeper support levels come into view at $4,274.55 and $4,104.68.
GBP/USD has come under selling pressure for a third consecutive session as renewed tensions between the US and Iran continue to support demand for the US Dollar.
Higher oil prices are stoking inflation concerns and reducing expectations for Federal Reserve rate cuts, further strengthening the greenback. Meanwhile, the Bank of England’s relatively hawkish stance may provide some support to the pound, helping to cap deeper losses in the pair.
GBP/USD is extending its decline for a third consecutive day on Tuesday, though selling pressure remains limited as the pair holds above the key 1.3500 level during the Asian session. The mixed fundamental landscape suggests traders should be cautious about expecting a deeper pullback from last Friday’s peak around 1.3655–1.3660, the highest level since mid-February.
The US Dollar continues to benefit from safe-haven demand amid rising tensions between the US and Iran around the Strait of Hormuz, alongside reduced expectations for Federal Reserve rate cuts in 2026. This stronger USD is weighing on GBP/USD. However, the Bank of England’s comparatively hawkish stance offers support to the British Pound, helping to cushion further downside.
Recent developments have heightened geopolitical risks, including reports of an explosion on a South Korean-flagged vessel in the strait. Former US President Donald Trump warned of severe retaliation if Iran targets US ships, while Iran reportedly launched missile and drone attacks on the UAE following the US announcement of “Project Freedom” to assist stranded vessels.
These escalating tensions are pushing crude oil prices higher, stoking inflation concerns and reinforcing expectations of tighter monetary policy from major central banks, including the Fed. This dynamic continues to support the USD and pressure GBP/USD, although the BoE’s indication that further rate hikes may be needed if inflation persists should help stabilize the pair.
Looking ahead, traders will monitor Tuesday’s US data releases—including ISM Services PMI, JOLTS job openings, and new home sales—along with comments from FOMC officials for short-term direction. Still, attention is firmly on Friday’s Nonfarm Payrolls report and ongoing geopolitical developments, both of which are likely to drive market volatility.
Salesforce, Adobe, and HubSpot have each experienced sharp year-to-date declines in their share prices.
However, despite the pullback, all three continue to deliver strong fundamentals, including double-digit revenue growth, industry-leading profit margins, and robust long-term earnings expansion forecasts.
The analysis below examines why these companies are increasingly viewed as “buy-the-dip” opportunities in the current market environment.
Software equities have come under heavy selling pressure in 2026, with many major enterprise software names falling sharply on worries about AI-driven disruption, lengthening sales cycles, and a broader shift away from high-growth tech.
Despite this backdrop, industry leaders like Salesforce (NYSE:CRM), Adobe (NASDAQ:ADBE), and HubSpot (NYSE:HUBS) continue to report strong operating performance while accelerating the monetization of AI capabilities.
As a result, these companies are now trading at multi-year low valuation multiples even as subscription revenues remain resilient and forward guidance is stable or improving. This disconnect is creating potential long-term entry opportunities for investors looking to accumulate high-quality growth names at discounted levels.
Salesforce (NYSE: CRM)
Year-to-Date Performance: -33.3% Current Price: $176.53 Fair Value Estimate: $282.84 (+60.2% upside) Market Cap: $144.4B
Salesforce has emerged as a notable laggard in 2026, with its share price down roughly one-third year-to-date amid broader software sector de-rating and concerns about moderating growth in its core business.
Even so, the company continues to demonstrate solid fundamentals, supported by AI-driven product enhancements and ongoing enterprise demand, which helps reinforce its long-term growth narrative despite near-term market weakness.
However, Salesforce’s AI initiatives—particularly Agentforce and its broader agentic AI suite—are beginning to show meaningful traction, with accelerating adoption and improving bookings momentum as enterprises integrate more autonomous workflow capabilities.
From a valuation standpoint, the stock now trades at levels well below its historical averages for a company of its scale and quality, which many analysts see as increasingly attractive. Salesforce is projected to deliver nearly 94.3% EPS growth, alongside an estimated 11.0% increase in revenue.
Wall Street consensus currently places a price target of $270.93, implying about 53.5% upside from current levels, while InvestingPro’s AI-driven models suggest roughly 60.2% upside, broadly aligning with a fair value estimate of $282.84.
With its next earnings report scheduled for June 3, 2026, Salesforce has an opportunity to reassert its leadership in both cloud software and AI-powered CRM solutions, potentially reinforcing investor confidence in its long-term growth trajectory.
Adobe (NASDAQ: ADBE)
Year-to-Date Performance: -29.7% Current Price: $246.10 Fair Value Estimate: $398.38 (+60.1% upside) Market Cap: $99.5B
Adobe has also been heavily sold off, with shares down nearly 30% year-to-date and now trading well below its 52-week high of $422.95. The decline reflects broader pressure across software stocks as well as investor concerns around AI disruption and shifting creative software dynamics.
At the same time, Adobe continues to make meaningful progress in integrating AI into its creative suite, strengthening its positioning in generative tools and workflow automation. This innovation cycle helps support its long-term growth outlook despite near-term volatility.
The company recently delivered another earnings beat in March, with both EPS and revenue surpassing expectations, driven by continued strength in its subscription-based business model.
Looking ahead, Adobe’s earnings are forecast to grow by 40.1%, while its free cash flow yield stands at an attractive 7.2%, a level that compares favorably with most peers in the software sector.
Momentum in its AI strategy is also accelerating. Adoption of Firefly generative AI tools has been strong, with generative credit usage rising more than 45% sequentially. Firefly-related ARR increased 75% quarter-over-quarter, while AI-first applications have more than tripled year-over-year, underscoring rapid integration of AI across Adobe’s product ecosystem.
With a forward P/E of just 10.5x, Adobe is trading at a notably compressed valuation despite its continued earnings strength and expanding AI-driven product momentum. Against this backdrop, a fair value estimate of $398.38 implies roughly 60.1% upside from current levels, reinforcing the view that the market may have overcorrected on the stock’s recent weakness.
HubSpot (NYSE: HUBS)
Year-to-Date Performance: -44.7% Current Price: $221.76 Fair Value Estimate: $303.95 (+37.1% upside) Market Cap: $11.4B
HubSpot has been one of the hardest-hit names in the software sector, with shares declining nearly 45% year-to-date amid widespread weakness across high-growth SaaS stocks and ongoing concerns about slower enterprise spending. As a result, the stock now trades well below its 52-week high of $344.71.
Despite the sharp correction, HubSpot remains a standout in the small-to-mid-cap software space, with its pullback reflecting more of a sector-wide de-rating than a deterioration in its underlying business fundamentals.
This sharp sell-off contrasts with HubSpot’s “Strong Buy” consensus rating, which reflects continued confidence in its underlying business strength.
The company has maintained solid growth in its inbound marketing and sales platform, while expanding AI-driven capabilities that enhance customer acquisition, automation, and retention tools.
Recent earnings reports have consistently delivered upside surprises in both revenue and profitability, reinforcing the durability of its SaaS model even in a more cautious spending environment. Looking ahead, the upcoming Q1 2026 results (expected on May 7) are seen as an important catalyst that could further validate HubSpot’s long-term growth trajectory.
At current levels, HUBS appears undervalued based on AI-driven quantitative models from InvestingPro, suggesting a potential 37.1% upside toward its estimated fair value of $303.95 per share.
This gap between price and intrinsic value highlights a meaningful dislocation in the stock, especially when combined with HubSpot’s strong competitive positioning in inbound marketing software and its expanding suite of AI-enabled tools that enhance customer acquisition, engagement, and retention.
Taken together, its resilient growth profile, innovation pipeline, and discounted valuation support the view that HubSpot remains an attractive buy-the-dip opportunity within the broader software sector.
Bottom Line
What unites Salesforce (CRM), Adobe (ADBE), and HubSpot (HUBS) is not just the magnitude of their recent selloffs, but the growing disconnect between depressed share prices and still-strong underlying business fundamentals.
Despite short-term concerns around software demand cycles and AI disruption, each company continues to demonstrate durable growth, expanding AI capabilities, and resilient recurring revenue models.
Historically, periods of heavy pessimism in high-quality software names have often proven temporary. For long-term investors able to tolerate volatility, these pullbacks may represent a rare opportunity to accumulate leading SaaS platforms at discounted valuations.
The market’s attention this week will center on the U.S. jobs report, the ISM PMI survey, and a fresh wave of AI-driven tech earnings.
Palantir Technologies looks set to post striking growth, fueled by accelerating demand for its AI-powered platforms.
Meanwhile, The Walt Disney Company is under pressure as investors closely evaluate streaming profitability and trends in its theme park business.
U.S. stocks closed higher on Friday, with both the S&P 500 and Nasdaq hitting fresh record highs as investors weighed signs of progress in U.S.–Iran ceasefire talks, while a strong rally in Apple Inc. shares provided additional support.
For the week, the S&P 500 climbed 0.9%, while the Nasdaq Composite and the small-cap Russell 2000 gained 1.1% and 0.9%, respectively. The Dow Jones Industrial Average posted a more modest increase of about 0.5% over the same period.
Looking ahead, markets may see increased volatility as investors weigh the outlook for economic growth, inflation, interest rates, and corporate earnings amid ongoing tensions with Iran.
The key item on the economic calendar will be Friday’s U.S. employment report for April, which is expected to show job gains of around 73,000, with the unemployment rate holding steady at 4.3%. In the meantime, the ISM services PMI will also draw close attention as an indicator of economic activity.
That will be accompanied by a busy lineup of Federal Reserve speakers, with policymakers including Christopher Waller, John Williams, Michelle Bowman, Beth Hammack, Mary Daly, and Alberto Musalem all scheduled to speak publicly.
Elsewhere, earnings season remains in full swing, with more than 100 companies in the S&P 500 due to report results this week. Key names include Advanced Micro Devices, Palantir Technologies, CoreWeave, Arm Holdings, The Walt Disney Company, McDonald’s, and Uber Technologies.
They will be joined by other notable firms such as Shopify, PayPal, Coinbase, Pfizer, and Arista Networks.
Regardless of how the market moves, here’s one stock that could attract strong demand and another that may face renewed downside pressure. Keep in mind, this outlook is strictly for the week ahead, from Monday, May 4 through Friday, May 8.
Stock to Buy: Palantir Technologies
Palantir stands out as a compelling buy ahead of its Q1 2026 earnings release, scheduled after Monday’s market close. The data analytics and AI platform firm continues to deliver rapid growth, fueled by strong demand for its Artificial Intelligence Platform (AIP) and accelerating adoption across commercial clients.
Sentiment has been increasingly bullish in the run-up to earnings, with analysts steadily revising their forecasts higher. Notably, all 18 of the most recent estimate changes have been upward revisions, underscoring growing confidence in the company’s near-term performance.
In the options market, traders are pricing in a post-earnings move of roughly ±9.5%, pointing to expectations of elevated volatility following the report.
Analysts expect adjusted EPS to reach $0.28, marking a 115% year-over-year surge, with revenue estimated at about $1.54 billion, up 74% annually. Both U.S. commercial and government segments are projected to grow by more than 60%, driven by strong demand for Palantir’s AI solutions.
Although the stock has declined roughly 20% in 2026 due to sector rotation, Palantir has consistently outperformed expectations and lifted its guidance. Market speculation around a potential stock split is also drawing attention. With Wall Street holding a Moderate Buy rating and average price targets near $192, a solid earnings beat combined with upbeat updates on backlog and AIP momentum could spark a sharp recovery.
Palantir is currently consolidating within a clearly defined range, with key support coming from the SuperTrend indicator and the Ichimoku Kijun level around $139.48–$140. While MACD is showing signs of improving bullish momentum, the broader price structure still reflects a pattern of lower highs since the November peak.
This technical setup suggests that, barring a significant earnings disappointment, the stock could be positioned for an upside surprise and a momentum-led breakout.
Trade Setup:
Entry: ~$144.10
Target: $164.30 (≈ +14% upside)
Stop-loss: $139.00 (≈ -3.6% risk)
Stock to Sell: Disney
In contrast, Disney is being viewed as a potential sell or short ahead of its Q2 fiscal 2026 earnings, scheduled for Wednesday morning before the market open. Although the company benefits from a diversified business model spanning streaming, theme parks, and content production, its near-term outlook points to only moderate growth amid ongoing headwinds.
Sentiment has also turned more cautious going into the report, with all 19 recent analyst revisions moving downward. Meanwhile, the options market is currently pricing in an expected post-earnings move of about ±5.1% in the stock.
Consensus estimates point to earnings per share of $1.49, up 3.4% compared to the same period last year, with revenue expected to increase 5.1% year-over-year to $24.84 billion.
More importantly, investors will focus on three key drivers: streaming profitability, theme park performance, and broader macroeconomic and geopolitical pressures affecting discretionary spending.
The Burbank-based entertainment giant is also expected to issue relatively cautious forward guidance, reflecting ongoing challenges in the Disney+ segment as well as uncertainty tied to global conditions impacting its theme park operations.
Disney recently staged a V-shaped rebound from the $92.18 area, but the upside momentum is now showing signs of exhaustion. Despite the bounce, the broader trend remains under pressure, with the 150-day moving average near $109.65 and a strong volume-based resistance zone around $111.82 continuing to cap further gains.
From a technical standpoint, the structure still favors sellers in the near term, making Disney more of a sell or underweight candidate into earnings for short-term traders and risk-conscious investors.
Oil isn’t just climbing—it’s triggering a broad reset across global markets.
With crude pushing past $108 per barrel, fueled by escalating conflict involving Iran and a sustained disruption in the Strait of Hormuz, this move goes far beyond a normal commodity rally. Roughly 20% of the world’s oil supply passes through that corridor, and current restrictions are tightening supply significantly.
This is a geopolitical shock to the system—and for prop traders, it creates one of the most opportunity-rich, yet high-risk environments of the year.
Futures Traders: Volatility as an Advantage
For futures traders, this kind of price action is exactly what high-performance environments are built for.
Daily swings of 5–8% in oil open the door to:
Breakout trades
Momentum continuation setups
High-probability intraday opportunities
But this isn’t a clean, technical market—it’s driven by headlines.
What’s working:
Riding momentum rather than calling tops
Scaling into trades instead of going all-in
Locking in profits quickly
Common mistakes:
Excessive leverage
Ignoring geopolitical developments
Holding positions through major news events
Key takeaway:
With strict drawdown limits, the objective isn’t to capture the entire move—it’s to generate steady gains while staying within risk parameters.
Stock Traders: Track Capital Rotation
At $108 oil, sector rotation becomes one of the clearest themes in equities.
This isn’t about trading indices—it’s about identifying where money is flowing.
Clear divergence:
Outperformers: Energy producers, oil services, infrastructure
Bitcoin resumes its upward move on Monday following a brief pause last week.
Ethereum is nearing its 200-day EMA, and a strong close above this level could pave the way for further gains.
XRP trades close to the $1.40 resistance area, with a breakout potentially sparking a new rally.
Bitcoin (BTC) climbs on Monday, trading above $80,000 and continuing its uptrend after a short consolidation last week. Ethereum (ETH) and Ripple (XRP) mirror BTC’s momentum, posting early-week gains as they approach key resistance levels, where a breakout could signal the start of another rally.
Bitcoin reaches the $80,000 milestone.
Bitcoin (BTC) is trading around $80,161 on Monday, maintaining a bullish tone as it holds above a strong support zone formed by the 50% Fibonacci retracement at $78,962 and the 100-day EMA near $75,903. The 50-day EMA around $74,448 further supports the ongoing uptrend.
Momentum indicators remain positive, with the RSI near 66 in bullish territory and the MACD crossing higher into positive ground, signaling continued buying interest despite nearby resistance levels.
On the upside, immediate resistance is seen at the 200-day EMA around $81,912, followed by the 61.8% Fibonacci level at $83,437 and a key horizontal barrier near $84,410. A decisive close above this zone could pave the way for a move toward the January high around $97,924.
On the downside, initial support lies at the $80,000 psychological level, with stronger support at $78,962. A deeper correction could target the broader support area between the 100-day EMA at $75,903 and the previous channel top near $75,680, where buyers are likely to step in as long as the overall bullish structure remains intact.
Ethereum may extend gains with a confirmed close above the 50-day EMA
Ethereum (ETH) is trading around $2,370 on Monday, holding a constructive short-term outlook as price remains above both the 50-day EMA (~$2,256) and the 100-day EMA (~$2,344). However, it is now testing a key resistance zone, with the 38.2% Fibonacci retracement at $2,380 acting as the first barrier, while a stronger supply cluster sits near $2,575, where the 50% retracement and the 200-day EMA converge.
Momentum is gradually improving. The RSI is rising toward 58, indicating strengthening bullish momentum without being overbought, while the MACD remains negative but is trending higher, suggesting fading bearish pressure.
On the upside, a break and daily close above $2,380 would expose the critical $2,575 confluence zone. Clearing this area decisively could open the path toward the 61.8% Fibonacci retracement at $2,770.
On the downside, immediate support lies at the 100-day EMA ($2,344), followed by the 50-day EMA ($2,256). A deeper pullback could test the channel resistance-turned-support near $2,148 and the 23.6% retracement at $2,138. Only a move toward the lower channel boundary near $1,747 would begin to threaten the broader bullish structure.
XRP tests key resistance near $1.40
XRP is trading around $1.41 on Monday, hovering just above the 50-day EMA at $1.40, which provides immediate support. However, it remains below the 100-day EMA near $1.50 and the upper boundary of a broader descending channel around $1.54, keeping the medium-term outlook constrained.
Momentum is modest. The RSI sits near 53, indicating mild bullish pressure without being overextended, while the MACD has dipped slightly into negative territory, suggesting that upward momentum may be losing strength as price consolidates.
On the upside, resistance is seen first at the 100-day EMA (~$1.50), followed by the channel ceiling near $1.55. A sustained breakout above this zone would be required to target the 200-day EMA at $1.74 and the longer-term resistance around $1.90.
On the downside, initial support lies at the 50-day EMA ($1.40), followed by a stronger floor at $1.30. If selling pressure intensifies, the lower boundary of the channel near $0.73 could come into focus as a major structural support level.
The NASDAQ 100 has delivered another strong week, but the key question now is whether it can sustain further upside momentum. Despite the gains, the market remains highly volatile and choppy, making it difficult to confidently chase prices at these elevated levels.
I believe dips will present buying opportunities that many traders will look to capitalize on, but for now, patience is essential. When a market is this strongly bullish, it can be challenging to navigate effectively.
USD/JPY
The US dollar dropped sharply against the Japanese yen on Thursday amid intervention, but overall, the market likely needs to stabilize before traders feel confident enough to start buying the dollar again.
Ultimately, the Japanese central bank has limited ability to keep the yen stable. Japan’s heavy debt burden makes it extremely difficult to sustain higher interest rates. As a result, I expect the market to reverse course and move back toward previous highs.
EUR/USD
The euro dipped early on, then rebounded, but ultimately surrendered much of its gains by the end of the week, reflecting ongoing choppy and erratic price action.
Given this setup, it appears that the 1.18 level marks the start of a significant resistance zone, likely extending up to around 1.1850. On the downside, the 1.1650 level remains a key area to watch, with a break below potentially opening the door toward 1.15.
BTC/USD
Bitcoin initially declined during the week but later rebounded, showing signs of recovery. As a result, the formation of a weekly hammer isn’t particularly surprising, given the strong resilience the market has consistently demonstrated.
It has climbed for most of the conflict, which is likely the first clear indication that something meaningful is happening beneath the surface. Bitcoin now appears to be targeting the $84,000 level, though reaching it will likely be a tough battle rather than an immediate move.
USD/CAD
The US dollar has traded in a choppy manner against the Canadian dollar this week, remaining within a well-established range. The 1.35 level continues to act as support, while the 1.3750 level serves as resistance above.
Friday saw a modest rebound from the lower end of the range, reinforcing the idea that “buy the dip” behavior may continue—at least until price breaks above the 1.3750 level. If that resistance is cleared, the upside could accelerate significantly, potentially pushing toward 1.40 over time, though such a move is unlikely to happen quickly.
Gold
Gold initially declined during the week, attempted a rebound, but then pulled back again. Overall, the $4,600 level appears to be a key area that traders will continue to watch closely.
This level has repeatedly proven significant in the past, and that’s unlikely to change anytime soon. That said, a break below the week’s low could open the door for a move down toward the $4,200 level.
Crude Oil
Crude oil has been highly volatile again this week, with markets remaining broadly noisy and unpredictable. Prices are largely being driven by the latest headlines from the Middle East, Washington D.C., and Tehran, leaving the market heavily influenced by geopolitical developments.
Given the situation, it’s nearly impossible to analyze or predict the next move in such a chaotic environment. Over the longer term, however, the only clear takeaway is that prices are likely to maintain a higher floor than they have in the past.
GBP/USD
The British pound showed strength for most of the week, though a late pullback has raised doubts about how sustainable the rally may be.
Given enough time, the market will likely make another attempt to reach the 1.37 level, though it may take a while to get there. After all, this has been a significant level over the past several months.
Is Bitcoin’s legendary boom-and-bust cycle truly breaking down, or are traders simply misinterpreting recent price action? After rallying to around $126,000 and then plunging nearly 50% within months, Bitcoin is putting one of its most enduring narratives—the four-year cycle—under serious scrutiny.
From 2024 to 2025, claims that “the four-year cycle is dead” spread widely across crypto circles as Bitcoin repeatedly set new all-time highs, peaking near $126,000 in October. Prominent voices like Bitwise’s Matt Hougan and ARK Invest’s Cathie Wood supported this view, pointing to shifting market dynamics such as spot BTC ETFs, evolving regulation, and increasing institutional and government participation.
Yet after the roughly 50% correction over the past six months, many who dismissed the cycle have reversed course, once again favoring the traditional pattern. Still, the question remains: what if the original argument—that the cycle is changing—was right all along?
The four-year cycle, explained
Bitcoin has historically moved in a repeating four-year rhythm, closely tied to its halving events. These cycles typically feature major bull market peaks and deep bear market bottoms spaced about four years apart. This pattern can be seen in Bitcoin’s record highs in November 2013, December 2017, November 2021, and October 2025—each occurring in the period following a halving.
A halving cuts the rate of new Bitcoin issuance by 50% roughly every four years, tightening supply and often fueling upward price momentum.
On the downside, Bitcoin has also followed a consistent pattern of steep corrections, with bear market lows marked by drawdowns of around 80% from prior highs—seen in January 2015, December 2018, and November 2022.
More recently, Bitcoin appears to be echoing this behavior, dropping about 50% from its $126,000 peak in October to around $63,000 by February. However, this could be one of the final instances where the market adheres so closely to the traditional four-year cycle.
Why calling the death of the four-year cycle in 2024 may have been premature
One of the main arguments for declaring the cycle “dead” was Bitcoin reaching a new all-time high before the April 2024 halving. This early surge was largely driven by strong inflows into newly launched spot BTC ETFs, which boosted demand ahead of schedule.
In previous cycles, Bitcoin typically set fresh record highs 16–18 months after a halving—not before it. So this unusual timing led many to believe that the traditional pattern had broken.
However, rather than signaling the end of the cycle, this shift may simply reflect front-loaded demand. The ETFs and rising institutional participation could have pulled forward the bullish phase, compressing or reshaping the cycle instead of eliminating it altogether.
Some argued that the arrival of traditional finance (TradFi) players via ETFs introduced entirely new market dynamics, since these participants don’t behave like native crypto investors. While there’s some truth to that, the argument overlooks a core driver of price action: supply and demand.
By the time ETF investors entered in January 2024, Bitcoin had already gone through about a year of bear market consolidation. During that phase, native crypto participants—long-time cycle followers, including whales and retail investors—had accumulated significant amounts of BTC, effectively becoming long-term holders (LTHs).
Sticking to the traditional cycle playbook, many of these holders maintained their positions, taking only partial profits, until around Q3 2025. This timing aligned with their expectations of a cycle peak. As a result, LTHs began distributing more heavily leading up to the final top on October 10.
In the months afterward, their holdings dropped sharply, with LTH supply falling to around 13.6 million BTC by December—the lowest level since 2021.
On the surface, the heavy distribution by long-term holders—combined with Bitcoin’s roughly 50% price drop—seemed to validate the familiar four-year cycle. However, it may instead signal a turning point, marking the beginning of that cycle’s breakdown and the rise of a new market structure.
Four-year cycle relevance may diminish over time
The current market reset suggests a gradual shift in Bitcoin ownership—from traditional cycle-driven participants to institutional players such as ETF investors and corporate treasuries like Strategy.
In just the past two months, US spot BTC ETFs have recorded net inflows of about $3.75 billion, while Strategy alone has accumulated over 100,000 BTC since the start of the year. The entrance of major financial institutions—highlighted by Morgan Stanley’s Bitcoin ETF launch in April—further signals that larger, more traditional players are taking a growing role in the market.
If this trend continues, and many crypto-native investors remain on the sidelines, the influence of the classic four-year cycle could steadily weaken. Price behavior already hints at this shift: the recent ~50% decline from Bitcoin’s all-time high is notably milder than the historical average of around 80% in past bear markets. If Bitcoin holds above $60,000, this would mark the shallowest drawdown in its history.
At the same time, halvings may carry less weight going forward. As Bitcoin’s total supply approaches its 21 million cap—with over 20 million already in circulation—the impact of reduced issuance naturally diminishes due to the law of diminishing returns.
As the market matures and institutional participation deepens, these structural changes could accelerate, pushing crypto-native investors to adapt their strategies to a new, less cycle-dependent environment.
Still, there’s room for error
To play devil’s advocate for the four-year cycle, recent behavior from ETF investors suggests the pattern may not be entirely gone.
Many ETF participants appeared to follow a familiar cycle-driven approach last year: strong inflows helped push Bitcoin to new all-time highs, but were later followed by significant outflows as investors rushed to lock in profits or limit losses after the October leverage flush.
This behavior mirrors the classic boom-and-bust rhythm seen in previous cycles, indicating that even newer institutional players may still be influenced—at least partially—by the same psychological and market forces that have historically shaped Bitcoin’s price action.
ETF investors, having now experienced a full boom-and-bust phase, may start factoring the four-year cycle into their strategies—potentially reinforcing it as a self-fulfilling pattern, much like crypto-native investors have done in the past.
At the same time, the true motivation behind ETF demand remains unclear. Unlike corporate holders such as Strategy, which openly embrace a long-term HODL approach, ETF investors represent a broad and diverse group with varying objectives.
Some may be drawn to Bitcoin as a store of value, others may be actively trading the familiar four-year cycle, and some—particularly hedge funds—could be exploiting arbitrage opportunities like the basis trade. This diversity makes it difficult to predict how their collective behavior will shape future market cycles.
So, is the four-year cycle dead?
A more balanced view is that Bitcoin’s cycle may weaken structurally, but still persist behaviorally. Going forward, price dynamics will likely depend less on halvings and more on how institutional capital chooses to act.
Bitcoin rebounds to trade above $76,000 on Friday after finding support near a key level the previous day.
Ethereum remains above its 50-day EMA at $2,244, signaling potential recovery momentum.
Meanwhile, XRP continues its decline after dropping below the key 50-day EMA at $1.41 earlier this week.
Bitcoin (BTC) and Ethereum (ETH) are attempting a recovery on Friday after rebounding from key support levels in the previous session. In contrast, Ripple (XRP) remains under pressure, having slipped below a crucial support zone. Overall, price action across the three leading cryptocurrencies reflects a cautious market sentiment, as traders watch whether BTC and ETH can sustain their rebound while XRP continues to underperform.
Bitcoin is trading around $76,600 on Friday, posting a modest rebound after finding support near a key zone in the previous session. The near-term outlook remains slightly bullish, with price holding above both the 50-day and 100-day EMAs, clustered just below $75,700 and aligned with a former channel top that now acts as immediate support around $75,680.
Momentum indicators paint a mixed picture. The daily RSI near 56 points to steady but not overbought strength, while the MACD remains below the zero line, indicating that the broader momentum backdrop is still somewhat weak despite the recent upside.
On the downside, immediate support lies near $75,680 and the 100-day EMA at $75,665. A deeper pullback could find demand around the 38.2% Fibonacci retracement at $74,487 and the 50-day EMA near $73,783.
On the upside, resistance is first seen at the 50% retracement level of $78,962, followed by the key psychological barrier at $80,000. Beyond that, a stronger supply zone emerges between the 200-day EMA near $82,326 and the 61.8% retracement around $83,437, just below a horizontal cap at $84,410, which could limit further gains.
Ethereum’s 50-day EMA remains firm, providing solid support.
Ethereum is trading around $2,265 on Friday, holding just above its 50-day EMA at $2,244, though still facing resistance below the 100-day EMA at $2,344 and the 38.2% Fibonacci retracement at $2,367. This setup points to a neutral-to-slightly capped outlook, with price maintaining position above the former channel top at $2,148 but lacking the strength to push into higher resistance zones.
Momentum signals remain mixed. The daily RSI sits near 49, reflecting neutral conditions, while the MACD stays in negative territory, suggesting fading bullish momentum despite the short-term support holding.
On the downside, immediate support is located at the 50-day EMA around $2,244. Further support lies near the previous channel ceiling at $2,148 and the 23.6% Fibonacci retracement at $2,130. A break below this zone could expose the lower boundary of the channel near $1,747.
On the upside, resistance begins at the 100-day EMA at $2,344, followed by the 38.2% retracement at $2,367. A sustained breakout above these levels could pave the way toward the 50% retracement at $2,558, then the 200-day EMA at $2,613, with the 61.8% retracement at $2,749 as a longer-term target.
XRP price action remains weak, signaling continued bearish pressure.
XRP is trading around $1.37 on Friday, continuing to show near-term weakness as it remains within a broader descending channel and below all major EMAs. The 50-day EMA at $1.40 acts as the closest resistance, with additional barriers at the 100-day EMA near $1.51 and the channel top around $1.56.
Momentum remains soft, with the RSI near 44 staying below the neutral level, while the MACD continues to trend deeper into negative territory—indicating that any short-term rallies may struggle to gain traction under current conditions.
On the downside, immediate support is seen around $1.30, a level that has previously attracted buyers. If selling pressure intensifies, the broader channel support near $0.75 could come into focus.
On the upside, a daily close above the 50-day EMA at $1.40 would be an early sign of stabilization. Further resistance lies at $1.51 and $1.56, and only a sustained breakout above these levels would begin to weaken the prevailing bearish trend, with $1.90 as a more distant resistance target.
Gold trades in a tight range during the Asian session, struggling to extend the prior day’s gains. It holds above $4,600 but is still set for a second consecutive weekly loss. A steadier US Dollar, supported by geopolitical tensions from stalled US–Iran talks, along with the Federal Reserve’s hawkish stance, continues to limit upside momentum.
Gold Technical Analysis
A push above $4,600 and the 100-hour Simple Moving Average (SMA) triggered some intraday short covering. However, the rally lost momentum before reaching $4,650, close to the 38.2% Fibonacci retracement of the drop from April’s peak. At the same time, the Relative Strength Index (RSI) stands at 58.33, indicating solid but not overbought conditions, while the Moving Average Convergence Divergence (MACD) remains slightly negative. Overall, momentum signals suggest that bullish pressure is present but still lacks strong conviction, even as prices stay above key short-term levels.
Given this setup, it may be wise to wait for a decisive break above the 38.2% Fibonacci level at $4,651.19 before expecting further upside from this week’s rebound off the $4,500 area, which marked a one-month low. If buyers gain traction, the next resistance could appear near the 50% retracement level at $4,696.20. On the downside, immediate support lies at the 100-hour SMA around $4,623.78. A drop below this level could open the door toward the 23.6% Fibonacci retracement at $4,595.49, with a deeper move potentially revisiting the broader swing low near $4,505.46 if selling pressure intensifies.
Fundamental Analysis
US President Donald Trump dismissed Iran’s proposal to reopen the Strait of Hormuz and ease the blockade while delaying nuclear negotiations. He stated that the US will maintain a naval blockade until Iran agrees to terms addressing concerns over its nuclear program, with reports also تشير to possible new US military strikes. These developments heighten fears of escalating tensions, supporting the US Dollar’s safe-haven appeal and weighing on Gold prices.
At the same time, the Federal Reserve kept interest rates unchanged at 3.50%–3.75%, with an unusually high level of dissent among policymakers. Recent US data showing rising inflation and continued economic strength reinforces expectations that rates could remain elevated into next year, further boosting the Dollar and pressuring Gold.
Data from the Bureau of Economic Analysis showed the PCE Price Index rose 0.7% month-on-month in March, with annual inflation accelerating to 3.5%. Core PCE also increased to 3.2% year-on-year. Additionally, the US economy grew at a 2.0% annualized pace in Q1 2026, a notable improvement from the previous quarter.
However, expectations for at least one 25-basis-point rate cut in 2026 have risen modestly, limiting bullish momentum in the Dollar and helping Gold avoid deeper losses. Market attention now turns to upcoming US data, particularly the ISM Manufacturing PMI, along with ongoing developments in the Middle East, both of which are likely to drive near-term price action.
Microsoft (MSFT) reached a major all-time high of $555.45 on July 31, 2025, before entering a sharp correction that bottomed at $356.07 on March 28, 2026—identified as wave (II). Since then, the stock has begun advancing in wave (III), although a break above $555.45 is still needed to fully rule out the risk of a double correction. The rally from the wave (II) low formed a clear five-wave impulse, reinforcing the bullish outlook as long as price holds above that base.
From the March low, wave (1) peaked at $386.29, followed by a pullback in wave (2) to $367.05. Wave (3) then extended higher to $433.94, before wave (4) corrected to $404.61. The final push in wave (5) reached $445.24, completing wave ((1)). Currently, the stock is undergoing a pullback in wave ((2)), correcting the cycle from the March low.
This corrective phase is expected to unfold in either three or seven swings before the broader uptrend resumes. In the near term, as long as the pivot at $367.23 holds, dips are likely to attract buyers, supporting the case for continued upside within wave (III).
Bitcoin trades just above $76,000 on Friday, maintaining support near its 100-day EMA. The Crypto Fear and Greed Index remains stuck in a neutral-to-bearish zone, signaling subdued market sentiment. Meanwhile, Terra Classic and Zcash are finding it difficult to sustain Thursday’s gains, raising the risk of a potential bearish reversal.
Bitcoin (BTC) holds above $76,000 at the time of writing on Friday, remaining stable despite subdued broader market sentiment. Meanwhile, Terra Classic (LUNC) and Zcash (ZEC) are under pressure, struggling to maintain the gains recorded in the previous session.
Market sentiment tilts toward a bearish bias.
Market sentiment tilts bearish as CoinMarketCap’s Crypto Fear and Greed Index reads 41 on Friday, lingering near the line between neutral and fear, signaling that risk-off sentiment is increasingly taking hold among investors.
Bitcoin steadies at a key support level.
Bitcoin holds near a key support level, with the 100-day EMA around $75,719 halting its recent three-day pullback and maintaining a short-term upward bias. However, the MACD remains in negative territory below its signal line, indicating that bullish momentum may be transitioning into a corrective phase. Meanwhile, the RSI at 56 stays above the midpoint, supporting a constructive outlook without signaling overbought conditions.
A break below the 100-day EMA at $75,719 could expose the 50-day EMA near $73,786 as the next support level, while the ascending trendline around $68,707 represents a more distant structural base.
On the upside, the 200-day EMA at 82,494.55 stands as the next key resistance, and a sustained move above this level could pave the way for a fresh advance within the broader bullish trend.
Will Terra Luna and Zcash hold gains?
Terra Classic (LUNC) is trading above $0.000070 on Friday, maintaining its footing after a strong 5% rally in the previous session. The token continues to hold above its 50-, 100-, and 200-day EMAs, signaling a constructive short-term outlook.
However, momentum indicators suggest caution. The RSI is elevated near 79, deep in overbought territory, indicating that the recent upside may be stretched. At the same time, the MACD is flattening around the zero line, pointing to fading bullish momentum following the latest surge.
For now, LUNC faces clear resistance at the $0.000081 swing high. A failure to break above this level could lead to consolidation or a short-term pullback, especially given the overheated conditions.
On the downside, the 78.6% and 61.8% Fibonacci retracement levels at $0.000070 and $0.000062, respectively, act as key support zones for Terra Classic.
Meanwhile, Zcash trades below $350 on Friday, continuing to consolidate within a triangle pattern. Despite this, the broader outlook remains constructive, with price action holding firmly above the 50-, 100-, and 200-day EMAs clustered between roughly $285 and $307.
Zcash also stays above a rising support trendline near $322, indicating that buyers still dominate the medium-term structure. However, the MACD slipping below its signal line points to fading upside momentum, while the RSI at 56 keeps the bias modestly tilted to the upside.
On the upside, immediate resistance lies at the descending trendline around $357, where previous rallies have stalled. A decisive daily close above this level could trigger a stronger recovery, potentially targeting the $400 psychological level.
On the downside, initial support emerges at the rising trendline near $322, followed by the 50-day EMA around $307 and the 100-day EMA near $301. The 200-day EMA at $284 serves as a deeper and more critical support level should selling pressure intensify.
USD/CHF climbs as the US Dollar rebounds following the Fed’s decision to hold rates while signaling a more hawkish outlook. Morgan Stanley now anticipates no rate cuts this year, scrapping its previous expectations for reductions in September and December. Meanwhile, Switzerland’s March KOF Leading Indicator is due for release later in the day.
USD/CHF posts a third straight day of gains, hovering near 0.7920 in Thursday’s Asian session. The pair is supported by a rebound in the US Dollar, which remains firm after the Federal Reserve left interest rates unchanged but adopted a more hawkish tone amid ongoing inflation concerns.
Morgan Stanley has revised its outlook, now expecting no Fed rate cuts this year, reversing earlier projections for two 25-basis-point reductions in September and December. The shift reflects persistent inflation and signs of continued economic strength.
The Federal Open Market Committee (FOMC) voted 8–4 to keep rates within the 3.5%–3.75% range, marking the highest level of dissent since October 1992. Policymakers noted that inflation remains elevated, partly driven by rising global energy prices.
Safe-haven demand has also lent support to the Greenback. US President Donald Trump stated that the naval blockade on Iran will remain in place until a nuclear agreement is reached, rejecting calls to reopen key routes. Iran responded with warnings of retaliation, accusing Washington of using coercive tactics.
Meanwhile, Swiss data showed a slight improvement in sentiment, with the ZEW Survey Expectations rising to -30.3 in April from -35.0 in March. The March KOF Leading Indicator is scheduled for release later in the day.
Bitcoin fell on Wednesday after the Federal Reserve kept interest rates unchanged and indicated it may maintain this stance to counter inflation risks stemming from Middle East tensions. Renewed diplomatic friction between the U.S. and Iran further dampened market sentiment, pushing the world’s largest cryptocurrency down about 1% to $75,632 by late trading.
Fed holds rates
The Federal Reserve kept its benchmark interest rate unchanged at 3.50%–3.75%, in line with expectations, but the decision drew the most dissent since October 1992. One official favored a 25-basis-point cut, while three others opposed signaling any easing bias for now.
The move comes as rising oil prices linked to Middle East tensions continue to pressure U.S. inflation, while the labor market remains subdued with low hiring and firing activity—making policy decisions more complex. In his press conference, Jerome Powell said the Fed is in a “good place” to either raise or cut rates depending on how inflation evolves, particularly from energy shocks.
He also indicated he will remain a Fed governor after his term as chair ends. This comes as the Senate advances Kevin Warsh, his potential successor, toward a full confirmation vote. Prolonged higher interest rates are typically a headwind for risk assets like cryptocurrencies.
Trump moves to extend the Iran blockade long-term, turning down Tehran’s proposal.
Donald Trump is reportedly pursuing a long-term blockade strategy against Iran, favoring sustained economic pressure over renewed military action or withdrawal, according to a The Wall Street Journal report. This comes after the U.S. rejected a three-step proposal from Tehran that would have reopened the Strait of Hormuz while postponing nuclear talks, with Trump considering the offer inadequate.
In comments to Axios, Trump described the blockade as potentially more effective than airstrikes and reaffirmed his stance against lifting it, citing concerns over Iran’s nuclear ambitions. Meanwhile, Axios reported that U.S. Central Command has drafted a plan for a brief but intense round of strikes to break the negotiation impasse.
Trump also criticized Iran on social media, urging faster progress toward a non-nuclear agreement, alongside a provocative post emphasizing a tougher stance. The ongoing closure of the Strait of Hormuz pushed oil prices higher on Wednesday.
Despite these macro pressures—including rising oil prices, increased liquidations, and expectations of prolonged high interest rates—Bitcoin has remained relatively stable. According to analyst Iliya Kalchev from Nexo Dispatch, this resilience may indicate that weaker market participants have already exited, or that the market is consolidating ahead of a major catalyst that could determine its next move.
Most altcoins moved lower alongside Bitcoin on Wednesday. The second-largest cryptocurrency, Ethereum, dropped 2.2% to $2,241.03, while XRP, ranked third, fell 1.3% to $1.3620. Solana and Cardano also declined by 1.4% and 1.8%, respectively. Among meme coins, Dogecoin reduced part of its earlier gains but was still up 2.6% at last check.
EUR/USD could linger close to its eight-month low around 1.1411.
The 14-day RSI, sitting near 48, points to fading bullish momentum and a likely consolidation phase.
Near-term resistance is located at the 50-day EMA, around 1.1678.
EUR/USD continues to decline for a third straight session, hovering near 1.1660 in Thursday’s Asian trading. Technical signals from the daily chart point to a possible bearish reversal after the pair broke below its ascending channel.
The pair remains slightly below both the 50-day and nine-day EMAs, indicating that near-term upside is limited despite the recent bounce from lower levels. Meanwhile, the 14-day RSI near 48 suggests weakening bullish momentum and a tendency toward consolidation, reinforcing the idea that gains may be capped while price stays beneath these key moving averages.
On the downside, EUR/USD could revisit the eight-month low around 1.1411, last seen on March 13. Immediate resistance is found at the 50-day EMA near 1.1678, followed by the nine-day EMA around 1.1700. A move back into the ascending channel would restore bullish sentiment and open the door to a retest of the two-month high at 1.1849 (April 17), with further upside toward the channel’s upper boundary near 1.1940. A decisive breakout above this zone could pave the way for a climb toward 1.2082, the highest level since June 2021, recorded on January 27.
Gold draws some buying interest on Thursday as the US dollar pauses following its post-FOMC rally. Meanwhile, elevated crude oil prices continue to stoke inflation concerns and reinforce expectations of a more hawkish Federal Reserve. At the same time, the ongoing US–Iran standoff underpins the dollar, which in turn caps further upside for the metal.
Gold (XAU/USD) extends its modest rebound from the $4,500 area—its latest monthly low—and gains traction during Thursday’s Asian session. The US dollar is currently consolidating after a hawkish Fed-driven rally to a two-and-a-half-week high, providing a supportive backdrop for the metal.
As expected, the Federal Reserve left interest rates unchanged at 3.50%–3.75%, though the decision saw the most dissent since 1992, with three officials opposing the policy tone. Fed Chair Jerome Powell later emphasized that the disagreement centered on communication rather than the need for rate hikes. Still, markets scaled back expectations for policy easing in 2026 and are now assigning a modest probability to a rate increase by year-end.
At the same time, surging energy prices—driven by ongoing US–Iran tensions and stalled negotiations—are reinforcing inflation concerns and supporting the dollar. In a recent development, President Donald Trump dismissed Iran’s proposal to end the conflict, insisting that no agreement would be reached unless Tehran abandons its nuclear ambitions. He also highlighted that naval blockades are continuing to disrupt energy flows through the Strait of Hormuz.
These factors may help sustain the dollar’s strength and limit gold’s upside potential. Even so, the precious metal has broken a three-day losing streak and is trading near $4,580, up about 0.75% on the day. Market participants now turn their attention to key US data releases, including the advance Q1 GDP report and the PCE Price Index, along with upcoming policy decisions from the Bank of England and the European Central Bank, which could drive further volatility.
Gold chart
Gold could face renewed selling pressure at higher levels, given the weakening technical outlook.
The recent rejection near the 200-period Simple Moving Average (SMA) on the 4-hour chart, combined with a drop below the 38.2% Fibonacci retracement of the March–April rally, tilts the bias in favor of XAU/USD bears.
Momentum signals also remain fragile, with the Relative Strength Index (RSI) lingering around 38 and the Moving Average Convergence Divergence (MACD) still in negative territory. This indicates that any recovery attempts may struggle as long as prices remain capped below key resistance levels.
On the downside, initial support is located near the 50% retracement around $4,494.59, followed by deeper Fibonacci support levels at $4,401.36 and $4,268.64, which could act as a broader cushion if selling pressure intensifies.
As of now, the Strait of Hormuz has effectively been shut since February 28, halting about 20% of global seaborne oil flows through this critical passage. The International Energy Agency called it “the largest supply disruption in the history of the global oil market.” Producers in the Gulf have curtailed nearly 9 million barrels per day, while U.S. gasoline prices have surged from $2.98 to above $4.00 per gallon.
Historically, shocks of this magnitude—1973, 1979, 1990—have delivered stagflationary blows severe enough to rattle markets. But after decades of observing market cycles, one lesson stands out: when price action refuses to validate a crisis narrative, it’s often because markets are factoring in dynamics that headlines overlook. That seems to be the case with Hormuz today.
Brent crude briefly spiked near $120 but has since eased to around $96, well below the $132 level projected by the Dallas Fed for a prolonged closure. Meanwhile, the S&P 500 continues to edge higher, and China—despite routing roughly a third of its crude imports through the strait—has remained resilient.
The real issue, then, isn’t why the worst-case forecasts missed the mark, but what they failed to account for—and where the true risks may now lie.
Why the Headlines Looked Worse Than the Reality
The “20% of global oil supply shut” narrative was always an oversimplification. In practice, the actual impact was cushioned by several key factors—each grounded in primary data and policy responses.
First, Gulf producers quickly rerouted a significant share of crude exports. According to estimates from Rystad Energy’s Tom Liles, around 5–6 million barrels per day could be diverted through pipeline networks in Saudi Arabia and the UAE, bypassing the Strait via outlets on the Red Sea and the Gulf of Oman. That’s roughly one-third of the region’s typical seaborne exports, reestablished within weeks rather than months.
At the same time, Iran quietly shifted from outright disruption to selective control. By late March, it allowed tankers from countries like China, Russia, India, Iraq, and Pakistan to pass. In effect, the “closure” functioned more as a rationing system than a complete blockade.
Second, strategic reserves performed exactly as intended. The International Energy Agency coordinated a record 400 million–barrel release, while the U.S. Strategic Petroleum Reserve alone contributed about 1.4 million barrels per day. As Bernstein analysts succinctly noted, the goal wasn’t to fully replace lost supply—it was to buy time. And it did just that, bridging the gap while alternative logistics ramped up and demand began to soften.
Third, China entered the الأزمة in a position of strength. Data from the U.S. Energy Information Administration showed commercial inventories approaching 1 billion barrels before February 2026, alongside an additional 360 million barrels in state reserves. That buffer equates to several months of imports, meaning Beijing had both the stockpile and the policy flexibility to weather disruptions—especially when paired with Iran’s selective transit allowances.
Taken together, these factors explain why the real-world impact fell far short of the initial shock implied by the headlines.
Finally—and most critically—the United States is structurally very different from what it was in the 1970s. Domestic crude output now exceeds 13 million barrels per day, providing a significant buffer against external supply shocks like those seen during the Arab Oil Embargo. In addition, LNG exports reached nearly 18 billion cubic feet per day in March, according to the EIA’s April Short-Term Energy Outlook. Less than 10% of U.S. crude imports pass through the Strait of Hormuz, meaning that in a global disruption, the U.S. acts more as a marginal supplier than a marginal victim.
Importantly, even the Dallas Fed’s worst-case scenario assumes the economic damage would be short-lived—limited to roughly one quarter, with an estimated 2.9 percentage point annualized drag on global real GDP. Current conditions appear much closer to the base-case outlook, which anticipated that rerouting, strategic reserves, and demand adjustments would absorb most of the shock. So far, that expectation has largely held true.
The Real Risk Lies on the Other Side
Here’s where the consensus may be misjudging the setup. If the bearish, crisis-driven oil narrative was overstated on the way in, the bullish case for oil at $96 may be equally overstated on the way out.
Once the Strait of Hormuz fully reopens, three forces are likely to hit the market simultaneously. Gulf producers could quickly bring back roughly 9 million barrels per day of shut-in supply, in line with EIA estimates. At the same time, tankers that have been sitting in storage will begin releasing cargoes, while U.S. shale—revitalized by prices near $95—continues operating at elevated output levels. Together, this creates a classic oversupply scenario.
The main counterbalance is the need to rebuild strategic reserves. More than 30 IEA member countries have drawn them down and will likely spend the latter half of 2026 replenishing stocks. Analysts at Kpler have pointed out that the back end of the oil futures curve appears undervalued, with late-2026 Brent priced around $74 compared to a fair value closer to $85.
That said, the direction may be right, but the scale could be off. Restocking demand will unfold gradually over several quarters, whereas supply can return within weeks. That mismatch is where the real risk of dislocation lies. A reasonable base case is for Brent to fall back toward the low $70s within about 90 days of a sustained ceasefire, with a meaningful chance of overshooting toward $60 if demand weakness—triggered by $4+ gasoline—persists.
This isn’t a call for a collapse in crude, but rather a recognition that the adjustment may be uneven. From current levels, upside appears limited, while the downside risk could be swift and pronounced.
The Market Has Already Pivoted to Earnings
It increasingly looks like markets have already absorbed the supply shock and moved on. Oil disruptions have been digested, and the focus has clearly shifted back to corporate earnings—and on that front, the data supports the bulls.
FactSet’s April 17 Earnings Insight shows that 88% of S&P 500 companies reporting so far have beaten first-quarter EPS expectations, well above the 10-year average of 76%. In aggregate, earnings are exceeding forecasts by 10.8%, compared to a historical norm of 7.1%. Looking ahead, analysts are now projecting around 18% earnings growth for full-year 2026. Barclays strategist Venu Krishna has already raised his 2026 EPS estimate to $321 from $305, while FactSet sees net margins reaching 13.9%—a record high. Earlier, Goldman Sachs highlighted this shift, noting that future index gains are likely to be driven primarily by earnings growth rather than multiple expansion.
Beyond that, the trend isn’t limited to 2026. Analysts are also revising 2027 earnings estimates upward, and at a pace that significantly exceeds historical norms.
That’s a genuinely constructive backdrop. Over time, equities tend to track earnings, and the strong Q1 beat rate points to real operational resilience. This isn’t a rally built on optimism alone—it’s being supported by actual results.
There are two important caveats, however.
First, forward earnings estimates almost always trend upward—until they don’t. Rising forward EPS is the norm during an expansion, not a uniquely bullish signal. What really matters is the turning point, and revisions typically roll over with a lag. As Goldman Sachs’ Ben Snider recently highlighted, much of the upward revision driving the S&P 500’s record levels has been concentrated in a narrow group of stocks, such as Exxon Mobil and Micron Technology. The median company in the index has seen minimal upgrades, suggesting this is a rally carried by a handful of leaders rather than broad-based improvement.
Second, valuations leave little room for error. The forward 12-month P/E ratio stands at 20.9—above both the 5-year average of 19.9 and the 10-year average of 18.9. At these levels, even strong earnings beats tend to generate only modest upside, while any disappointment—especially in forward guidance—can trigger sharp declines.
That makes the real test less about Q1 results and more about Q2 outlooks. If sectors like retail, travel, and discretionary begin lowering guidance as the impact of $4+ gasoline filters through consumer spending, forward estimates could finally start to roll over.
Until then, the path of least resistance for equities still appears to be upward.
How to Position From Here
I know not everyone will agree—and that’s fine. Markets exist because of differing views. But after decades of managing portfolios through shocks like this, here’s a practical way to think about positioning given the Strait of Hormuz dynamics and elevated equity valuations:
Don’t chase the oil rally. Crude right now is being driven more by geopolitics than underlying fundamentals. At around $96, the risk/reward for going long looks unfavorable. If you’re already holding energy names that have rallied 40% or more, it may make sense to lock in gains rather than press further. Adding exposure here increases downside risk if the setup reverses.
Favor infrastructure over raw exposure. Instead of betting on oil prices directly, consider energy infrastructure—midstream operators and LNG exporters. These businesses are less sensitive to spot price swings and tend to benefit from a global shift toward energy security. Their cash flows are generally more stable, even if Brent pulls back toward $70.
Respect equities—but don’t overextend. With the S&P 500 trading around 20.9x forward earnings, markets are not pricing in much room for error. It’s reasonable to acknowledge the strength, but avoid chasing it. Rebalancing—trimming outsized winners back to target weights—can help manage risk without abandoning exposure.
Hold duration as a hedge. U.S. Treasuries are currently reflecting expectations of solid growth. But if oil prices fall sharply and demand weakens, it could give the Federal Reserve room to ease policy. In that case, intermediate-duration bonds (“the belly” of the yield curve) would likely rally, providing a natural offset to risk assets.
Keep some cash on hand. Markets across equities, oil, and credit seem to be pricing in a smooth resolution to the conflict. If that assumption proves wrong—whether due to a breakdown in ceasefire or a supply glut hitting before restocking demand builds—liquidity becomes a strategic advantage. Having dry powder allows you to respond when dislocations create better entry points.
Overall, this is less about making aggressive bets and more about managing asymmetry: limited upside in crowded trades versus potentially sharper downside if the narrative shifts.
Bottom line: The market’s calm around the Strait of Hormuz is justified, and the focus on earnings is warranted. But the risk hasn’t disappeared—it has shifted. Instead of an oil price spike, the bigger threat may now be an oil downturn, and instead of geopolitics, attention turns to equity valuations. Both sides of that equation require active management, not complacency, even if markets appear steady.
With ceasefire talks postponed for the second time in a week, tensions between the U.S. and Iran over the Strait of Hormuz remain unresolved. Although equity markets have rebounded this month—shifting focus to a more optimistic macro backdrop—and crude futures have retreated from their March peaks, investors may be underestimating the tightening in physical oil supply.
At the start of 2026, an oversupply of crude was expected to weigh on prices. However, damage to energy infrastructure and production cuts in the Middle East have heightened concerns about a supply crunch triggered by disruptions in the Strait of Hormuz. Typically, about one-fifth of global oil supply flows through this passage, yet since March 1, only around 23,000 kilobarrels have exited—equivalent to less than a day and a half of normal volumes based on the previous year’s average. While earlier oversupply has cushioned the initial impact, a full market rebalancing could take several months.
Much of the attention has been on futures prices in the “paper” market, but a growing disconnect with the physical market has gone largely unnoticed since mid-March. Signs of tightening supply are evident as futures continue to trade below dated Brent—the benchmark for physical oil—even as prices recover after briefly surging past $140 per barrel ahead of the U.S.–Iran ceasefire.
As the last shipments that left the Strait of Hormuz before the conflict only reached their destinations in the week of April 13, securing physical crude supplies is quickly becoming a top priority. Japanese refiners have increased purchases of U.S. oil, Chinese buyers have pushed imports from Vancouver to record levels, and India has ramped up acquisitions of Venezuelan crude. In some cases, traders at Asian refineries have reportedly been willing to pay almost any price to secure cargoes.
While oil futures could decline once credible news emerges of a sustained reopening of the Strait, the shape of the futures curve indicates that a higher price floor may now be in place. Ongoing tightness in the physical market could drive a longer-term shift in the energy landscape—from a just-in-time supply model toward one that places greater emphasis on holding strategic inventories.
What’s Driving the Buzz Around the Petrodollar?
A major theme tied to the recent squeeze in physical oil markets is renewed speculation about the “death” of the petrodollar. Still, that narrative appears overstated. The petrodollar system—rooted in a 1970s agreement between the U.S. and Saudi Arabia to price oil in dollars and recycle those revenues into U.S. assets—remains structurally intact.
Concerns were stirred when Iran reportedly accepted transit payments in Chinese yuan, fueling talk of a potential shift toward a “petroyuan.” However, such a transition would be gradual at best, unfolding over years or even decades—not in a matter of weeks. That said, the offshore petrodollar system may be less influential in the current shock compared to past cycles.
Several factors explain this shift. Gulf nations have increasingly diversified away from traditional reserve assets like U.S. Treasuries, favoring sovereign wealth funds and equity investments instead. Saudi Arabia, for example, has begun issuing dollar-denominated bonds rather than simply reinvesting in them. Additionally, the temporary decline in Middle Eastern oil flows due to disruptions in the Strait of Hormuz has reduced the scale of dollar recycling tied to energy exports.
At the same time, the U.S.’s position as a net energy exporter helps sustain strong dollar liquidity within North American oil markets, reinforcing the broader role of the dollar in global energy trade.
What About Equities?
As global markets have shown since late February, rising oil prices don’t impact all regions equally. The U.S., now firmly a net exporter of petroleum products, enjoys a degree of insulation. This status helps shield domestic equities, which also tend to rely less on overseas revenue than many international peers—reducing vulnerability to global spillovers.
In contrast, developed markets outside the U.S. appear more exposed. Europe’s relative underperformance during the conflict highlights how higher energy and raw material costs can squeeze corporate margins and cap earnings growth. At the same time, rising oil prices often translate into “imported” inflation, pushing expectations higher for rate hikes from central banks like the European Central Bank and the Bank of England this summer. Even if markets treat the shock as temporary, tighter monetary policy could weigh on European equities in the near term.
Japan is particularly sensitive, with roughly 88% of its oil imports coming from the Middle East. Still, Japanese stocks have shown some resilience, supported by a rebound in technology shares. A similar pattern is visible across emerging Asia: markets with strong tech sectors, such as South Korea and Taiwan, have held up better, while countries like Thailand and Indonesia—less driven by tech—have been more negatively affected by rising oil prices and supply constraints.
Conclusion
This unprecedented shock to global energy supply is something investors should keep a close eye on. Current market signals point to oil prices staying elevated, while tightness in the physical market could persist as supply takes time to normalize—potentially marking a more structural shift in how energy markets operate.
That said, the situation does not appear catastrophic for either the U.S. dollar or global equities. The dollar index has actually strengthened since the conflict began, reinforcing its role as the world’s primary reserve currency. Similarly, concerns about the collapse of the petrodollar system seem exaggerated.
With both Washington and Tehran signaling a willingness to maintain the temporary ceasefire and continue negotiations over the Strait of Hormuz, equity markets are likely to shift their focus back to underlying fundamentals. The disruption from the effective closure of the waterway may remain a background factor rather than a dominant driver.
In the near term, U.S. equities are expected to outperform both developed and emerging markets, as strong earnings—particularly from the technology sector—should more than offset the relatively limited drag from higher oil prices.
The “rising oil pushes the Fed toward rate hikes, so gold has to drop” narrative is circulating—it holds up… until it doesn’t.
At certain oil and inflation levels, people start rushing into gold, but those tipping points remain unclear for now.
As long as that (misguided) narrative persists, declining oil prices tend to support gold.
The chart shows a clear head-and-shoulders top formation, though there’s no certainty it will unfold exactly as the technical setup suggests.
The “scenario #2” outlook for oil comes down to one key takeaway: whether the move happens now or later, oil is highly likely headed much higher.
While Americans face less immediate risk of fuel shortages than those in Asia or Europe, global pricing means they’re still exposed to similar inflation pressures—just with a delay.
Because the oil–gold–interest rate narrative heavily influences bank algorithms and institutional capital, disciplined gold investors should maintain enough liquidity to stay composed during the sharp pullbacks this narrative can trigger in gold, silver, and mining equities.
Gold may ultimately reach $20,000, but the path won’t be linear. Price corrections can bring equally sharp emotional swings—especially for investors whose exposure is misaligned with their true risk tolerance.
Over the past couple of weeks, I’ve argued that the bears have the upper hand on the daily chart.
Four short-term technical factors are driving this view. First, the RSI has struggled to break decisively above the 50 level. Second, strong resistance remains around $4,900.
Third, the key 14,7,7 Stochastics oscillator has flashed a sell signal and hasn’t yet reached oversold territory. Finally, the 20,40,10 MACD is showing weakness—the recent buy signal barely pushed the histogram above zero and has since faded significantly.
As for tactics, the approach is straightforward: look to accumulate in the $4,100 and $3,900 zones (or both) if the current pullback reaches those levels. On the upside, consider trimming positions modestly in the $5,400–$5,600 range.
As U.S. debt pressures deepen and reliance on fiat intensifies, more countries and institutions may continue reducing their bond exposure. In that environment, new narratives will likely emerge arguing for lower gold prices. For gold investors, fiat acts as a buffer.
Gold serves as money, while fiat provides the flexibility to navigate shifting narratives and the short- to medium-term volatility they can create in gold, silver, and mining stocks.
Here’s a clean paraphrase:
A look at the key weekly chart for gold shows a much stronger setup than the daily timeframe, and weekly signals typically carry greater weight for forecasting price direction.
The 14,5,5 Stochastics oscillator is currently flashing a buy signal, while a large, flag-like consolidation pattern is forming—resembling a drifting bullish rectangle.
The tactical approach remains unchanged from the daily view: consider buying in the $4,100 and $3,900 zones, and look to take profits in the $5,400–$5,600 range.
What about the miners? Looking at the long-term CDNX chart, I had anticipated a multi-month consolidation as the index approached the neckline of its massive inverse head-and-shoulders pattern—and that scenario is now unfolding.
Turning to the senior miners through the GDX ETF, the picture suggests patience is still needed. The Stochastics oscillator hasn’t yet reached oversold territory, indicating there may be further downside or consolidation before a stronger entry point emerges.
The preferred buy zones for senior gold miners mirror those for gold itself—around $4,100 and $3,900.
As emphasized, gold represents money, while fiat serves as insurance. Investors in gold equities should maintain sufficient cash reserves to confidently accumulate their preferred miners at these levels, while viewing the $5,400–$5,600 range as an opportunity to lock in substantial gains and step back from the market during what remains a broader gold bull cycle.
AUD/USD faces selling pressure after the release of Australia’s consumer inflation data. Ongoing geopolitical uncertainty continues to support demand for the safe-haven US dollar, adding downside pressure on the pair. However, expectations of a hawkish Reserve Bank of Australia stance may help cushion losses for the Australian dollar, as markets now turn their attention to the upcoming FOMC decision.
The AUD/USD pair remains unable to break above the 0.7200 level, edging lower during Wednesday’s Asian session after the release of Australia’s consumer inflation data. Spot prices slipped toward the 0.7170 area in recent trading, although downside momentum appears limited ahead of the key FOMC policy announcement later today.
According to the Australian Bureau of Statistics (ABS), the headline CPI rose 1.4% in Q1, pushing the annual rate up to 4.1%. The Trimmed Mean CPI increased 0.3% over the quarter and 3.5% year-on-year. Despite the inflation figures coming in largely in line with expectations, the Australian dollar saw some selling pressure amid cautious market sentiment driven by ongoing geopolitical tensions.
At the same time, the data has not significantly altered expectations for a more hawkish Reserve Bank of Australia (RBA), with markets now assigning a higher probability of a 25-basis-point rate hike at the May meeting. Combined with relatively subdued US dollar movements, this helps cushion losses in AUD/USD and prevents a deeper decline. Traders, however, remain on the sidelines, awaiting clearer signals from the Federal Reserve’s policy decision.
Markets will closely monitor the FOMC statement for guidance on the Fed’s policy outlook, particularly amid concerns that rising energy prices linked to geopolitical risks could reignite inflation. Meanwhile, continued uncertainty around US-Iran relations and tensions over the Strait of Hormuz may keep demand for the US dollar supported as a safe-haven currency, potentially limiting further gains in AUD/USD and encouraging caution before positioning for a continuation of its month-long uptrend.
The US Dollar Index hovered around 98.65 in early Wednesday Asian trading, showing little change. The Fed is broadly expected to keep rates unchanged at 3.50%–3.75% at its April meeting. Market focus will then turn to Thursday’s US Q1 GDP and PCE inflation data.
The US Dollar Index (DXY), which tracks the value of the US Dollar (USD) against a basket of six major currencies, is trading around 98.65 during Wednesday’s Asian session. The index remains stable as investors await the Federal Reserve’s interest rate decision later in the day.
The Fed is widely anticipated to keep the federal funds rate unchanged at 3.50%–3.75%, a level maintained since January. This meeting may also be Chair Jerome Powell’s last before a potential transition to nominee Kevin Warsh.
Market participants will pay close attention to Powell’s post-meeting press conference for guidance on the Fed’s outlook amid ongoing economic risks. A more hawkish stance on persistent inflation could provide short-term support for the US Dollar against other major currencies.
According to Carol Kong, currency strategist at Commonwealth Bank of Australia, uncertainty remains over Powell’s future role, including whether he will step down as Chair or continue serving as a governor beyond his term.
Looking ahead to Thursday, investors will focus on the preliminary US Q1 GDP data and the Personal Consumption Expenditures (PCE) Price Index. Weaker-than-expected results from these reports could put downward pressure on the DXY.
EUR/USD Price Forecast
EUR/USD remains steady around 1.1700 ahead of upcoming Fed and ECB policy decisions, with both central banks expected to keep rates unchanged. Meanwhile, German HICP is projected to rise at a faster annual rate of 3% in April.
EUR/USD trades sideways around 1.1700 in Wednesday’s Asian session, as markets await key Fed and ECB policy decisions. Both central banks are expected to keep rates unchanged while flagging inflation risks linked to higher energy prices amid ongoing Strait of Hormuz disruptions. Investors will closely watch commentary from Jerome Powell and Christine Lagarde for signals on future policy direction. Ahead of the meetings, attention also turns to German April HICP data, expected to show inflation rising to 3% YoY from 2.7%.
EUR/USD technical outlook
EUR/USD is trading flat around 1.1700, showing a sideways bias as it continues to hover near the 20-day EMA at 1.1698, while still holding above the 38.2% Fibonacci retracement level at 1.1666.
The RSI has moved back into the 40–60 neutral zone after failing to sustain levels above 60, signaling fading upside momentum, although the broader bullish bias is still in place.
On the upside, immediate resistance is seen at the 50% Fibonacci level near 1.1745, followed by 1.1825 (61.8% retracement), then 1.1938 and the recent cycle high around 1.2082. On the downside, initial support lies at 1.1666; a break below this level could open the way toward 1.1567 (23.6% retracement) and further down to the key structural support near 1.1408.
The conflict involving Iran has disrupted many asset classes—except for Bitcoin. In recent weeks, the leading cryptocurrency has shown notable resilience, with far less volatility than other risk-sensitive assets like U.S. equities. While some argue that Bitcoin is becoming less sensitive to geopolitical events, other factors are also at play.
Last week, Bitcoin climbed to a two-month high above $78,000 and has largely maintained those gains, continuing its upward momentum.
Historically, Bitcoin hasn’t been insulated from geopolitical shocks. Its price has tended to drop during sharp escalations—such as the Iranian strikes on Israel in April 2024—and it still behaves like a risk asset, often moving in tandem with equities during periods of extreme market fear. Yet this pattern hasn’t played out in the current Middle East conflict.
That said, the US–Iran war began after Bitcoin had already undergone a steep correction of more than 50% from its all-time high prior to February 28.
This recent resilience could indicate that Bitcoin is in the process of forming a bottom, particularly if it continues to defend key support levels. Beyond the idea that the market had already priced in significant downside, Bitcoin’s stability during wartime may point to stronger underlying demand and a more robust market structure, driven by several supporting factors.
Institutional investors and corporations are increasing their exposure.
Institutional investors have poured more than $3 billion into spot Bitcoin ETFs from March to now, following a relatively modest $206 million outflow in February. This suggests that even after the conflict began at the end of February, net inflows stayed positive—helping support Bitcoin’s resilience as investors stick to a long-term outlook and continue building exposure.
On the corporate side, treasury heavyweight Strategy has maintained its aggressive accumulation strategy despite the geopolitical backdrop and an unrealized Q1 loss of $14.46 billion on its Bitcoin holdings. With its latest purchase, Strategy’s total holdings—now exceeding 815,000 BTC—have even surpassed those of major institutional player BlackRock.
Liquidity injection
Broader liquidity conditions have also been a key driver behind Bitcoin’s resilience, given that BTC remains highly sensitive to global liquidity cycles. Over the past six months, global M2 money supply has been on the rise. Historically, Bitcoin tends to follow this trend with a lag, as expanding liquidity often finds its way into risk assets. This backdrop of increasing global money supply helps explain—and support—Bitcoin’s recent strength.
Additionally, according to Barchart, the United States Department of the Treasury is expected to repurchase $15 billion of its own debt this week—marking the largest Treasury buyback on record. This broader backdrop of expanding liquidity, fueled by both Treasury buybacks and rising global M2, has created supportive conditions that help Bitcoin absorb war-related uncertainty more effectively than in earlier, less liquid market cycles.
Wall Street’s crypto presence keeps growing
Rising interest from major Wall Street banks is another factor underpinning Bitcoin’s resilience. Morgan Stanley launched its Bitcoin Trust (MSBT) on the New York Stock Exchange in early April, marking the first spot Bitcoin ETF introduced by a major U.S. bank. Meanwhile, Goldman Sachs has also entered the ETF race.
This expanding presence of traditional financial institutions in the crypto space strengthens the narrative that Bitcoin is gradually evolving from a purely speculative instrument into a more established asset class.
Iran considers using Bitcoin for toll payments
The Middle East conflict may also be enhancing Bitcoin’s real-world utility. Iran has reportedly proposed that shipping companies pay transit tolls in cryptocurrency for oil tankers passing through the Strait of Hormuz.
Under the plan, tanker operators would need to submit cargo details in advance for approval by Iranian authorities. Approved vessels would then pay a transit fee of roughly $1 per barrel, with payments accepted in Bitcoin, other cryptocurrencies, or the Chinese yuan. Empty vessels would be exempt.
Given Iran’s reliance on crypto to bypass U.S. sanctions, Bitcoin has already been used for import payments and trade settlement. This latest proposal signals a potentially expanding role for crypto in global commerce. If implemented, it could mark a meaningful step in adoption—especially in financially constrained regions—and may provide a near-term boost to demand, particularly as around 20% of global oil shipments pass through the Strait of Hormuz.
Technical Analysis: Is BTC bottoming out?
Bitcoin’s technical structure is starting to show constructive signals. The leading cryptocurrency gained 4.33% last week, reaching an 11-week high near $78,333, and has extended those gains by more than 5% this week. Price is այժմ approaching the key 61.8% Fibonacci retracement level around $78,490, measured from the August 2024 low (~$49,000) to the October 2025 all-time high (~$126,199).
A weekly close above this $78,490 resistance would be significant, opening the door for a move toward the 100-week Exponential Moving Average (EMA) near $82,568. Breaking and holding above that level would establish a higher high on the weekly chart—a strong signal that the broader trend may be turning bullish again.
Momentum indicators are also improving. The Relative Strength Index (RSI) sits at 46 on the weekly timeframe and is trending upward toward the neutral 50 level after rebounding from oversold conditions—suggesting that bearish pressure is fading. Meanwhile, the Moving Average Convergence Divergence (MACD) has just printed a bullish crossover, with a positive histogram reinforcing the case for continued upside.
Taken together, these signals point to a market that may be in the early stages of forming a bottom—though confirmation will depend on whether key resistance levels are decisively broken.
Bitcoin still behaves primarily as a risk asset, and its role as an “inflation hedge” or “digital gold” remains premature—at least until the market matures further. Rather than acting as a clear safe haven during geopolitical turmoil, its recent resilience likely reflects a convergence of factors: capital inflows, improving liquidity conditions, and growing adoption, alongside the aftermath of a deep correction and deleveraging phase.
While headlines will continue to influence Bitcoin—as they do all asset classes—the market, for now, appears to be driven more by liquidity dynamics than by geopolitical shocks.
Liquidity rarely gets attention until it disappears. By the time equities are sliding and risk assets are being repriced, underlying market conditions have often been tightening for weeks. The key is knowing what signals to monitor early on.
This piece outlines how I view real-time liquidity. It’s not a step-by-step guide, but rather context for why I focus heavily on funding markets—and why shifts in those flows often appear in the data before they’re reflected in risk assets.
Why Liquidity Ultimately Matters
Markets don’t always react to underlying liquidity conditions right away. There are periods when liquidity is quietly tightening, yet equities continue to rally—often driven by falling volatility, dominant options flows, or a single macro catalyst overshadowing everything else.
Still, liquidity tends to lead over time. Many significant risk-off episodes I’ve observed—such as crypto weakening ahead of equities or the S&P 500 stalling despite positive headlines—have been preceded by clear signs of tightening funding conditions. These signals may not offer immediate trading opportunities, but they are informative.
The objective isn’t to generate a direct trade signal, but to bring visibility to forces that typically remain beneath the surface.
What I Track
Four key components tend to matter most: SOFR volumes, the Treasury General Account (TGA), bank reserves, and the reverse repo facility (RRP). Each offers a different lens on where cash sits, how it’s moving, and what it’s funding. Together, they form a real-time snapshot of liquidity across the U.S. financial system.
Looking at rates alone isn’t sufficient. Volumes, balances, and the direction of flows carry more weight. So do secondary signals—like credit spreads, equity repo financing, Bitcoin’s price action, and usage of the standing repo facility—which either reinforce or challenge the primary data.
The edge isn’t just understanding each piece in isolation, but integrating them into a cohesive, real-time view. That synthesis is what I focus on every day for subscribers.
Why Today Isn’t 2023
The most important structural change over the past two years is that the liquidity buffer the system leaned on in 2023 has largely been exhausted. Back then, when the Treasury issued debt to finance deficits, much of it was absorbed by idle cash sitting at the Fed—so the market impact was relatively muted.
That cushion is now gone. Today, similar issuance is more likely to be funded with cash that would otherwise support bank reserves. The deficit may be the same, and the volume of bills unchanged, but the effect is different because the funding source has shifted.
This is where much of the commentary falls short. Saying “the Fed isn’t doing QT anymore” misses the point. The real story lies in how the deficit is being financed—and those underlying mechanics can matter more than the Fed’s headline policy stance.
When the Plumbing Moved First
Three episodes are worth revisiting, because the order of events mattered: each time, stress showed up in the system’s plumbing before anything else.
Take September 2019
A widely documented reserve shortage unfolded as Treasury settlements and corporate tax payments landed in the same week, after reserves had already been declining for months. On September 17, overnight repo rates surged far above the Fed’s target range, forcing emergency liquidity operations. In the days prior, market price action looked calm—but beneath the surface, funding conditions had been tightening. The plumbing cracked first, rates reacted next, and equities only adjusted after the Fed stepped in, even though the strain had been building in funding markets for weeks.
March 2020
The COVID shock ultimately spread far beyond funding markets, but in the early phase, the stress began in the plumbing. A global dash for dollars triggered indiscriminate selling across assets — even Treasuries weren’t spared. Funding conditions deteriorated rapidly and markets seized up, forcing the Fed to roll out emergency measures. The key takeaway: once funding breaks, correlations snap into place almost immediately, and everything starts moving together.
November 2025
Bitcoin started to roll over a couple of weeks before equities followed. That sequencing — crypto weakening ahead of broader risk-off — has shown up often enough across cycles to be useful as a confirming signal in liquidity analysis, even if it’s not a primary driver.
Not every bout of market stress originates in the plumbing. Some are driven by earnings shocks, geopolitics, or policy shifts. Still, a notable portion of the larger equity drawdowns since 2018 have left clear traces in funding conditions—visible if you’re watching the right indicators.
Where the Model Falls Short
This framework isn’t a crystal ball, and it has some clear limitations:
Market price action can diverge from liquidity signals for extended periods. Short-term forces — like zero-DTE options flows, single-name earnings catalysts, or volatility compression — can dominate and mask underlying funding stress.
Central bank intervention can quickly reset the landscape. If the Fed steps in to support reserves or tweaks facilities like the standing repo, signals can reverse abruptly.
Bitcoin doesn’t always behave as a pure risk asset. While it often tracks liquidity, there are moments — particularly when traditional safe havens lose credibility — where it decouples and complicates the read.
Finally, the Fed’s “ample reserves” narrative can lag reality. Policymakers may maintain that reserves are sufficient even as overnight funding markets begin to tighten, making real-time data a more reliable guide than official messaging.
Why This May Matter Now
A new Fed Chair is set to take over in mid-May. His stated preferences — lower rates, a smaller balance sheet, and less reliance on forward guidance — suggest a potential shift away from the reflexive “Fed put” mindset that has shaped markets for over a decade. If that transition plays out, the assumption that any funding stress will be met immediately with balance sheet support deserves a fresh look.
At the same time, recent data points to tightening funding conditions. The direction mirrors setups seen ahead of past stress episodes — with September 2019 as a key reference, when a plumbing issue beneath an otherwise calm market quickly escalated within days.
None of this guarantees an equity drawdown. But it may help explain why recent rallies feel flow-driven, why credit markets are showing subtle divergences, and why assets like precious metals and crypto have been soft.
This is the framework I rely on day to day.
For Daily Application
The edge isn’t in the components themselves — it’s in reading them in real time and understanding when their interaction starts to matter for markets. Watching how SOFR, the TGA, and reserve levels are evolving right now, how they line up with signals from credit and FX basis, and how all of that compares with the price action in the tape. Then looking for the confirming cues that indicate whether a liquidity drain has already been absorbed — or is still ahead.
WTI advances as the Strait of Hormuz remains mostly closed, constraining Middle East supply. Oil’s upside could be limited as markets evaluate ceasefire chances and a possible reopening following Iran’s latest proposal to the US. Meanwhile, six Iranian tankers have been turned back under the US blockade, while an ADNOC LNG vessel has passed through Hormuz and is approaching India.
West Texas Intermediate (WTI) crude extends its advance for a second straight day, trading near $95.20 per barrel during Tuesday’s Asian session. Prices are being supported as the Strait of Hormuz remains largely closed, tightening energy supplies from the Middle East.
Still, further upside may be limited as investors assess the chances of a durable ceasefire and a possible reopening of the waterway following Iran’s latest proposal to the United States. Tehran has reportedly conveyed via Pakistan that it could de-escalate if Washington lifts its naval blockade, adjusts transit rules through Hormuz, and provides assurances against future military action.
A US official said Monday that President Donald Trump is not satisfied with the proposal, while Iranian sources indicated that Tehran is holding off on addressing its nuclear program until hostilities end and shipping disputes in the Gulf are resolved.
Now in its ninth week, the conflict has driven energy prices higher and disrupted key supply chains, with the International Energy Agency (IEA) warning of a potential supply shock alongside slowing demand risks.
The standoff remains unresolved, with Iran restricting flows through the Strait—responsible for roughly 20% of global oil and gas transit—while the US continues its blockade of Iranian ports.
Ship-tracking data cited by Reuters highlights the disruption, showing six Iranian tankers forced to turn back amid the blockade. However, an LNG vessel operated by ADNOC has managed to pass through the Strait of Hormuz and is reportedly approaching India.
The U.S. Federal Reserve is set to release its FOMC statement this weekend, and no changes to the Federal Funds Rate are anticipated. With that largely priced in, short-term traders are likely to shift their attention toward evolving market sentiment. This is being shaped by ongoing uncertainty surrounding the Middle East conflict, its impact on energy prices, and the increasingly delicate relationship between the EU and the U.S., which could carry broader economic implications.
As a result, the Fed’s upcoming policy remarks may take a secondary role, while financial institutions remain more focused on adjusting their medium-term outlooks in response to the uncertainties linked to the situation involving Iran.
Peaks and Troughs in a Shifting Environment
Short-term traders attempting to capture small movements in EUR/USD have found no shortage of opportunities, and this environment is likely to persist in the near term. The challenge, however, lies in identifying when prevailing market drivers will maintain their influence or abruptly reverse course. Rapidly shifting conditions have dealt heavy losses to retail Forex traders, while even large institutional players have likely felt the impact.
Although EUR/USD may appear oversold at current levels, geopolitical noise—particularly from the White House and developments involving Iran—remains elevated heading into the weekend. Early trading on Monday could face immediate pressure as global markets react. One potential support for traders is that markets already closed Friday on a cautious note, suggesting participants may be partially prepared for further volatility. Whether this leads to renewed selling in EUR/USD or a rebound driven by bargain buying remains uncertain.
Trading Gauge for the Week Ahead
A swift peace resolution in the conflict involving Iran appears unlikely in the near term. That said, the Trump administration has at times surprised global markets with unexpectedly optimistic signals, quickly shifting sentiment.
For now, the outlook offers little indication of imminent compromise, which could weigh on EUR/USD in the short term. However, before sellers become overly aggressive or bullish traders turn too pessimistic, a broader perspective is worth considering. A three-month view shows the pair still trading near the midpoint of its range.
EUR/USD has previously declined to similar levels only to rebound sharply—something traders should keep firmly in mind.
EUR/USD Weekly Outlook: Market Focus Turns to Uncertainty and Volatility
EUR/USD is expected to trade within a speculative range of 1.1610 to 1.1790.
Speculators should remain cautious about their expectations, as worst-case scenarios may already be priced in by financial institutions. This raises the possibility that EUR/USD might not revisit the lows seen in March, with the 1.1700 level potentially acting as support. However, if the pair breaks below 1.1700 early in the week, a move toward the 1.1670 support zone would not be unreasonable. Predicting near-term direction remains difficult, given the ongoing exchange of threats and rhetoric between the U.S. White House and Iran.
More broadly, the Forex market has been particularly challenging to navigate over the past two months, and these conditions are unlikely to ease soon. Rapid shifts in sentiment continue to drive sharp price swings in EUR/USD and other major currency pairs. While forming an opinion on current market dynamics is relatively straightforward, establishing a confident short-term outlook has proven far more difficult—contributing to the pronounced whipsaw price action seen in EUR/USD.
USD/JPY weakens below 159.50 during Monday’s Asian session, extending its pullback from near the key 160.00 psychological level. The pair is pressured by renewed US dollar softness and lingering fears of Japanese intervention, while a slight improvement in risk sentiment also supports the yen. Meanwhile, traders are largely looking past tensions between the US and Iran, turning their focus to this week’s monetary policy decisions from the Bank of Japan and the Federal Reserve.
Technical Analysis
Aside from a few brief knee-jerk moves, USD/JPY has been trading within a range since mid-March. Considering the recent solid rebound from the technically important 200-day EMA, this price action can still be seen as a phase of bullish consolidation, supporting a positive overall outlook.
Momentum indicators also point to a constructive setup rather than an overstretched market. The RSI sits near 57, indicating sustained upward pressure without entering overbought territory. Meanwhile, the MACD remains slightly below the zero line, suggesting only mild bearish momentum that has yet to threaten the broader uptrend.
That said, buyers should wait for a clear and sustained move above the 160.00 psychological level before targeting further upside. In the meantime, any pullbacks are likely to be viewed as corrective within the broader bullish structure, as long as USD/JPY stays above the key long-term support near 154.76. A decisive break below this level would be needed to indicate a more significant shift in trend.
Fundamental Analysis
USD/JPY extends last week’s rebound from the mid-157.00s, advancing for a fourth consecutive day on Thursday. The Japanese yen remains under pressure due to economic concerns tied to escalating Middle East tensions and expectations that the Bank of Japan may delay further rate hikes. At the same time, ongoing geopolitical uncertainty reinforces the US dollar’s safe-haven appeal, pushing the pair to a one-and-a-half-week high during the early European session.
Although US President Donald Trump announced a temporary extension of the Iran ceasefire just before its expiration, investors remain doubtful about any lasting de-escalation. Limited progress in negotiations, tensions surrounding the Strait of Hormuz, and continued friction—highlighted by the US naval blockade of Iranian ports—keep risks elevated. Iran’s chief negotiator, Mohammad Bagher Ghalibaf, stated that reopening the strategic waterway is not feasible under current conditions. These developments raise concerns about disruptions to energy supplies, posing potential strain on Japan’s economy and weighing further on the yen.
Meanwhile, reports indicate that the Bank of Japan is inclined to keep policy unchanged this month, as uncertainty over the Middle East conflict clouds the economic and inflation outlook. This adds to downward pressure on the yen, though the central bank is still expected to signal readiness to tighten policy as early as June amid rising inflation. Additionally, speculation that Japanese authorities could intervene to support the currency may limit further yen weakness and cap USD/JPY gains near the 160.00 psychological level. Even so, any meaningful pullback appears limited given the underlying strength of the US dollar.
Higher crude oil prices are also reviving inflation concerns, reducing expectations of a dovish stance from the Federal Reserve. This pushes US Treasury yields higher and continues to support the dollar, suggesting that the overall bias for USD/JPY remains tilted to the upside. Traders now turn to upcoming US data, including weekly jobless claims and flash PMI releases, though attention is likely to remain focused on developments in the US–Iran situation, which could drive further market volatility.
The US Dollar Index (DXY) edges lower, trading near 98.45 during Monday’s early Asian session.
The decline comes after Iran proposed a deal to the United States to reopen the Strait of Hormuz.
Investors are now focusing on the Federal Reserve’s interest rate decision, scheduled for Wednesday.
The US Dollar Index (DXY), which tracks the Greenback against a basket of six major currencies, is hovering around 98.45 during Monday’s Asian session. The index is under slight pressure following reports that Iran has put forward a proposal to the United States aimed at reopening the Strait of Hormuz.
According to Bloomberg, Iran’s latest proposal includes delaying nuclear negotiations while extending the ceasefire to allow both sides to work toward a more lasting resolution to the conflict. Optimism around a potential de-escalation in US–Iran tensions and broader stability in the Middle East could weigh on the US Dollar against its peers.
However, on Sunday, US President Donald Trump instructed Jared Kushner and Steve Witkoff to cancel their planned visit to Pakistan—currently mediating talks—remarking that Iran’s offer was “substantial, but insufficient.”
Meanwhile, market attention is firmly shifting to the Federal Reserve’s policy decision due on Wednesday. The central bank is widely expected to hold interest rates steady in the 3.50%–3.75% range, where they have remained since January. Analysts at Deutsche Bank suggest that any shift toward a more hawkish policy outlook—particularly if driven by sustained oil-related inflation—could provide support for the DXY.
Silver ticks up as safe-haven demand strengthens amid stalled U.S.–Iran negotiations.
President Donald Trump canceled a planned diplomatic visit to Pakistan that could have enabled direct talks with Iran.
Meanwhile, the Federal Reserve is expected to proceed cautiously, with gradual rate cuts anticipated under incoming Chair Kevin Warsh.
Silver (XAG/USD) extends its gains for a second straight session, hovering near $76.00 per troy ounce during Monday’s Asian trading hours. The metal is being supported by rising safe-haven demand as US–Iran peace negotiations remain at an impasse.
Donald Trump canceled a planned delegation to Pakistan that could have facilitated direct discussions with Iran. Over the weekend, he instructed Jared Kushner and Steve Witkoff to skip the trip, noting that Iran had “offered a lot, but not enough.” Trump added that Iran could initiate talks directly, emphasizing the availability of secure communication channels.
On the other side, Masoud Pezeshkian reiterated that Iran would not engage in negotiations imposed under pressure or threats.
Meanwhile, shipping activity through a key strategic waterway remains heavily constrained due to Iran’s control and a US naval blockade, raising concerns about prolonged disruptions and lending support to crude oil prices.
Elevated energy costs are fueling inflation worries and reinforcing a more hawkish outlook among central banks, which may cap further gains in non-yielding assets like silver.
At the same time, the Federal Reserve is expected to remain cautious, with markets pricing in gradual rate cuts under incoming Chair Kevin Warsh. The Fed is widely anticipated to hold rates steady at its April meeting, while investors will closely monitor the post-meeting press conference for insights into how policymakers assess rising energy prices and their implications for the longer-term interest rate path.
Silver prices dropped sharply this week as interest rates remained the key driver. Ongoing uncertainty around Middle East tensions—despite some easing—continues to leave traders unsure, with no clear agreement yet between the U.S. and Iran.
The $80 level is acting as resistance; a break above it could push prices toward $90, while $70 appears to be the support floor.
Gold
Gold prices have fluctuated throughout the week, with the region just above $4,600 emerging as a key level. Similar to silver, the market has shown strong sensitivity to interest rate movements. In particular, the U.S. 10-year yield remains crucial, with the 4.30% mark acting as an important threshold. Generally, when yields rise above 4.3%, it tends to put downward pressure on gold.
EUR/USD
The euro moved erratically throughout the week, briefly testing the 1.18 level before finishing slightly lower. Overall, it remains near the upper boundary of the range it has traded in since around this time last year, so no major breakout is expected
That said, interest rates in both the United States and Germany are elevated beyond where they arguably should be, and combined with ongoing war-related news, they are creating significant market distortions. Even so, it’s notable that prices have remained within the same range for an extended period, and as we approach the upper boundary, selling pressure is beginning to re-emerge.
GBP/USD
The British pound traded within a relatively narrow range over the week, as traders weighed the potential end of the war and its implications for interest rates.
The 1.35 level stands out as a key area—not only as a major psychological round number, but also as a point many market participants are watching closely. Overall, the market appears to be searching for direction.
A break above last week’s high could open the door for a move toward the 1.3750 level. On the other hand, if the market pulls back, the 1.3350 area may become a likely target for sellers.
USD/MXN
The US dollar traded choppily against the Mexican peso during the week, testing the 17.5 level.
This zone has previously acted as both support and resistance, suggesting strong market memory. A break above 17.50 could pave the way for a move toward the 17.8 level.
A pullback from this point would likely signal continued consolidation for the US dollar between the 17 and 17.5 levels. While the interest rate differential still favors Mexico, any increase in risk aversion could boost demand for the dollar.
NASDAQ 100
The Nasdaq 100 posted another strong rally over the week, marking its fourth consecutive week of significant gains. Short-term pullbacks could present buying opportunities, especially on a bounce, for those looking to align with the upward momentum. The 26,250 level, which previously acted as resistance, is likely to serve as support if the market pulls back from here.
It’s worth noting that much of the Nasdaq 100’s movement is being driven by developments in artificial intelligence, along with ongoing headlines out of the Middle East.
BTC/USD
Bitcoin moved higher over the week, though it still faces some downward pressure. The climb appears to be gradual, with the market likely aiming toward the $84,000 level—an area that previously acted as support and may now serve as resistance.
USD/CAD
The $72,000 level remains a key area on pullbacks, where buyers may step back in and provide support to push the market higher.
The US dollar initially declined against the Canadian dollar but found support at the 200-week EMA, reversing course and forming a hammer pattern.
A break above the 1.37 level could open the way for a move toward 1.38. The interest rate differential continues to favor the US dollar, which should remain a key driver of direction.
The U.S. dollar rose on Thursday, supported by increased demand for safe-haven assets as tensions in the Middle East escalated.
Although the U.S. and Iran agreed to extend their ceasefire, continued attacks on vessels near the strategic Strait of Hormuz, along with strong rhetoric from both Washington and Tehran, dampened investor risk appetite.
By 15:56 ET (19:57 GMT), the U.S. Dollar Index, which measures the greenback against a basket of six major currencies, had gained 0.3% to 98.77.
Trump orders U.S. forces to destroy boats laying mines in the Strait of Hormuz.
Former U.S. President Donald Trump on Thursday said he had instructed the U.S. Navy to “shoot and kill” any vessels attempting to lay mines in the Strait of Hormuz. He added that American mine-clearing operations were already underway and would be intensified threefold. Meanwhile, Axios reported, citing a U.S. official, that Iran had deployed additional mines in the area.
Trump’s remarks followed escalating activity around the Strait of Hormuz, a crucial shipping route that carries about one-fifth of the world’s oil and gas. Its effective closure since the onset of the Middle East conflict has triggered what is being described as the largest oil supply disruption in history.
The U.S. military also announced it had seized an Iran-linked oil tanker, releasing footage that allegedly showed American forces boarding the vessel in the Indian Ocean. At the same time, Iran published a video appearing to show its troops taking control of a cargo ship near the strait.
Earlier, Tehran reportedly attacked three ships on Wednesday and seized two of them. Tensions have been fueled further by the ongoing U.S. naval blockade of Iranian ports and coastline, with U.S. Central Command stating that 33 vessels had been redirected since the blockade began.
Uncertainty over future negotiations between Washington and Tehran continues to weigh on markets. While both sides remain deadlocked over the strait and the blockade, the Wall Street Journal reported that mediators from Pakistan, Turkey, and Egypt are attempting to arrange talks that could take place as early as Friday. Meanwhile, Israel’s N12 News reported that Iran’s Ghalibaf had stepped down from the negotiating team following pressure from the Islamic Revolutionary Guard Corps.
Strong economic data and shifting Fed rate expectations support the dollar.
The U.S. dollar also gained support from stronger-than-expected preliminary PMI data. According to S&P Global, business activity in the U.S. picked up in April after slowing to near stagnation in March following the outbreak of conflict in the Middle East.
José Torres, senior economist at Interactive Brokers, noted that economic conditions improved slightly, with consumer demand, production, employment, and business sentiment remaining resilient despite supply chain disruptions and rising prices that continue to weigh on performance and outlook.
He added that the manufacturing sector stood out, driven by proactive inventory building in response to the Strait of Hormuz closure, as well as policy incentives introduced last year, which helped push S&P Global’s Flash PMI above expectations.
At the same time, expectations that the Federal Reserve may keep interest rates unchanged this year have strengthened. A rebound in oil prices above $100 per barrel has heightened concerns about inflation, raising the possibility that central banks could even consider rate hikes instead of cuts.
Kevin Warsh, nominated by Donald Trump to lead the Fed, told lawmakers on Tuesday that he had made no promises to lower borrowing costs and stressed the importance of the central bank’s independence, despite Trump’s repeated calls for aggressive rate cuts to support economic growth.
Meanwhile, a Reuters poll indicated that investors expect the Fed to hold off on any rate cuts for at least six months.
Eurozone output hits a 17-month low, while South Korea records robust GDP growth.
Eurozone business activity fell to a 17-month low, pushing the euro down 0.2% to $1.1687 after S&P Global data showed the private sector slipping back into contraction in April, ending 15 months of expansion. According to Chris Williamson, the region is facing mounting economic strain from the Middle East conflict, which is both dragging growth and fueling inflation, while supply shortages risk worsening the outlook further.
Meanwhile, the British pound dropped 0.3% to $1.3467, and the Japanese yen weakened with USD/JPY edging up to 159.68. The South Korean won also declined, with USD/KRW rising 0.4% to 1,483.48, despite strong data showing South Korea’s economy recorded its fastest growth in nearly six years in Q1 2026, driven largely by a surge in AI-related chip exports.
Gold edged lower from around $4,750 in Thursday’s Asian session, giving back part of the previous day’s gains as renewed US–Iran tensions over the Strait of Hormuz kept the US Dollar supported and weighed on sentiment. However, expectations that the Federal Reserve may hold off on further rate hikes continued to limit downside pressure on the non-yielding metal.
Technical Analysis
Technically, XAU/USD shows a mildly bearish short-term bias as it remains below the 100-period SMA at $4,739.32, the 200-period SMA at $4,770.64, and the 20-period SMA at $4,776.89. The RSI, hovering near 44, points slightly lower, while the Momentum indicator also trends modestly below the midline, signaling weakening upside traction.
On the upside, immediate resistance is seen at the 100-period SMA, followed by stronger hurdles at the 200-period SMA and the 20-period SMA, creating a dense resistance cluster that bulls need to clear to neutralize bearish pressure. With limited nearby support from indicators, a further decline could expose gold to retesting recent lows around $4,668 if selling pressure intensifies.
On the daily timeframe, however, the broader outlook remains more constructive. Price continues to hold above the 20-day SMA at $4,693.12 and the 100-day SMA at $4,731.60, which acts as a key near-term support area. The much lower 200-day SMA at $4,236.91 underscores the longer-term uptrend. Meanwhile, the RSI near 48 and neutral Momentum readings suggest consolidation, with bullish momentum cooling rather than reversing decisively.
Fundamental Analysis
Spot Gold was little changed on the day, hovering near the $4,730 level as markets grappled with rising uncertainty stemming from fresh Middle East tensions that have pushed the situation into a stalemate.
After a series of back-and-forth developments, the United States and Iran failed to restart negotiations and missed the scheduled meeting in Pakistan. US President Donald Trump later said the ceasefire would remain in place until Iran presents a “unified proposal,” while Tehran dismissed the extension as “meaningless” and warned of a potential military response.
Meanwhile, tensions escalated around the Strait of Hormuz, with reports suggesting renewed disruptions to shipping routes, including vessel seizures and attacks on oil transport. Midweek, Trump indicated that talks with Iran could still take place next Friday, though Iranian media quickly denied any such plans, stating there were no current intentions to negotiate with Washington.
With both the ceasefire and diplomatic prospects in doubt, markets remain directionless, further complicated by anticipation of key central bank meetings next week.
In this environment, crude oil has strengthened notably, with West Texas Intermediate (WTI) climbing to around $92 per barrel, its highest level since last Friday. The rally reflects growing concerns over supply risks and skepticism that a swift resolution in the Middle East is forthcoming.


")
")
")
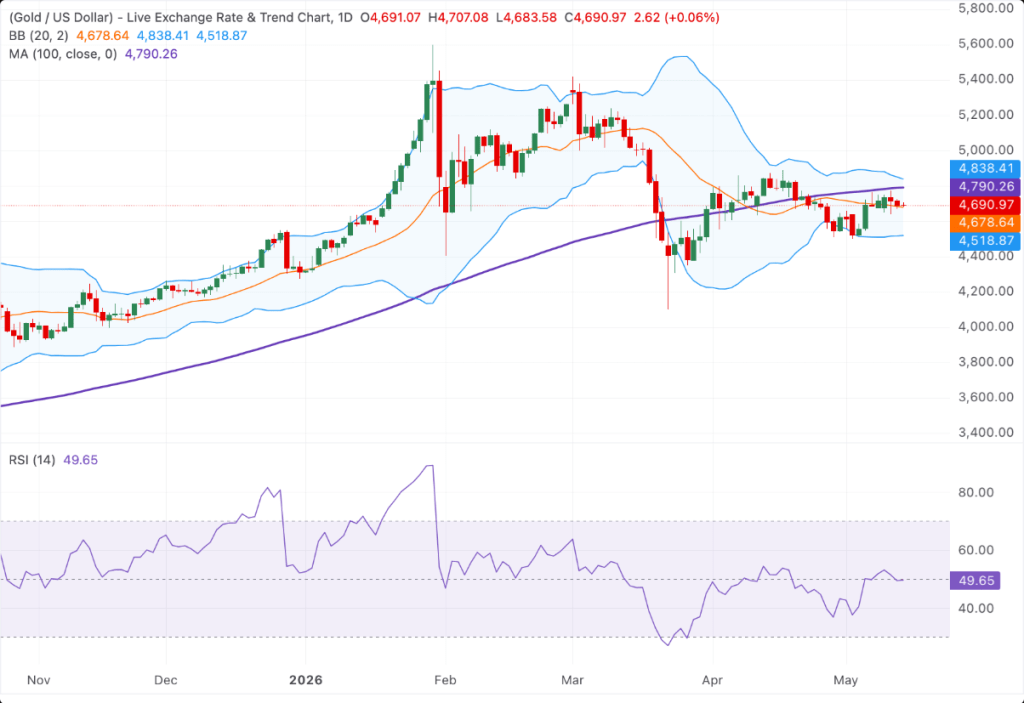


")
")
")
")
")
")
")
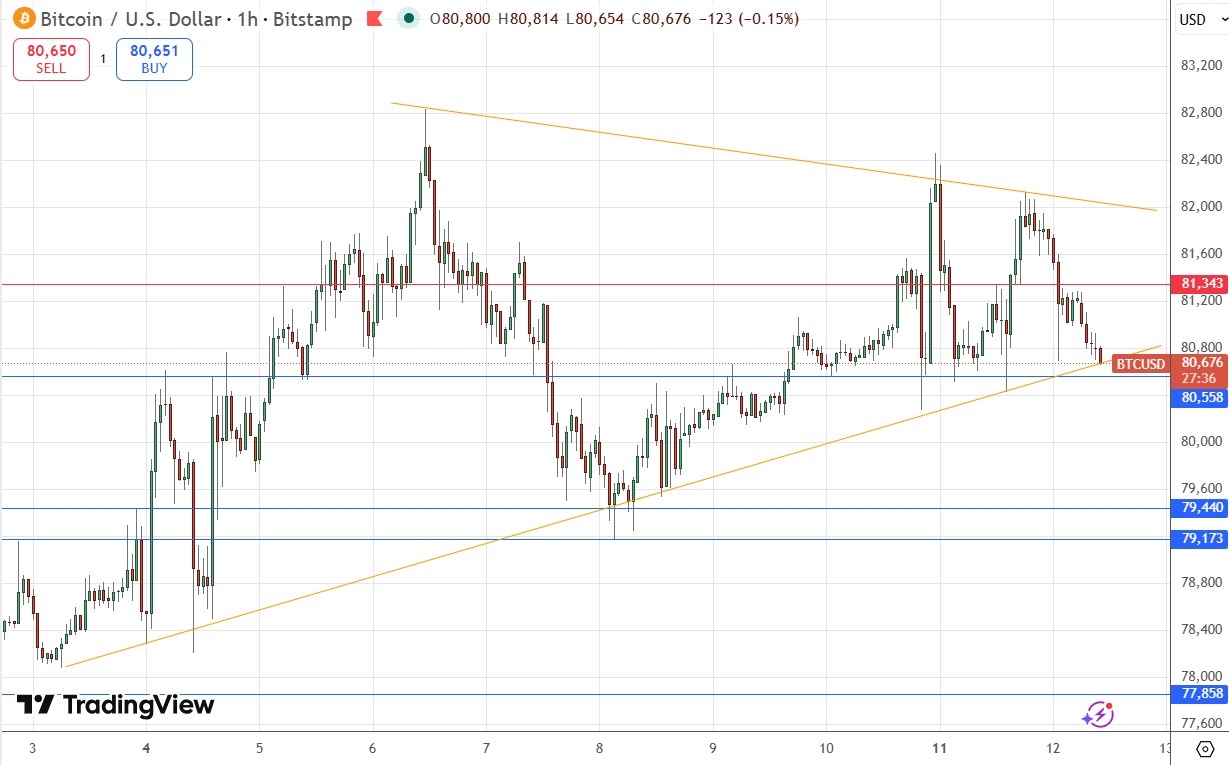

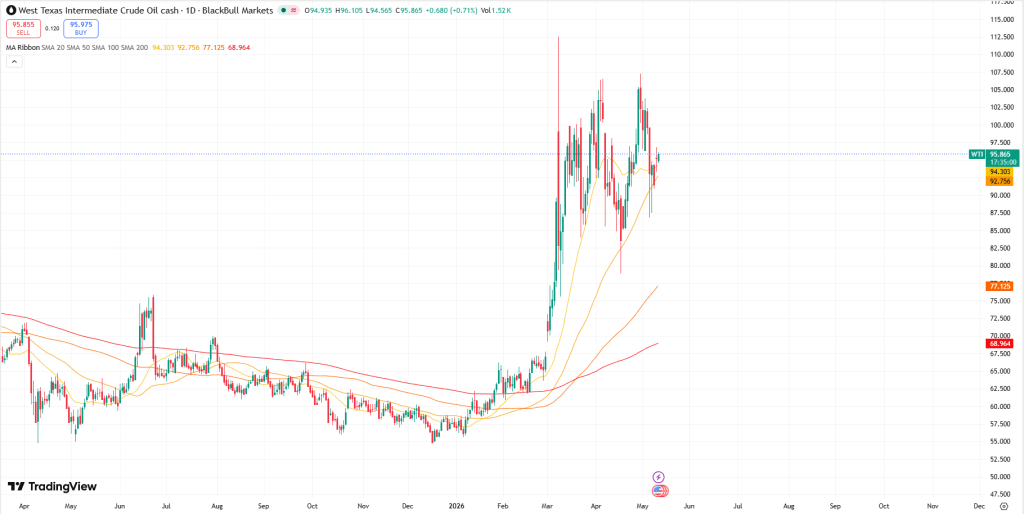
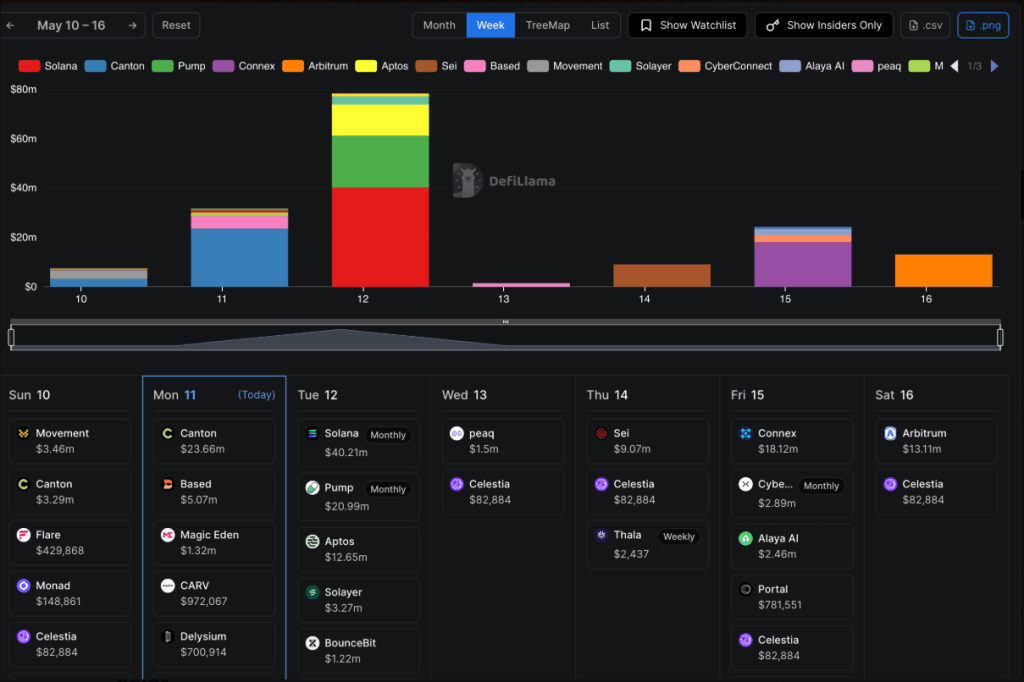
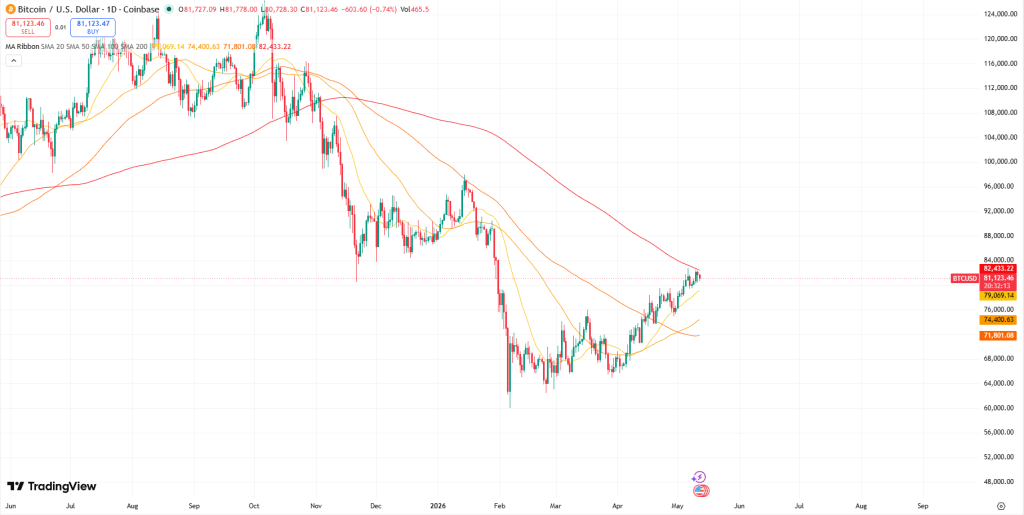


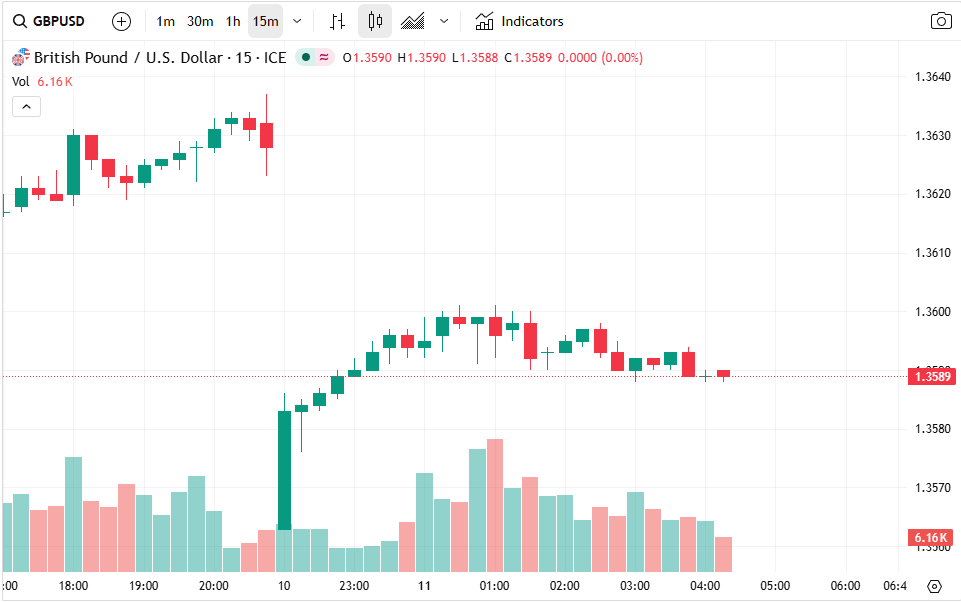


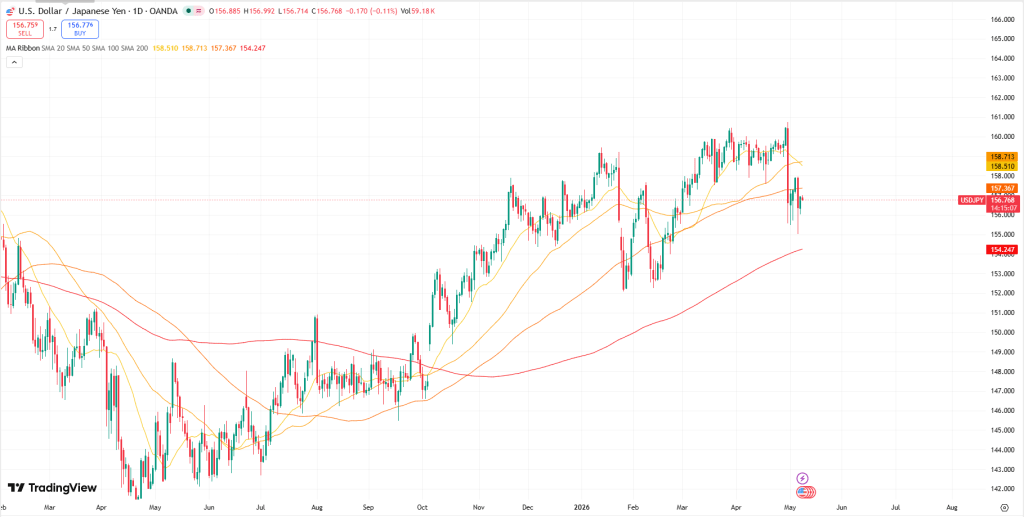
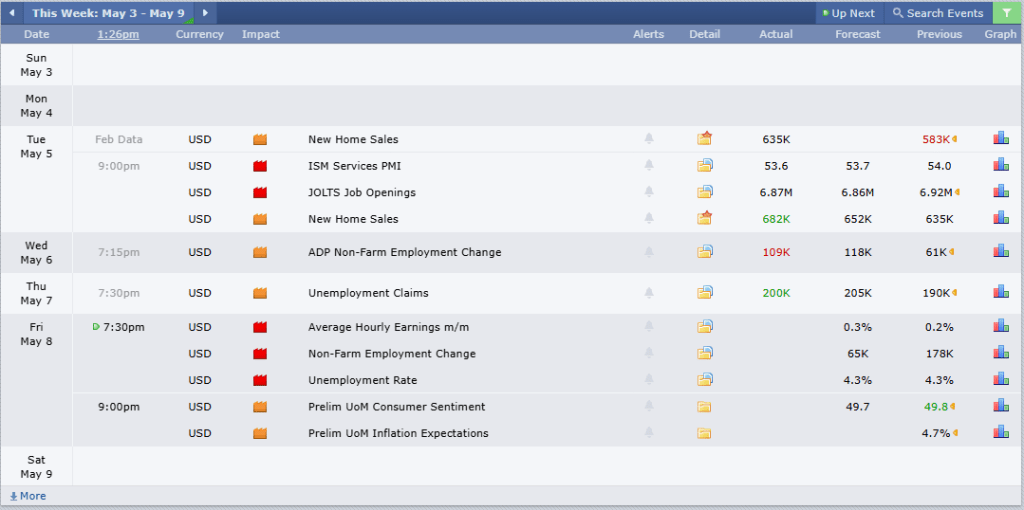

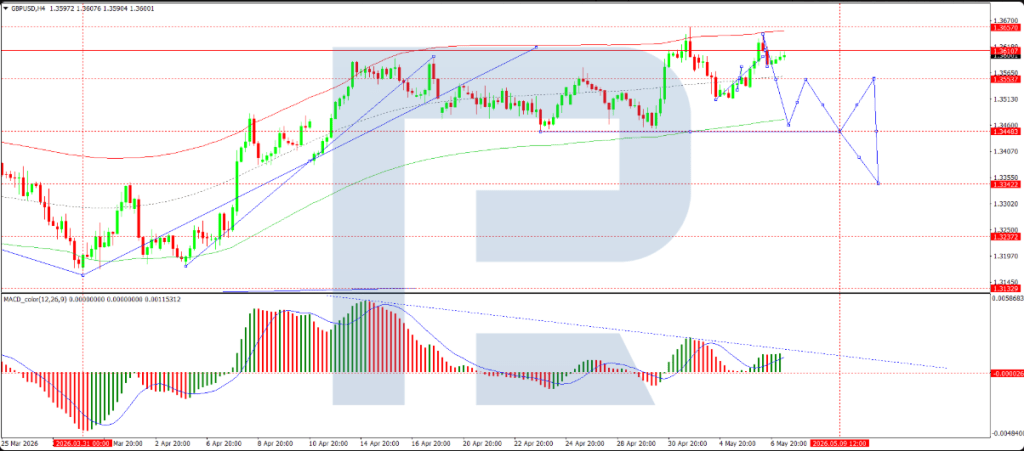
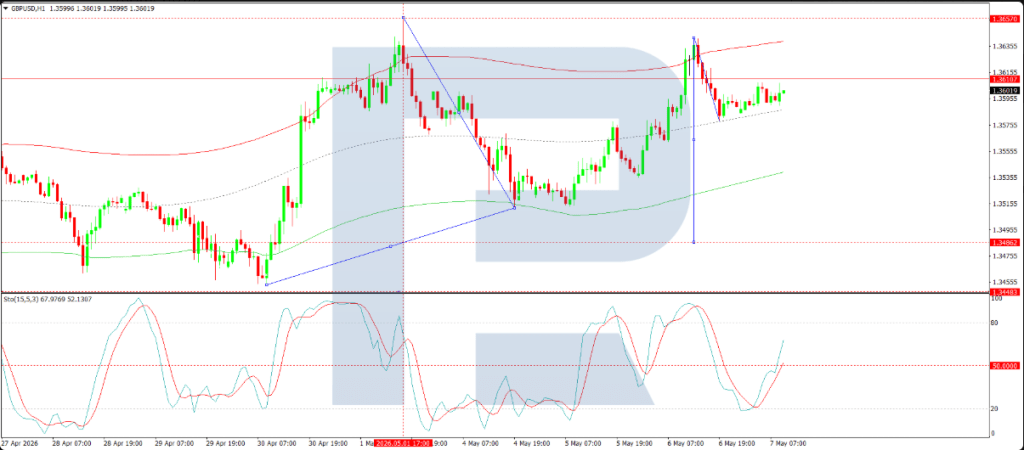

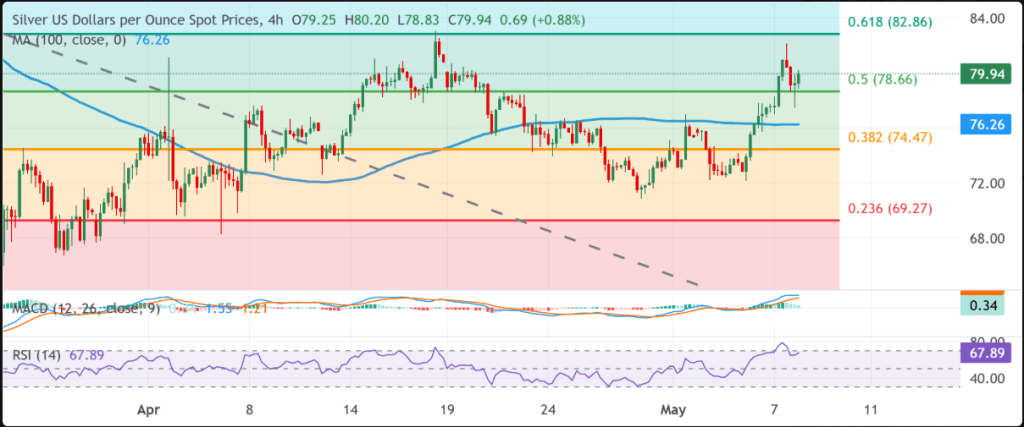

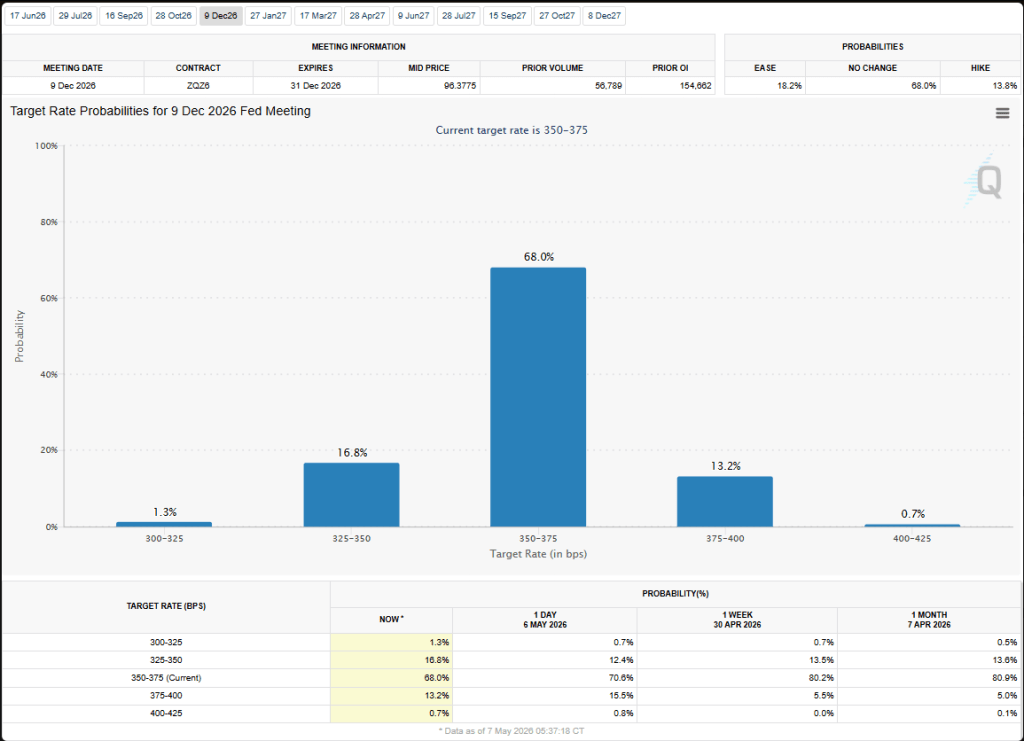
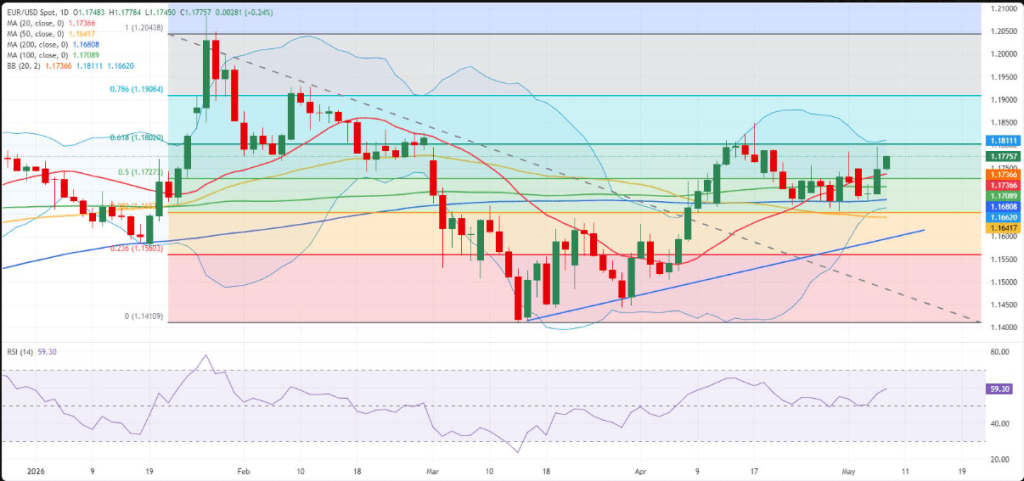

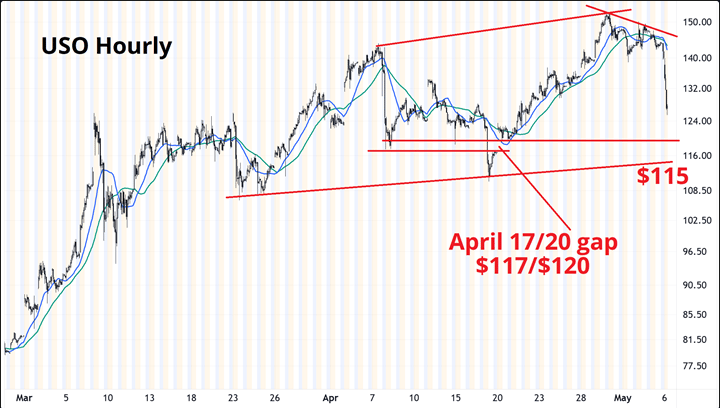
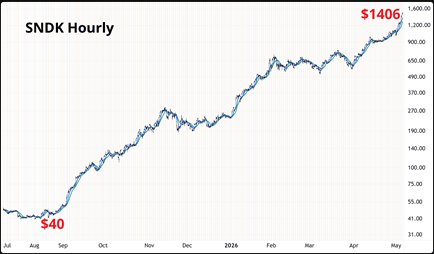
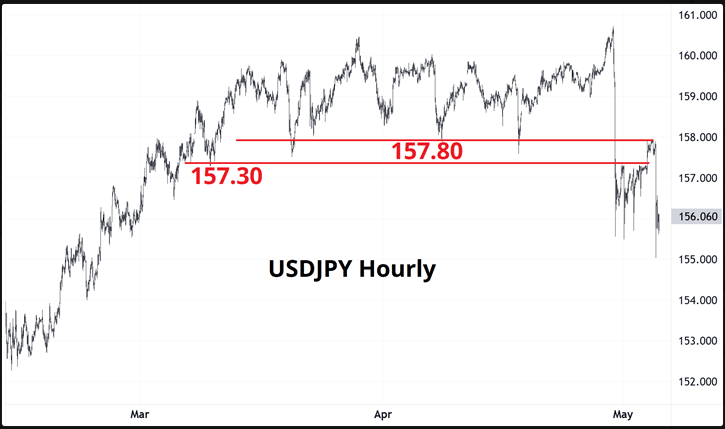
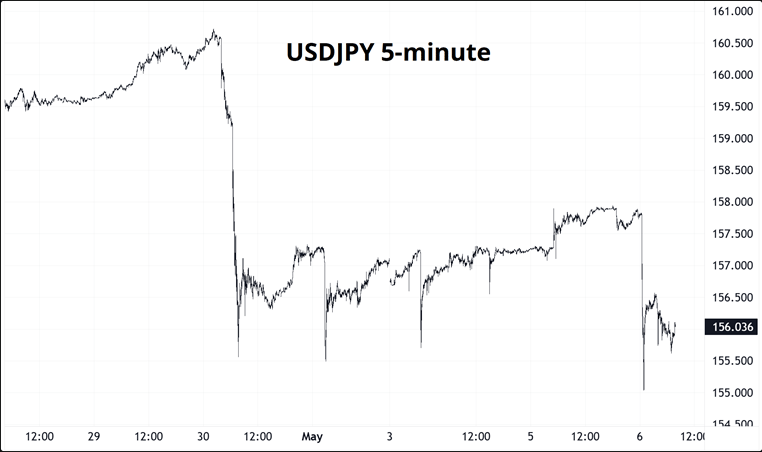
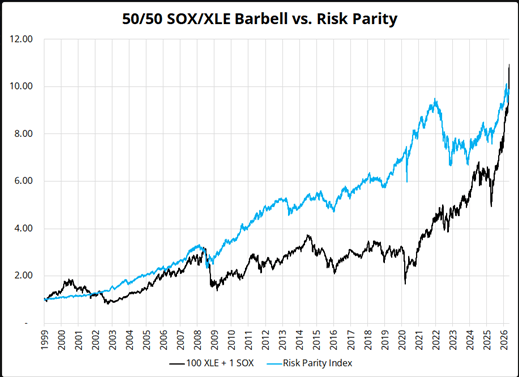
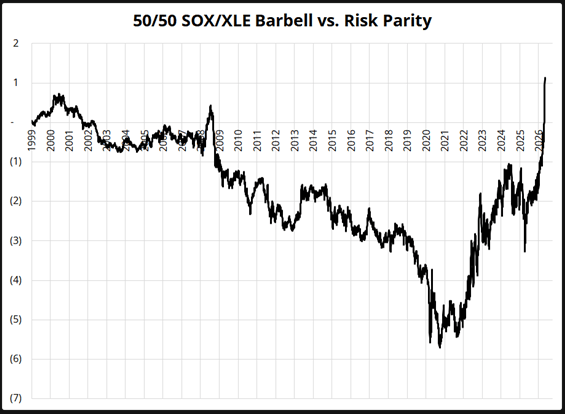
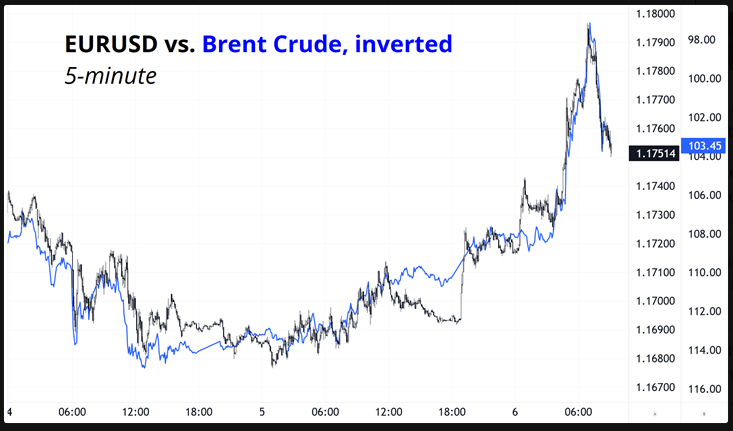
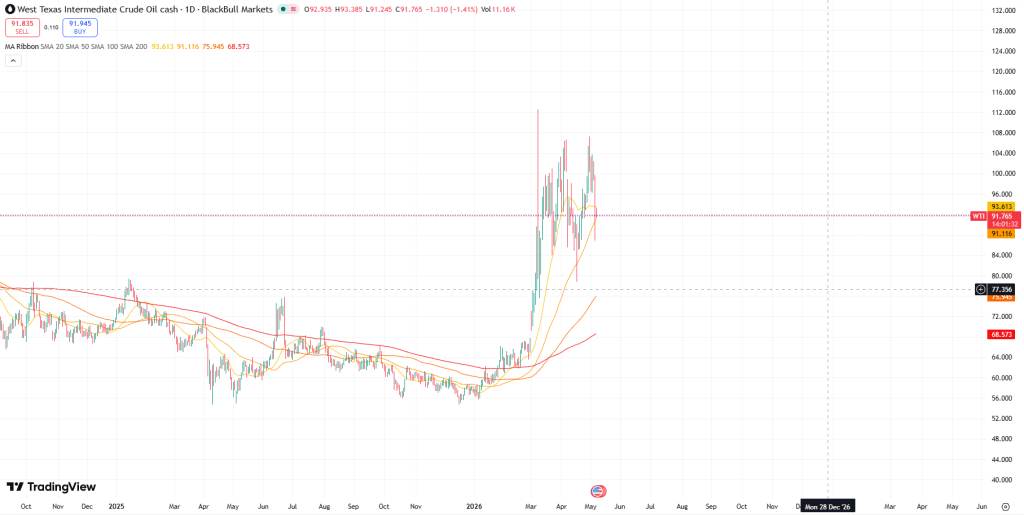
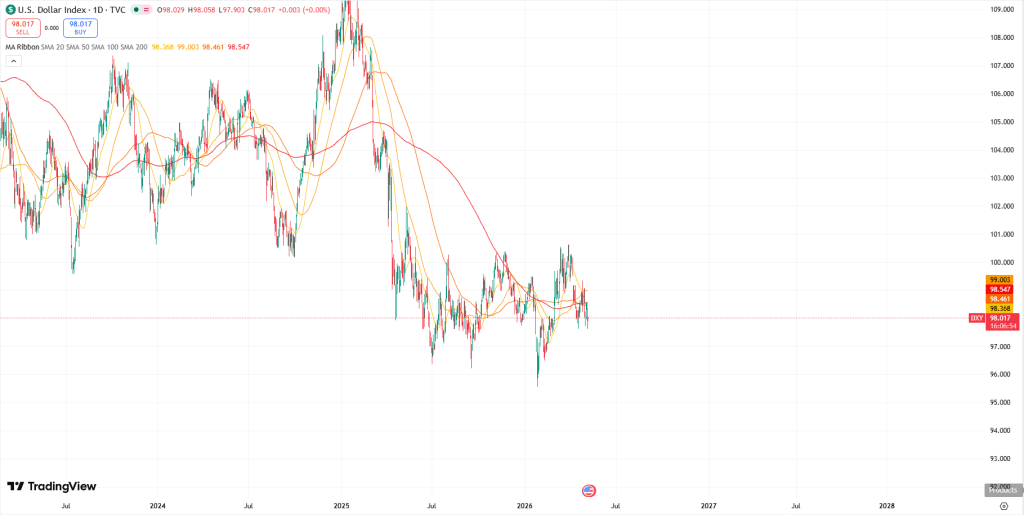
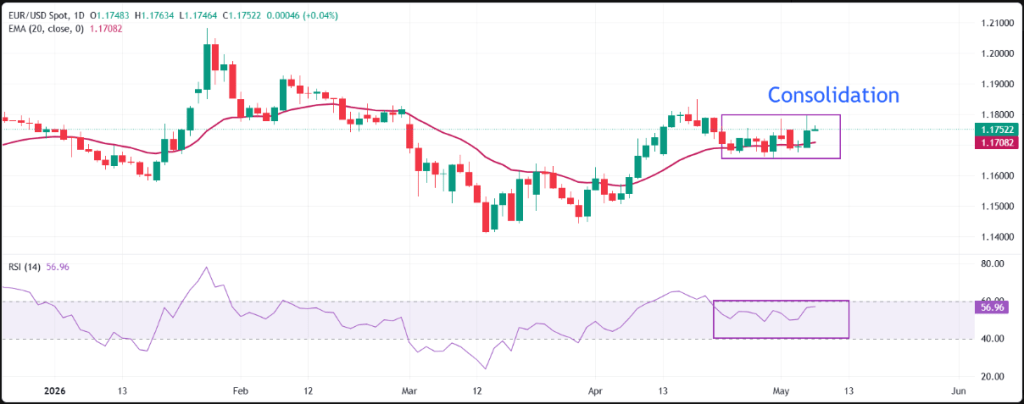
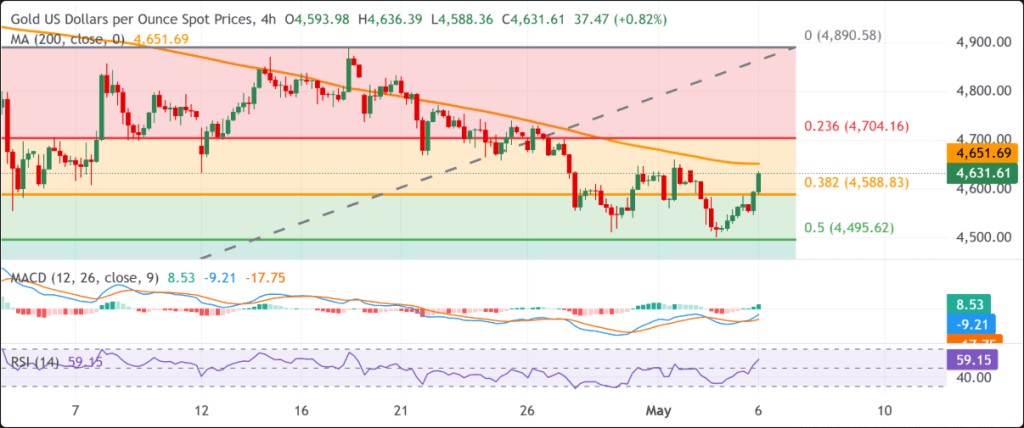


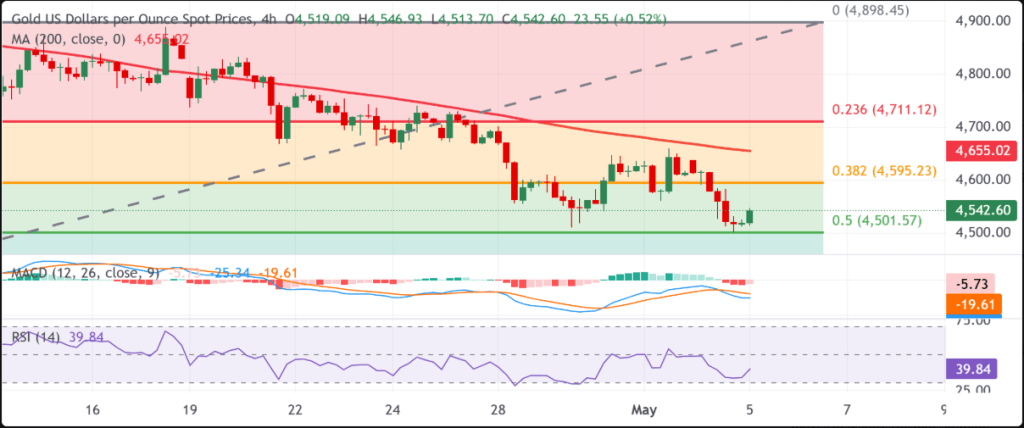


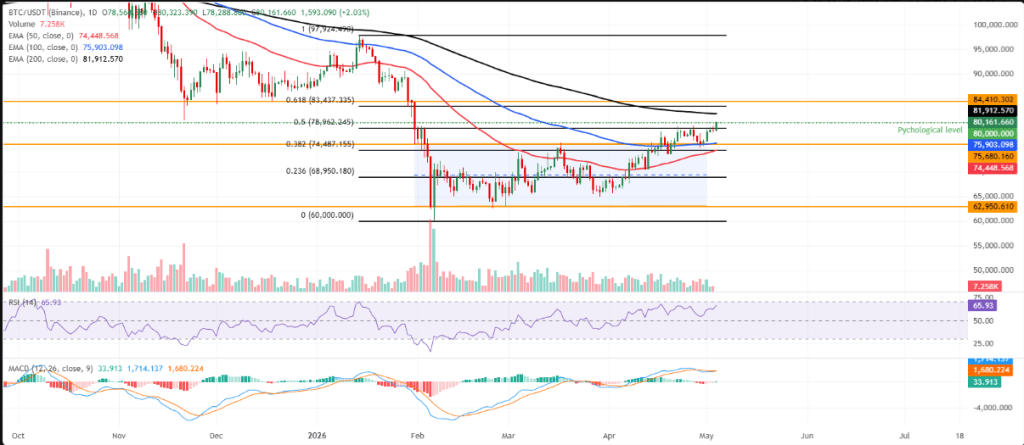
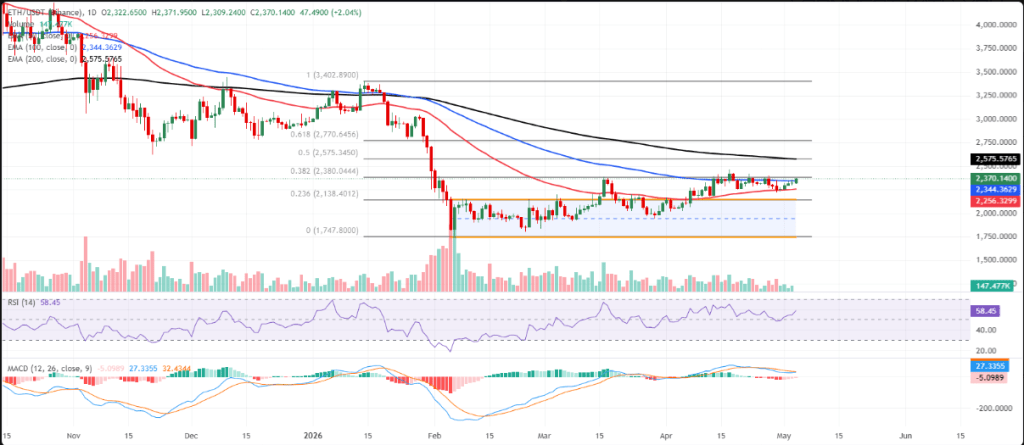
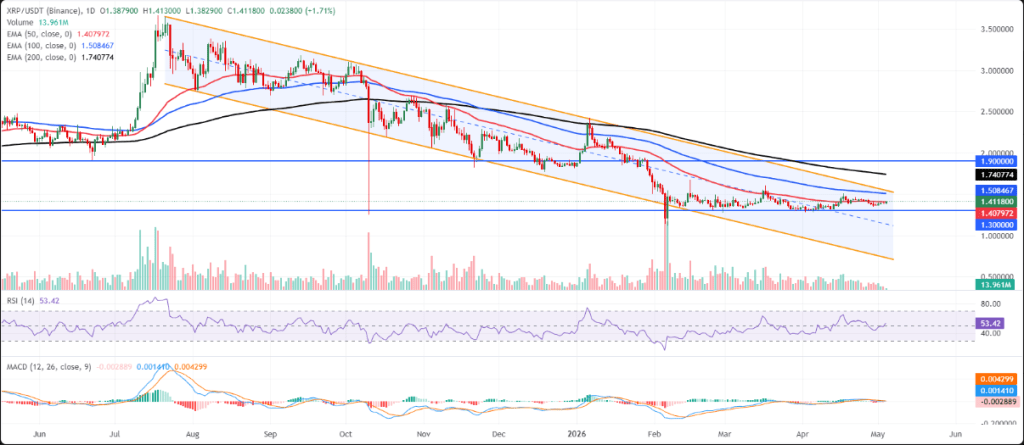


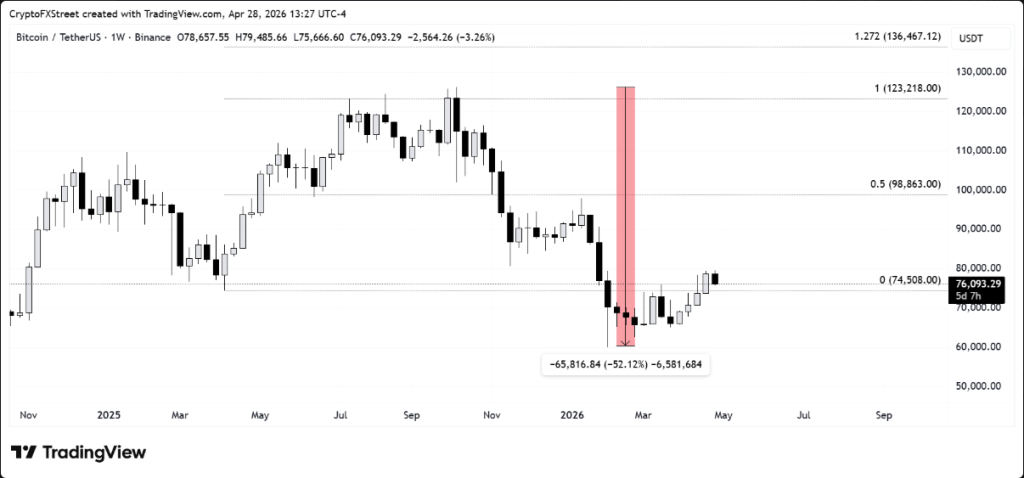
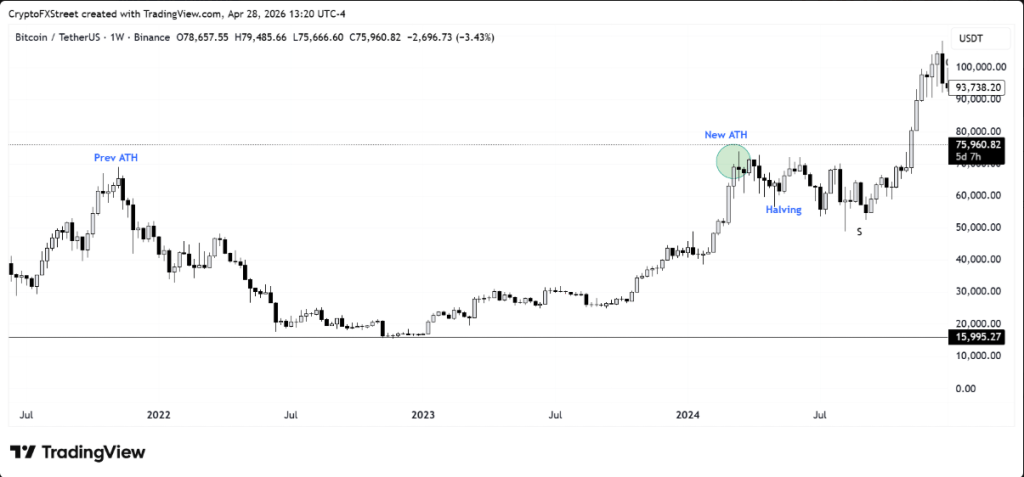
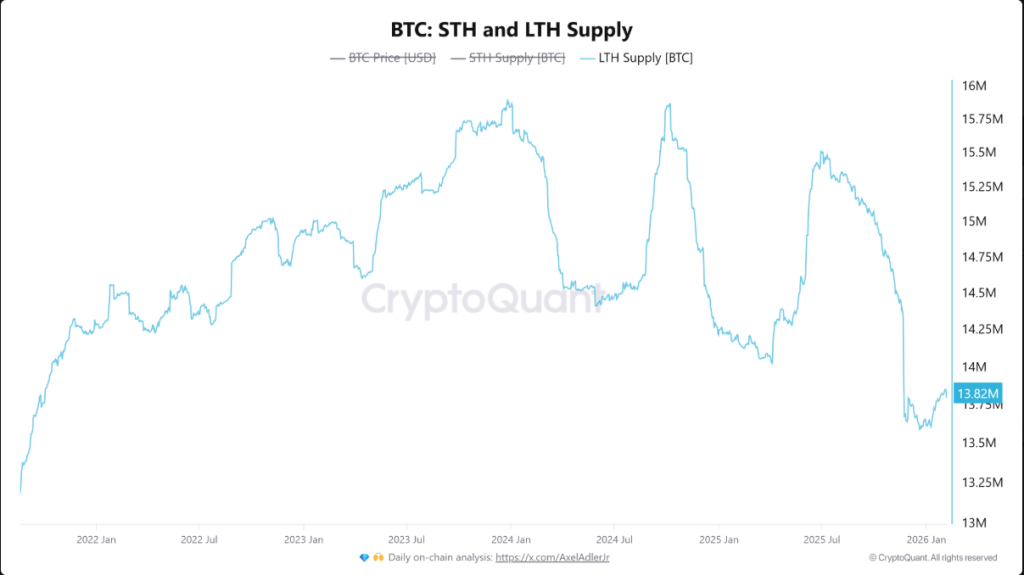
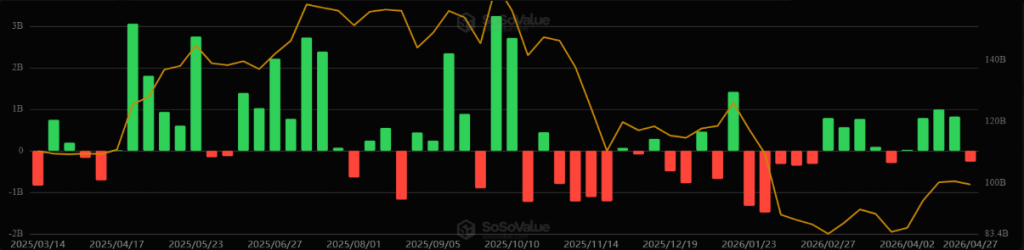
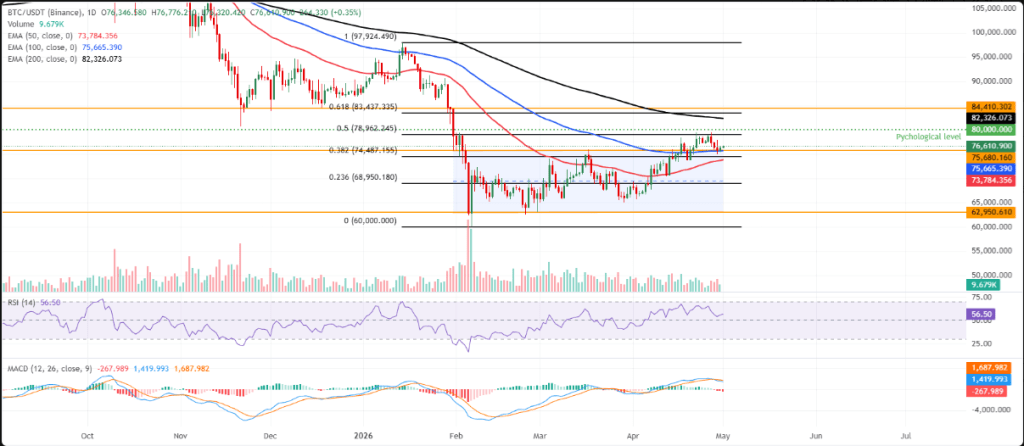
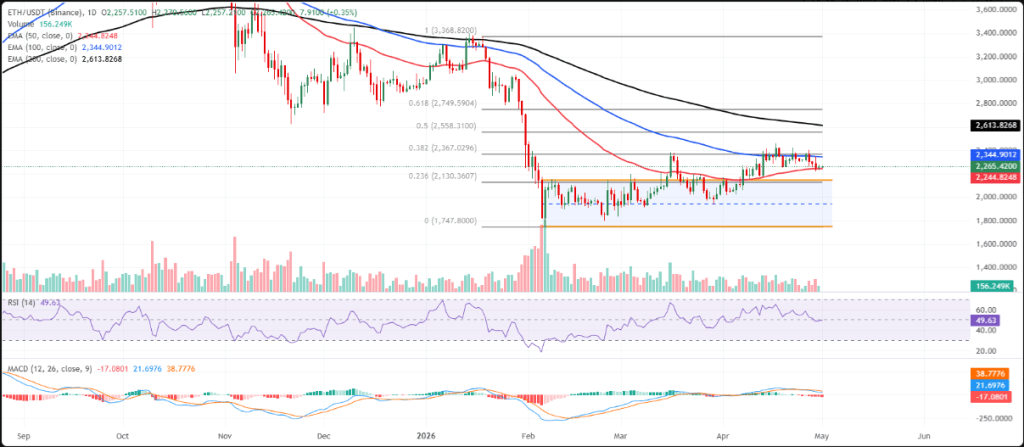
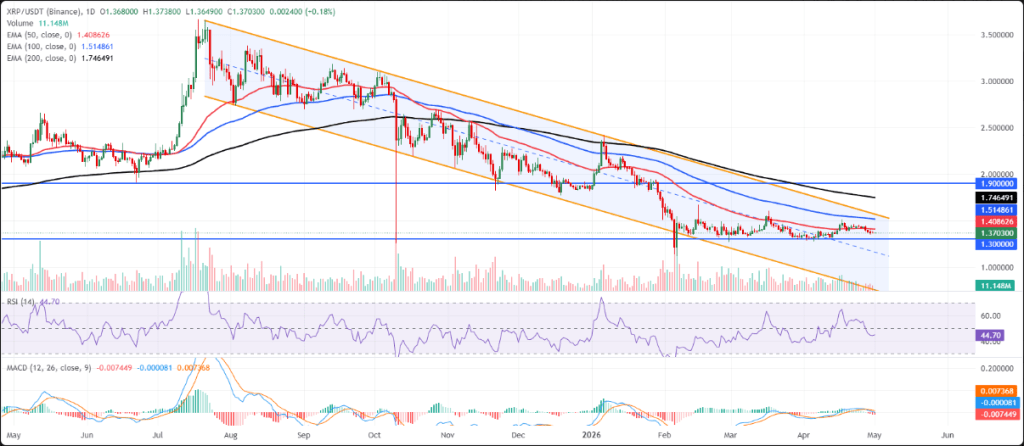
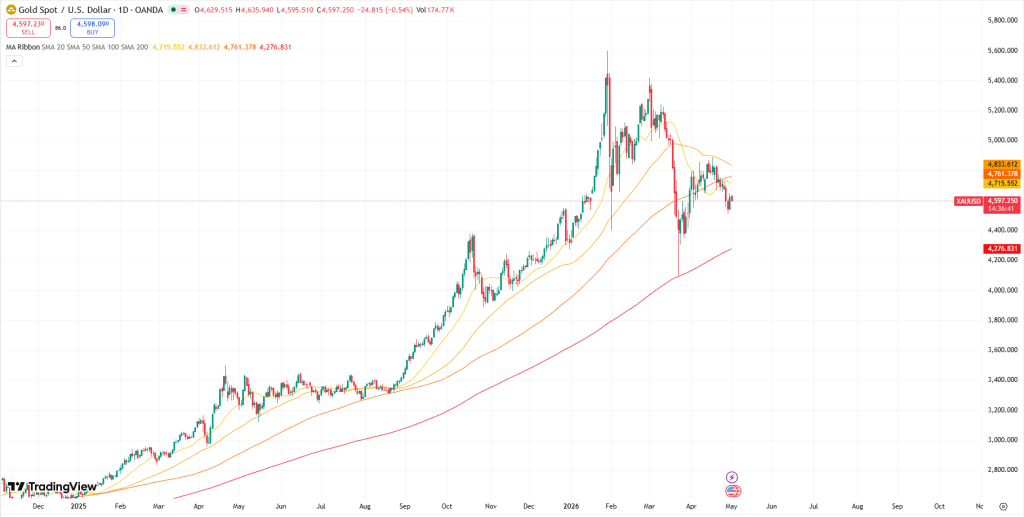
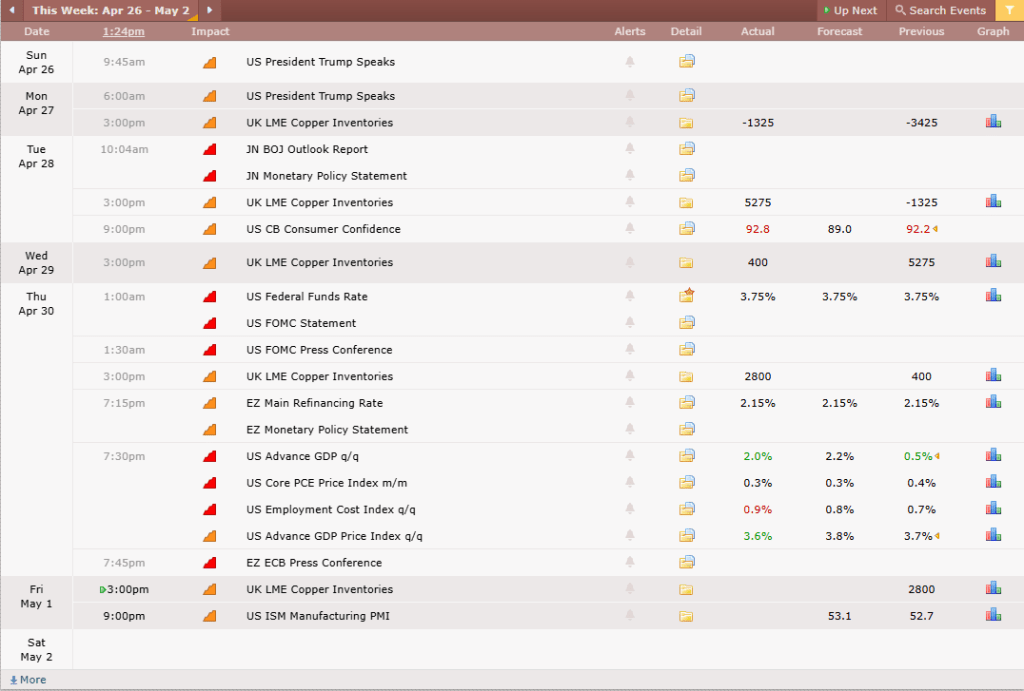
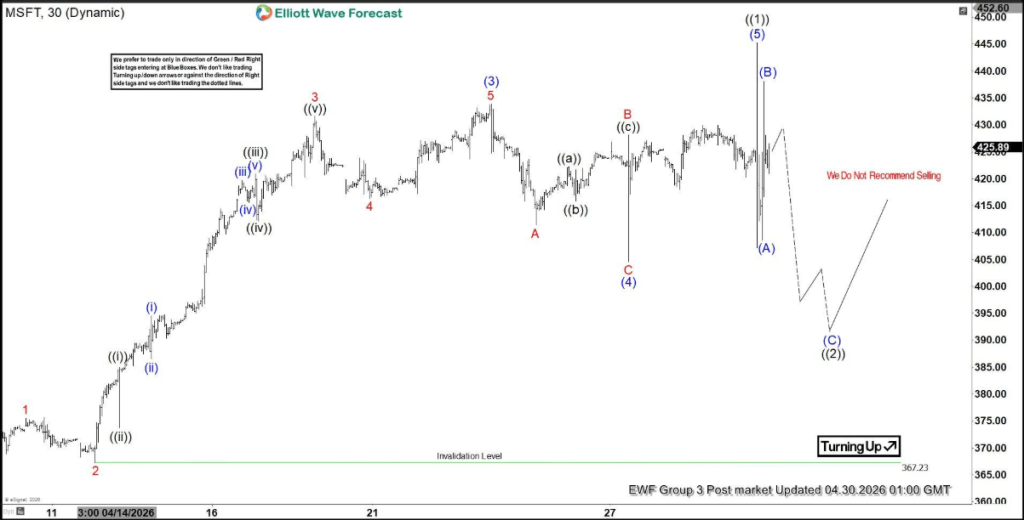
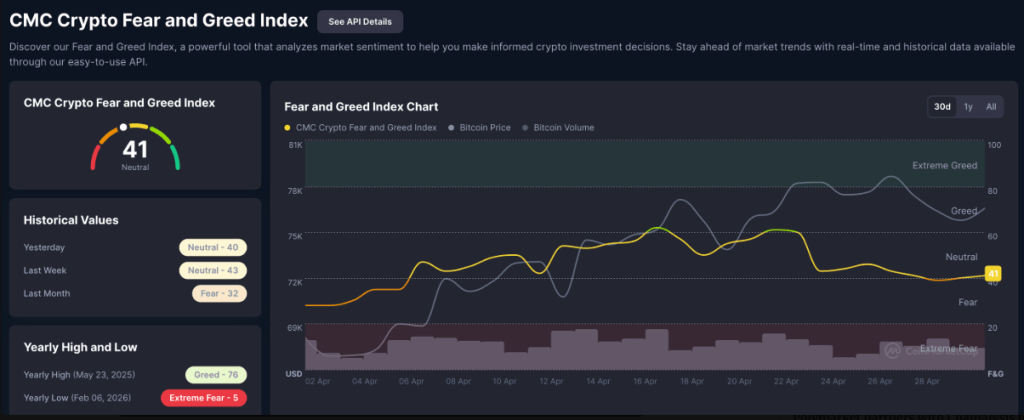
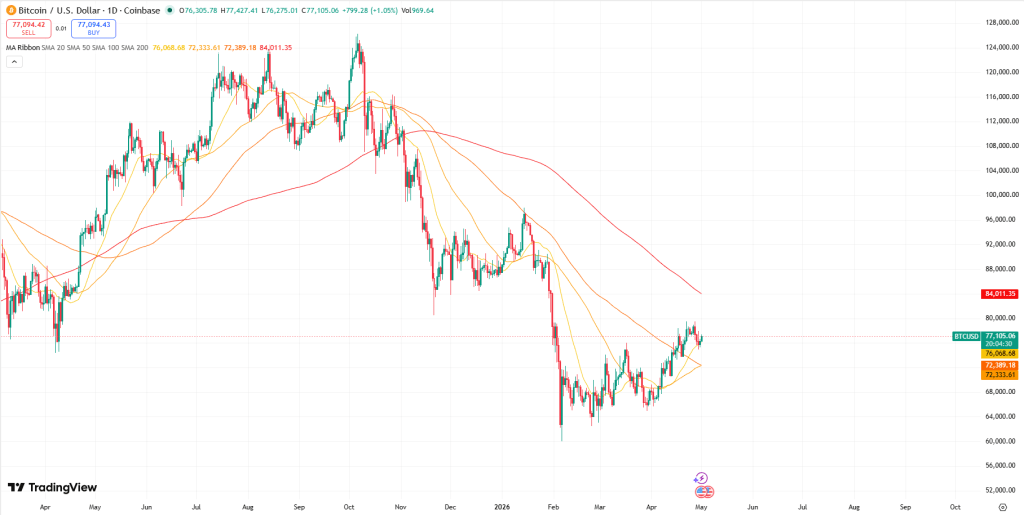
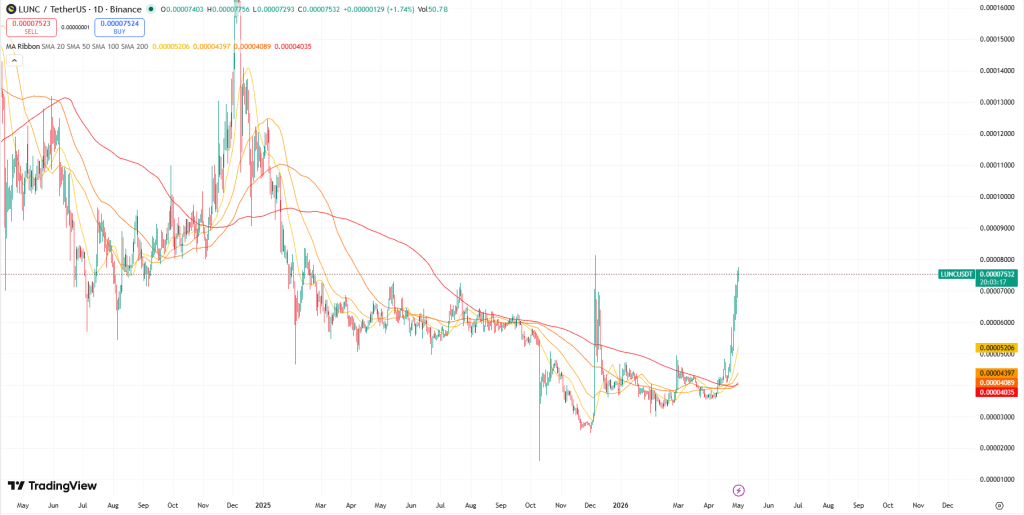
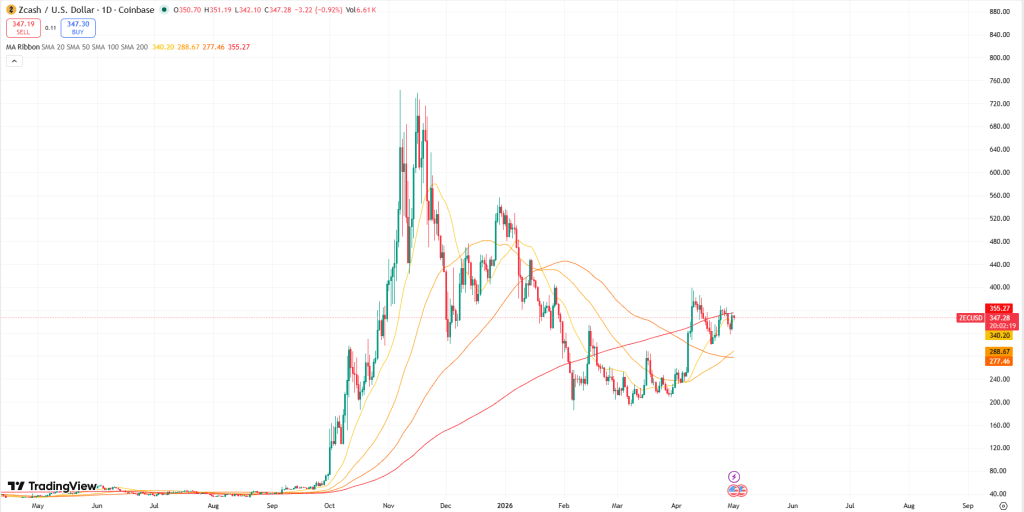
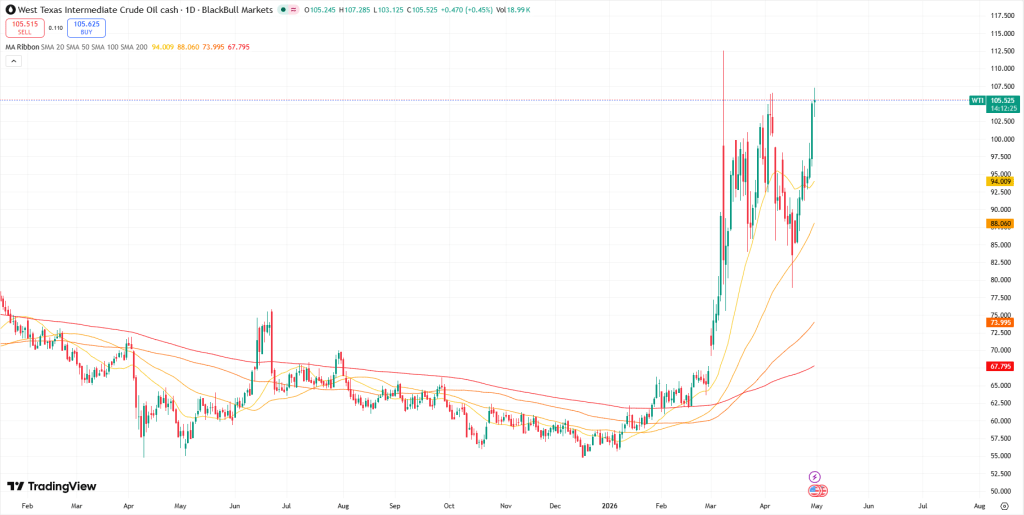
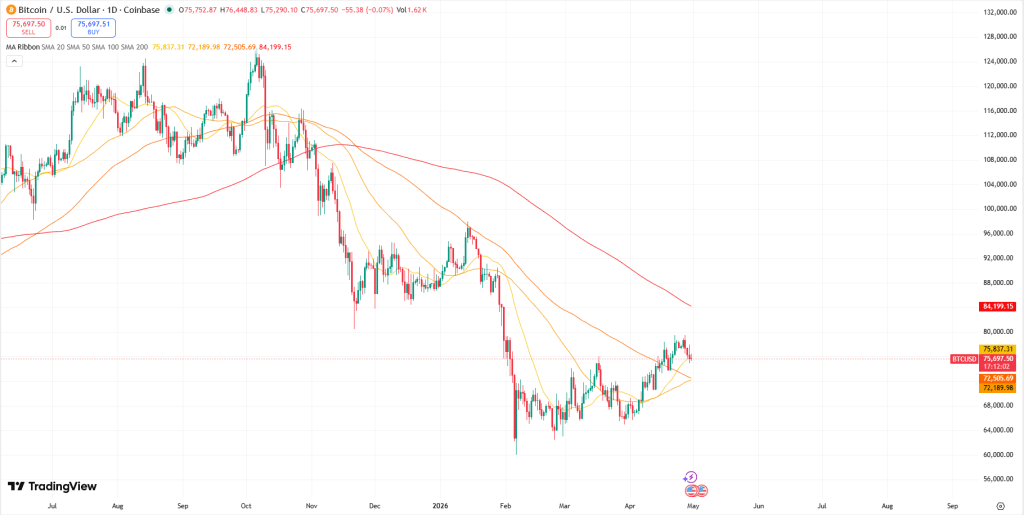
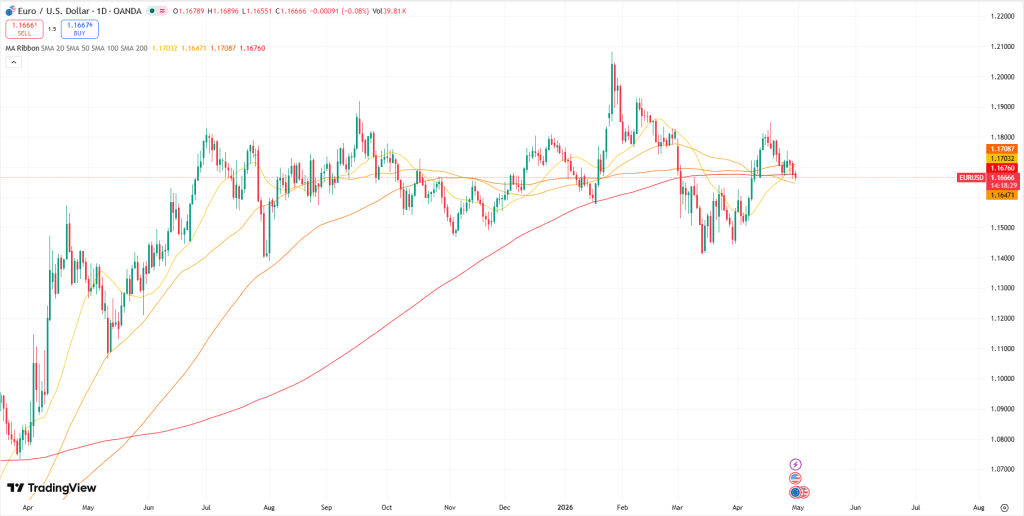
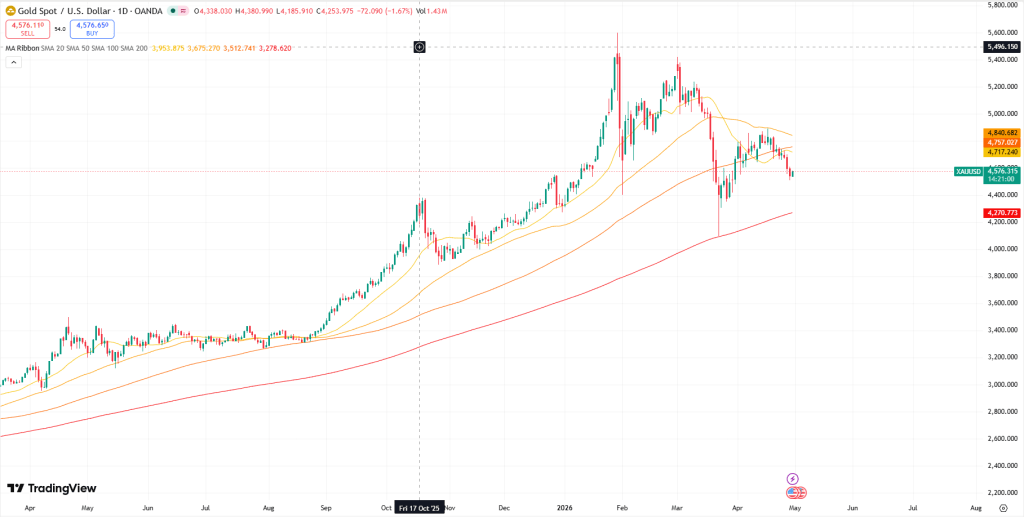


")
")
")
")
")
")
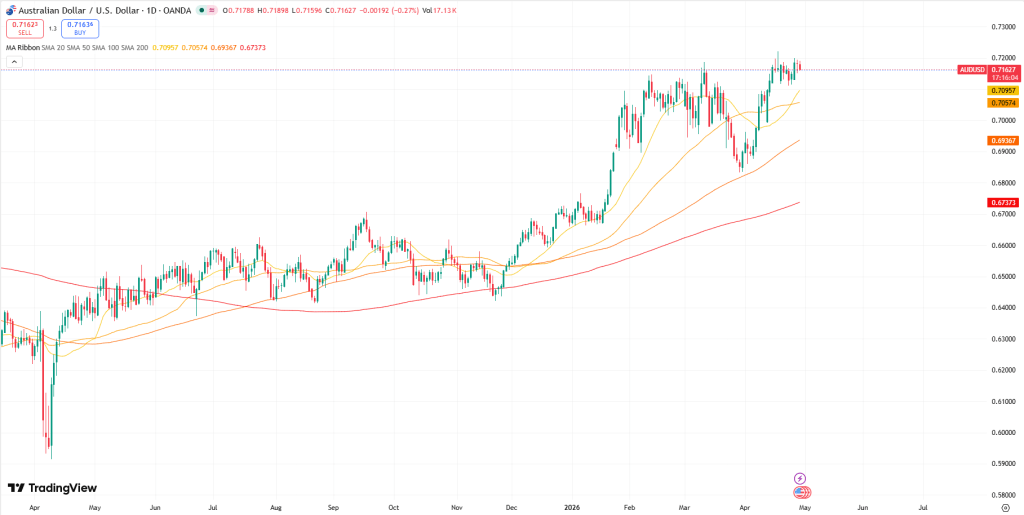
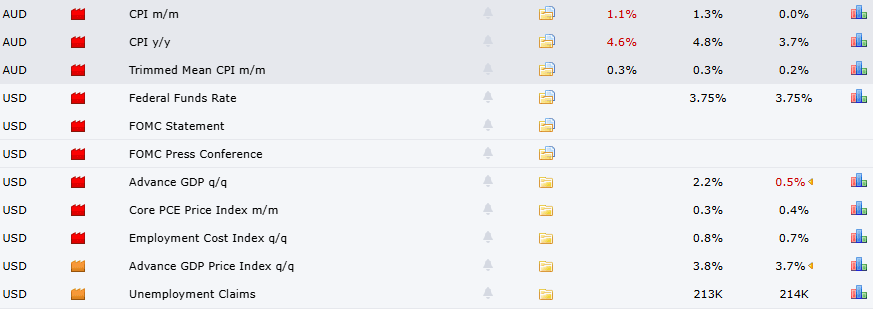
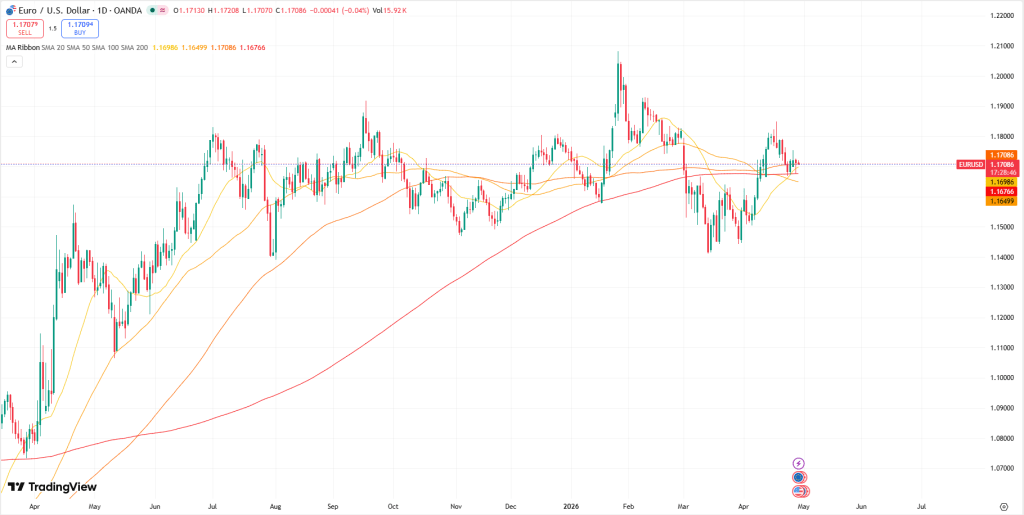
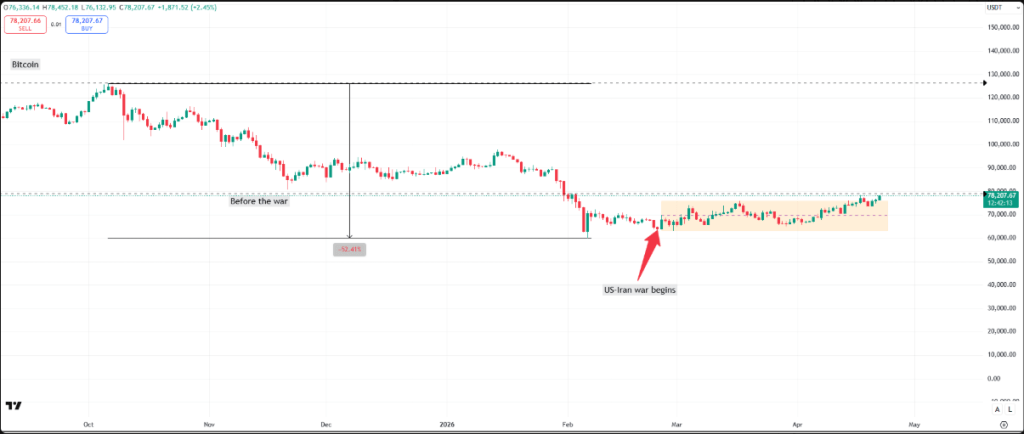
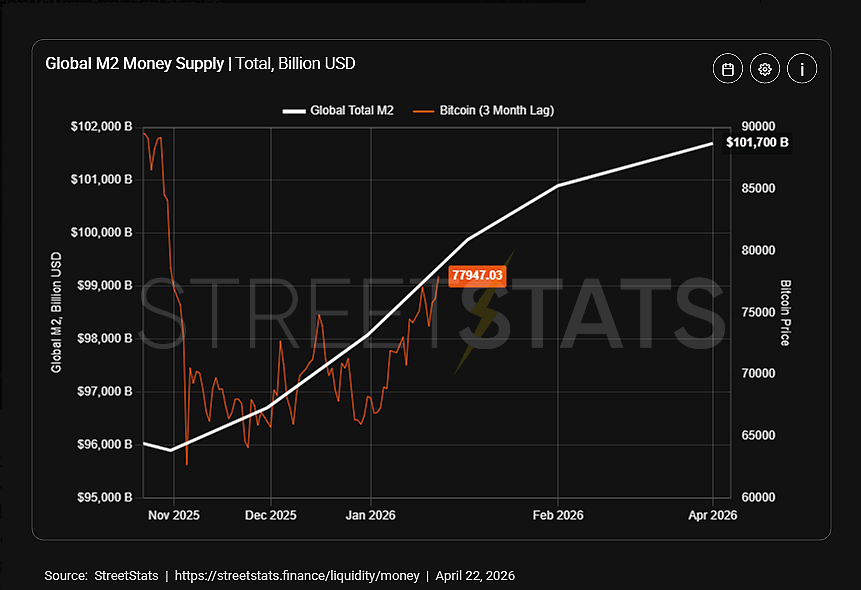
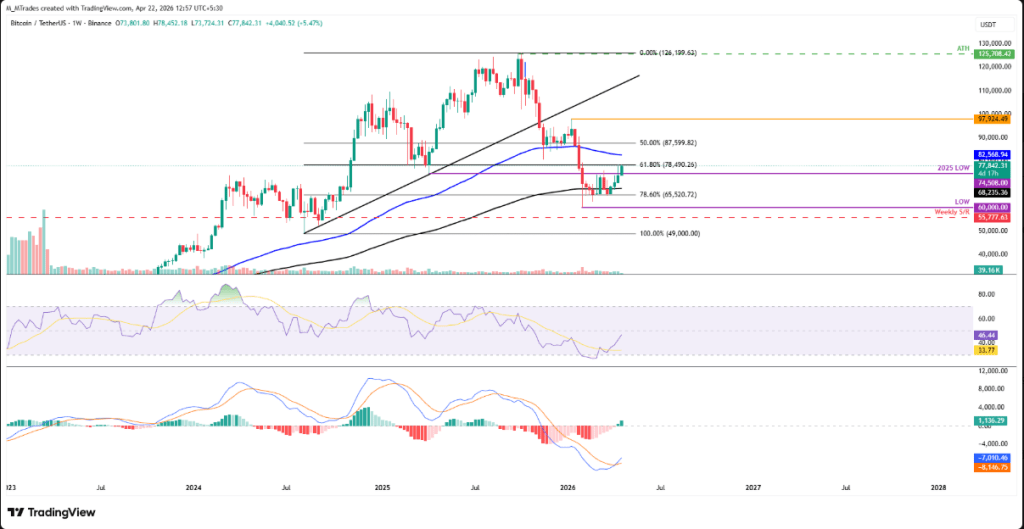


")