Key highlights
- Oil surged at the Asian open on Monday, bonds declined, and equities were mixed as Donald Trump warned of “hell” if Iran fails to meet his Strait of Hormuz deadline.
- Crude prices advanced after the Easter break, with the ongoing U.S.-Israel conflict with Iran continuing to disrupt global supply.
- The dollar remained firm, while the yen hovered near the key 160-per-dollar level amid market unease over escalating Iran tensions and Trump’s deadline.
- Japan’s benchmark yields climbed to a 27-year high as Middle East conflict fueled inflation concerns and strong U.S. jobs data reduced expectations for early rate cuts.
- Gold edged lower, weighed down by a stronger dollar, as elevated oil prices and robust U.S. labor data dampened hopes for Federal Reserve easing.
Dow Jones futures ticked higher Sunday night, with S&P 500 and Nasdaq futures also posting modest gains as investors remained cautious amid fresh U.S.–Iran tensions and rising oil prices.
The S&P 500 advanced during the holiday-shortened week, breaking a five-week losing streak. Earlier, the index had recorded its worst quarter since 2022, weighed down by late-February declines linked to the conflict and surging energy costs. However, markets rebounded last week despite continued gains in crude oil.
All three major indexes ended their five-week slides, each rising at least 3%. Still, equities have faced pressure this year due to concerns over AI disruption, weakness in private credit, and ongoing Middle East uncertainty, leaving the S&P 500 roughly 6% below its late-January peak.
U.S. Economic Data & Earnings Preview
Investors are closely watching upcoming inflation data, particularly Friday’s March Consumer Price Index, which is expected to rise 0.9% month-over-month—an early indication of the inflationary impact from the war-driven surge in energy prices. U.S. crude oil has climbed roughly 90% so far this year, pushing average gasoline prices above $4 per gallon for the first time in more than three years.
Another key release comes Thursday with the Personal Consumption Expenditures report, a preferred inflation gauge for the Federal Reserve and a crucial input for its interest-rate decisions.
Economic calendar:
- Monday (Apr 6): Donald Trump holds a press conference at the Oval Office at 1:00 p.m.
- Tuesday (Apr 7): Austan Goolsbee participates in a live Q&A in Detroit at 12:35 p.m.
- Wednesday (Apr 8): Federal Reserve releases minutes from its March meeting at 2:00 p.m.
- Thursday (Apr 9): February PCE report is published.
- Friday (Apr 10): March CPI data is released at 8:30 a.m., with forecasts pointing to a 0.9% monthly increase.
Earnings calendar:
- Wednesday (Apr 8): Delta Air Lines reports Q1 results before the open, while Constellation Brands posts its fiscal Q4 earnings.
Delta’s recent performance reflects the typical volatility of the airline sector, where fuel costs, labor expenses, and consumer demand fluctuate. The company has held up relatively well by focusing on higher-income travelers who are less sensitive to inflation, even as demand for economy-class seats weakened. In Q4, main-cabin revenue dropped 7% to $5.62 billion, while premium ticket revenue increased 9% to nearly $5.7 billion.
The stock reaction to Delta’s January 14 earnings was muted: adjusted EPS declined 13% year-over-year to $1.55, slightly beating expectations, while revenue rose 3% to $16 billion. Looking ahead, the company projects full-year adjusted EPS of $6.50–$7.50 (midpoint $7.00, below the $7.25 consensus) and Q1 adjusted EPS of $0.50–$0.90, roughly in line with market estimates.
Technical Analysis
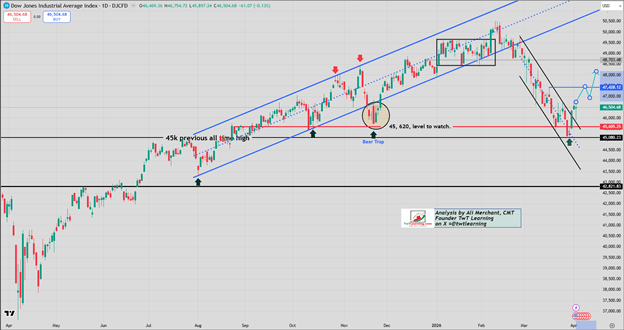
DJIA Technical Outlook
The Dow Jones Industrial Average recently broke out above a descending channel, which has now turned into support around 45,760.
As long as the index holds above this level, it is likely to extend its rally toward 47,430, followed by a potential short-term pullback. A clear breakout above 47,430 would signal further upside, with the next target near 48,400.
Notably, the index successfully retested and rebounded from the previous all-time high zone around 45,000—an encouraging sign that the broader uptrend remains intact.
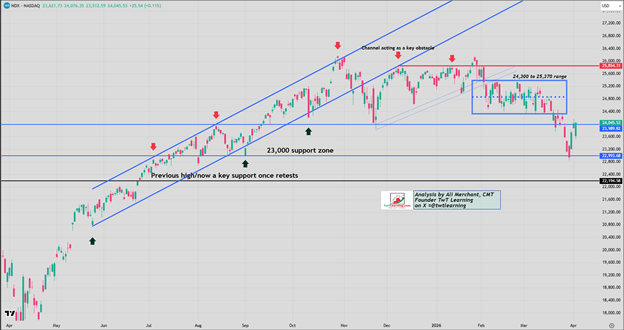
Nasdaq 100 Technical Outlook
The Nasdaq-100 has rebounded from the previously identified support near 23,000.
To maintain upward momentum, the index needs to stay above 23,990, which would open the way for a move toward 24,330 this week. However, a rejection at the 24,330 level could push prices back down toward the 23,000 support zone.
In the near term, the NDX is likely to trade within a range of 23,000 to 24,330 until a decisive breakout establishes a clearer direction.
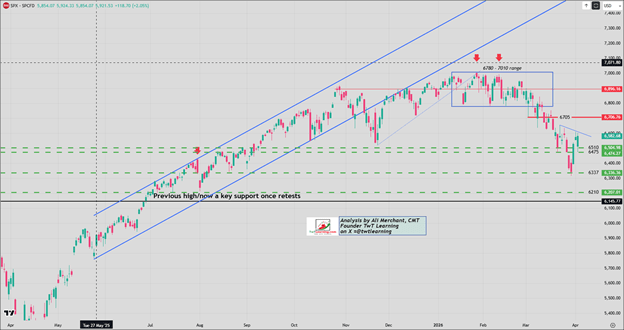
S&P 500 Technical Outlook
The S&P 500 rebounded from the 6,335–6,340 support zone and delivered a strong rally last week, in line with the previous outlook.
To continue the upward trend, the index needs to break above the 6,610–6,615 resistance area, which would open the path toward 6,705.
If that breakout fails, the SPX is likely to move sideways within a 6,510–6,610 range, with potential downside risk extending to around 6,475.
Weekly U.S. Indices Probability Map
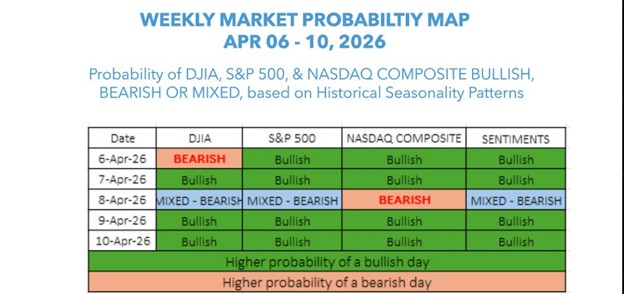
The U.S. weekly probability map for March 30 to April 3, 2026 indicates that the following week (April 6–10) has historically been bullish for major U.S. indices, suggesting a favorable environment for upward momentum.
These probability maps are based on historical seasonality trends, while sentiment indicators are generated using a scoring system derived from those seasonal patterns.
Sources: Ali Merchant

Leave a comment