In our previous update, we noted that the S&P 500’s year-to-date performance had closely followed midterm election-year seasonality. When combined with our Elliott Wave analysis, we concluded that:
- The decline was likely to bottom around $6,490 ± 10
- A countertrend rally would begin once that low was in place, potentially reaching about $6,900 ± 100
- This would likely be followed by another pullback, at minimum retracing 38.2% of the rally from the April low
As of now, the index appears to have behaved largely in line with that outlook. It bottomed on Friday at $6,473—just 7 points below the projected zone—and has since rebounded by roughly 2%.
However, given that the market seems to be undergoing a fourth-wave correction comparable in scale to the 2022 second-wave decline, it’s unlikely that such a modest pullback represents the entire correction. Elliott Wave theory suggests corrections typically unfold in at least three waves (a, b, and c).
As a result, while not impossible, it is unlikely that the correction has already completed. More plausibly, the red Wave A within the broader black Wave 4 has now formed its low.
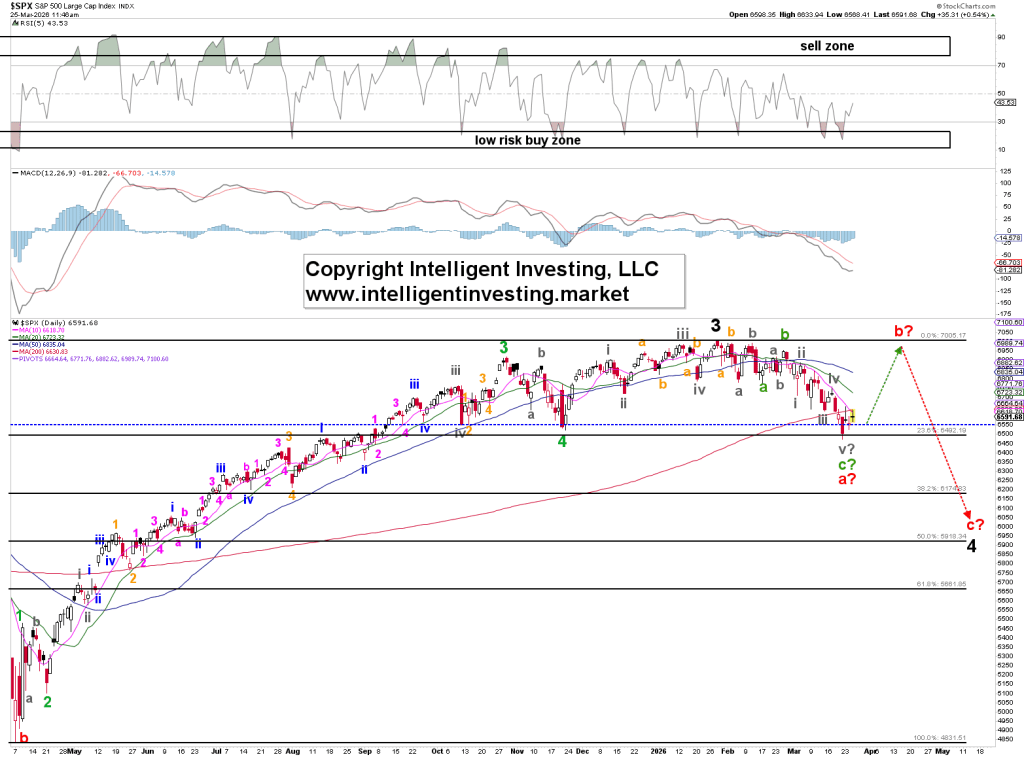
Figure 1. Intermediate-term Elliott Wave count for the S&P 500 (SPX) since April 2025.
Because we prioritize what’s most probable rather than merely possible, we rely on a weight-of-the-evidence approach. In addition to seasonality, we assess a range of market breadth indicators.
Here, the McClellan Oscillator for the S&P 500 shows a higher low between the March 13 and March 20 price lows (see Figure 2). This indicates that fewer stocks were involved in the latest decline—a condition known as positive divergence (green dotted arrow), which is typically a bullish signal.
Moreover, the indicator had fallen to levels last seen during the April 2025 crash low, pointing to deeply oversold market breadth. Much like a stretched rubber band nearing its limit, such conditions often precede a rebound—another constructive signal for the market.
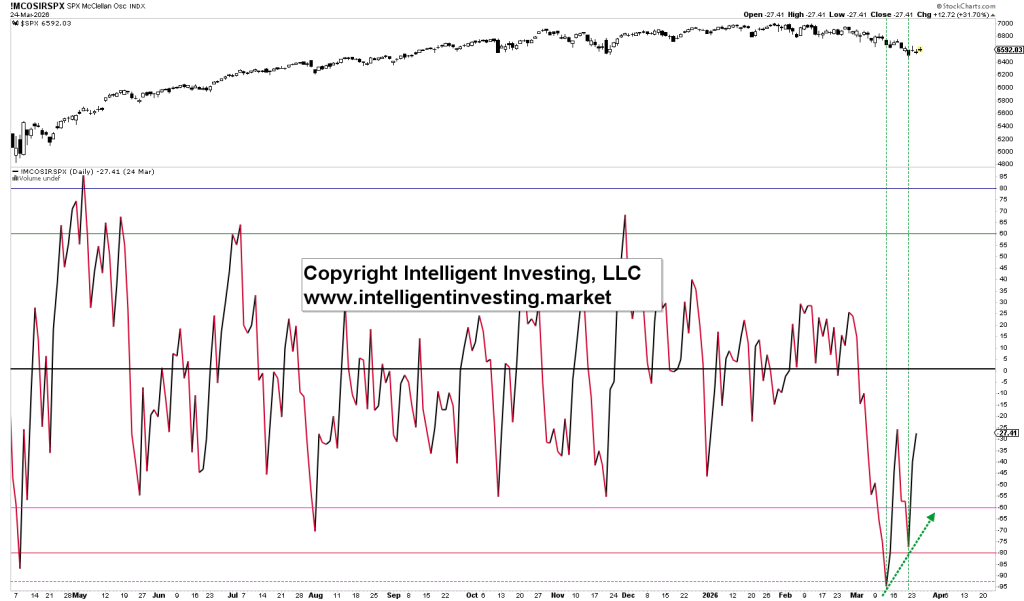
Figure 2. McClellan Oscillator for the S&P 500 since April 2025.
The second breadth indicator we analyze is the cumulative Advance–Decline line for the S&P 500 (SPX A/D), shown in Figure 3. So far, it has continued to hold above its upward-sloping blue dotted trendline from the April lows (black arrows), which is a constructive sign.
Earlier in 2025, a negative divergence between the index and the A/D line signaled the February–April correction (solid red and green arrows). In contrast, no such divergence has appeared recently. Instead, the A/D line has been rising while the index has been largely flat (dotted red and green arrows within the black box).
Moreover, the A/D line has now broken above its downtrend line that had been in place since early March (green arrow), adding another bullish indication.
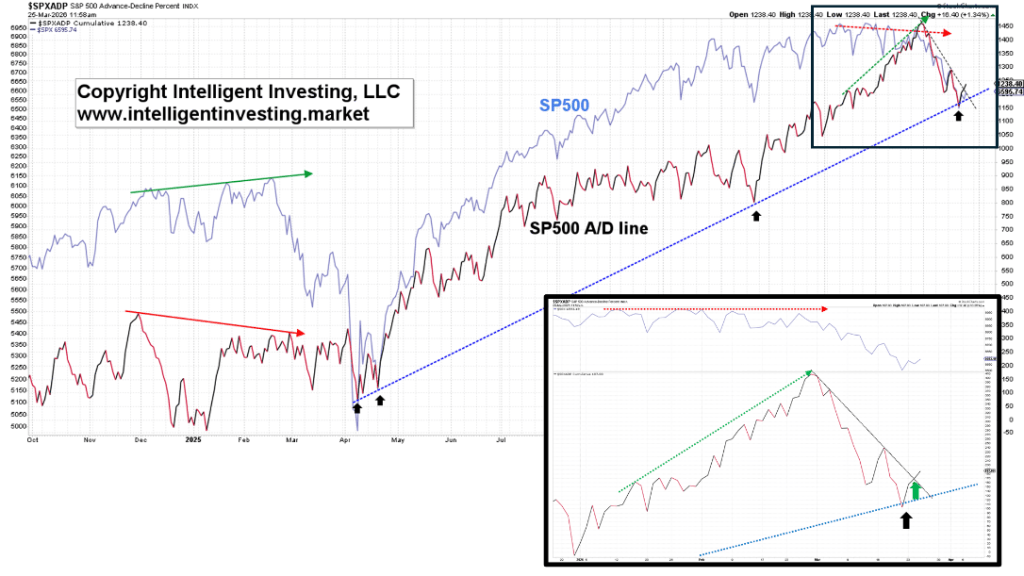
Figure 3. Cumulative Advance–Decline (A/D) line for the S&P 500 since October 2025.
In summary, while price action remains the ultimate arbiter, key market breadth indicators are broadly supportive of a bullish outlook. At the same time, the index found a low precisely within the zone projected by our Elliott Wave and Fibonacci analysis.
As long as prices hold above Friday’s low, we anticipate the B-wave rebound to extend toward the $6,900 ± 100 area. However, if that level fails to hold, the next meaningful support lies in the mid-6,300s, where buyers may look to reestablish control.
Sources: Dr. Arnout ter Schure

Leave a comment