The S&P 500 closed down more than 1.3%, pressured by a hotter-than-expected PPI reading, a sharp rise in oil prices, and growing expectations that the Fed may delay rate cuts into 2026—even without Jay Powell at the helm.
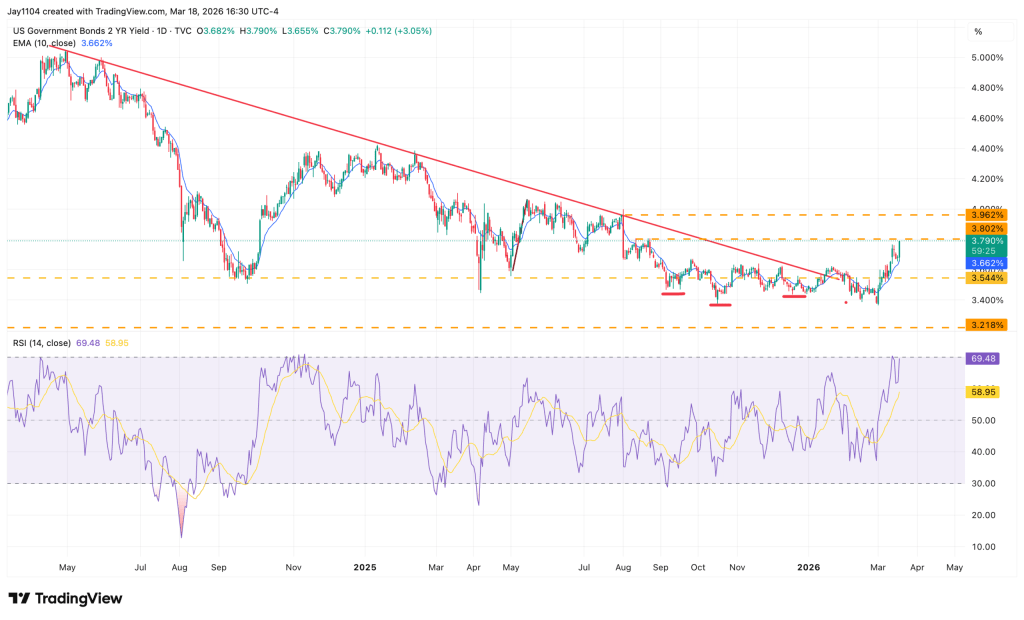
The 2-year Treasury yield tells the story, jumping over 10 basis points to 3.79%, its highest level since August. While there’s minor resistance around 3.8%, it appears limited, leaving the door open for a move back toward 4% in the near term.
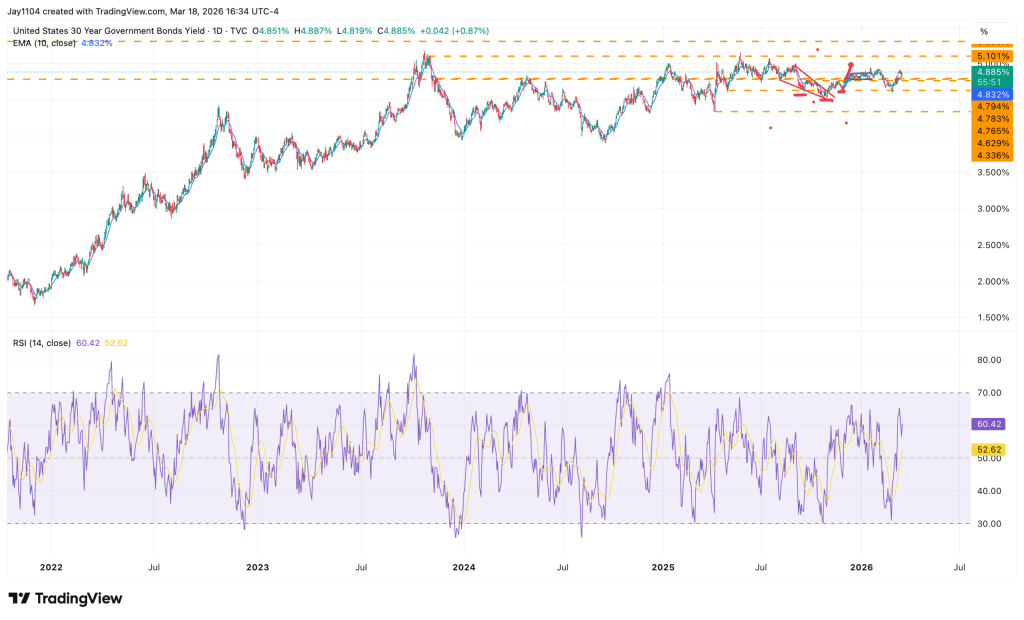
More notable is the move in the 30-year yield, which is once again approaching the 5% level. It rose 4 basis points on the day to 4.89%, putting it within striking distance of that key threshold.
If oil prices remain elevated—or push even higher—and inflation continues to trend upward, a breakout above 5% looks increasingly plausible, with a potential move toward 5.1%–5.2% not out of the question.
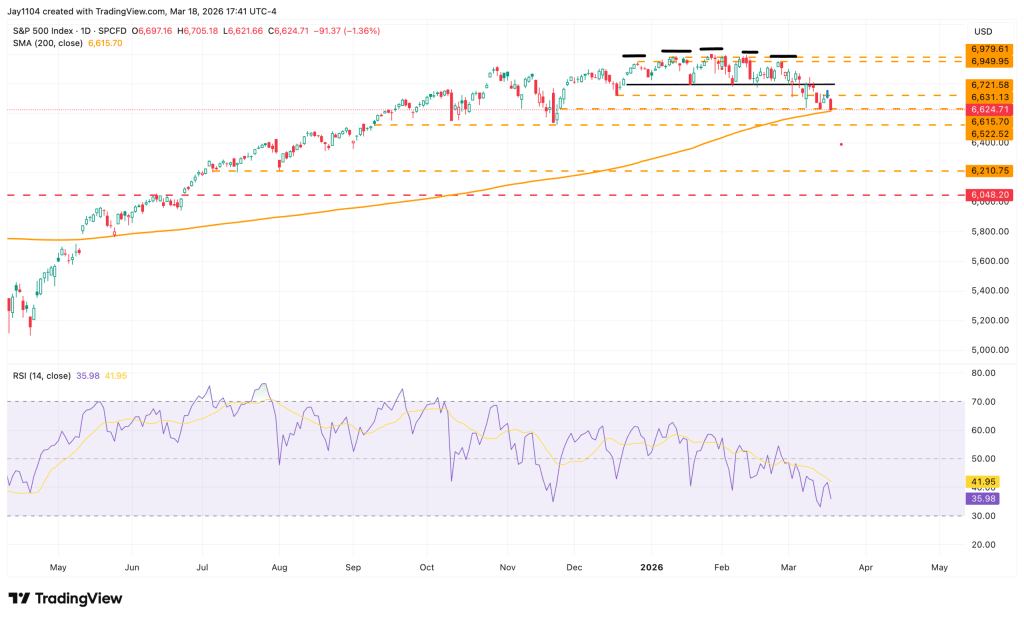
Turning back to the S&P 500, the index closed at its lowest level since November, finishing at 6,624. With the 200-day moving average just 9 points below, the market is approaching a key technical battleground ahead of Friday’s options expiration (opex).
A decisive break below the 200-day, especially with follow-through selling, would likely raise red flags for investors. For now, however, such a move would more likely signal a test of the next support zone around 6,520.
The real inflection point lies below that—if 6,520 gives way, downside momentum could accelerate. In the near term, 6,500 is also shaping up as a critical level, acting as a put wall at least through Friday.
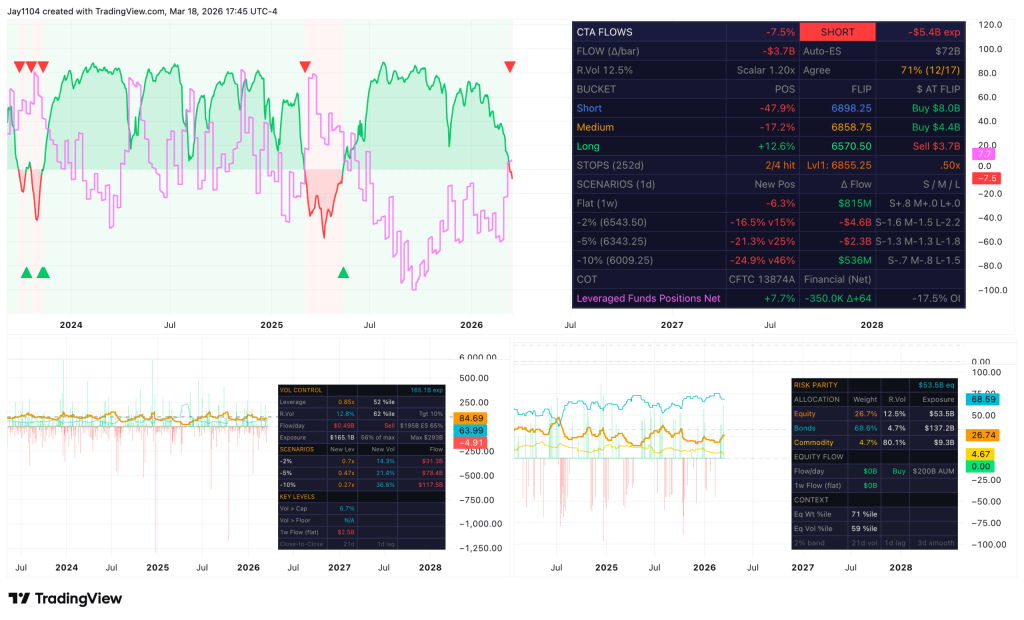
Based on my CTA model, flows are currently negative, with the next key flip level sitting around 6,570. I’m still refining the longer-term trend signal, so confidence there remains limited. More importantly, though, systematic flows at this point are not providing support for a market move higher.
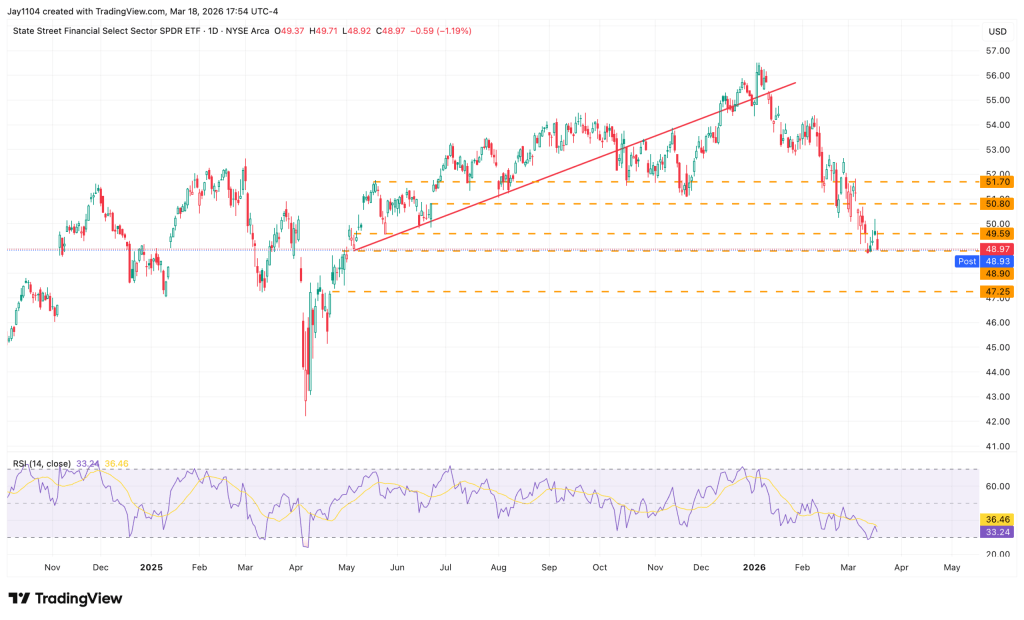
The Financials ETF (XLF) is nearing a break of key support just below $49. If that level gives way, the next support zone comes in around $47.25—an area that dates back to April last year and also marks an unfilled gap on the chart.
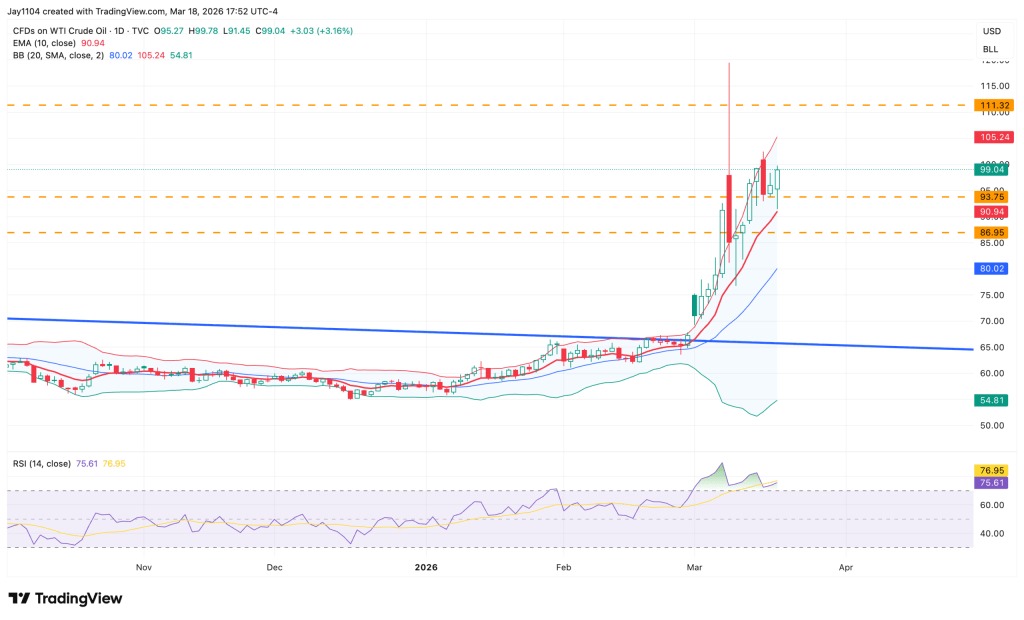
At the end of the day, it all comes back to one key driver: oil—and for now, that trend is still pointing higher. As long as oil continues to climb, it likely keeps upward pressure on rates and the dollar, while weighing on risk assets.
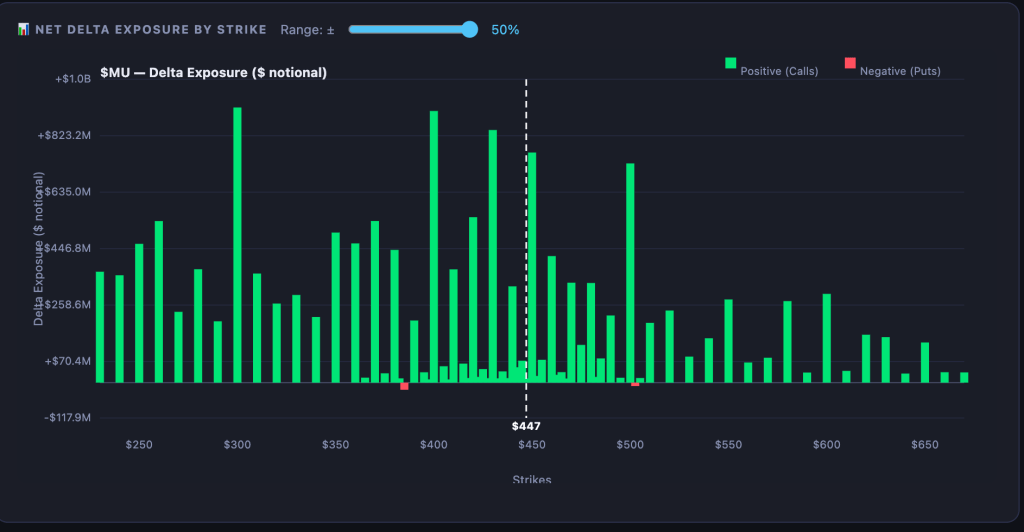
Micron (NASDAQ: MU) just delivered stellar earnings and strong forward guidance, yet the stock is still down more than 3%. It’s not disastrous—at least for now—but notably, shares remain below the $450 level.
In essence, call options at $450 and above could rapidly lose value today if the stock fails to recover. That may trigger selling pressure, which in turn could force market makers to unwind their hedging positions.
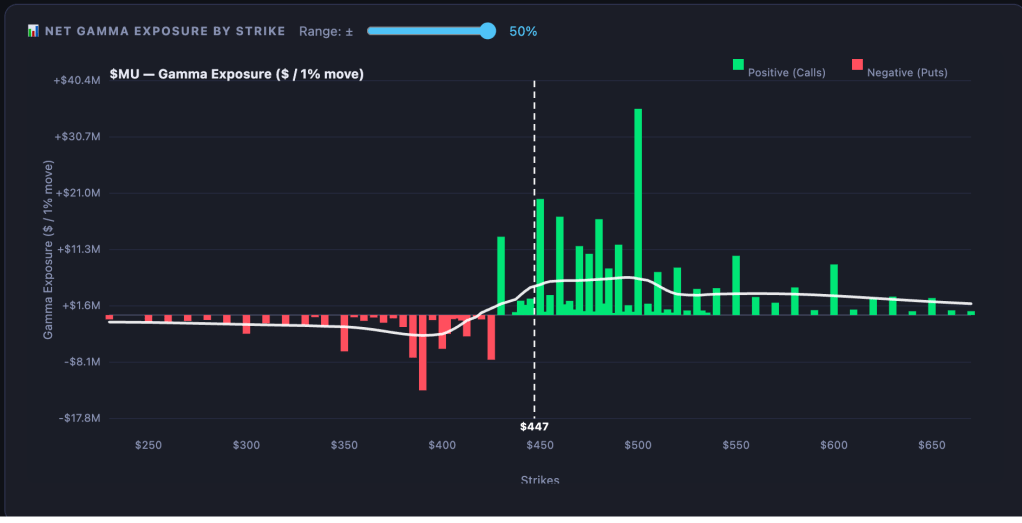
As long as the stock holds above $430, gamma should remain positive—at least based on yesterday’s readings—making that level a potential area of support. However, if it falls below $430, dealers may turn into sellers, which could push the stock down toward $400, or possibly even closer to $390.
In this market, it really does feel like the tail is wagging the dog—at least from my perspective.
Sources: Michael Kramer

Leave a comment