Key Takeaways
- Utilities are outperforming the S&P 500, signaling growing investor demand for defensive positioning.
- Consumer Staples and Health Care present mixed signals as traders evaluate potential rotation into risk-off sectors.
- Tracking both absolute and relative sector strength can offer insight into broader market risk.
It’s March Madness on Wall Street: the VIX remains in the mid-20s, WTI crude oil has climbed back to $100, and bearish momentum continues to build. With “defense wins championships” in mind, traders may be weighing whether bracing for further downside is the prudent strategy.
In that context, sector analysis deserves a spot in your playbook. Within the 11 S&P 500 sectors, Utilities, Consumer Staples, Health Care, and Real Estate are typically viewed as less cyclical, lower-growth, defensive areas. Together, they account for about 18.5% of the index (under 10% excluding Health Care). From a portfolio standpoint, shifting heavily into these sectors represents a meaningful active bet. If sentiment flips and bulls regain control, a sharp rebound could quickly punish defensive positioning.
Even so, opportunities may lie beyond the high-growth “headline” sectors. Let’s take a closer look.
Utilities Gaining Momentum
Starting with Utilities (XLU), it’s useful to assess both absolute and relative price action. The sector ETF remains firmly in an uptrend.
As shown in the chart, a pattern of higher highs and higher lows has persisted since September 2023. The upward-sloping 200-day moving average indicates that bulls still dominate the primary trend. Meanwhile, the RSI momentum indicator has frequently reached overbought territory—often a sign of strength rather than weakness. In short, XLU continues to show strong upside momentum.
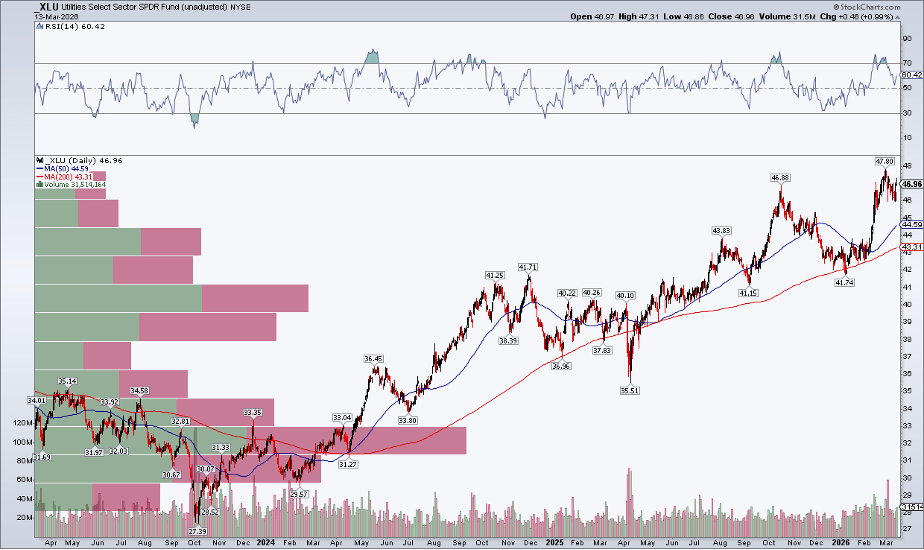
XLU remains in a strong uptrend and is trading near record highs.
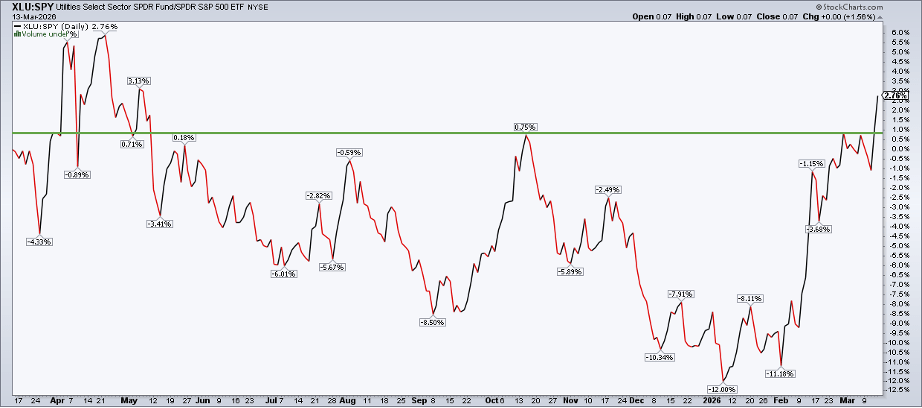
But how does it compare to the S&P 500 ETF (SPY)?
To check, enter “XLU:SPY” in the SharpCharts symbol box (or “_XLU:_SPY” for a price-only view). As of last Friday, the ratio hit its highest level since May 2025, breaking above key resistance.
In short, relative strength is shifting toward Utilities, which implies a more bearish tilt for the broader S&P 500.
Staples Near a Crucial Support Zone
Looking at Consumer Staples (XLP), the price trend is less decisive. The ETF is edging closer to correction territory, pulling back toward key support around $84 and its 50-day moving average. Given the strong volume-by-price concentration in the mid-$80s, there’s an expectation buyers may step in at this level. The coming weeks will be pivotal.
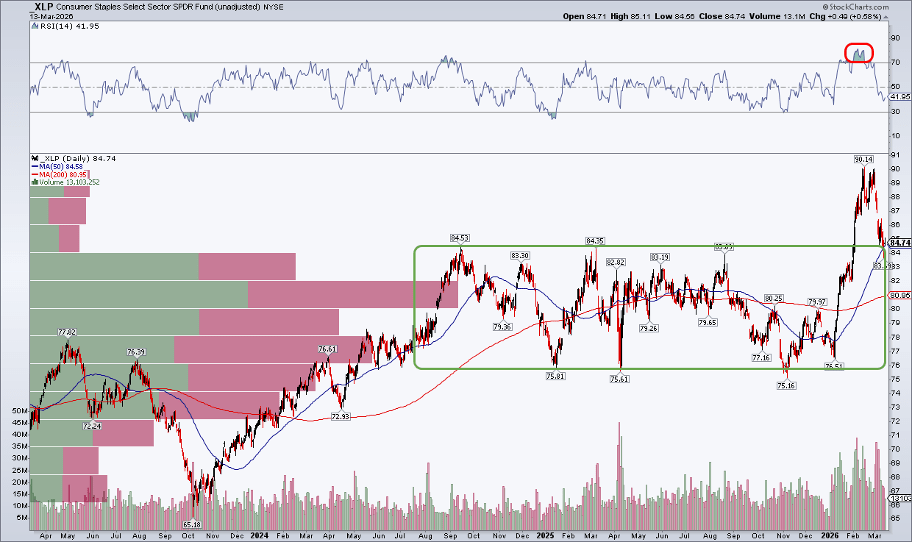
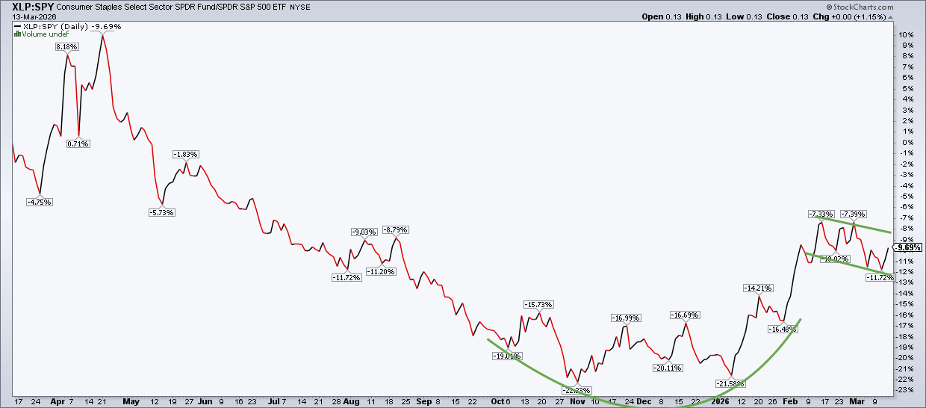
Similarly, the XLP:SPY ratio is not as well-defined as XLU:SPY. It formed a rounded bottom around the start of the year and has since moved into a consolidation phase—potentially a bull flag.
From a technical perspective, consolidations typically break in the direction of the broader trend—which is upward here. That suggests XLP could maintain support near $84 and resume outperforming the S&P 500 in the weeks and months ahead.
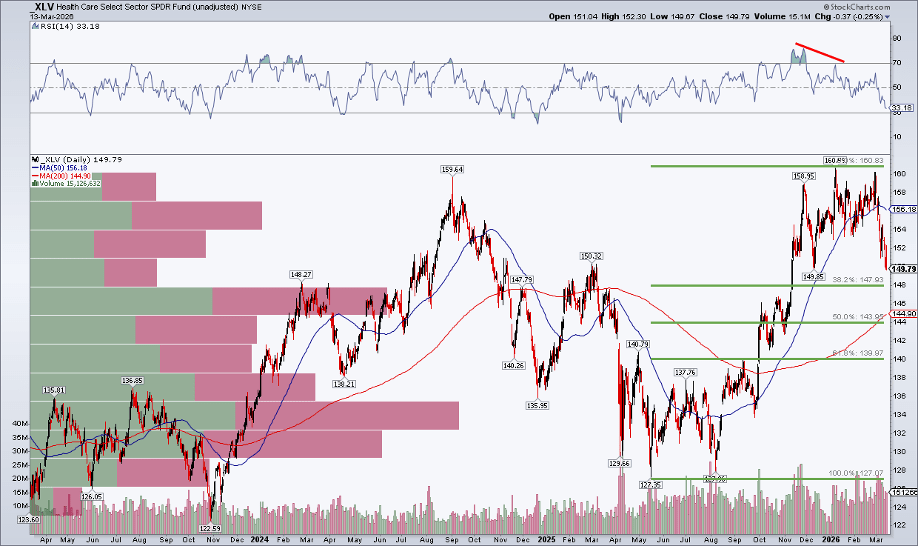
Health Care Still on the Sidelines
Turning to Health Care (XLV), the chart shows a clear bearish double top, with sellers stepping in twice around the $160 level—first in Q3 2024 and again more recently over an extended period.
The sector, which includes defensive pharmaceutical firms, somewhat cyclical medical device makers, and higher-risk biotech names, has seen its RSI drop to its weakest level since just after Liberation Day. Meanwhile, the rising 200-day moving average sits only a few percentage points below the current price. In addition, after breaking below an upward trendline, the next key level to watch is the 38.2% Fibonacci retracement near $148.
Overall, XLV looks better left on the sidelines for now.
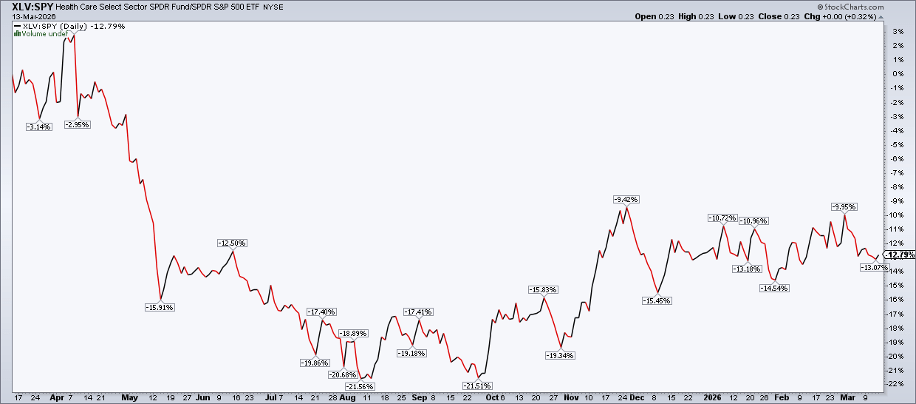
XLV:SPY lacks a compelling setup. The sector found a bottom last August, showed some strength in November, but has largely moved sideways since December.
Much like how Walmart and Costco lead the Staples space, Health Care performance is heavily driven by Eli Lilly, Johnson & Johnson, and UnitedHealth Group.
Don’t Overcomplicate the Defensive Trade
At a high level, it’s easy to get lost comparing relative strength across defensive, cyclical, and growth sectors. But the reality is simple: risk-off areas like Utilities, Staples, and Health Care can rally—and have done so multiple times during this bull market. In fact, companies such as Walmart, Costco, and Eli Lilly often behave more like growth stocks than traditional defensive names.
The takeaway: sector analysis—including relative strength—is just one tool within a broader top-down and intermarket framework.
When Defensive Strength Signals Trouble
So when does outperformance in defensive sectors shift from a caution sign to a real warning? If Utilities, Staples, Health Care (and possibly Real Estate) start showing relative strength while declining in absolute terms, it’s usually a sign the S&P 500 is under pressure.
There have been early hints of this dynamic alongside the index’s bearish rounded top, but so far it’s been inconsistent rather than decisive. While it’s not ideal for defensive sectors to lead, such phases can persist longer than expected.
Bottom Line
While attention is centered on Energy and Technology—with $100 oil and NVIDIA grabbing headlines—along with Financials facing stress from private credit concerns, traders shouldn’t ignore the defensive sectors. Monitoring both absolute and relative trends in these areas can provide clarity and help filter out noise during volatile market conditions.
Sources: Mike Zaccardi

Leave a comment