U.S. Strategy I: Roaring 2020s vs. Stagflating 1970s Redux
In last Tuesday’s QuickTakes, reacting to the latest Middle East conflict, we noted that although markets were already due for a pullback because of excessive bullish sentiment, the escalation increased the likelihood of a deeper correction. We suggested the market could fall around 10% from its peak, potentially reaching 15% if Iran’s Islamic Revolutionary Guard Corps (IRGC) succeeded in sustaining a blockade of the Strait of Hormuz using drones and fast boats.
Since then, much of Iran’s conventional naval capability has reportedly been destroyed. However, as long as the IRGC retains drone capabilities, the strategic waterway could remain effectively constrained. Donald Trump has authorized the United States Navy to escort vessels through the Strait, though the operation may take time to deploy and may not fully eliminate the threat of Iranian drone attacks.
Media reports over the weekend underscored those risks. According to the New York Post, an Iranian suicide drone struck a commercial oil tanker in the Strait, setting it ablaze while U.S. naval protection efforts for shipping lanes could still be weeks away.
Limits of Air Power
Military historians have long debated whether air power alone can decisively win wars. Most conclude it rarely achieves lasting victory by itself. While air strikes can destroy infrastructure, supply chains, and concentrated forces, they cannot control territory, conduct searches, or administer local governance. Nor can they fully eliminate dispersed threats such as drones.
Over the weekend, President Trump declined to rule out deploying ground forces, though he dismissed the idea of using Kurdish fighters as proxies for an invasion of Tehran, saying the conflict was already “complicated enough.” He indicated ground operations would only occur if the adversary were sufficiently weakened.
Domestic Economic Backdrop
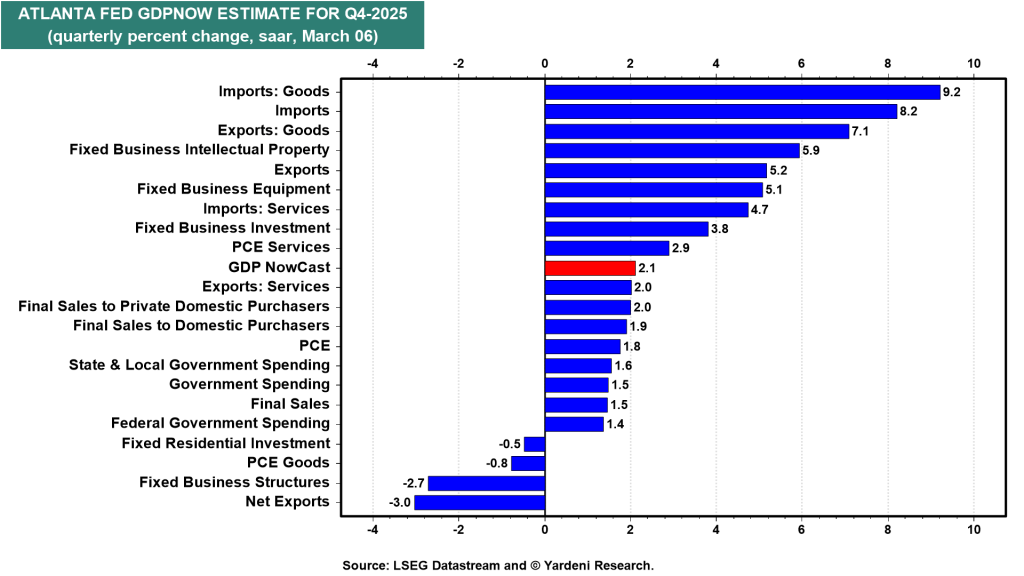
At home, economic data has also softened. February’s U.S. employment report came in much weaker than expected, while January retail sales disappointed. As a result, the Federal Reserve Bank of Atlanta’s GDPNow model lowered its estimate for Q1 real GDP growth to 2.1% (annualized), down from 3.0%.
This leaves both the U.S. economy and equity markets caught between geopolitical shocks and slowing domestic momentum. The Federal Reserve faces a similar dilemma: if higher oil prices persist, its dual mandate could be squeezed between rising inflation and weakening employment.
Implications for the Economic and Market Outlook
Rapidly Changing Conditions
Given the speed of developments, scenario probabilities are being adjusted. The base case remains the “Roaring 2020s” with a 60% probability. However, the “Meltup” scenario has been cut from 20% to 5%, while the “Meltdown” scenario—now including the risk of 1970s-style stagflation—has been raised from 20% to 35%.
Looking beyond this year to the rest of the decade, the outlook narrows to two primary possibilities:
- Roaring 2020s: 85% probability
- Stagflating 1970s Redux: 15% probability
Oil Prices and Market Risk
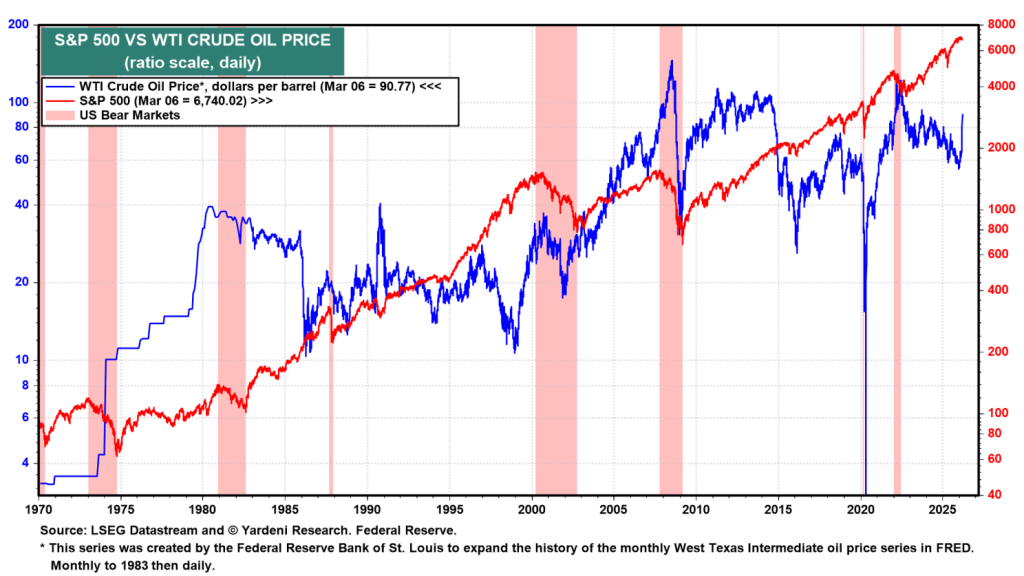
Historically, sharp oil price spikes have often coincided with recessions and bear markets. One recent exception was the 2022 surge following Russia’s invasion of Ukraine, which produced a bear market but not a recession—highlighting the resilience of the U.S. economy.
A similar pattern could play out today. While the economy may absorb higher energy costs, the current oil shock still increases the likelihood of a 10%–15% correction in equities, even if a full bear market ultimately proves avoidable under current conditions.
War Likely to Continue for Several More Weeks
Our relatively optimistic scenario assumes the conflict will persist for a few more weeks, while the U.S. economy and corporate earnings remain resilient, as they have during previous shocks.
One reason for this resilience is the sharp decline in the economy’s energy intensity—measured as total energy consumption per unit of real GDP. In the United States, energy intensity has fallen dramatically over the past several decades, dropping about 70% between 1950 and 2024 and roughly 62% since 1979.
This structural shift means the U.S. economy is far less sensitive to oil-price shocks than in earlier decades, particularly compared with the 1970s oil crisis period when energy costs had a much larger impact on growth and inflation.
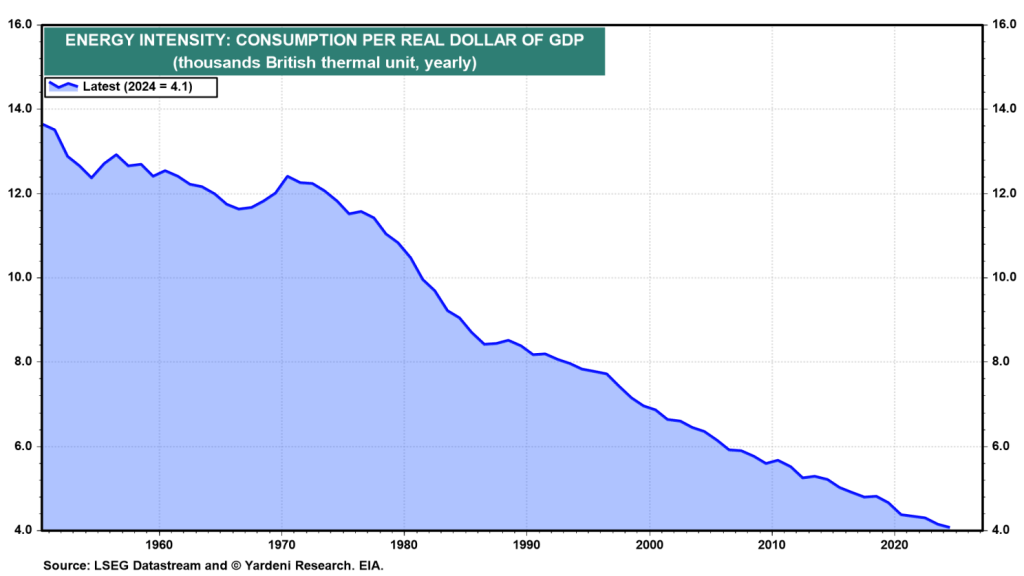
The United States economy has gradually shifted from heavy reliance on energy-intensive manufacturing toward a more service-oriented structure, which has helped reduce overall energy consumption relative to economic output.
Additional factors behind the decline in energy intensity include the introduction of Corporate Average Fuel Economy (CAFE) standards and ongoing technological improvements in internal combustion engines, both of which have improved fuel efficiency across the transportation sector.
At the same time, the expansion of the digital economy—including data centers, cloud computing, and artificial intelligence—has been driving stronger electricity demand. Even so, the growing use of natural gas and renewable energy sources in power generation, as well as their increasing adoption in industrial processes that previously relied on oil, should continue to moderate the economy’s direct dependence on crude oil.
Oil production
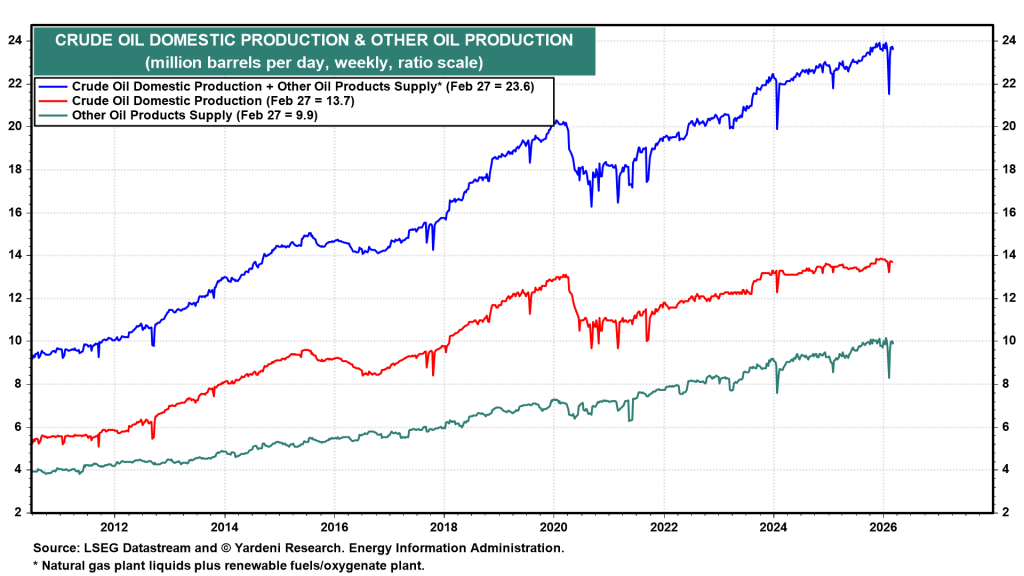
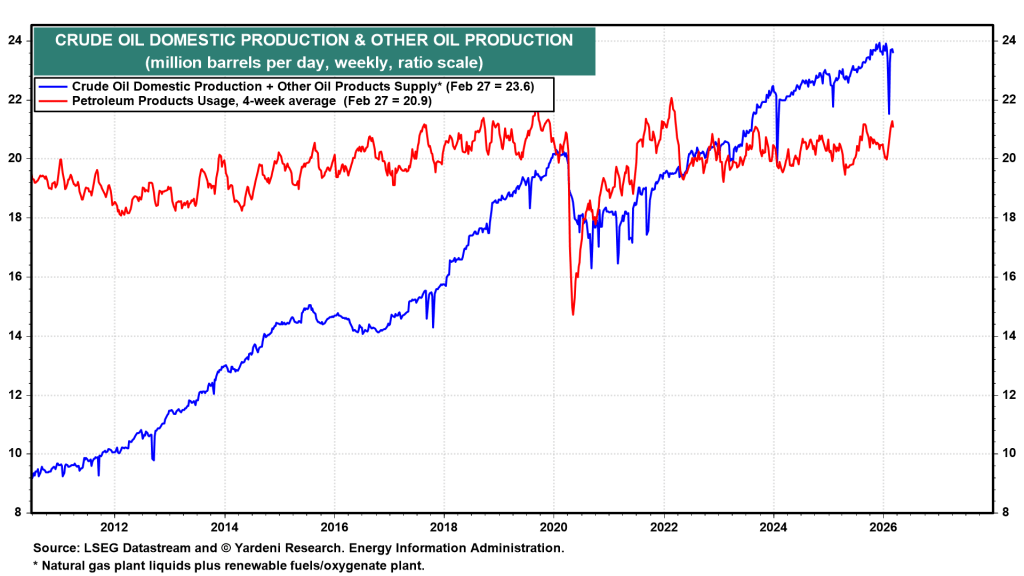
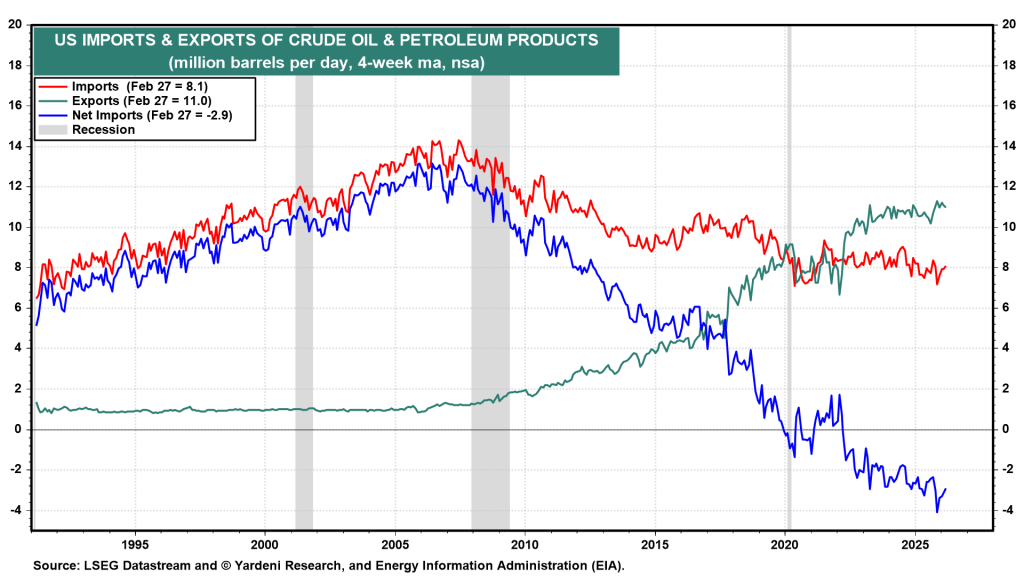
U.S. oil production, which includes natural gas plant liquids and renewable fuels/oxygenates, has reached a record level of 24 million barrels per day (mbd), significantly exceeding domestic consumption of 21 mbd (Fig. 7 and Fig. 8). As a result, the United States has become a net exporter of roughly 3.0 mbd (Fig. 9). This represents a dramatic shift compared with 2007, when the country was a net importer of approximately 12 mbd.
A potential return of 1970s-style stagflation
A bear market cannot be ruled out if investors begin to expect a repeat of the stagflationary conditions seen in the 1970s. At that time, the global economy was hit by two major oil shocks. In October 1973, Arab members of Organization of the Petroleum Exporting Countries (OPEC) imposed an oil embargo on the United States and other countries that supported Israel during the Yom Kippur War.
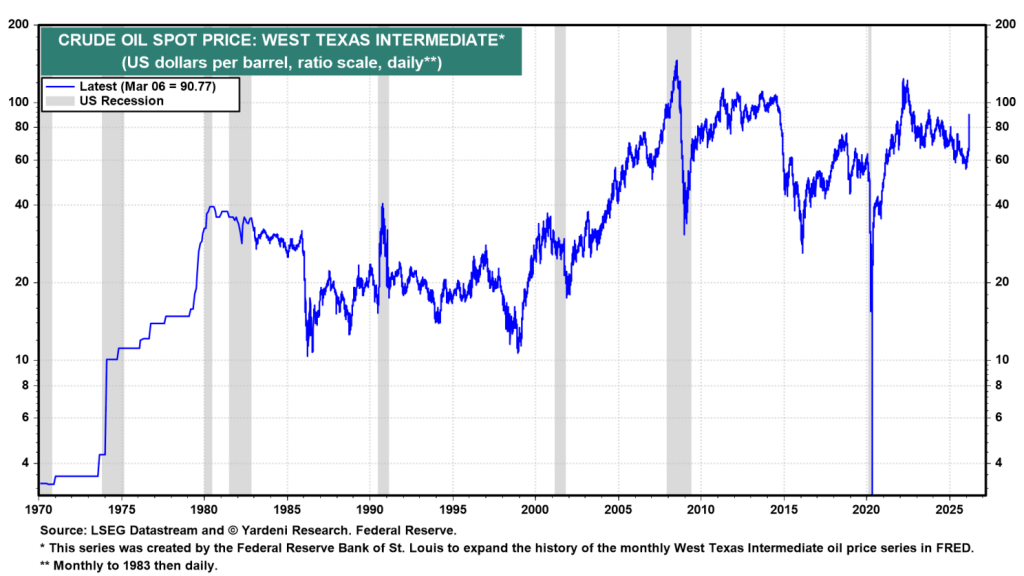
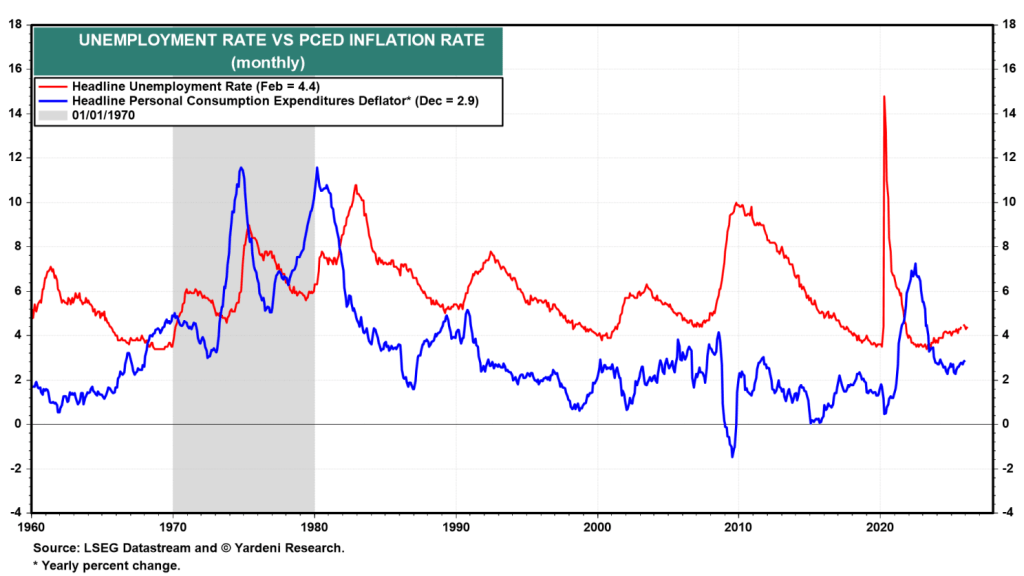
Oil prices surged dramatically, rising about fourfold from roughly $3 to nearly $12 per barrel within only a few months. This led to stagflation—an unusual and painful economic condition characterized by slow economic growth, high unemployment, and accelerating inflation (Fig. 10). The crisis resulted in long queues at gasoline stations, fuel rationing, and a heightened awareness of the United States’ dependence on foreign energy supplies.
The second oil crisis occurred after the Iranian Revolution, which significantly disrupted global oil supplies. As a result, oil prices surged, rising to more than twice their previous level. This shock further weakened an already fragile economy and deepened the stagflationary pressures. Together, the two oil crises contributed to two recessions during the 1970s.
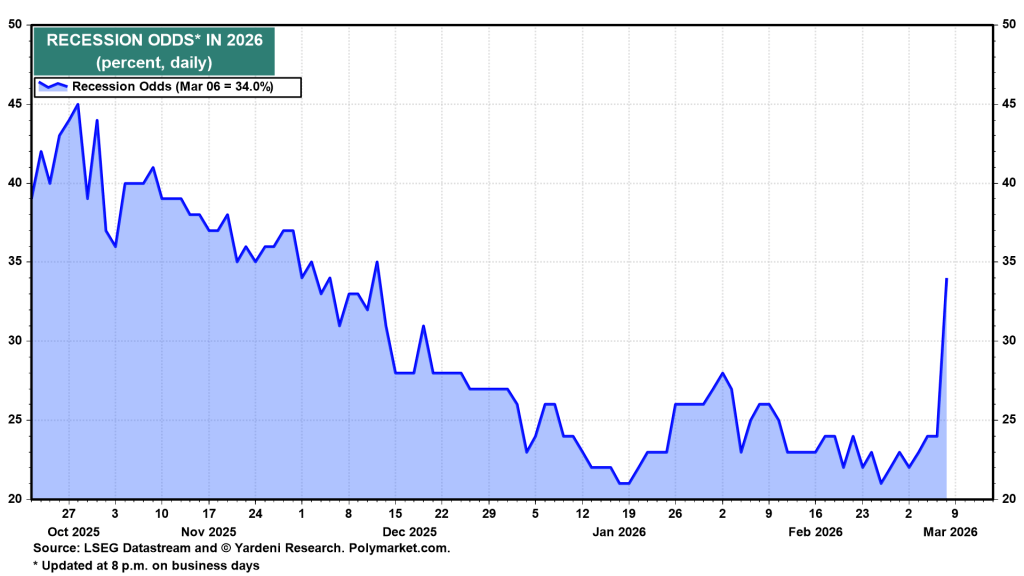
According to Polymarket, the probability of a recession this year rose to a three-month high of 34% on Friday, up from 21% on Wednesday, February 25, just before the conflict began (Fig. 11).
U.S. Strategy II: A Direct Confrontation with the IRGC
When the conflict began on Saturday, February 28, the initial assumption was that it would end quickly. However, by the following Tuesday, that view changed, prompting further analysis in that day’s QuickTakes. A key concern is that by eliminating the leadership of the Iranian regime in the opening hour of the war, the United States and Israel effectively unleashed the regime’s most powerful force—the Islamic Revolutionary Guard Corps (IRGC). Often described as a “state within a state,” the IRGC is believed to control 20–40% of Iran’s economy, including large construction companies, telecommunications networks, and oil engineering firms. This financial base allows it to sustain operations even under severe sanctions.
In April 2019, the United States officially designated the IRGC as a Foreign Terrorist Organization—the first time Washington had applied such a label to a branch of another government. Because of their decentralized structure and access to weapons such as suicide drones, the group would be difficult to eliminate through air power alone.
Donald Trump first publicly demanded Iran’s “unconditional surrender” on Friday, March 6. The following day, he clarified that the phrase meant a situation where Iran could no longer continue fighting. On Sunday morning, he also warned that any new Supreme Leader selected by Iran’s Assembly of Experts “would not last long” without his approval, implying a U.S. veto over the succession process following the death of Ali Khamenei.
Without a central leader, Iran lacks a figure capable of formally accepting unconditional surrender. For example, on Saturday, Iranian President Masoud Pezeshkian issued a public apology for Iran’s “fire-at-will” attacks on neighboring countries. Yet only hours later, the IRGC launched another wave of strikes, highlighting a severe breakdown in command and control after Khamenei’s death on February 28. Even without the regime’s top leader, the IRGC’s decentralized design allows regional commanders to operate independently, already carrying out retaliatory drone and missile attacks against U.S. assets and allies in the Gulf.
One objective of the ongoing air campaign is to weaken the IRGC’s ability to suppress domestic opposition. By striking the Basij—the IRGC’s paramilitary force used for internal control—the United States hopes to open the door for a possible uprising inside Iran. However, from the perspective of financial markets, the war will not truly end until commercial ships can move through the Strait of Hormuz without the threat of IRGC attacks. Once that happens, the stock market’s bullish trend could resume.
U.S. Economy: Domestic Impact
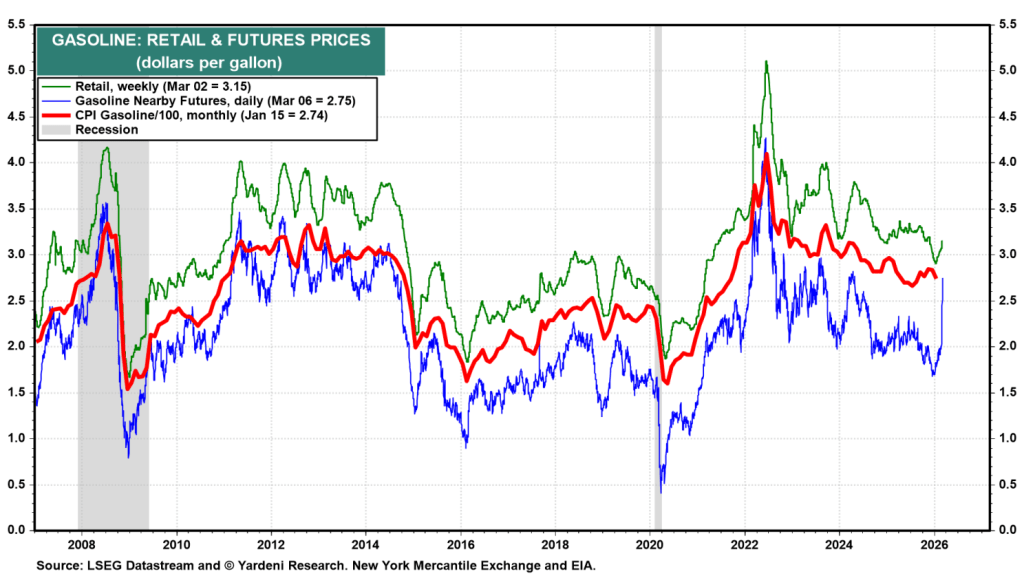
Within the United States, economic data from January and February were collected before the war and present a mixed picture. Data from March will likely reveal the first economic effects of the conflict, including rising inflation and a weakening labor market. One immediate sign of inflationary pressure is the sharp increase in gasoline prices, driven by the surge in crude oil prices (Fig. 12).
Food prices may not increase right away, but fertilizer shortages could push them higher in the months ahead. Roughly 25%–33% of the global nitrogen fertilizer trade—particularly urea and anhydrous ammonia—moves through the Strait of Hormuz. On March 2, an Iranian drone attack struck the Ras Laffan Industrial City in Qatar, the world’s largest export hub for liquefied natural gas. Since natural gas is the main feedstock used to produce nitrogen fertilizers, disruptions there could have significant downstream effects. Meanwhile, Saudi Arabia, Oman, and the United Arab Emirates—all among the world’s top ten exporters of urea—are facing logistical and production challenges because of the ongoing air conflict.
If the blockade remains in place into early April, farmers might be forced to shift away from nitrogen-intensive corn-based fertilizer systems toward soybean alternatives or simply reduce fertilizer usage. Lower fertilizer application typically results in reduced crop yields, which could lead to a secondary food price shock toward the end of 2026.
This conflict represents another major test of the resilience of the U.S. economy since the beginning of the decade. It also challenges the so-called “Roaring 2020s” outlook. Despite the new risks, that optimistic scenario remains the base case with a 60% probability. However, the likelihood of a 1970s-style stagflation scenario has been raised to 35%, while the probability of a market melt-up has been reduced to 5% for the rest of 2026.
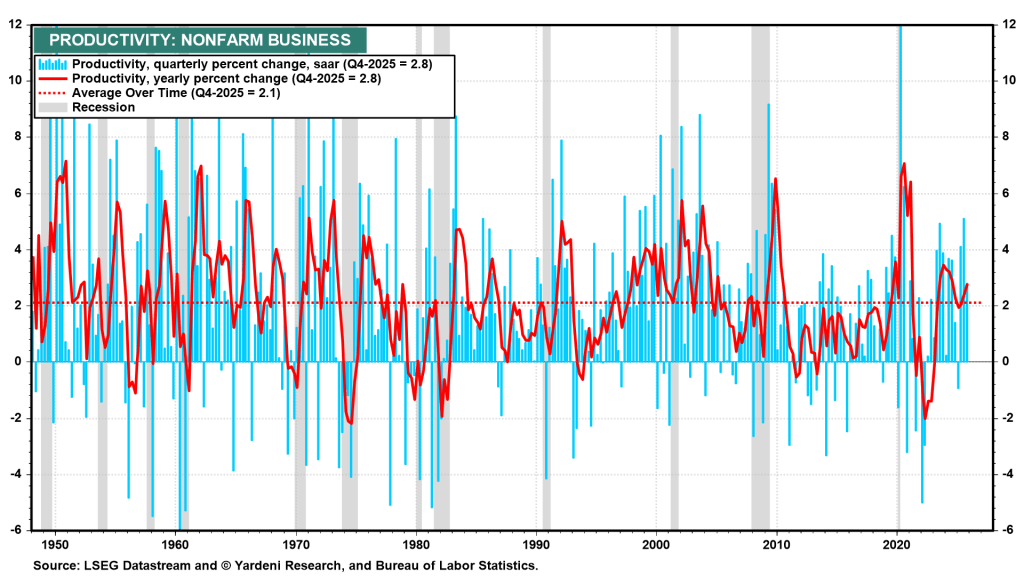
Recent economic data suggest that the labor market weakened in February and retail sales were soft in January. On the positive side, productivity growth has been particularly strong in recent quarters. If that trend continues, higher productivity could help mitigate some of the stagflationary pressures created by the war.
Employment
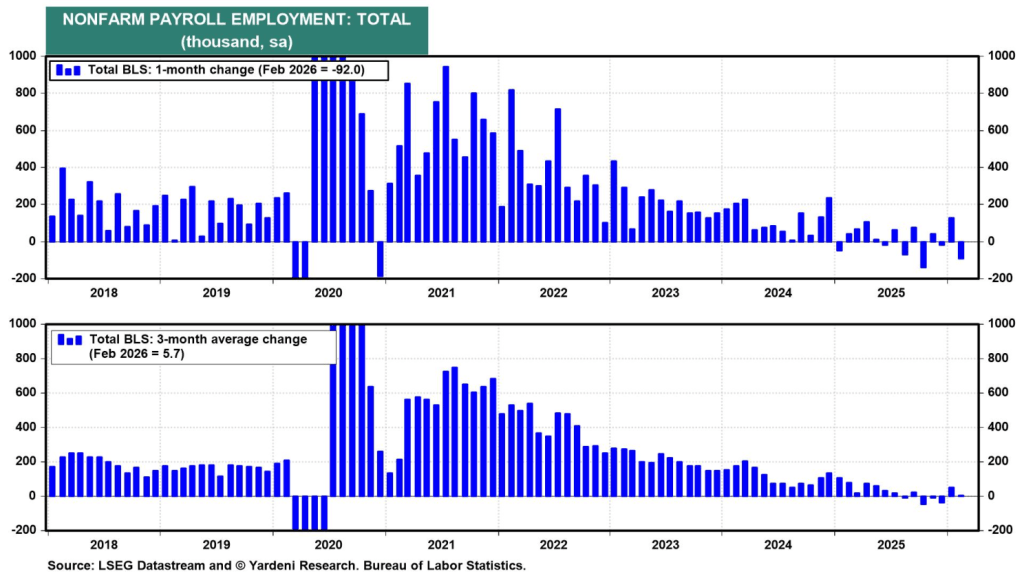
The January employment report came in significantly stronger than expected, whereas the February report was much weaker than forecasts. Severe weather conditions and a labor strike negatively affected February’s figures. As a result, nonfarm payrolls declined by 92,000 last month.
In addition, the January payroll figure was slightly revised downward by 4,000 to 126,000, while December’s data was adjusted from a previously reported gain of 48,000 to a decline of 17,000 (Fig. 13). Meanwhile, the unemployment rate increased marginally, rising to 4.4% in February from 4.3% in January.
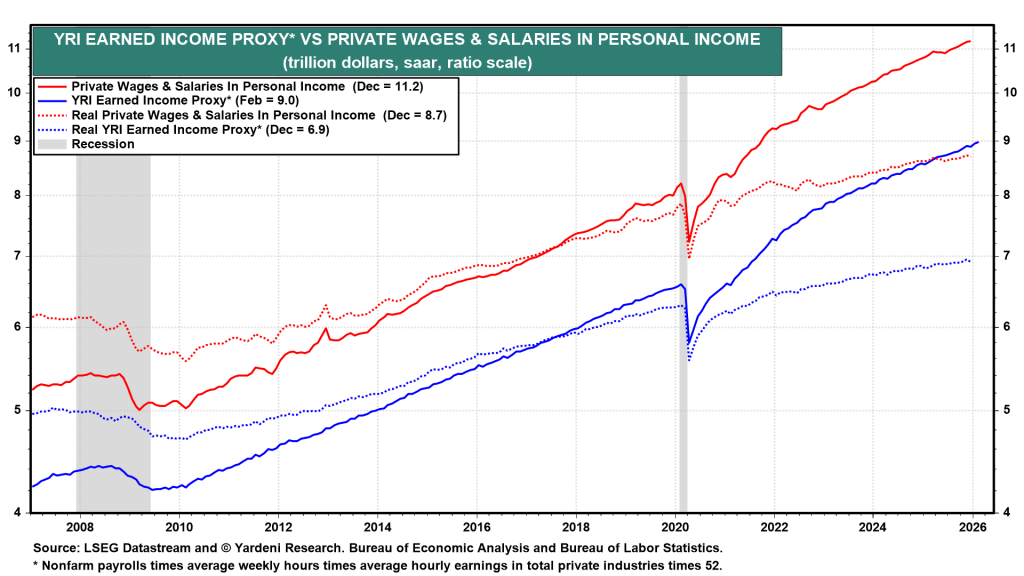
The positive development is that average hourly earnings increased by 0.4% month over month in February, while the average workweek remained unchanged. Consequently, our Earned Income Proxy, which estimates wages and salaries within personal income, rose by 0.3% in February, reaching a new record high (Fig. 14).
The Federal Reserve is facing a policy dilemma: a softening labor market, which would normally justify cutting the federal funds rate, versus rising energy and fertilizer costs linked to the Iran conflict, which could push inflation higher and argue for keeping rates unchanged or even tightening policy.
This clash of signals complicates the Fed’s next move. Weak employment data suggests the economy may need monetary support, while higher oil and commodity prices risk reigniting inflation, forcing policymakers to remain cautious about easing.
Retail Sales
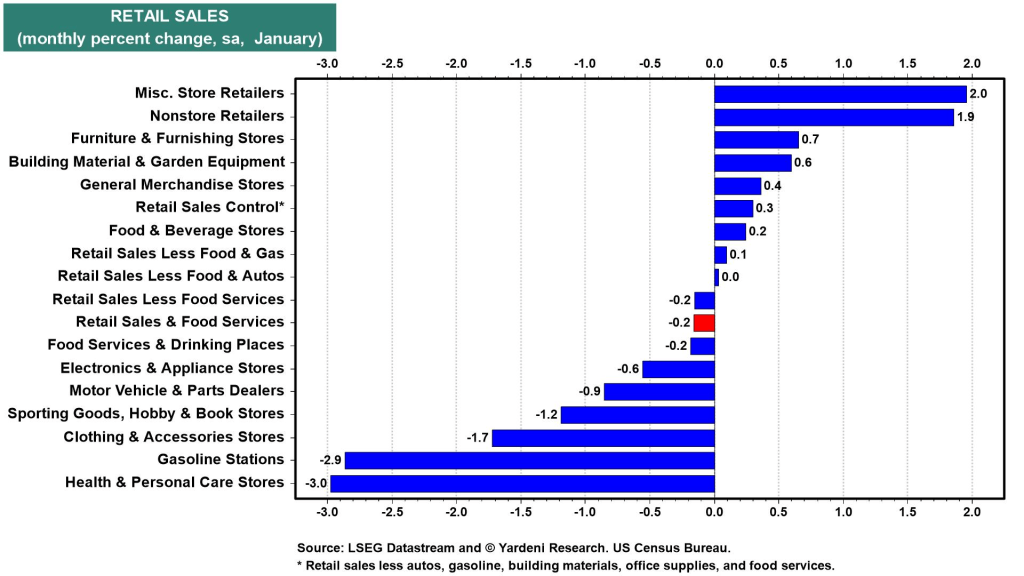
In January, retail sales declined by 0.2% month over month, while December’s figures, previously reported as showing moderate growth, were revised downward to no change compared with the previous month.
Among sectors, nonstore retailers experienced a 1.9% monthly increase, whereas motor vehicle and parts dealers recorded a 0.9% decline (Fig. 15). Sales at gasoline stations also dropped 2.9%.
One positive sign was a 0.3% month-over-month rise in core retail sales, which excludes several more volatile categories.
The rollout of last year’s One Big Beautiful Bill Act is expected to support consumer spending in the weeks ahead. A “February rebound” in retail activity is likely as record-high tax refunds—about 20% larger on average than last year—begin reaching households’ bank accounts.
Productivity
Labor productivity—defined as output per hour worked—increased at an annualized rate of 2.8% in Q4 2025. This marks the third consecutive quarter in which productivity growth has surpassed the long-term average of 2.1%, a benchmark calculated from data beginning in the late 1940s (Fig. 16).
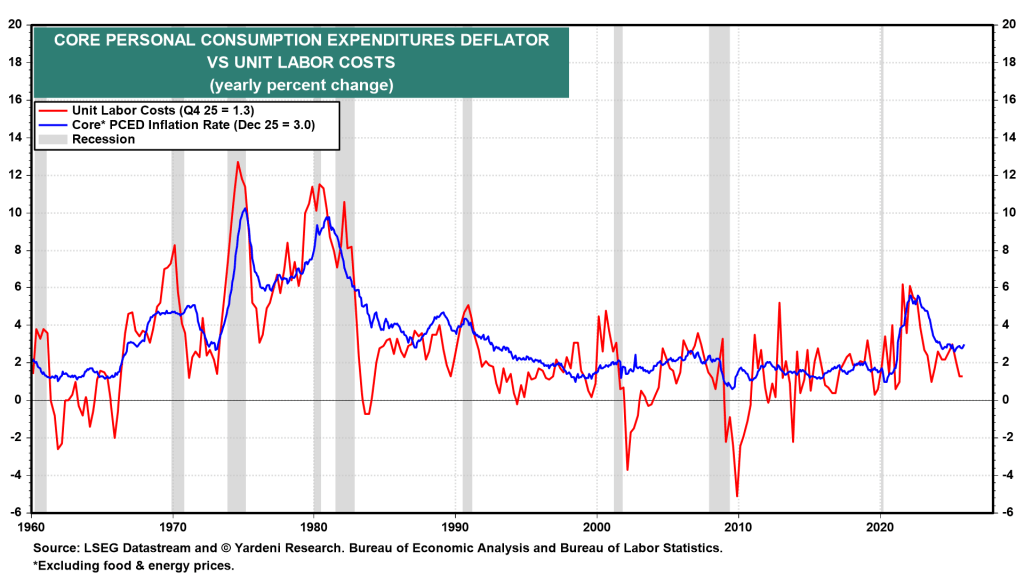
At the same time, unit labor costs rose by only 1.3% year over year in Q4 2025, which helped contain inflationary pressures in the economy (Fig. 17).
GDPNow
As noted earlier, the newest economic data prompted the Federal Reserve Bank of Atlanta’s GDPNow model to lower its forecast for first-quarter 2026 economic growth from 3.0% to 2.1% (Fig. 18).
Sources: Ed Yardeni

Leave a comment