EUR/USD was trading near 1.1546 on March 12, extending a sharp three-day decline that has wiped out weeks of recovery efforts within just a few sessions. The pair reached a high of 1.2082 on January 27—its strongest level since June 2021—but has since formed a clear sequence of lower highs and lower lows, a classic signal of a sustained downtrend. From the January peak to current levels, the pair has fallen by roughly 536 pips, suggesting more than a simple correction. Instead, the shift points to a broader change in market dynamics: the dollar has regained control while the euro has moved firmly onto the defensive.
The decline has been structured enough to resemble a steady trend, yet sharp reversals around key turning points have repeatedly caught bullish traders off guard. After the initial breakdown in late January, EUR/USD briefly stabilized around the 1.1700 region before rolling over again. The pair later touched a low near 1.1507, followed by a modest rebound that quickly lost momentum. That bounce failed to convincingly retake 1.1600, leaving the market once again testing the psychologically important 1.1500 level, a threshold closely monitored by technical analysts in recent weeks.
A major catalyst behind this move has been the conflict involving Iran that erupted on February 28, which has widened the economic divergence between the United States and the Eurozone. The surge in energy prices has played a particularly significant role. Brent crude has climbed to around $97 per barrel, while West Texas Intermediate is trading near $93.
In response to the supply shock, the International Energy Agency authorized the release of more than 400 million barrels from strategic reserves, with the United States contributing over 172 million barrels. Even with these emergency measures, oil prices continued to rise, underscoring the severity of the supply disruption currently being priced into global energy markets.
Iraq announced it would suspend port operations at key oil export terminals after two tankers were attacked in the Persian Gulf. As a result, the risk of disruption to the Strait of Hormuz is no longer theoretical—it is actively being priced into global energy markets.
For Europe, the implications are particularly severe. Unlike the United States, the continent lacks sufficient domestic energy production to offset supply shocks. Its energy system has already been strained by the sharp reduction in Russian gas flows following the Russia–Ukraine War. Now, policymakers are confronting another potential surge in energy costs, with analysts warning that European inflation could climb above 3% in the coming months. Meanwhile, Iran has openly stated its goal of pushing oil prices toward $200 per barrel, leaving European economic planners with few credible short-term countermeasures.
The situation looks very different for the United States. As the world’s largest oil producer, higher crude prices translate into stronger revenues for domestic energy companies. While rising oil prices complicate the Federal Reserve’s path toward monetary easing, they do not represent the kind of systemic import shock faced by Europe. In addition, the global oil trade is largely settled in U.S. dollars, meaning elevated energy prices tend to reinforce structural demand for the currency. The same oil shock that weighs on the euro therefore provides underlying support for the dollar. This imbalance lies at the heart of the current bearish outlook for EUR/USD and is unlikely to shift unless geopolitical tensions ease or Europe secures alternative energy supplies at scale—neither of which appears imminent.
Recent inflation data has done little to alter this outlook. February headline Consumer Price Index (CPI) rose 0.3% month-over-month and 2.4% year-over-year, while core CPI increased 0.2% on the month and 2.5% annually. The readings were not alarming, but they also failed to give markets a clear signal that the Federal Reserve is ready to pivot toward easier policy.
The 2.5% core inflation rate, although near recent lows, remains above the Fed’s 2.0% target. More importantly, the forward-looking risks are intensifying. With crude oil trading near $97 per barrel and the conflict involving Iran showing little sign of resolution, higher energy costs are likely to filter through to consumer prices over the next two to three CPI releases, reinforcing concerns that inflation pressures could reaccelerate.
The market’s expectations have shifted dramatically. Earlier in 2026, investors widely anticipated multiple Federal Reserve rate cuts during the first half of the year. That outlook has since been completely overturned. Futures markets now price in only a single 25-basis-point cut in September, meaning the first potential easing step would arrive nine months into the year—far later and far smaller than previously expected.
This sharp repricing has provided strong support for the U.S. dollar. Elevated yields on U.S. Treasury securities relative to their European counterparts have widened the interest-rate differential that typically drives capital flows. As returns on dollar-denominated assets increase compared with euro assets, funds tend to move from EUR into USD holdings. When that spread widens, EUR/USD usually declines—and it has been expanding steadily since January.
The U.S. Dollar Index (DXY) is currently trading near 99.39, just below a key resistance level around 99.68, after touching a 15-week high of 99.70 earlier in the week. The index has now posted three consecutive sessions of gains, supported by rising oil prices and renewed safe-haven demand for the dollar.
Technically, the outlook for the dollar remains constructive. DXY is trading comfortably above both its 50-day and 200-day exponential moving averages, a configuration that typically signals underlying strength. Momentum indicators are also supportive: the Relative Strength Index (RSI) is climbing toward the 60–65 range, suggesting there is still room for further upside before conditions become overbought.
From a technical perspective, the 0.236 Fibonacci retracement near 99.18 is acting as immediate support. Below that, the channel midpoint and the 0.382 Fibonacci level around 98.87 represent a deeper support zone. A confirmed break above 99.68 would likely open the door to a move toward 100.00 and potentially 100.32.
If such a rally unfolds, it would likely intensify pressure on EUR/USD. Historically, each incremental advance in the dollar index toward the 100 level tends to translate into further compression in the euro pair, potentially pushing it toward 1.1450 and even 1.1391.
In the near term, only two developments appear capable of interrupting the dollar’s upward momentum: a shift toward a more dovish tone from the Federal Reserve during its March 18 policy communication, or a sudden de-escalation in Middle East tensions that triggers a sharp decline in crude oil prices. Until one of those catalysts emerges, the macro and technical backdrop continues to favor dollar strength.
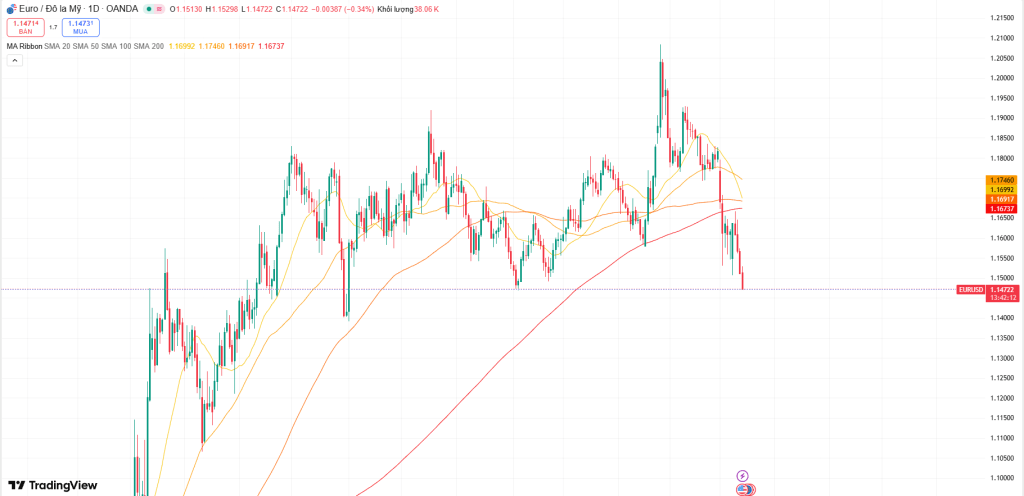
EUR/USD broke below its 200-day Simple Moving Average (SMA) at 1.1672 on March 3, marking a key structural shift in the pair’s trend. Before that breakdown, the 200-day average had acted as a heavily contested level between buyers and sellers. Once the pair decisively moved below it, the level flipped into resistance—a classic technical reversal. Since then, every attempt to reclaim the 1.1672 area has failed. The pair’s earlier peak at 1.2082 on January 27 was followed by a steady decline that has carried EUR/USD down to its current levels.
The 100-day SMA, located near 1.1696, is now flattening, a development that often precedes a bearish crossover with the 200-day average. Meanwhile, on shorter time frames, the 50-day EMA has already crossed below the 200-day EMA on the 2-hour chart, forming a Death Cross—a signal that reinforces the prevailing bearish bias among short-term traders. Price action remains below the 50-day EMA, which is now functioning as dynamic resistance during intraday rebounds.
Momentum indicators also lean bearish. The 14-day Relative Strength Index (RSI) has fallen toward 33, approaching but not yet reaching the oversold threshold near 30. This suggests the pair still has room to move lower before a technical rebound becomes more likely.
The Moving Average Convergence Divergence (MACD) indicator remains below both its signal line and the zero level, confirming ongoing downward momentum. Although the histogram bars have begun to contract slightly—hinting at a potential slowdown in momentum—the broader directional bias remains negative.
Finally, the Average Directional Index (ADX) sits near 29, indicating that the current downtrend is strengthening rather than fading. Since ADX measures the strength of a trend rather than its direction, this reading suggests that bearish momentum in EUR/USD is continuing to build.
The 1.1500 level has become the immediate battleground for EUR/USD. This area aligns with Monday’s intraday low and represents one of the strongest psychological support levels on the chart. During Monday’s session, the pair briefly dipped to 1.1507 before staging a modest rebound. However, that bounce quickly faded and now appears to have been little more than a temporary dead-cat bounce, leaving the pair once again approaching the 1.1500 threshold, this time from a technically weaker position.
A decisive daily close below 1.1500—not merely an intraday dip—would significantly shift the technical outlook. The next clear support lies at the November 5, 2025 low of 1.1468, followed closely by 1.1450. If selling momentum continues through those levels, attention would likely turn to the August 1, 2025 low at 1.1391, which becomes the next major downside target. From current levels, that would represent roughly a 155-pip decline, adding to a move that has already erased more than 500 pips since the January peak.
On the upside, 1.1600 serves as the first hurdle bulls must reclaim before any meaningful recovery attempt can develop. Even then, the pair would still need to challenge the 200-day Simple Moving Average near 1.1672. Beyond that, 1.1700 stands as the critical structural level: a daily close above it would effectively undermine the current bearish framework and potentially open the door toward the 1.1800–1.1825 resistance zone.
However, achieving such a recovery would likely require a significant shift in the macro backdrop—something that currently appears absent. In the meantime, the broader Fibonacci retracement band between 1.1644 and 1.1714 continues to act as a strong ceiling for any rallies, making upward progress difficult while leaving the downside path comparatively clearer.
GBP/USD trading near 1.3378 and extending losses for a third straight session is not simply a U.K.-specific issue. Instead, it reinforces the idea that the dollar strength pushing EUR/USD lower reflects a broader, systemic move rather than a euro-only story. Sterling was rejected from the 1.3480–1.3500 resistance zone and has since reversed sharply, with price now sitting below both the 200-day EMA and the 50-day EMA, which have shifted from support to overhead resistance.
Technically, the pair did form a modest higher low near 1.3280, but momentum indicators are weakening. The Relative Strength Index (RSI) is rolling over around the mid-50 region, a pattern that often signals fading bullish momentum and can precede another leg lower. If GBP/USD breaks decisively below 1.3300, the next downside targets appear near 1.3215 and then 1.3150.
For sterling to stage a more meaningful recovery, bulls would first need to reclaim 1.3480 and break above the descending trendline that has capped price action since late January. That trendline has remained intact since it formed, reinforcing the broader bearish structure. Until it is convincingly broken, rallies are likely to face selling pressure, while dips continue to look for the next support level below.
The parallel weakness in GBP/USD alongside EUR/USD suggests that the current market dynamic is not limited to euro fundamentals. Instead, it reflects a broader U.S. dollar appreciation cycle, driven by rising energy prices, inflation concerns, and the repricing of expectations around Federal Reserve policy. Those forces are exerting pressure across major currency pairs simultaneously.
Analysts at Deutsche Bank have noted that the European Central Bank is likely to maintain a cautious policy stance while inflation risks remain unresolved. Although this approach resembles the position of the Federal Reserve, the euro area faces a more fragile economic backdrop. Europe is more directly exposed to energy price shocks than the United States, relies more heavily on export demand that is weakening amid global trade uncertainty, and has less flexibility to sustain high interest rates given the debt burdens of several peripheral Eurozone sovereign economies.
The Federal Reserve, with policy rates in the 3.50%–3.75% range, is operating from a position that remains relatively strong despite restrictive conditions. U.S. economic fundamentals continue to show resilience: GDP growth has remained positive, the labor market has held firm, and the domestic energy sector actually benefits from elevated oil prices.
The situation is very different for the European Central Bank. The ECB must manage monetary policy for a 20-nation bloc, where consensus decision-making can slow policy responses. At the same time, Germany—the largest economy in the euro area—is dealing with an ongoing industrial slowdown. This leaves the ECB with less room to project a convincingly hawkish stance. As the yield spread between U.S. and European government bonds widens, capital continues to flow toward dollar-denominated assets. For EUR/USD to stage a meaningful recovery, either the ECB would need to raise rates or the Fed would need to cut—scenarios that appear unlikely over the next couple of months.
The geopolitical backdrop has further complicated matters. When Iraq announced the closure of its oil export ports after tanker attacks in the Persian Gulf, it removed an important marginal supply source from an already tight energy market. In response, the International Energy Agency authorized the release of 400 million barrels from strategic reserves, including 172 million barrels from the United States. Yet oil prices continued climbing, signaling that traders believe the supply disruption linked to the Strait of Hormuz is more significant than emergency reserves can offset in the near term.
Iran has openly discussed pushing crude prices toward $200 per barrel, a target that highlights the asymmetric risk facing global markets. Even if prices fall short of that level, the implications remain serious. At around $120 oil, European inflation could move above 3%, forcing the ECB to confront stagflation risks that would limit its ability to ease policy. If crude were to approach $150, energy-intensive industries in Europe could face severe demand destruction, threatening eurozone growth. In a scenario where oil reached $200, the strain on the European economy could be profound, potentially pushing EUR/USD toward levels not seen since the early 2000s. Importantly, the bearish outlook for the euro does not require such extreme outcomes—simply keeping oil above $90, which is already the case, maintains pressure on the currency.
From a trading perspective, EUR/USD near 1.1546 remains vulnerable within a well-defined descending channel that began after the January 27 peak at 1.2082. The technical structure is reinforced by a sequence of lower highs and lower lows. Several key indicators now act as resistance: the 200-day SMA around 1.1672, the 50-day EMA, and the 100-day SMA near 1.1696. Meanwhile, the Average Directional Index (ADX) near 29 suggests the downtrend is strengthening rather than fading, while the RSI near 33 indicates there is still room for further downside before oversold conditions prompt a technical rebound.
In this context, rallies toward the 1.1600–1.1640 resistance zone are likely to face selling pressure. The immediate technical pivot remains 1.1500. A decisive daily close below that level would expose further downside targets around 1.1446, followed by the November 2025 low near 1.1391.
A bullish scenario would likely require a strong rejection from below 1.1500, ideally accompanied by a sharp reversal candle and increased trading volume, which could support a short-term rebound toward 1.1600. Outside of that narrow tactical setup, however, the broader picture remains bearish. With crude oil trading near $97, the U.S. Dollar Index hovering around 99.39, the Fed maintaining a steady policy stance, and the ECB constrained by weaker regional fundamentals, the macro environment currently offers little reason to expect a sustained EUR/USD recovery.
Sources: Itai Smidt

Leave a comment