Trading volume has begun to increase, with selling pressure dominating, though the market has not yet confirmed the start of a new downtrend. While news headlines suggest a more severe market deterioration, price action has not fully validated that narrative so far.
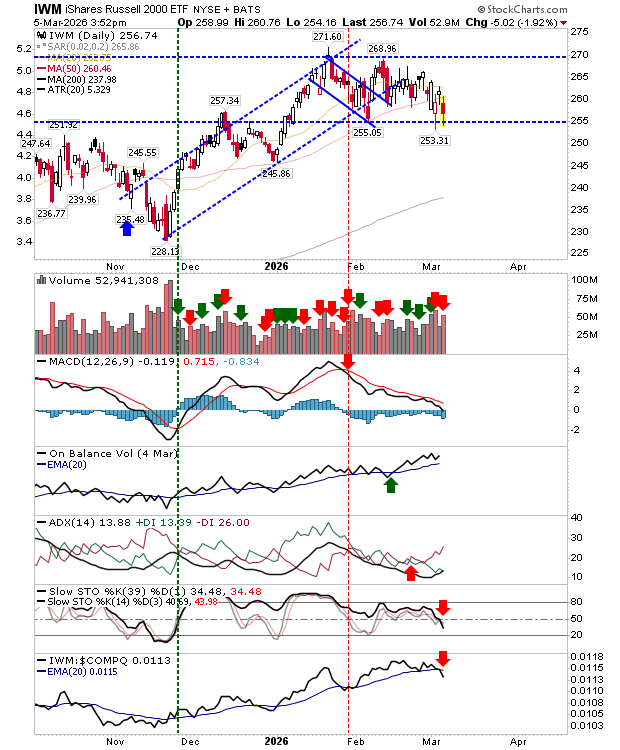
The Russell 2000 (IWM) has gradually drifted toward range support, forming a series of lower highs but still avoiding lower lows. This tightening structure could eventually resolve with a decisive bearish breakdown—likely marked by a strong red candlestick—which would present a potential short opportunity targeting the 200-day moving average.
If that level is reached, the technical outlook would likely shift to a net-negative stance. At that point, the market could begin to reveal whether a broader bearish trend is developing.
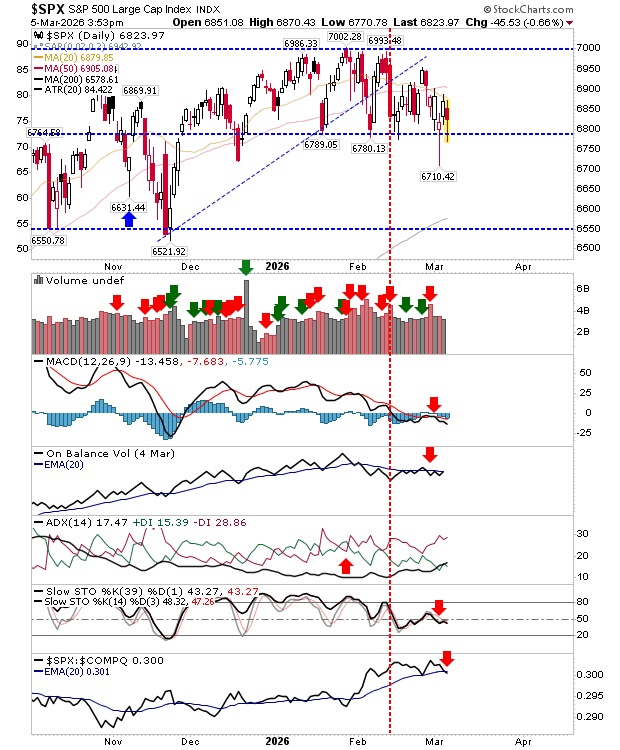
The S&P 500 is also approaching the lower boundary of its trading range, though it still has the early-week spike low acting as a reference level. Trading volume in recent sessions has remained relatively modest, but the broader technical picture has turned negative, highlighted by a newly formed downtrend in On-Balance Volume (OBV).
When prices move back toward a spike low, markets often break below that level if the session ultimately closes within the spike range. A decisive drop below 6,800 would therefore create a potential short setup, with risk managed by placing a stop on a daily close back above 6,800.
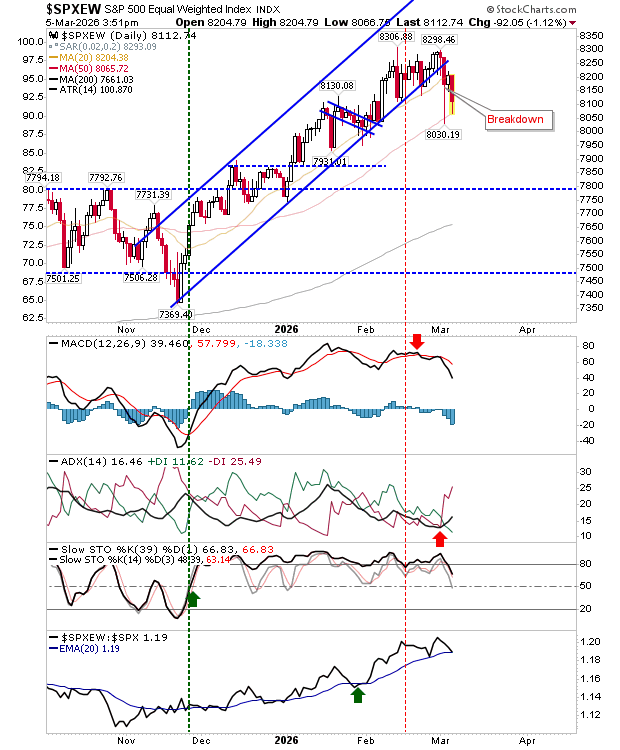
The equal-weighted S&P 500 may provide clearer insight into the market’s direction. It recently registered a clear trend break and has since completed two successful retests of its 50-day moving average. Given how frequently this level has been tested, a third retest would not be surprising—and that attempt could potentially lead to a breakdown below the 50-day MA.
Technical indicators currently present a mixed picture. For the time being, the most reasonable interpretation is that the index remains in a trading range, similar to the consolidation pattern observed in the market-cap-weighted S&P 500.
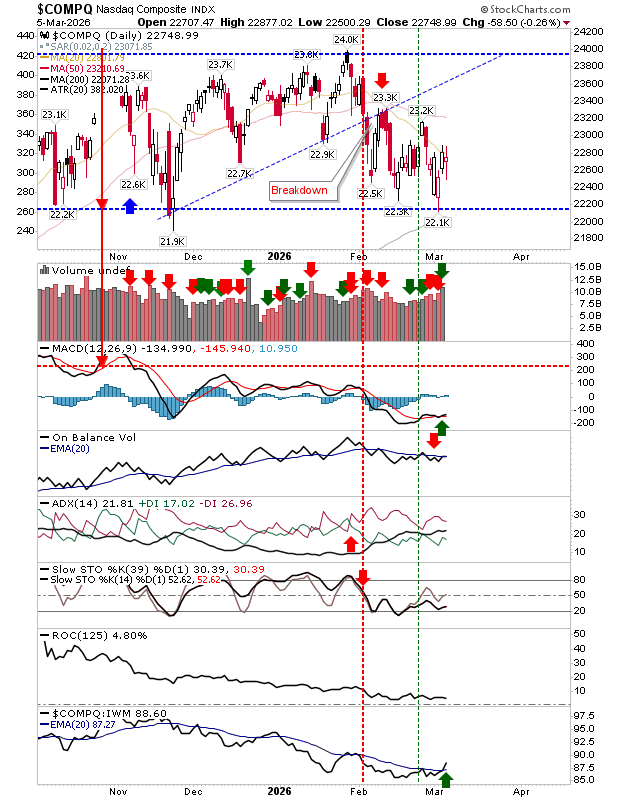
The Nasdaq is showing slightly better resilience compared with other major indices. Yesterday’s volume was classified as accumulation, indicating some buying interest. However, the 20-day moving average is currently acting as resistance and is quickly converging with range support and the 200-day moving average.
This tightening price structure suggests a potential volatility squeeze, which is likely to lead to a sharp breakout. Once that move occurs, traders can look to position themselves in the direction of the breakout.
Bitcoin has made an initial move higher, successfully breaking above its 20-day moving average. Although prices have pulled back slightly since the breakout, the move remains intact and has not yet threatened the bullish shift.
The next upside target is the 50-day moving average, followed by the $85,000 level, which is likely to align with a test of the 200-day moving average.
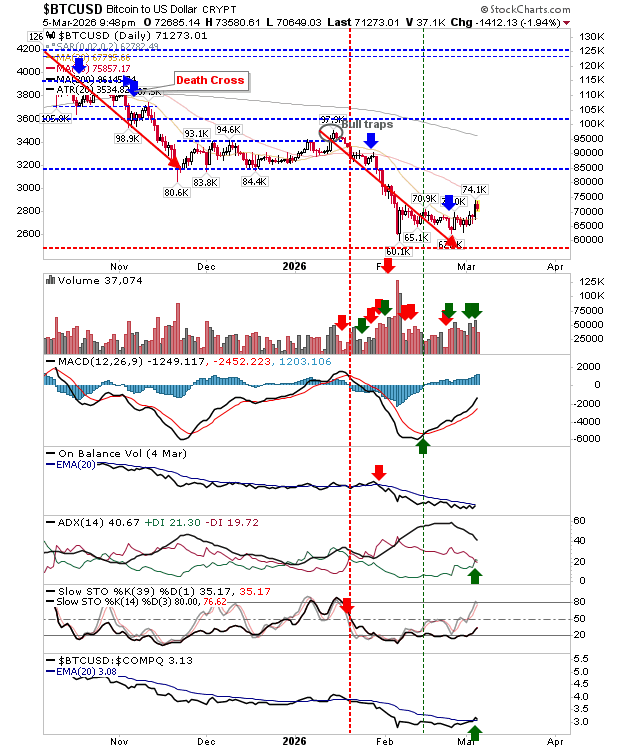
Potential short opportunities are beginning to emerge, but with markets still confined to trading ranges, entering positions too early carries a high risk of whipsaws. For the time being, bullish traders may find Bitcoin to be the more stable long setup, as it continues to hold above its recent breakout level.
Sources: Declan Fallon

Leave a comment