Beyond the surge in oil prices — which had already been climbing before Israel and the accompanying U.S. strike on Iran — the longer-term market consequences remain uncertain. I closely monitor how major indices trade relative to their 200-day moving averages. Since late 2025, this positioning has normalized, no longer appearing overbought or presenting the level of risk I had anticipated heading into 2026.
That said, clearly defined support levels are now in play and are likely to be tested early next week. A break below these levels would not necessarily be severe, as the 200-day moving averages lie beneath and could provide a cushion. The real risk scenario would emerge if the Iran conflict escalates into sustained terrorist attacks targeting U.S. interests, potentially provoking direct U.S. (and possibly Israeli) ground involvement in Iran.
The Middle East rarely offers quick, decisive resolutions, and the U.S. has little historical success in such engagements to rely upon. In that kind of drawn-out conflict, markets could experience gradual, persistent losses that eventually shift the broader trend into bearish territory. If declines were to push indices decisively below their 200-day moving averages, it could create attractive long-term buying opportunities — even if headlines remain overwhelmingly negative.
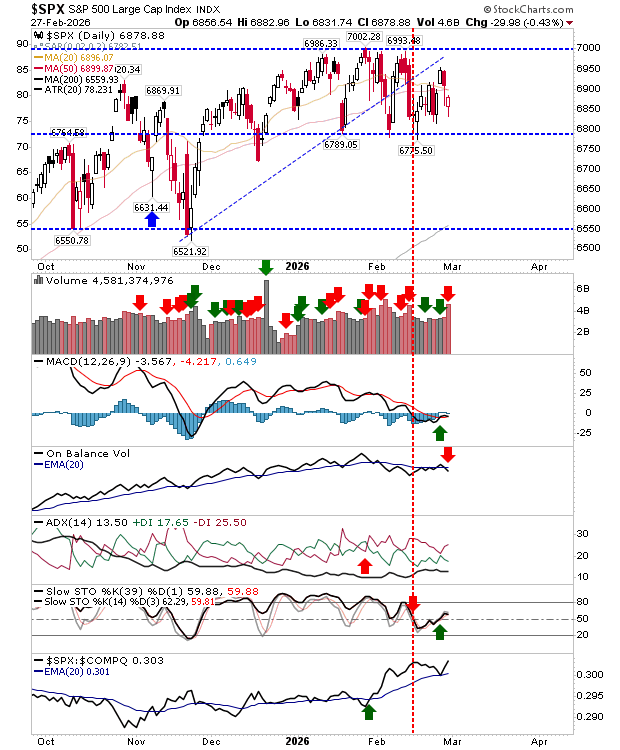
The S&P 500 ended Friday with a technical “sell” signal following higher-volume distribution. February has already seen several distribution days. Considering the questionable activity in prediction markets ahead of the Iran strikes, it raises the possibility that some February selling may have reflected insider positioning around a potential conflict. The elevated distribution volume on Friday — just before Saturday’s airstrikes — stands out as unusual, especially within what had been a range-bound market where volume is typically subdued.
Ultimately, speculation aside, we can only act on the data in front of us. For now, the S&P 500 remains a “hold.”
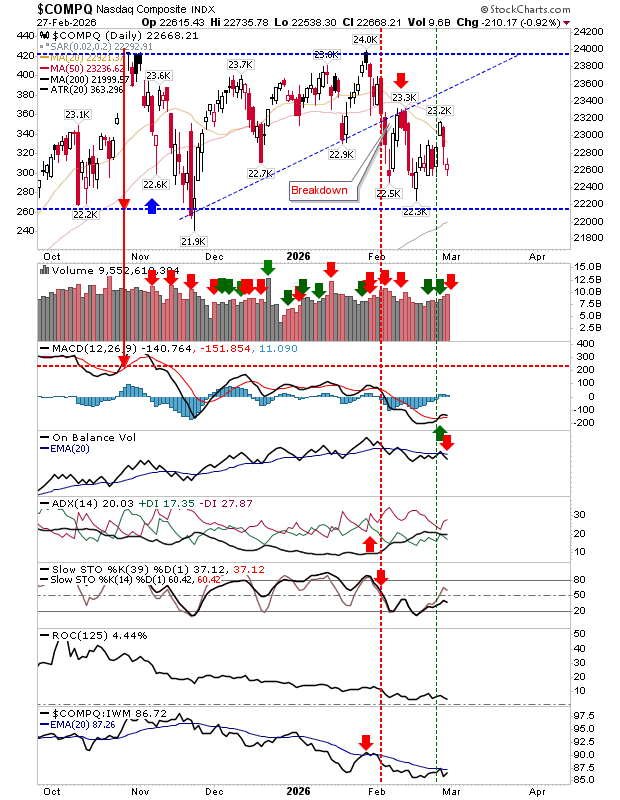
The Nasdaq Composite also registered a distribution day, though the signal was less pronounced than what we saw in the S&P 500. It’s possible the 200-day moving average could converge with established range support just as the index pulls back to retest that same level.
Technical indicators are giving mixed signals. The only outright positive is a weak MACD buy trigger, but that comes after an extended stretch of relative underperformance compared to the Russell 2000 (IWM). Under these conditions, a break below support would not be surprising — though it’s best to wait and see how price action unfolds.
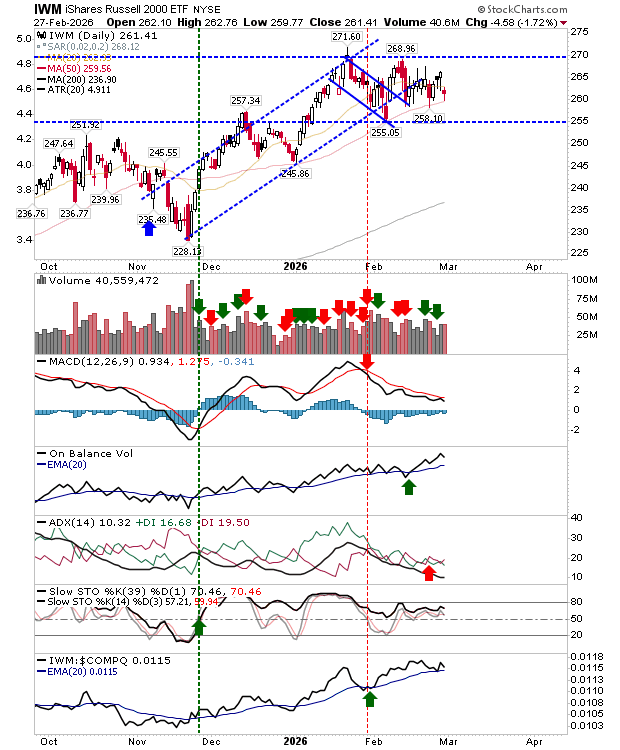
The Russell 2000 (IWM) may prove to be the most resilient in the face of negative headlines. Unlike the larger indices, it did not register a distribution day and continues to hold support at its 50-day moving average.
Technical indicators are leaning constructive: on-balance volume and stochastics are positive, ADX remains neutral, and although MACD is trending lower, it is still positioned above the bullish zero line. For now, the key question is how the index responds to the weekend developments — price action will ultimately provide the clearest signal.
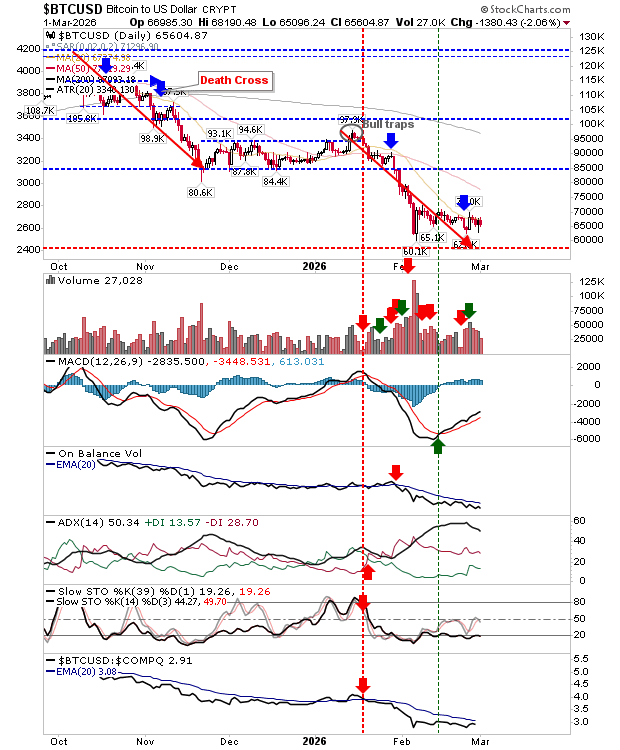
Bitcoin has responded relatively calmly to the developments surrounding Iran. From a trading perspective, there appears to be a swing setup forming, with a decisive move above $70K or below $65K likely to determine the next directional bias.
Given that the market is already in oversold territory, even a downside break may struggle to sustain prolonged weakness. Any dip could prove short-lived if buyers step in at lower levels.
An eventful week is shaping up, but this feels more like the beginning of a broader development rather than its conclusion.
Sources: Declan Fallon

Leave a comment