Macro uncertainty is intensifying just as EUR/USD and GBP/USD test pivotal technical zones. With interest-rate expectations shifting and tail risks mounting, the next directional move may depend more on macro catalysts than chart patterns.
Both pairs are hovering near critical support and resistance levels, while a dense lineup of U.S. and European data raises the prospect of increased volatility. The dollar continues to trade in close correlation with Treasury yields and evolving Federal Reserve rate pricing, reinforcing the macro-driven backdrop.
At the same time, tariff developments and geopolitical tensions are injecting additional tail risk ahead of the weekend, leaving markets vulnerable to sharp, sentiment-driven swings.
Summary
As the week moves into its final stretch, both Europe and the United States face a heavy slate of economic releases—and this is unlikely to be mere background noise for markets. Recent price action has already underscored how reactive EUR/USD and GBP/USD are to changes in relative rate expectations across the U.S., U.K., and euro area.
With both currency pairs now positioned near critical technical thresholds, the incoming data flow carries the potential to do more than simply inject volatility. It may ultimately determine whether the latest directional moves gain traction—or begin to lose momentum and reverse.
Heavy Data Calendar Lifts Volatility Threat
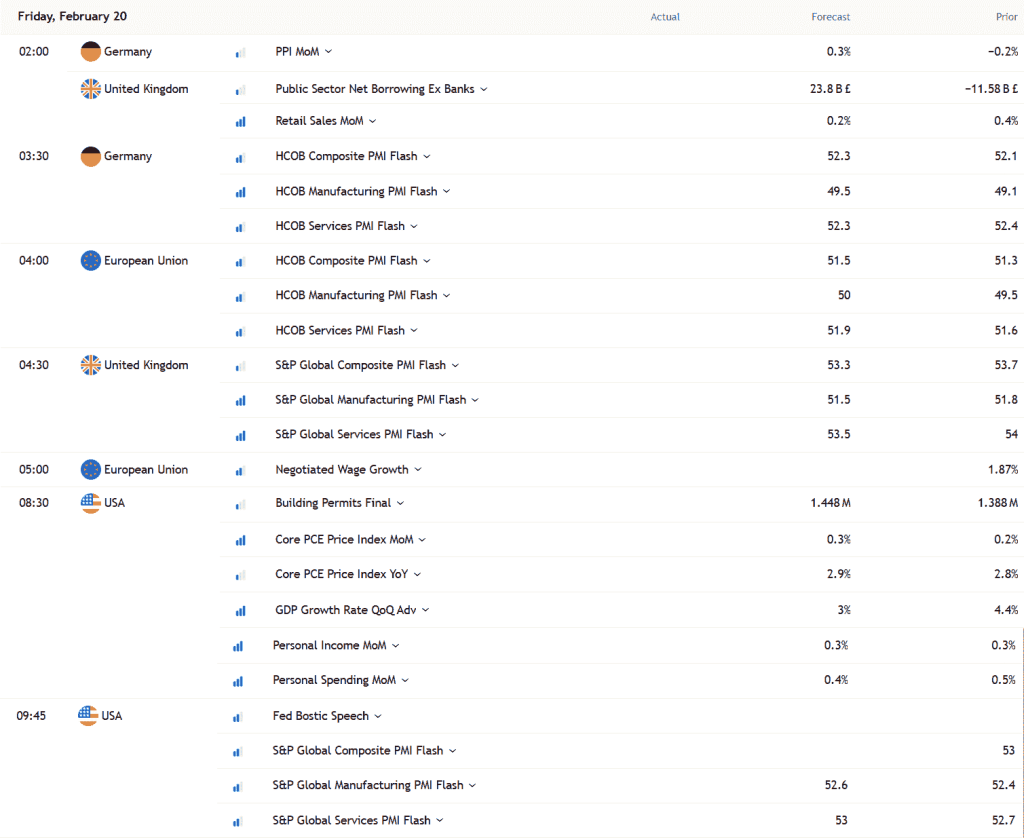
Flash PMIs rarely fail to generate movement in EUR/USD and GBP/USD, largely because European participants tend to respond far more decisively to the releases than traders elsewhere. In the euro area, the focus is likely to center on price components and new orders, especially in light of the recent resilience in the single currency. In the UK, attention may gravitate toward price pressures, employment trends, and overall activity, reflecting the economy’s persistent softness.
The more consequential headline risk, however, lies in the United States. The advance Q4 GDP print stands out. While backward-looking and heavily estimate-based, it still carries the potential to influence how the dollar closes the week. An upside surprise would reinforce the narrative of U.S. exceptionalism. A downside miss, on the other hand, could reignite expectations for Federal Reserve rate cuts—expectations that have recently been scaled back after generally firm data and relatively hawkish FOMC minutes.
December’s core PCE deflator rarely delivers genuine surprises these days. Enhanced data mapping has largely diminished its shock factor, shifting attention toward the consumption and income components instead. Markets will scrutinize the consumption data for signs that recent weakness in goods demand has spilled into services, while income figures should provide a clearer indication of households’ capacity to sustain spending.
US flash PMIs, meanwhile, have produced inconsistent market reactions and are often overshadowed when more significant releases land on the same day. Broadly speaking, they have tended to exaggerate the signal seen in ISM surveys. As a result, a stronger market response may emerge if there are clear signs of softening—particularly within the services sector.
Weekend Risk Premium Builds
Beyond the dense data schedule, traders also face mounting tail risks heading into the weekend. A ruling from the Supreme Court of the United States on the legality of tariffs imposed under the International Emergency Economic Powers Act (IEEPA) could arrive around 10 a.m. U.S. time, although there is no certainty a decision will be issued today. Even the possibility is sufficient to keep markets cautious, given the potential implications for Treasury yields and overall risk sentiment.
At the same time, Donald Trump has set a 10-day deadline for Iran to reach a deal or face potential military action. Considering the risks to global energy supply—and the United States’ position as a major energy producer—any pre-emptive strike would likely support the dollar against European currencies, particularly if it sparks a renewed wave of risk aversion.
Regarding tariffs, the market reaction may remain relatively muted regardless of the court’s decision—unless investors begin to question whether any shortfall in government revenues can be covered through alternative channels. Should doubts arise on that front, both the dollar and longer-dated Treasuries could face meaningful downside pressure as fiscal concerns move to the forefront.
Dollar Catalysts Return to Center Stage
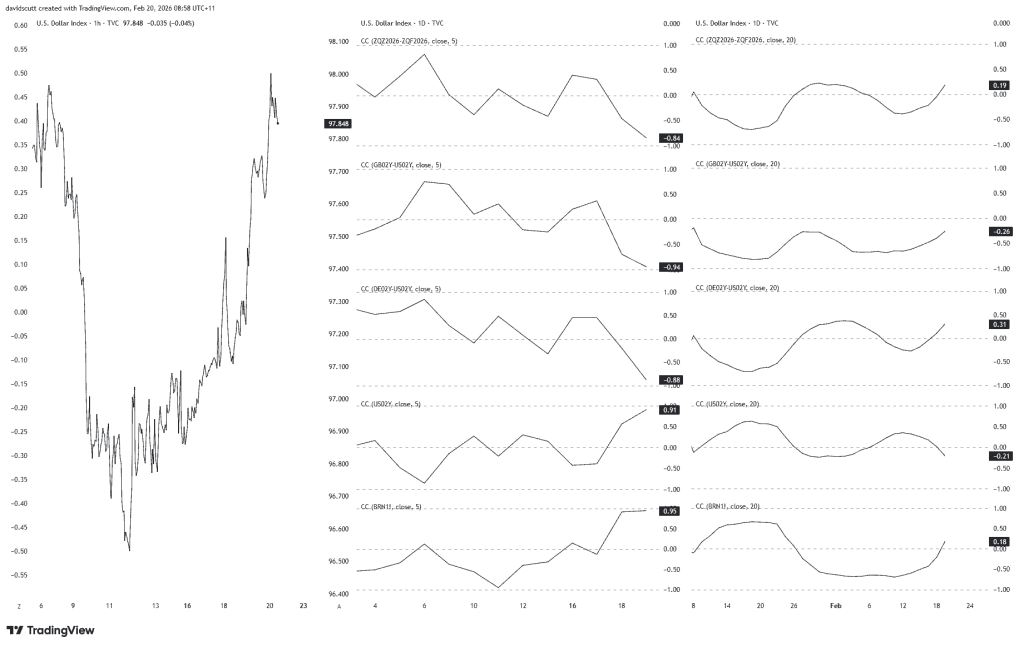
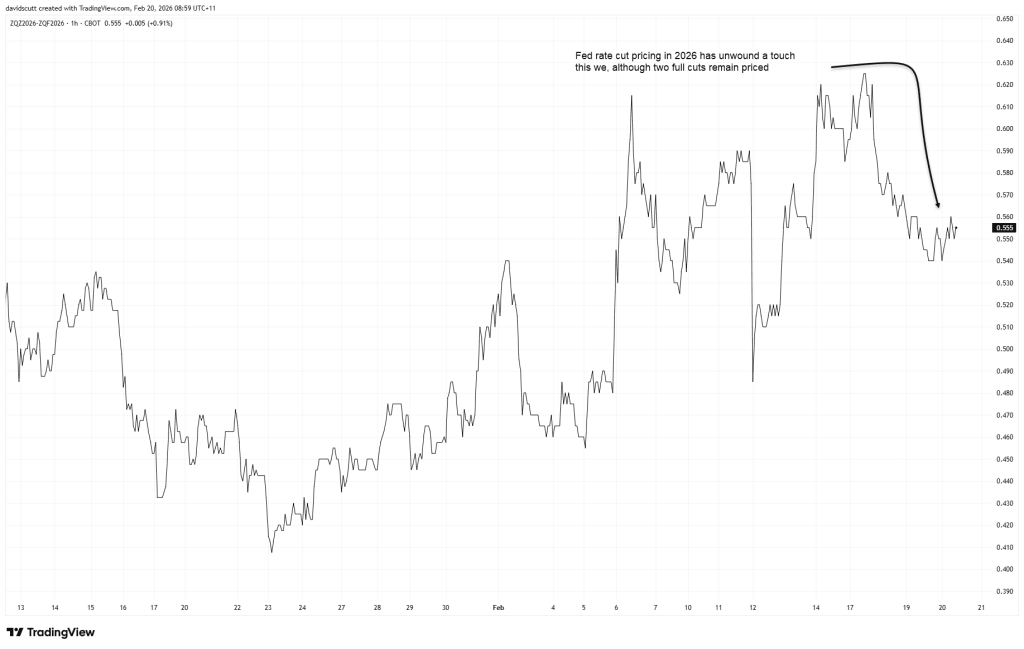
Underscoring the significance of the upcoming data and event risk, the US Dollar Index (DXY) has shown a notably tight correlation over the past week with Fed rate-cut expectations, front-end yield differentials, US two-year Treasury yields, and even Brent crude, as illustrated in the middle panel of the chart above. In practical terms, the dollar has reverted to trading primarily as a rates-and-yields narrative, with an added layer of sensitivity to energy prices.
Yet the 20-day correlation metrics shown on the right paint a much less compelling picture. Over the past month, these relationships have been weak and statistically insignificant, serving as a reminder that the recent alignment may prove temporary rather than structural.
GBP/USD Faces Growing Downside Pressure
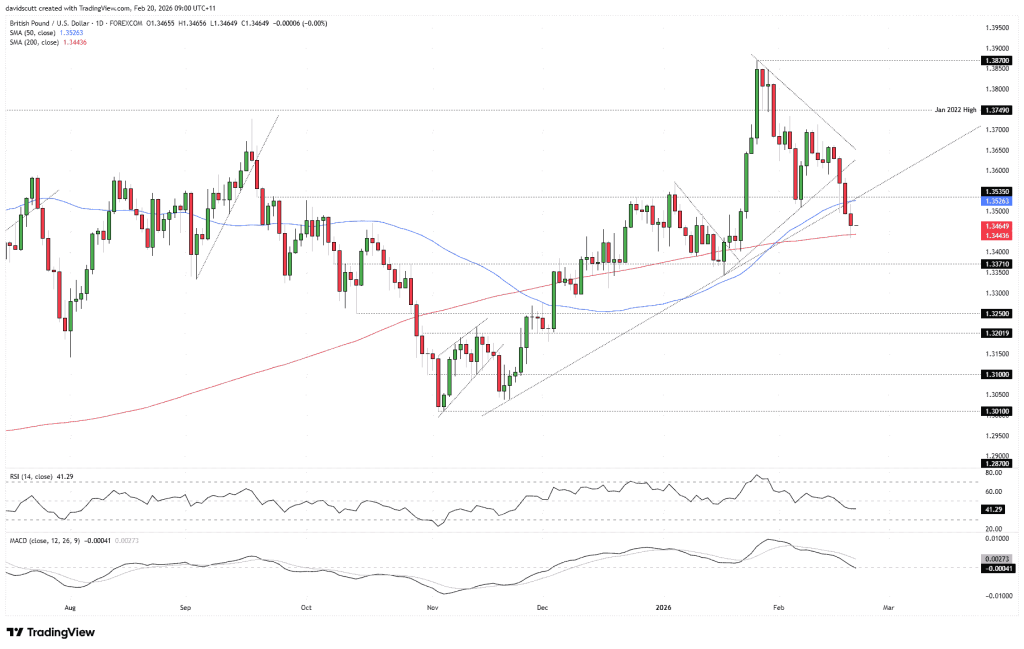
As discussed in earlier analysis this week, the release of key UK labour market and inflation figures acted as the catalyst that pushed GBP/USD out of its consolidation phase. Combined with firm U.S. data, the move triggered a decisive break below multiple technical markers, including the November uptrend and the 50-day moving average, before finding support at the 200-day moving average. Whether assessed through pure price action or momentum indicators, the bias now tilts toward increasing downside risk.
The 14-period RSI continues to trend lower below the 50 mark, while MACD has crossed beneath its signal line and moved into negative territory—both reinforcing the build-up of bearish momentum. As a result, selling rallies appears more favorable than buying dips. That said, the pair’s proximity to the 200DMA provides a clearly defined reference point for structuring trades as incoming data and headlines shape sentiment.
A sustained break below the 200DMA would strengthen the bearish case, opening the door for short positions with stops placed just above the average. Initial downside targets would sit at 1.3371, followed by 1.3300 and 1.3250. Conversely, if price manages to hold above the 200DMA, the setup could shift tactically. Long positions above the level, with stops placed beneath, would target 1.3535—a zone where several technical indicators, including the 50DMA, currently converge. A reclaim of that area would undermine the newly established bearish bias and shift directional risks back toward a sideways-to-higher outlook.
Triangle Formation Brings Breakout Levels Into View
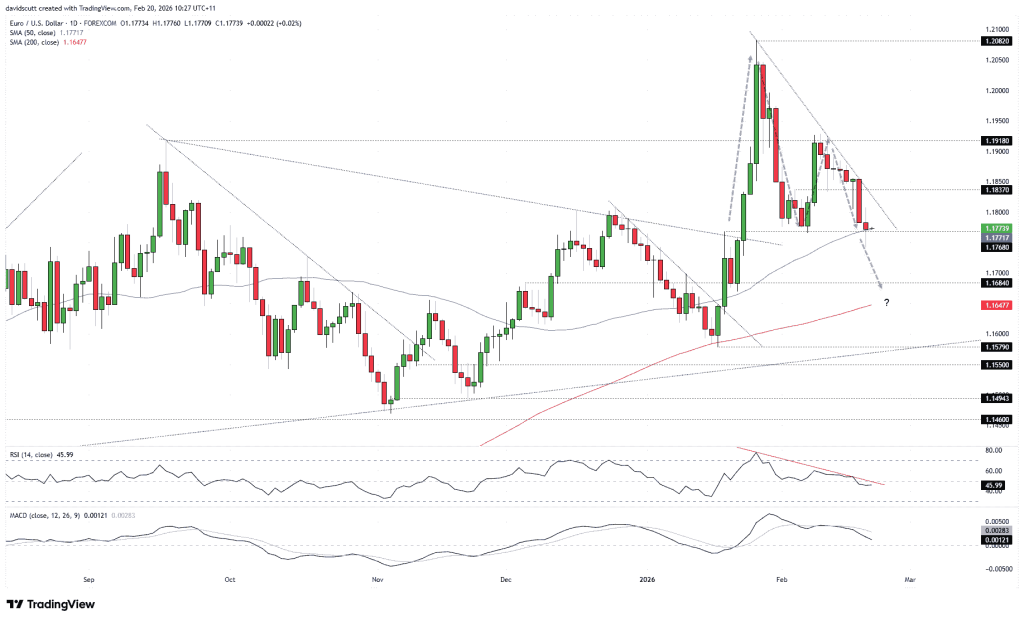
With EUR/USD coiling within a descending triangle and momentum indicators drifting lower, downside risks appear to be gradually building. A decisive break beneath the confluence of the 50-day moving average and horizontal support at 1.1768 may prove pivotal in unlocking further weakness. Thursday’s doji candle aligns with that narrative, highlighting a degree of indecision among market participants at a technically sensitive juncture.
While the bearish case in GBP/USD looks more straightforward—given recent UK data and the repricing of Bank of England rate expectations—the outlook for the euro is less clear-cut. That ambiguity reinforces the importance of upcoming data and headlines in shaping near-term direction. RSI (14) has slipped just below 50, offering a neutral-to-soft signal, while MACD has rolled over but remains marginally above zero, underscoring the lack of decisive momentum so far.
The descending triangle structure keeps the downside break scenario firmly in focus, but confirmation is still required. A sustained break and close below the 50DMA/1.1768 area would strengthen the bearish case, with short positions targeting 1.1684 initially, followed by the 200-day moving average. Stops could be placed just above the broken support zone for protection.
Conversely, if the pair manages to hold this confluence area, a tactical long setup may be considered with tight stops below, initially targeting the January downtrend line. Should price test but fail to clear that trendline convincingly, it may favor squaring positions or re-establishing shorts with stops above, aiming for a retest of the 50DMA/1.1768 region. A clean upside breakout, however, would alter the landscape, opening scope toward 1.1837 and potentially 1.1918, shifting directional risks back toward a sideways-to-higher bias.
Sources: David Scutt

Leave a comment