The S&P 500 E-mini bears are targeting a decisive breakdown below the February 5 low and the 20-week EMA, followed by strong and sustained selling pressure. In contrast, bulls want the 20-week EMA to hold as support, and if prices decline, they are looking to the November 21 low as a key support level.
S&P 500 E-Mini Futures – Weekly Chart
This week’s candlestick formed an inside bear bar that closed in the lower half of its range while testing the 20-week EMA. As mentioned last week, the market was likely to continue moving sideways in the near term, and so far it remains confined within an 11-week tight trading range.
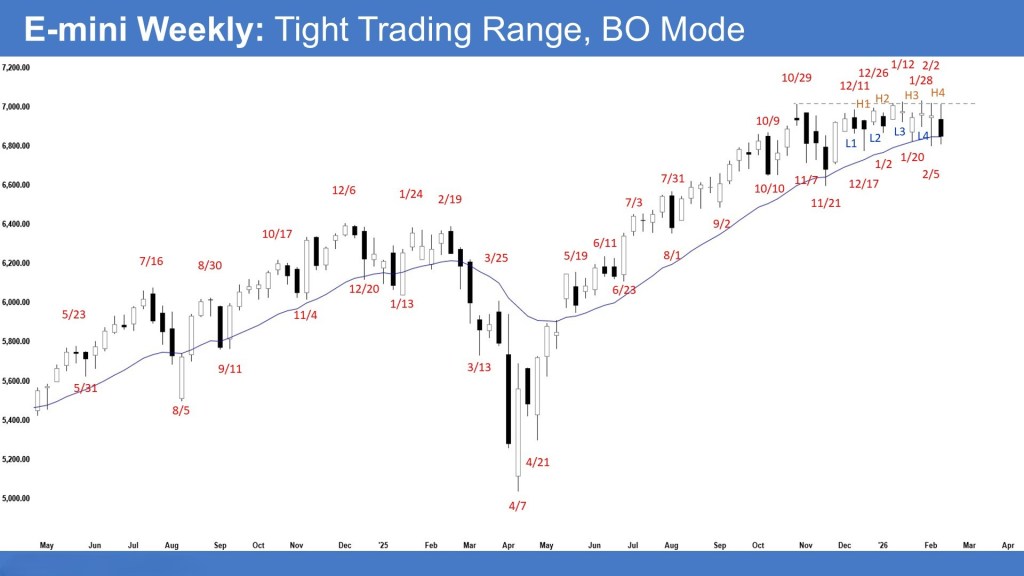
From the bearish perspective, the chart shows a wedge top (December 11, December 26, and January 12), a double top (October 29 and January 28), and a smaller double top (January 12 and January 28). Bears want the October 29 high to serve as resistance. Their goal is a strong breakout below the February 5 low and the 20-week EMA, followed by continued selling that could project a measured move down toward 6,500, based on the height of the 11-week range. To shift the market into an Always In Short condition, bears need consecutive strong bear bars closing well below the 20-week EMA. If the market moves higher, they prefer weak follow-through buying to raise the probability of a failed breakout.
Bulls, on the other hand, see a large double-bottom bull flag (December 17 and February 5), along with a High 4 buy setup. They need a powerful breakout above the January 28 high with sustained follow-through to increase the likelihood of trend continuation, targeting a measured move toward 7,300, based on the range height. Bulls want the 20-week EMA to hold as support, and if prices fall, they expect the November 21 low to provide backing.
The market has traded in a tight range for 11 weeks, reflecting a balance between buyers and sellers as bearish pressure has caught up with the prior uptrend. Over the past two weeks, bulls have been unable to break above previous highs and have seen progressively lower closes within the range.
Until a decisive breakout occurs, traders may continue to apply a Buy Low, Sell High strategy within the range. Market participants will watch whether bears can push through the bottom of the 11-week range with strong follow-through selling, or whether bulls can retest and break above the all-time high. However, even if a new high is reached, lack of sustained buying would increase the risk of a failed breakout.
Alternatively, the market may continue to consolidate around the October 29 high. Most traders will likely wait for a clear breakout with strong follow-through—either above the all-time high or below the 20-week EMA—before committing aggressively. The longer price stalls near the October 29 high without breaking higher, the greater the probability of a deeper pullback.
Daily S&P 500 E-Mini Chart
The market edged higher early in the week. Although Tuesday and Wednesday opened with gap-ups, both sessions reversed and closed as bear bars. On Thursday, a large bear bar formed, testing the 100-day EMA, and Friday printed a doji, signaling hesitation.
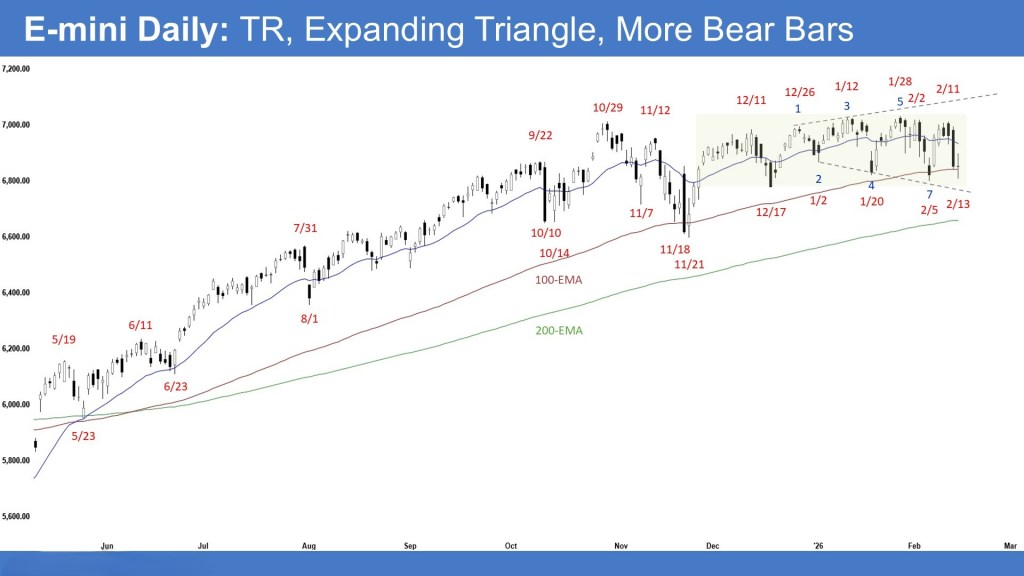
Last week, traders were monitoring whether price would stall near the 20-day EMA and develop a second sideways-to-down leg, or whether bulls could produce enough follow-through buying to push to new all-time highs. So far, price action is pausing around both the 20-day EMA and the all-time high zone.
From the bullish perspective, the chart shows a large double-bottom bull flag (December 17 and February 5), a wedge bull flag (January 2, January 20, and February 5), and a smaller double bottom (February 5 and February 13). Bulls are aiming for a decisive breakout above the January 28 high with sustained buying momentum, targeting a measured move toward 7,300 based on the height of the 11-week range. If the market declines, they want the November 21 low or the 200-day EMA to provide support. To improve the odds of a successful breakout and renewed uptrend, bulls need consecutive strong bull bars.
Bears, meanwhile, want the 20-day EMA to cap price as resistance. Their objective is a clear breakdown below the 11-week trading range, with a projected move toward 6,500 based on the same range measurement. To shift the market into an Always In Short condition, they need consecutive strong bear bars breaking below the December 17 low and the 100-day EMA. If the market rallies to a new all-time high, bears prefer to see weak follow-through buying to raise the likelihood of a failed breakout.
The market continues to trade within a range that began in late November, with bulls seeking an upside breakout and bears pushing for a downside resolution. Since late December, price action has shaped an expanding triangle, which can serve as either a continuation or reversal pattern and often traps traders with false breakouts before reversing.
Over the past two weeks, bear bars have been more pronounced than bull bars, suggesting gradually increasing and cumulative selling pressure. Traders are closely watching whether the market keeps stalling around the 20-day EMA and the all-time high area. A pattern of slightly lower highs accompanied by stronger bear bars would increase the probability of a downside breakout. Conversely, if bulls manage a breakout to new highs, traders will look for strong follow-through; without it, the risk of a failed breakout rises.
Until a decisive move with sustained momentum occurs in either direction, traders may continue applying a Buy Low, Sell High (BLSH) approach — buying near the lower third of the range and selling near the upper third.
Sources: Al Brooks

Leave a comment