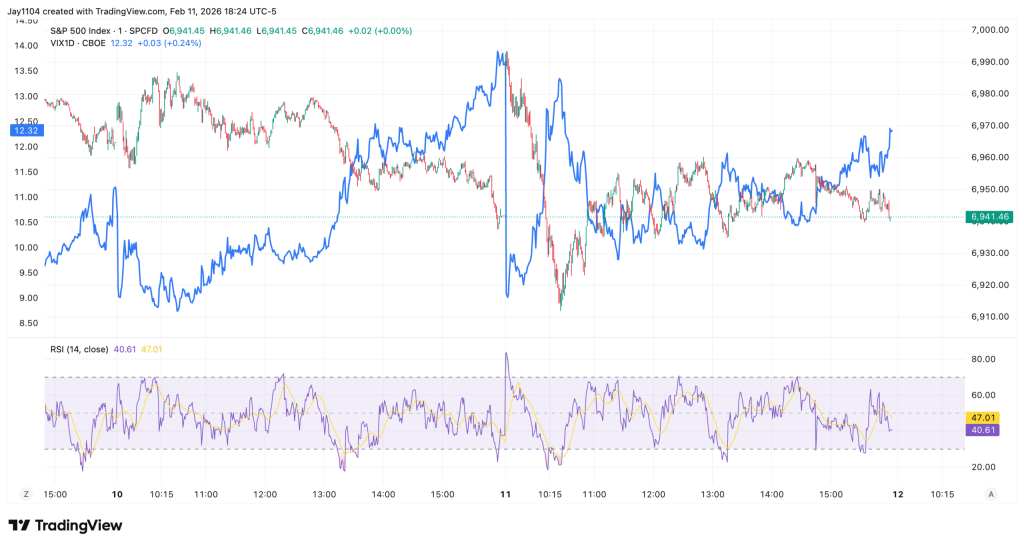
The S&P 500 climbed early in the session, gaining roughly 50–60 basis points at its intraday peak, but those advances faded as the volatility crush quickly ran out of steam. As mentioned previously, the 1-day VIX had closed at 13.6—levels that typically coincide with 50–60 basis-point moves when volatility compresses. However, the 1-day VIX opened near 9, steadily increased during the session, and finished around 12, making the volatility unwind even more short-lived than anticipated.
More notably, subtle signs of stress are emerging beneath the surface. The VVIX—which tracks implied volatility of the VIX itself—moved higher, and the S&P 500 left-tail index also rose. While the index may appear calm on the surface, these indicators suggest that underlying volatility is building and becoming harder to ignore.
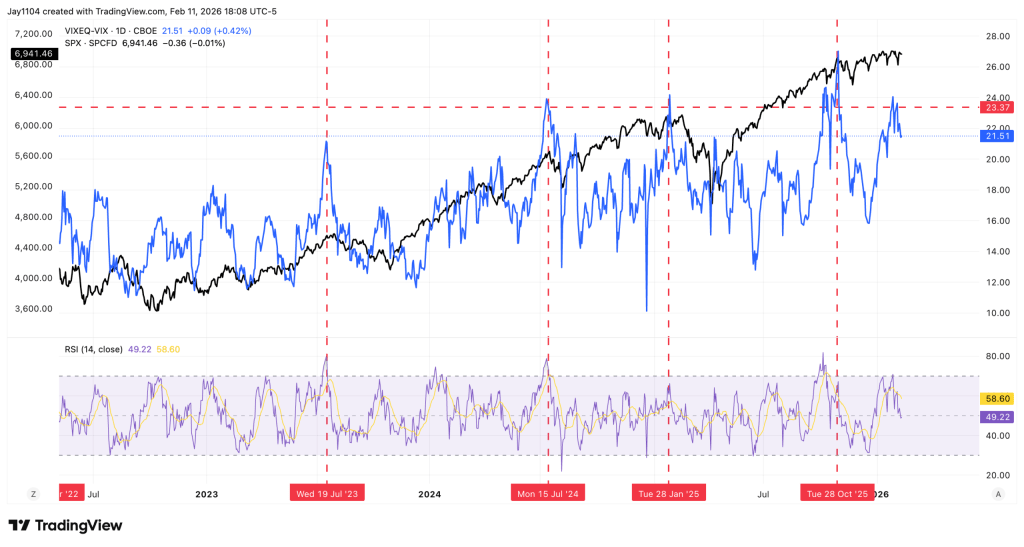
Single-stock volatility, reflected by VIXEQ, remains unusually elevated compared with the headline VIX, which measures index-level volatility. The spread between the two sits near 21.5. Historically, when this gap widens to such levels, it has often preceded meaningful market pullbacks.
Although the surface looks stable, significant shifts are occurring underneath, serving as a cautionary signal. As earnings season progresses, implied volatility for individual stocks should continue to ease, as is typical. If that happens, the spread is likely to compress. That normalization process may require the unwinding of positioning, which could trigger a sharp downside move. This risk has been a recurring theme in prior commentary.
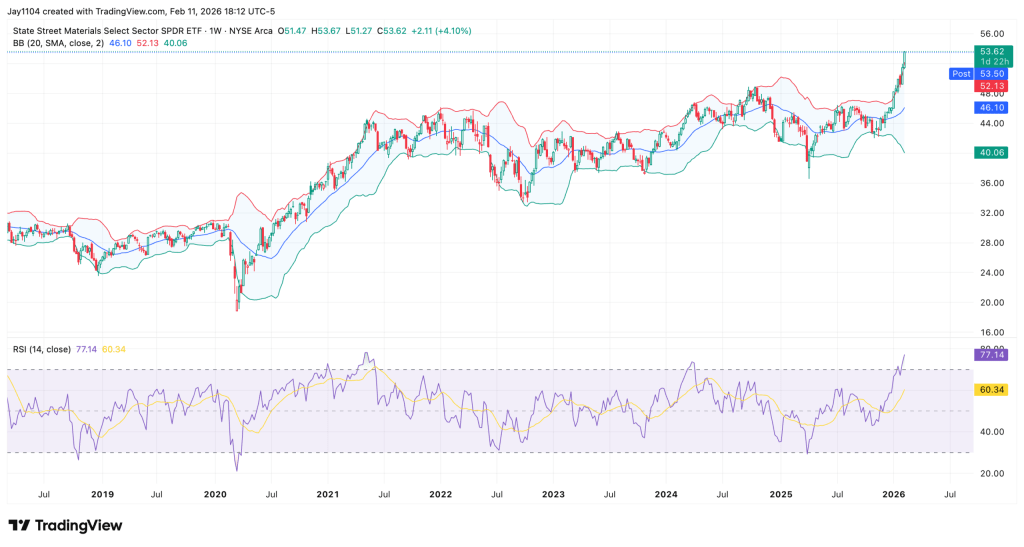
Meanwhile, several sectors appear technically stretched. The Materials ETF (XLB) now shows a weekly RSI of 77 and is trading above its upper weekly Bollinger Band—classic overbought signals that suggest near-term vulnerability.
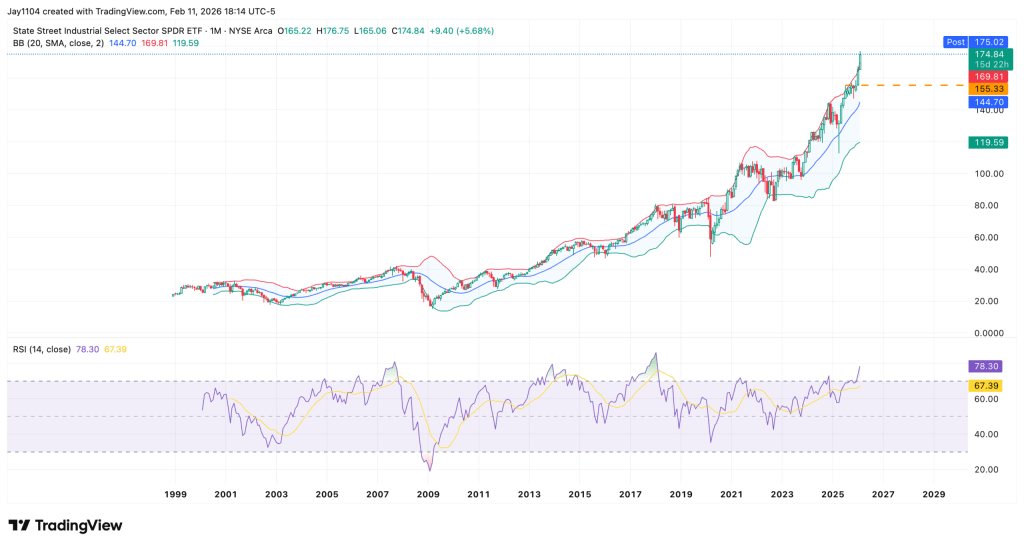
The Industrials ETF (XLI) is even more extended, trading above its upper monthly Bollinger Band with an RSI of 78.3. Historically, similar conditions—in 2007, 2013–2014, and 2018—have led to prolonged consolidation phases. When monthly momentum reaches these extremes, sustaining further upside typically becomes difficult without first easing overbought pressures.
The complication is that Industrials, Materials, Staples (XLP), and Energy (XLE) have been key drivers of the equal-weight S&P 500 (RSP) outperforming the cap-weighted index. This rotation helps explain why the headline S&P 500 often appears relatively steady: leadership shifts from one group to another, offsetting weakness elsewhere. The large-cap “Mag 7” stocks alone are no longer carrying the market.
One possible factor behind this dynamic is the growing influence of zero-DTE options and heavy trading in short-dated contracts. While definitive proof is lacking, the pattern suggests dealer hedging flows may be shaping price action around heavily concentrated strike levels.
For instance, if substantial open interest exists at a strike like 6,950, positioning could effectively pin the index near that level. As a result, underlying sector rotation may occur to keep the index aligned with options pricing. This could drive increased dispersion beneath the surface, with individual sectors making larger moves even as the broader index appears relatively unchanged.
Sources: Michael Kramer

Leave a comment