The Dow Jones continues to trade within an increasingly narrow range, as buyers find support along the December trendline while sellers cap advances near 49,580. The longer this compression persists, the higher the likelihood of a decisive and volatile breakout once the range is resolved.
- Triangle pattern continues to tighten as pressure mounts.
- 49,580 stands as the critical upside barrier.
- The breakout will determine direction, not strength.
Something has to give in the Dow Jones contract as price action continues to compress within an ascending triangle. Buyers remain active along the trendline support drawn from early December, while sellers continue to defend the 49,580 area. The market is effectively locked in a stalemate, and the longer this coiling persists, the greater the likelihood of a sharp, potentially explosive move once the pattern finally resolves.
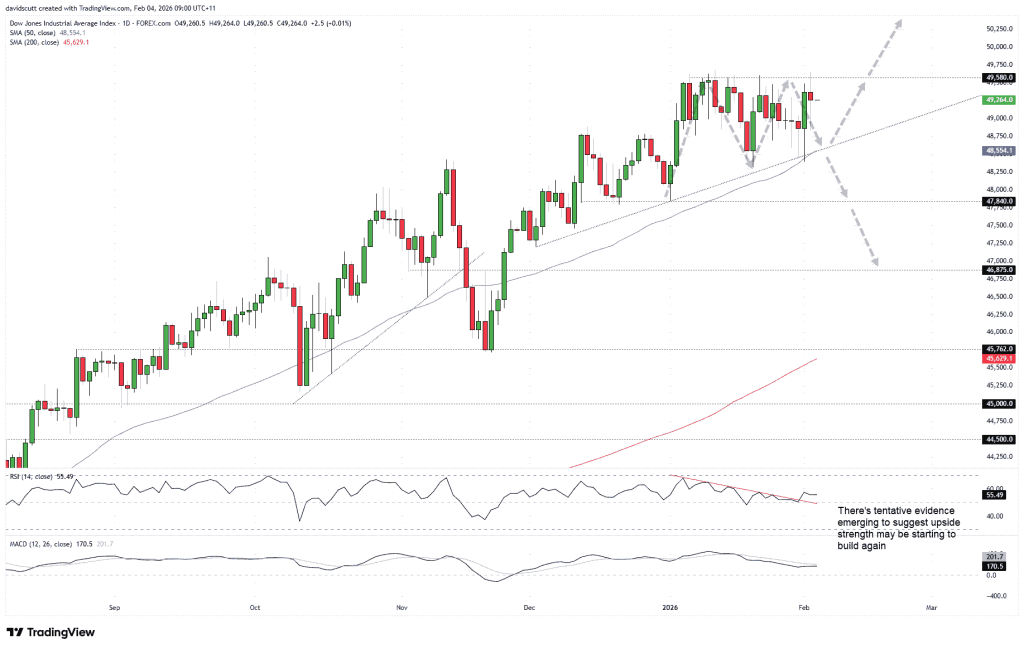
Traditionally, this setup favors a bullish resolution, opening the door to fresh record highs, with a push beyond 51,000 possible given the placement of the triangle. A decisive break and close above 49,580 would allow long positions to be established above the level, with stops placed just below for risk management. While the 50,000 mark will naturally attract close attention due to its psychological importance, I would prefer to see a clear topping formation before reassessing whether to trim, exit, or maintain positions.
That said, technical conventions do not always play out—particularly against a backdrop of elevated valuations—so traders should remain mindful of the potential for a downside break from the pattern.
For now, the December uptrend is tracking closely alongside the 50-day moving average, creating a key zone where both long and short opportunities could emerge, depending on price behavior, should another pullback unfold.
A successful test and rebound from support could offer opportunities to establish long positions, targeting a retest of resistance near 49,580. Conversely, a decisive break and close below this zone would flip the bias, opening the door for short positions with stops placed above the trendline for protection. On the downside, 47,840 emerges as the first notable objective, aligning with multiple rebound points seen in December. Below that, 47,200—where the current uptrend originated—comes into focus, followed by the 46,875 area, which saw considerable two-way price action in the final quarter of 2025.
Adding some support to the bullish case, the 14-period RSI has broken its downward trend and is holding above the 50 level, indicating that downside momentum has stalled for now. The MACD echoes this view, turning back toward its signal line from below while remaining in positive territory. Overall, the signals suggest a neutral near-term bias, though with a slight edge still favoring the bulls.
Sources: David Scutt

Leave a comment