Markets absorbed last night’s FOMC decision without much surface reaction, but the takeaway was straightforward: the Fed is content to keep financial conditions accommodative. That stance weighed on the U.S. dollar and pushed yields lower, while gold and equities edged higher on solid earnings. In essence, the Fed did nothing to challenge the prevailing market narrative. Attention now shifts back to the charts, which are beginning to tell a compelling story.
Is It Possible? DXY Slips Back to Its 2008 Trendline
The DXY has drifted back into a long-term monthly trendline zone that has previously served as a key structural floor. For now, this move represents a test rather than a confirmed breakdown.
What matters next:
A decisive weekly close below this support area would confirm a genuine structural breakdown. Conversely, if the DXY stabilizes and rebounds, it would be an early signal that the crowded “short USD” trade may be vulnerable to a squeeze.
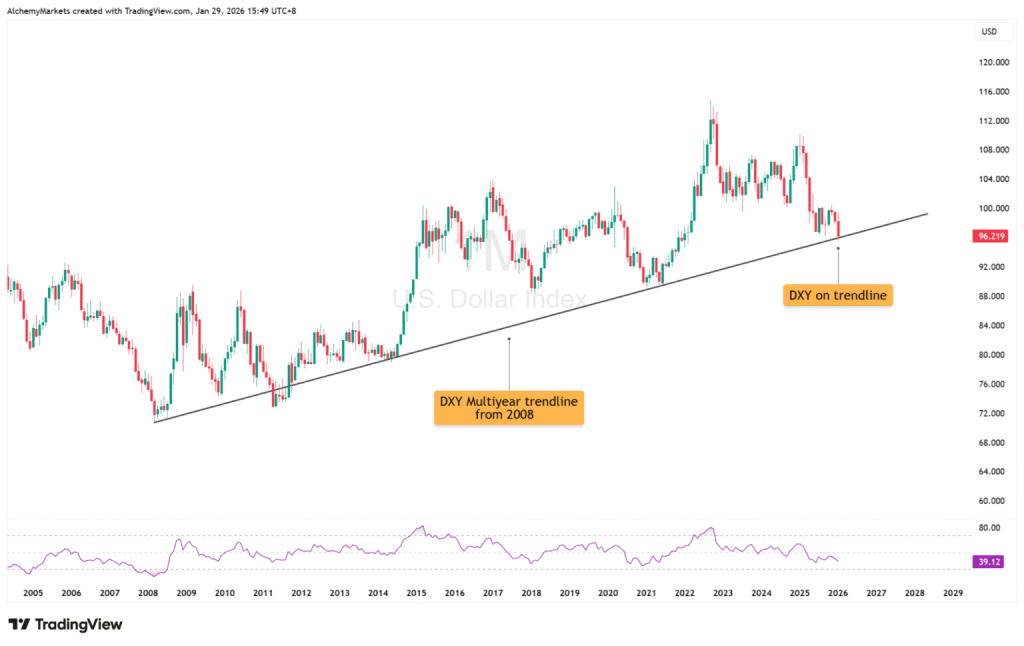
This is precisely the kind of setup where long-term sentiment can be right, yet short-term positioning gets punished.
EUR/USD Points to a Near-Term Pause as the Dollar Regains Some Strength
EUR/USD is pushing into a dense resistance cluster, including the 1.20 psychological level, a multi-year trendline, channel alignment, and a bearish divergence on the weekly RSI.
That combination typically leads to at least a pause or pullback, even if the longer-term bias remains bullish for EUR/USD (and bearish for the dollar). If EUR/USD does roll over, it would offer the cleanest “risk-on USD bounce” setup without having to guess.
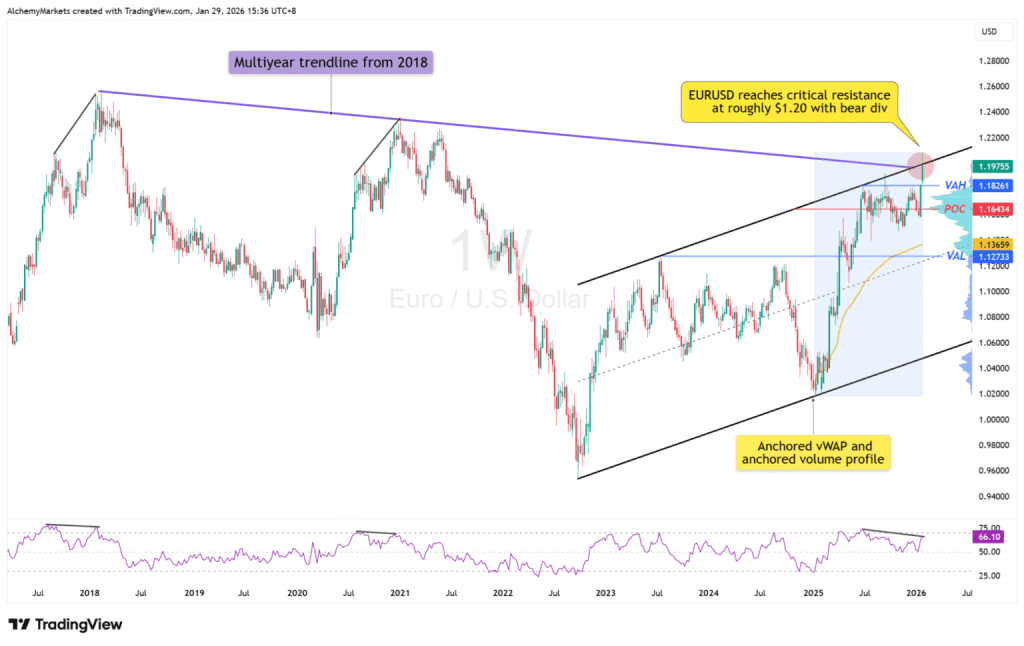
Key takeaway: A stall in EUR/USD here gives the DXY room to breathe.
USD/CHF Is Also Trading at Extreme Levels
USD/CHF is one of the clearest expressions of U.S. dollar pessimism. When it reaches extreme levels, two patterns typically emerge: downside momentum begins to fade as the trade becomes crowded, and volatility increases as even minor catalysts trigger repositioning.
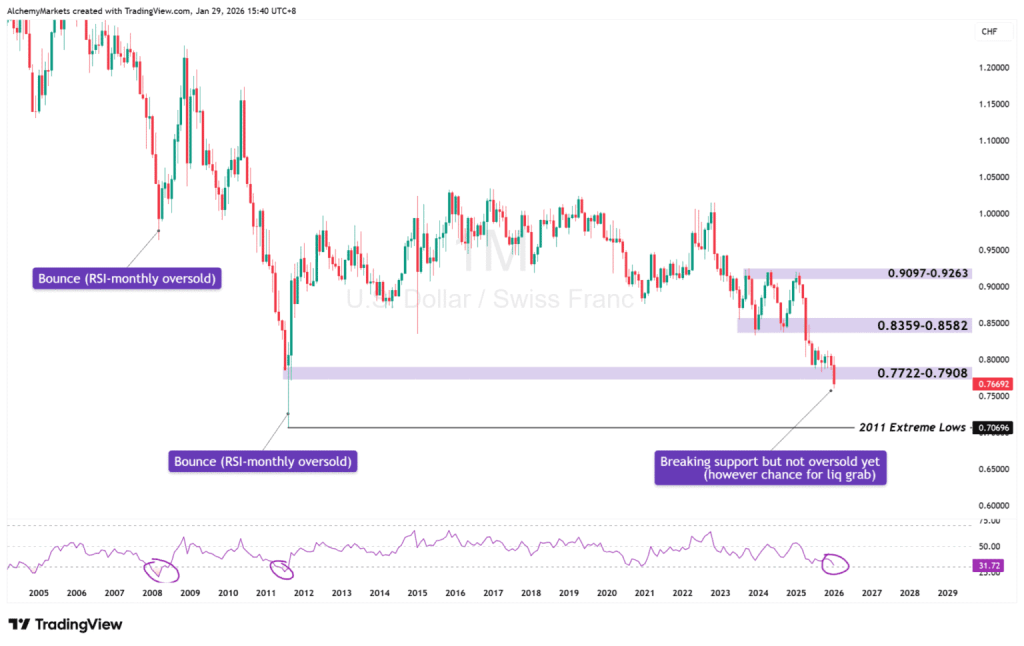
Even if dollar weakness persists, this is a zone where smooth continuation should no longer be assumed.
USD/JPY: A Key Pressure Zone for a Potential Dollar Reversal
USD/JPY is where macro theory collides with market reality. If a meaningful USD squeeze is going to materialize, this pair is almost certain to play a role.
On the weekly chart, USD/JPY is interacting with a major structural pivot, pulling back into a former resistance area that is now attempting to act as support around 151–153. For now, price has printed a wick at this support zone, suggesting USD/JPY may pause here before any further downside acceleration.
If this support holds, a rotation higher becomes increasingly plausible, with upside targets back toward the prior supply zones at 157.7–158.7, followed by 160.7–161.8.
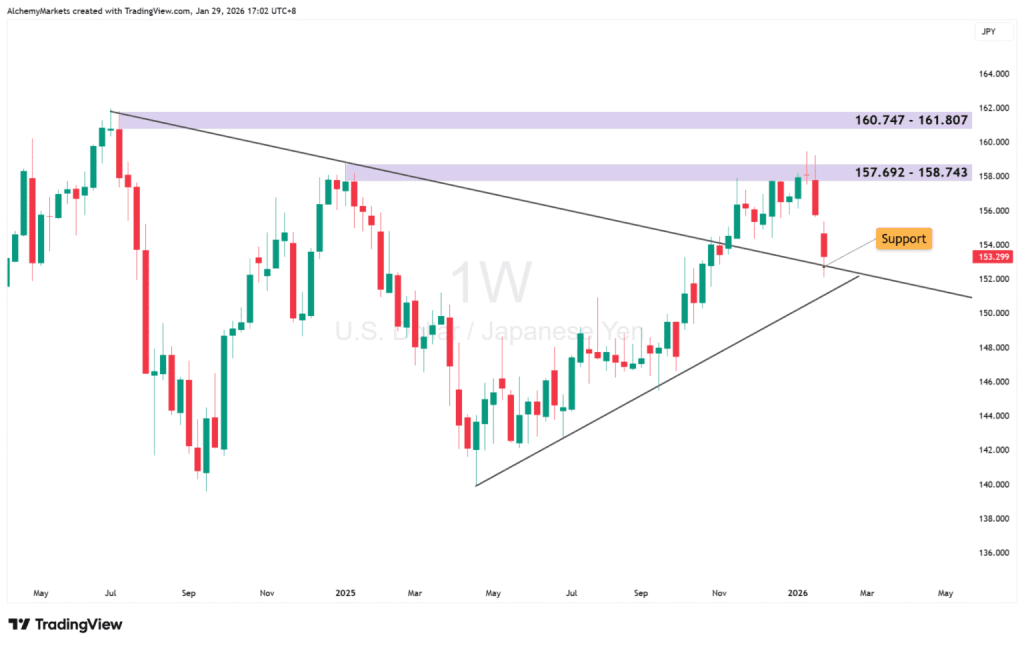
That wouldn’t imply the start of a new USD bull market, but rather a crowded-trade unwind, especially with the current consensus loudly focused on a yen carry unwind and broad USD bearishness.
Bank of Japan Policy Decision
The next Bank of Japan policy meeting is scheduled for 18–19 March 2026, with market expectations largely aligned:
- No rate hike is expected in March
- Attention will center on guidance, messaging, and any indications of follow-through later in 2026
- A continued bias toward verbal intervention and tactical signaling, rather than immediate or aggressive FX action
In short, the BOJ meeting is unlikely to be the catalyst itself. More often, it serves as the narrative justification after price has already picked a direction.
That’s why USD/JPY should be viewed as a leading indicator rather than a reactive trade. Focus on the key levels, and let positioning and price action do the talking.
Sources: Lee Yang

Leave a comment