After reaching record highs and recording its largest four-day gain since 2008, silver’s momentum has sharply reversed. The price broke through its uptrend support from January 9, signaling a potential deeper correction.
Despite strong macroeconomic tailwinds, selling pressure has intensified, likely fueled by heavy retail trader activity, which has contributed to significant volatility.
The break of the uptrend was confirmed by a three-candle bearish reversal pattern on the hourly charts and bearish divergence in the RSI (14) indicator.
Following the trend break, silver’s price dropped sharply to a support level at $86.24 before rebounding toward $89.15. This price range has been a key area of activity recently and will be important for traders monitoring short-term movements.
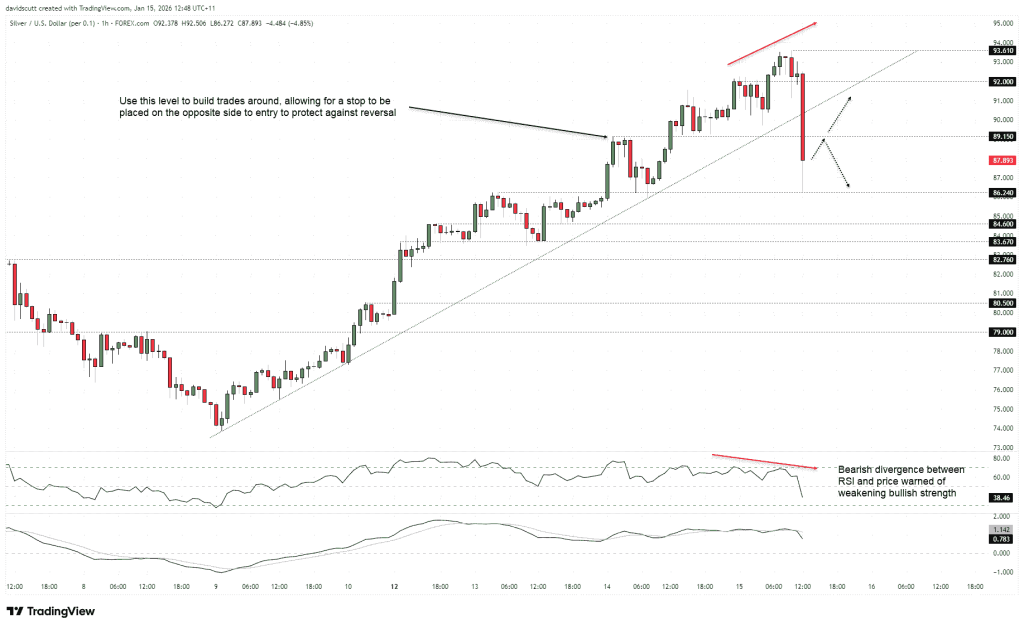
If the bullish trend has ended and the price fails to climb back above $89.15 to rejoin the uptrend, traders might consider opening short positions just below this level with a tight stop-loss above it for protection. The initial target would be support at $89.24.
Should this support break, key downside levels to watch are $84.60, $83.67, and $82.76, all of which previously acted as short-term support or resistance during the upward move. Further declines could target $80.50 and $79 if the sell-off gains momentum.
However, as has often been the case with silver breakouts, bearish moves tend to be short-lived, so a strong wave of dip-buying remains possible. If buyers push the price back above $89.15, it could trigger new long positions aiming first for the previous uptrend level, followed by targets at $92 and the record high of $93.61.
While I don’t put much emphasis on the mixed signals from the RSI (14) and MACD regarding the short-term direction, the bearish divergence between RSI and price before the drop did offer an early warning that the bullish momentum was weakening. This is an important factor to consider regardless of silver’s next move.
Sources: StoneX

Leave a comment