- Story continues its recovery, approaching the $3 mark after gaining 27% on Monday.
- MYX Finance is nearing $6, marking its third straight day of gains within a short-term trading range.
- Dash rose 3% on Tuesday, building on Monday’s nearly 6% increase, and is now testing the 200-day Exponential Moving Average (EMA).
Story (IP) is spearheading the market rally with double-digit gains in the past 24 hours, while MYX Finance (MYX) and Dash (DASH) each climb about 6%. These top performers are approaching critical resistance levels as they seek to continue their upward momentum.
Story Continues Rapid Recovery

Story edged up more than 1% Tuesday, building on Monday’s impressive 27% gain. The meme coin is on its third consecutive day of recovery and is nearing the $3.00 mark, approaching the November 6 low of $3.26, which previously acted as resistance on November 26.
If Story (IP) breaks above $3.26, it may set its sights on the 200-day Exponential Moving Average (EMA) at $4.101.
Momentum indicators on the daily chart suggest strong bullish momentum. The Relative Strength Index (RSI) stands at 79, indicating overbought conditions, while the Moving Average Convergence Divergence (MACD) continues to rise, supported by green histogram bars.
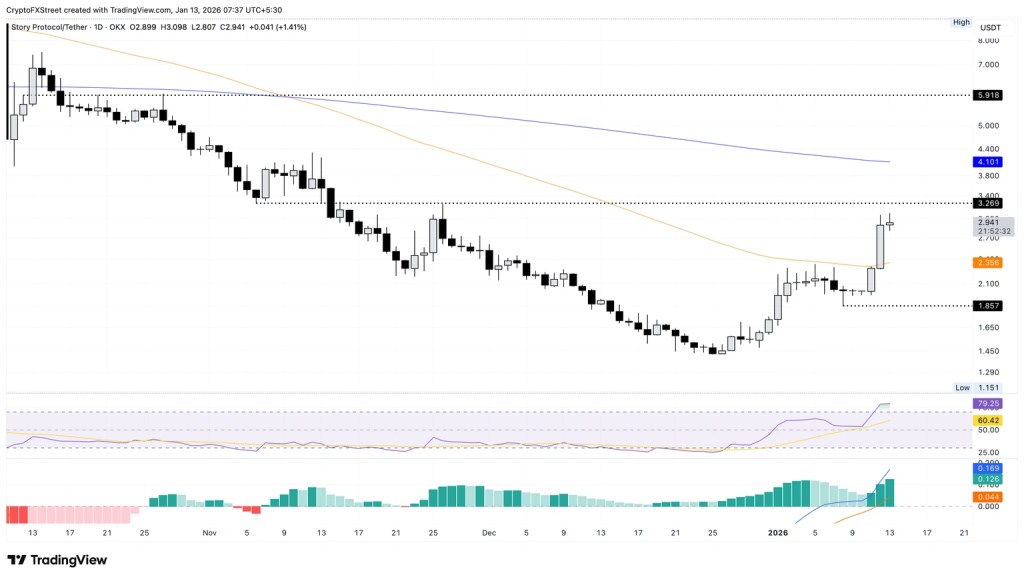
IP/USDT daily price chart.
If Story cannot break above $3.00, it may face a pullback that tests support at the 50-day Exponential Moving Average (EMA) around $2.356.
MYX Finance could struggle to surpass $6
MYX Finance is approaching resistance near $6.07, marking the upper boundary of a short-term range and aligning with the January 3 closing price. At the time of writing, MYX has gained nearly 1%, adding to the previous day’s 4% increase.
A strong close above $6.07 could propel MYX toward the January 3 high of $7.29, where it faces resistance from a trendline connecting the October 29 and November 15 highs.
From a technical standpoint, MYX Finance is showing renewed bullish momentum, with the Relative Strength Index (RSI) at 71 on the daily chart, edging into overbought territory. The MACD and its signal line also continue their upward trajectory. However, the absence of a clear trend in these indicators signals a possible risk of reversal.
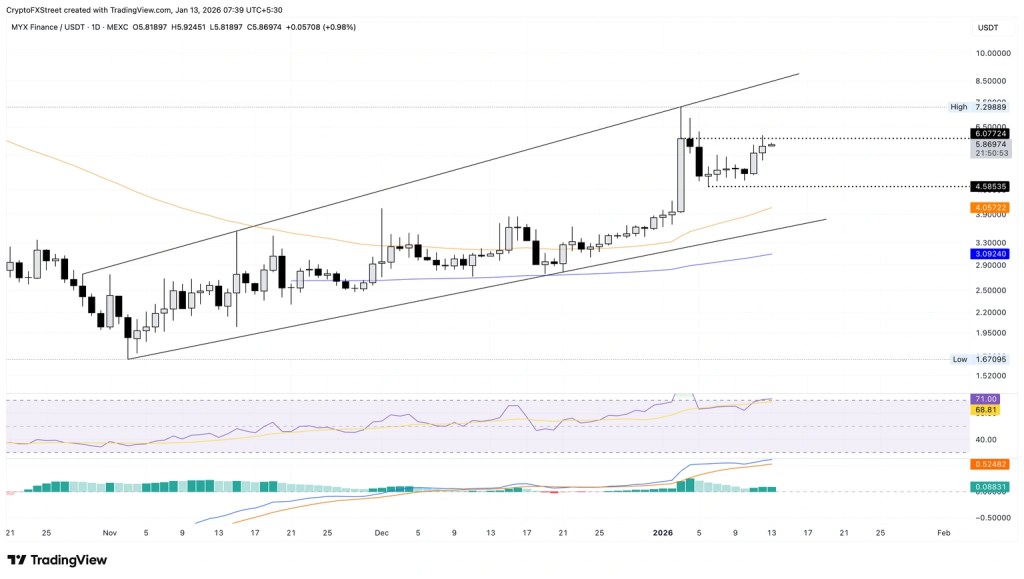
MYX/USDT daily logarithmic chart.
Conversely, if MYX fails to hold above $6.07, a pullback could drive the price down toward the January 6 low of $4.58.
Dash’s Recovery Reaches 200-day EMA
Dash gained 3% as of Tuesday, building on a 6% increase from the previous day. The privacy-focused cryptocurrency is recovering from a December 23 low of $36.68 and is now nearing the 200-day Exponential Moving Average (EMA) at $41.30.
If Dash surpasses this level, it could next aim for the 50-day EMA at $45.04.
Technical indicators on the daily chart point to a revival in buying interest. The Relative Strength Index (RSI) at 46 is approaching the midpoint, signaling a rebound from last week’s decline, while the MACD has crossed above its signal line, reflecting renewed bullish momentum.
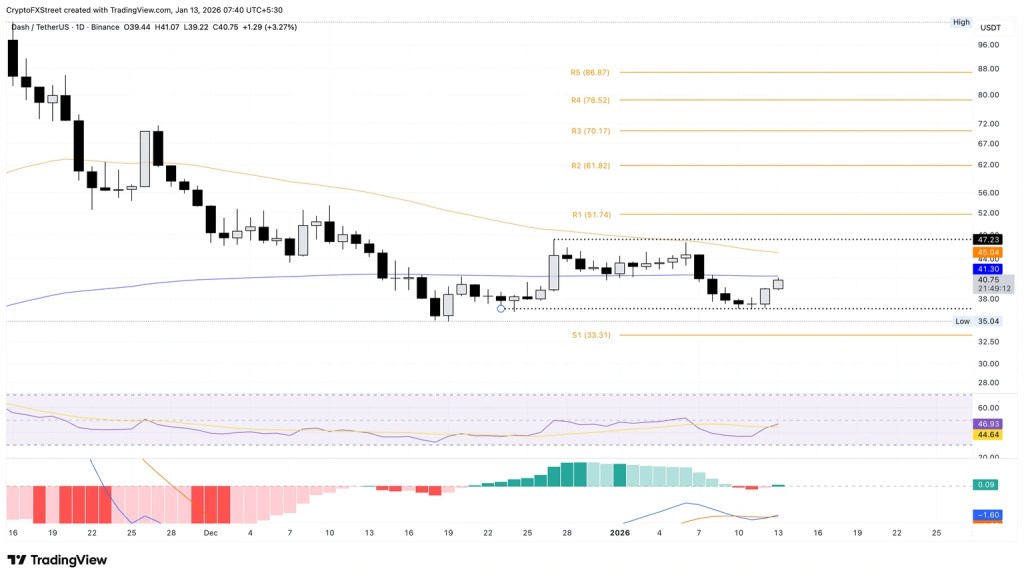
DASH/USDT daily price chart.
On the downside, if DASH fails to break above $41.30, it may pull back to retest the $36.68 support level.
Sources: Fxstreet

Leave a comment