In our December report, we combined the Elliott Wave (EW) Principle with average midterm election-year seasonality and the Armstrong Pi-cycle turn dates to analyze the S&P 500 (SPX). We concluded that:
“… As long as the index remains above the November 21 low of 6720, it can position itself for a subdividing final 5th wave (gray waves W-i, ii, iii, iv, and v), potentially reaching as high as 7490 around April 18-28, 2026.”
Since then, the SPX has risen nearly 2% and appears to be unfolding as expected. With new price data now available, we have revised our short- to intermediate-term EW count but kept the same ultimate upside target range of approximately 7345-7490. Please refer to Figure 1 below.
Figure 1: Intermediate Elliott Wave analysis for the SPX.
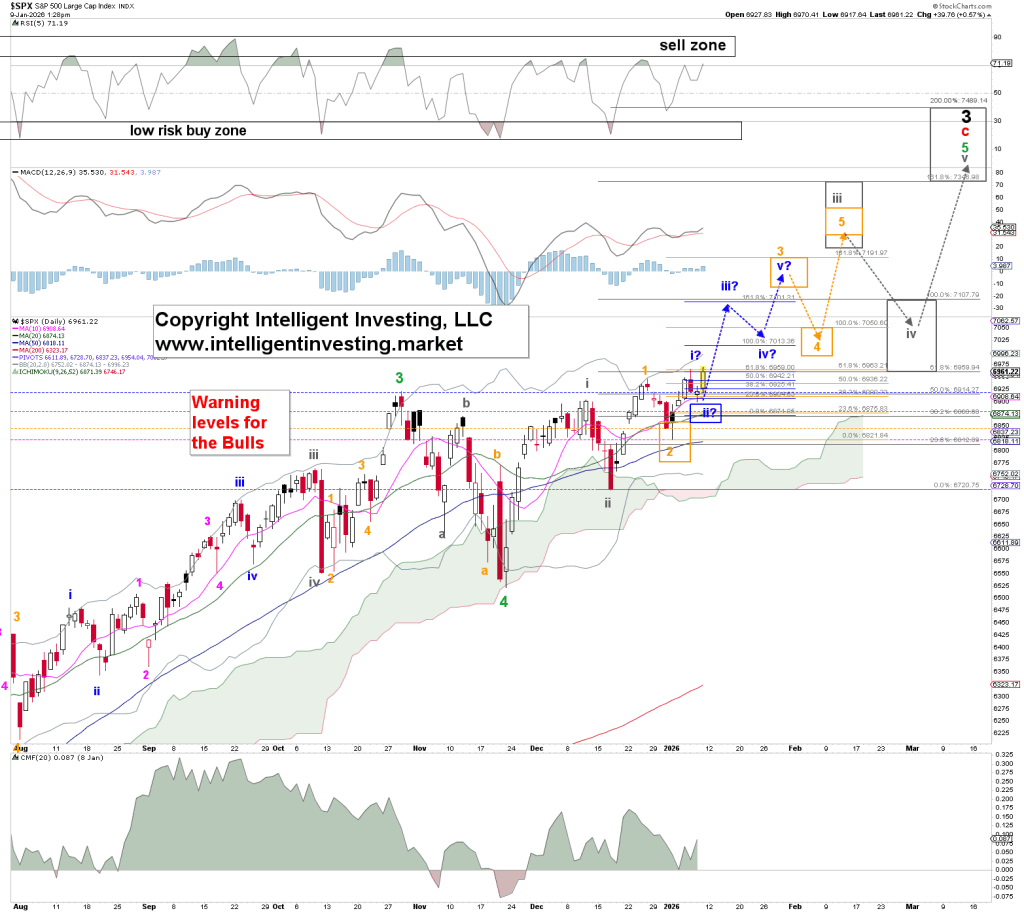
Assuming the price stays above the specified warning levels*, with each additional breach raising the probability of the uptrend ending by 20%, we anticipate the index to ideally reach around 7100 for the blue W-iii wave, then decline to roughly 7015 for the blue W-iv wave, followed by a rally to approximately 7160 ± 40 for the orange W-3 wave, and so on. The current pattern depicts a standard impulse wave; however, the green W-5 wave could potentially form an overlapping ending diagonal, leading to an overlapping rally toward the lower boundary of the target zone (around 7345). At this stage, there is no sign that this scenario will unfold. Nevertheless, it’s important to note that once the green W-5 completes—expected around April 18-28—we anticipate a bear market similar to that of 2022 before a larger, multi-year rally to new all-time highs can commence.
Sources: Investing

Leave a comment