Key Takeaways
- A Middle East ceasefire sparked a strong global rally, boosting previously underperforming country ETFs and cyclical sectors domestically.
- Oil prices tumbled, bond yields declined, and the VIX dropped toward 20—pointing to a possible shift in market regime.
- Early signs of technical strength are appearing, but sustained momentum will be key to confirming the rally’s durability.
“I want you all to forget the flight plan. From this moment on, we are improvising a new mission.”
These were the words of Gene Kranz to his Houston team after an explosion struck Apollo 13. Faced with a sudden crisis, he led a pivot away from the original objective of landing on the moon, improvising a new mission under severe constraints.
A Familiar Setup, Rewritten Script
More than half a century later, Americans are once again circling the moon, even as markets absorb a fresh wave of macroeconomic shocks. Under normal circumstances, attention would be turning to Q1 earnings, upcoming inflation data, and signals from the Fed—but this time is different.
The narrative is shifting. Global equities are surging on news of a two-week ceasefire between the U.S. and Iran. While both sides are claiming success, the true beneficiaries may be investors who stayed committed to buying the dip.
Stock Market Reacts: Risk-On Reigns
The S&P 500 surged nearly 3% in premarket trading on Wednesday, April 8, echoing the explosive “post–Liberation Day” rally seen almost exactly a year earlier. As expected, leadership came from some of the most beaten-down corners of the market: Asia-Pacific ETFs like iShares MSCI South Korea ETF (EWY), iShares MSCI Taiwan ETF (EWT), iShares MSCI Japan ETF (EWJ), and iShares MSCI India ETF (INDA); Europe via Vanguard FTSE Europe ETF (VGK); and U.S. small caps through iShares Russell 2000 ETF (IWM). Cyclical industries also joined the surge, including homebuilders SPDR S&P Homebuilders ETF (XHB) and airlines U.S. Global Jets ETF (JETS), alongside strength in crypto and gold.
At the same time, energy markets moved sharply in the opposite direction. Oil plunged roughly 12%, dragging energy stocks lower. Bond yields declined, the U.S. dollar weakened, and the CBOE Volatility Index (VIX) broke its upward trend—classic signals of a broad “risk-on” shift.
I had planned to focus on bank stocks, but it makes more sense to examine several geopolitically sensitive charts first—to assess whether this rally has real staying power.
Tools of the Trade
To start, traders should take a look at StockCharts ACP (Advanced Charting Platform)—a highly interactive, web-based charting platform built to elevate how you analyze market behavior. It becomes especially valuable during periods of heightened volatility, whether moves unfold during trading hours or after the close.
I had it up and running at 6 p.m. ET on Tuesday, just as the SPDR S&P 500 ETF Trust (SPY) began to edge higher—before accelerating sharply, almost like a launch sequence counting down.
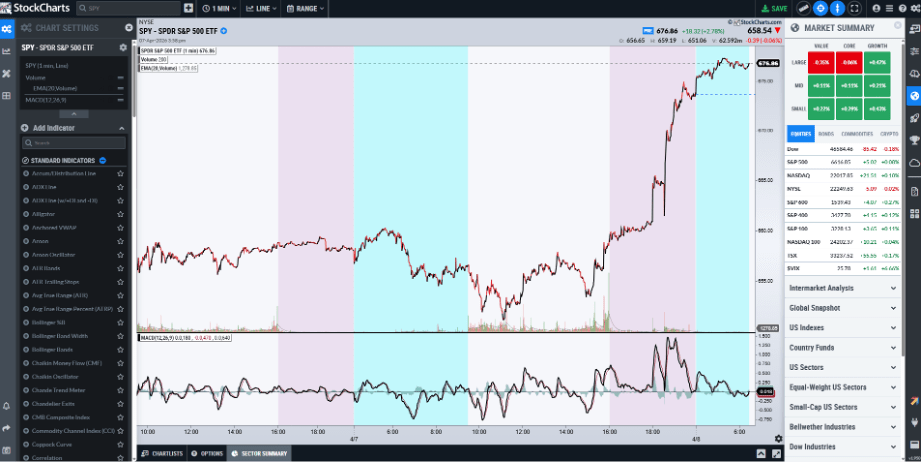
For now, though, StockCharts SharpCharts will do the job perfectly well.
South Korea Leads the Charge
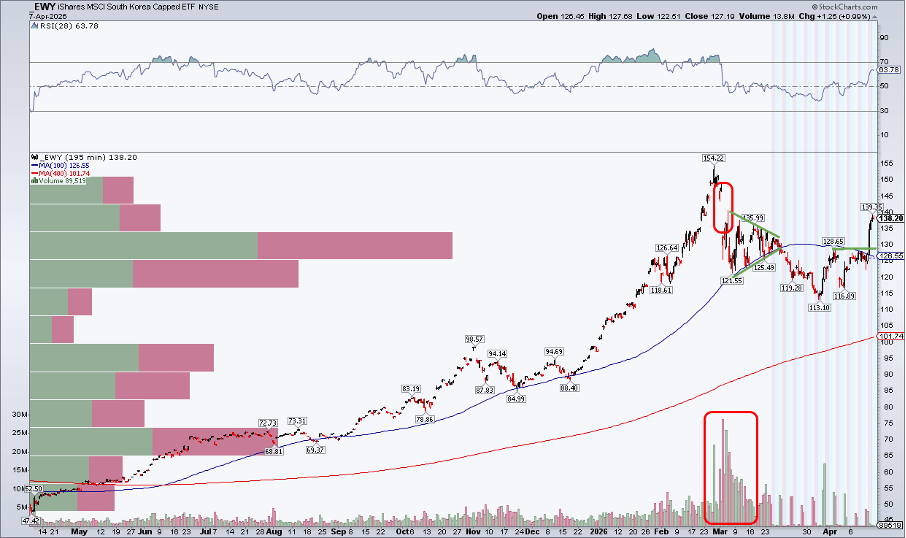
Starting with one of the highest-beta country ETFs, the iShares MSCI South Korea ETF (EWY) surged nearly 10% ahead of Wednesday’s open. From its $113 low at the end of March, the post-ceasefire rally quickly extended to about 23%.
Technically, EWY has now pushed firmly above its 50-day moving average—a level that previously acted as resistance earlier in the month. That shift suggests improving momentum. With the all-time high sitting roughly 11% higher, the former resistance zone around $129 may now serve as a key support level.
For a clearer view of extended-hours activity, enabling premarket and after-hours data is essential. Taking it further, adjusting moving averages (e.g., doubling from 50 to 100 and 200 to 400) and using a 195-minute chart interval (two bars per day) helps surface important trend levels that might otherwise be missed outside regular trading hours.
Looking ahead, bulls should focus on the gap near $147. This level is particularly significant due to the heavy volume-by-price activity during the prior selloff—often a hallmark of a blow-off top. Still, with momentum building, South Korean equities appear poised to make another attempt toward the $150 level.
Global Equities vs. Homebuilders: A Clear Split
Turning to the domestic market, homebuilders tell a different story. As Brent and WTI crude surged toward $120 per barrel, the accompanying rise in interest rates quickly stopped the homebuilders’ rally. While oil-sensitive international ETFs—especially those tied to economies reliant on the Strait of Hormuz—declined sharply last month, U.S. industrial sectors that depend on lower Treasury yields also came under pressure.
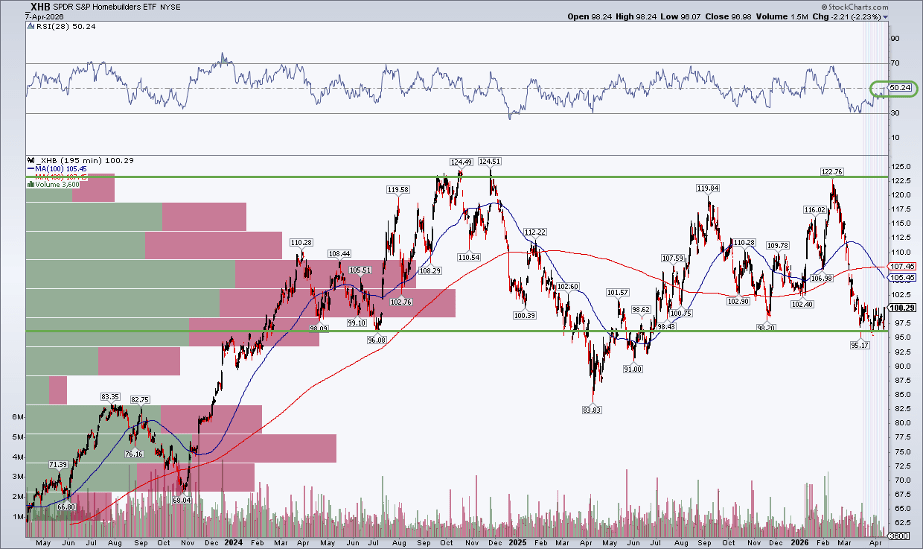
The SPDR S&P Homebuilders ETF (XHB) looks notably weaker than EWY and other Asia-Pacific ETFs. Even with a premarket move above $100, it still trades below both its 50-day and 200-day moving averages. Sitting roughly 20% below its late-2024 peak and its high from two months ago, the sector isn’t signaling confidence yet. However, the RSI momentum indicator has just crossed above 50, which technicians typically view as a positive sign. Since momentum often leads price, this could point to a near-term rebound.
That said, XHB’s overall technical picture remains messy: strong resistance sits in the $120–$125 range, while buying interest has consistently emerged in the upper-$90s. A clearer bullish outlook would likely require a decisive breakout to new highs.
Is the Volatility Regime Shifting?
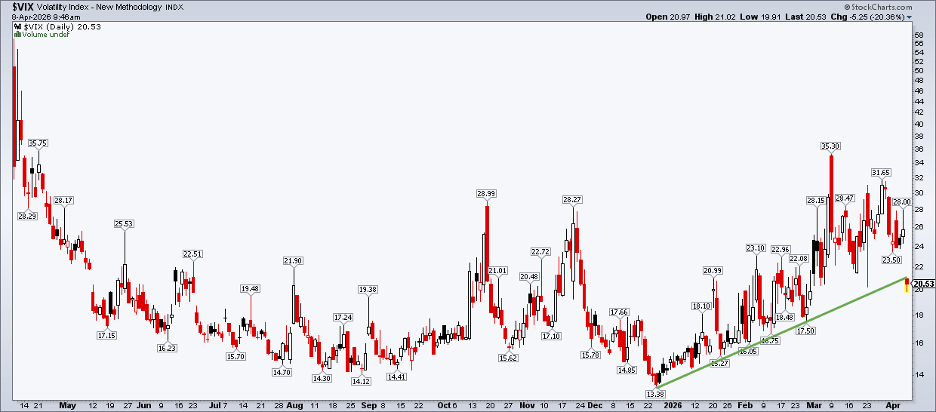
Let’s wrap up with a look at market volatility. The Cboe Volatility Index had been steadily climbing since late last year, raising concerns among macro investors, as moderately elevated volatility often signals weaker performance for the S&P 500.
However, that trend has recently reversed following the temporary reopening of the Strait of Hormuz. The VIX has now broken its multi-month uptrend and recorded a clear lower low. Despite heightened expectations, volatility never reached the dramatic spike many anticipated—it topped out just above 35, only nine days after the Iran conflict began. The combination of high volatility, surging oil prices, and poor investor sentiment made March particularly challenging.
For confirmation of a new short-term volatility regime, a weekly close below 20 on the VIX would be encouraging. Historically, April tends to be a calmer month and has delivered some of the strongest global equity returns since 1988. That said, skeptics point to typically weaker second quarters during midterm election years. My view: volatility may ease in the near term, but it shouldn’t be ignored as we move toward the summer months.
The Bottom Line
Stocks surged Tuesday night after news of a temporary two-week ceasefire between the U.S. and Iran, shifting attention away from upcoming economic data like PCE inflation and March CPI. While earnings season still feels a bit off, JPMorgan Chase is set to kick things off next Tuesday morning.
The S&P 500 has climbed back above its 200-day moving average, while the Cboe Volatility Index has eased toward the 20 level. Meanwhile, several country ETFs that were heavily sold in March are now showing strong early rebounds.
The next few sessions will be crucial—markets need continued technical follow-through to sustain this bullish momentum.
Sources: Mike Zaccardi

Leave a comment