Key points:
- Gold and silver prices rose as investors sought safe-haven metals amid heightened geopolitical tensions following the U.S. capture of Venezuelan leader Nicolás Maduro.
- The capture of Venezuela’s President Maduro has raised concerns about how quickly the country can increase oil production, with analysts skeptical about major oil companies committing new investments amid the ongoing uncertainty.
- Crude oil prices fluctuated as traders weighed the impact of Maduro’s capture on global supply and Venezuela’s energy sector. Brent crude dropped up to 1.2% before bouncing back near $61 per barrel, while WTI stayed above $57. Despite the instability, Venezuela remains a relatively small supplier in an already oversupplied market.
- U.S. airlines are resuming Caribbean routes after a U.S. military operation in Venezuela caused regional airspace closures, which stranded thousands of travelers. Airlines like American and Delta responded by adding extra flights and larger planes, with American alone providing nearly 5,000 additional seats.
- Upcoming jobs data, particularly the January 9 report, is set to influence markets. Labor market softness prompted the Fed to cut rates in its last three meetings in 2025, supporting stocks, but the potential for further rate cuts in 2026 remains uncertain.
- The S&P 500 slipped toward the end of the year but still posted a strong 16% gain for 2025. January promises to be busy, with Q4 earnings and crucial inflation figures scheduled for release.
Dow Jones futures dipped slightly Sunday night, while S&P 500 and Nasdaq futures edged up. Over the weekend, former President Donald Trump claimed that the U.S. would “run” Venezuela following the capture of President Nicolás Maduro, though Maduro’s government remains intact.
The annual CES technology conference officially begins Tuesday in Las Vegas, with artificial intelligence expected to take center stage. CES 2026 will showcase major presentations from AI chip leaders Nvidia (NASDAQ: NVDA) and Advanced Micro Devices (NASDAQ: AMD), highlighting AI’s tangible applications across devices—from smart glasses and wearable life-loggers to robotaxis and humanoid robots.
Industrial technology will also receive attention, with keynote speeches from the CEOs of Caterpillar (NYSE: CAT) and Siemens (SIEGY). The four-day event will run through Friday.
Nvidia, AMD, and Taiwan Semiconductor Manufacturing (NYSE: TSM) will be key players at CES 2026 in Las Vegas.
- $NVDA – Jensen Huang’s keynote: January 5 at 4:00 PM ET
- $AMD – Lisa Su’s keynote: January 5 at 9:30 PM ET
- $MRVL – Matt Murphy’s fireside chat: January 6 at 12:00 PM ET
- $TSM – Monthly sales data release: January 9
Stocks dropped in the final trading session of 2025, causing the S&P 500 to register a loss for December. However, the index still posted a strong gain of over 16% for the year, marking its third consecutive year with double-digit growth, while the VIX remained near yearly lows.
After a quiet year-end, 2026 is expected to start actively with important economic reports, a Supreme Court decision on President Trump’s tariffs, his nominee for the next Federal Reserve chair, and the beginning of earnings season. Although next week’s earnings calendar is relatively light, a few companies such as AAR (NYSE: AIR), Commercial Metals (NYSE: CMC), and Acuity (NYSE: AYI) are scheduled to report.
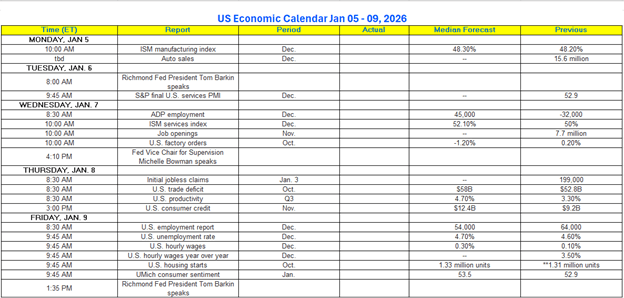
US Economic Data
A series of key economic reports will be released during the first full week of January. Scheduled releases include the ISM manufacturing and services indexes, Commerce Department data on housing starts and building permits, and the Labor Department’s JOLTS report. The highlight will be Friday’s release of December payrolls.
On December 30, the Chicago Fed reported that its labor market model indicated only minor shifts in layoffs, quits, and hiring of unemployed workers for the month, projecting the unemployment rate to remain steady at 4.56%.
The tech boom and onshoring efforts are set to trigger a significant surge in capital spending. The majority of this investment is expected from the “Big Four” tech giants—Microsoft, Amazon (NASDAQ: AMZN), Alphabet (NASDAQ: GOOGL), and Meta (NASDAQ: META)—all of which have indicated their 2026 capital expenditures will likely surpass those of 2025.
The “Magnificent 7” — which includes Microsoft, Amazon, Alphabet, Meta, Apple (NASDAQ: AAPL), Nvidia, and Tesla (NASDAQ: TSLA) — are projected to collectively invest over $500 billion in capital expenditures in 2026. Although not officially committed to this amount, their guidance in late 2025 suggests an acceleration of substantial AI infrastructure spending in the coming year.
Onshoring also plays a crucial role in driving capital investment, as the Trump administration’s tariff team has secured commitments from foreign governments and companies to establish manufacturing facilities in the U.S. in return for reduced tariff rates.
Technical Analysis
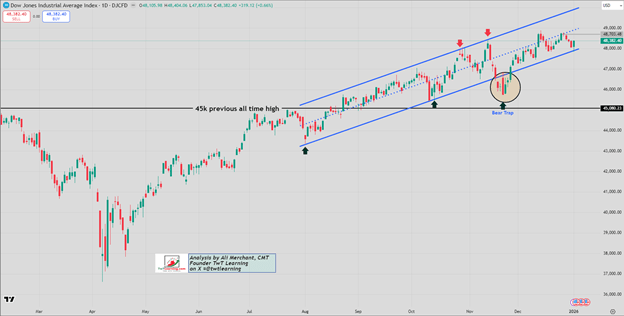
DJIA Index
The DJIA continues to trade within an upward channel that began from the lows in August 2025. On Friday, December 26, 2025, the index was unable to move above the channel’s midpoint. Support is found near the lower boundary of the channel, around 47,900. A decisive move either above or below this 47,900 level will likely determine the next direction for the index.
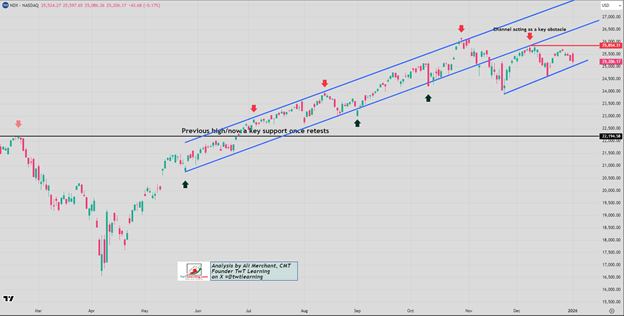
Nasdaq 100 Index
The NDX continues to face resistance in the 25,870–25,900 range. As long as this resistance holds, the index is expected to trade within a range between 25,900 and 24,645. A clear break below the 25,000 level could pave the way for a decline toward 24,645.
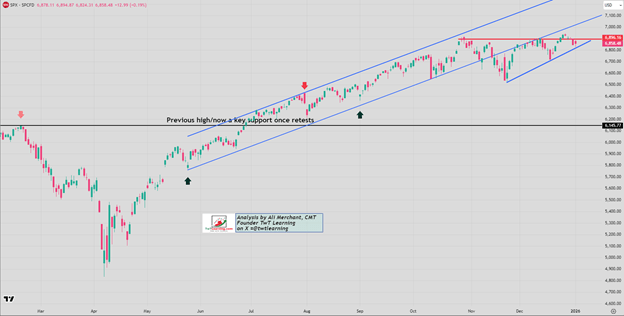
SPX Index
Last week, the SPX fell below the 6,896 resistance zone. As long as it remains under this level, a decline toward 6,820 seems probable. A strong and sustained break below 6,820 would suggest further downside potential toward the 6,740–6,720 range. Otherwise, the SPX is likely to trade sideways within the 6,890 to 6,820 range.
Weekly US Indices Probability Map
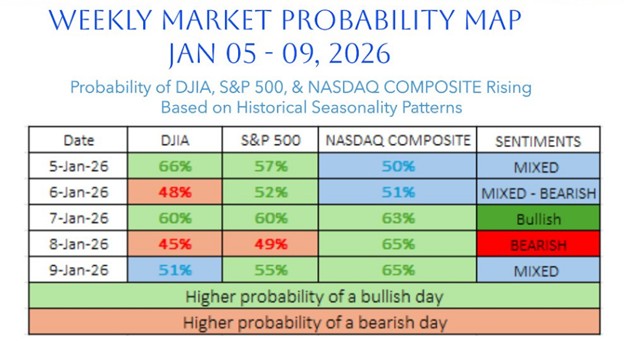
The U.S. weekly market probability map for January 5–9, 2026 indicates a week characterized by mixed trading patterns. These maps are based on historical seasonality trends, with sentiment readings generated using a seasonality-driven scoring system.
Sources: Investing

Leave a comment