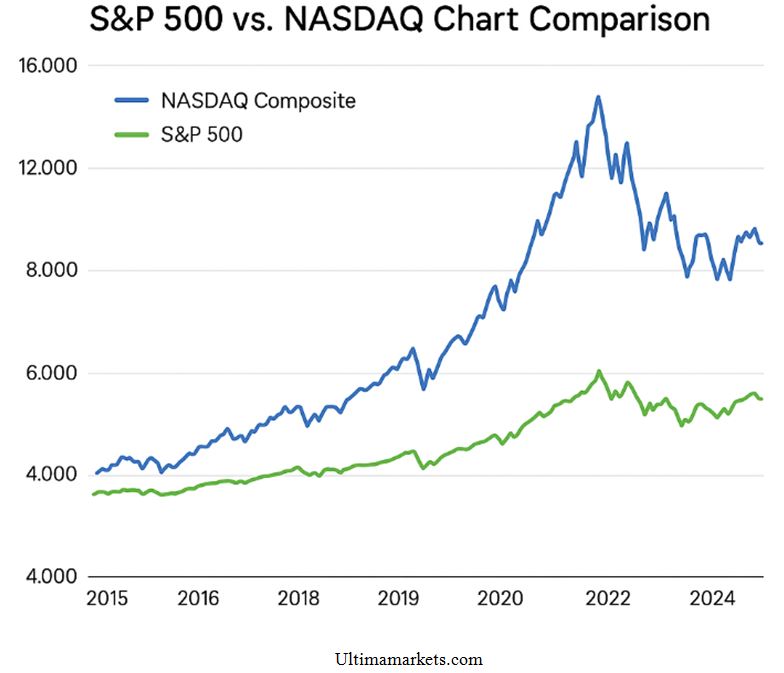
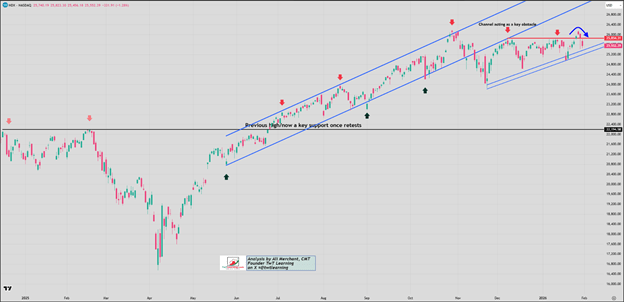
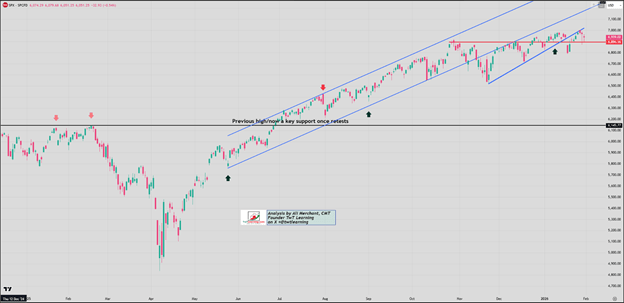
NASDAQ Composite — and technology stocks more broadly — are like a finely tuned sports car. They can easily lap your grandmother’s Oldsmobile — the Dow Jones Industrial Average — but they also require more maintenance and can stall at inconvenient moments.
Since its launch, and particularly since 2015, the NASDAQ has outperformed both the Dow and the S&P 500. Still, it’s very much a hare-and-tortoise story: the speedy rabbit occasionally takes long naps, yet ultimately wins the race — provided investors can tolerate the volatility that comes with tech-heavy exposure.
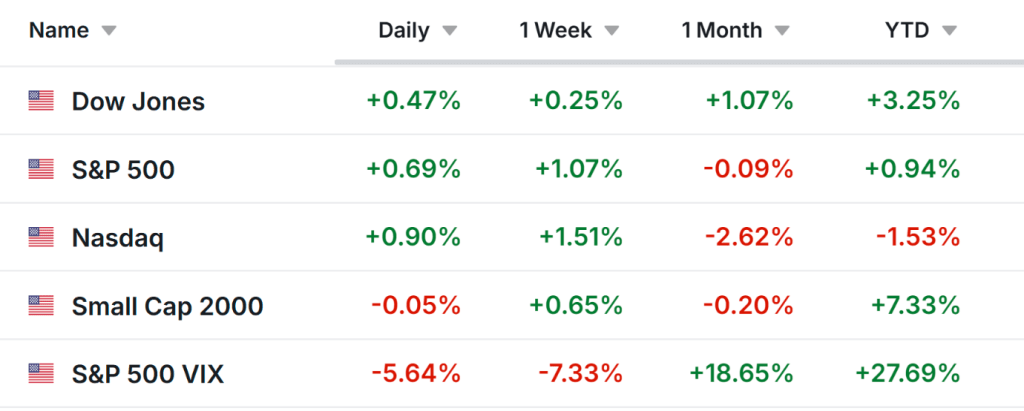
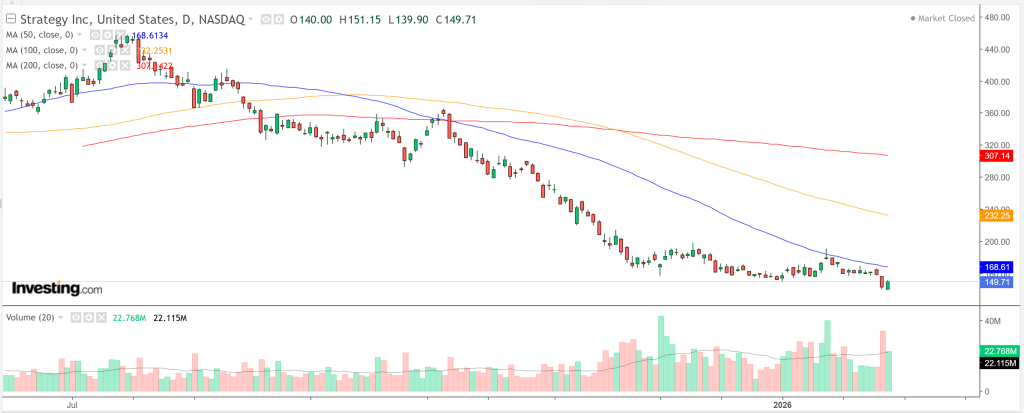
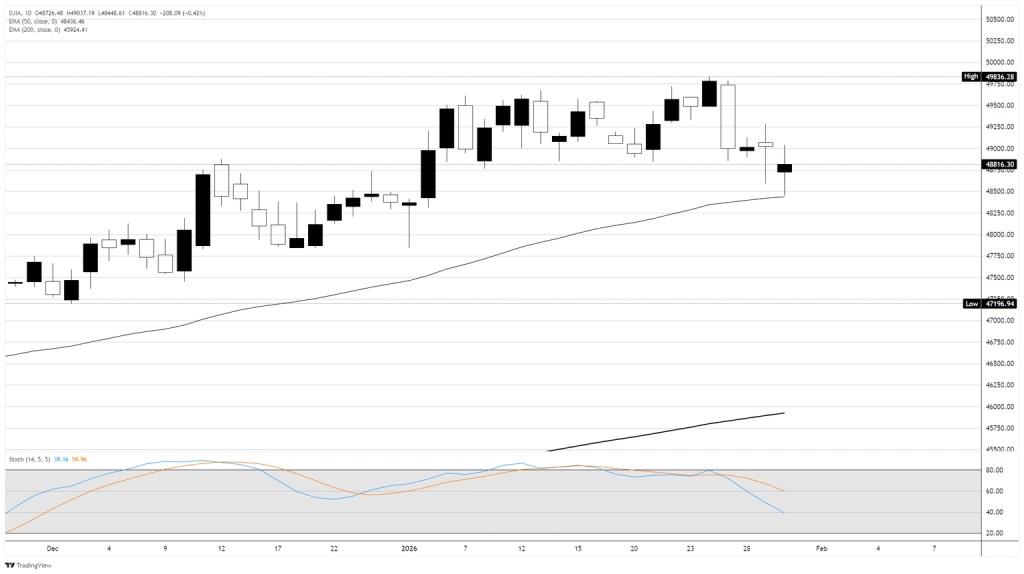
That dynamic is playing out again in the current market rotation. Since November 1, 2025, the Dow has gained 4.34%, while the NASDAQ has slipped 3.54% — a near mirror image. Once again, capital has rotated out of high-flying tech names (the flashy sports car) and into the steadier reliability of the Dow’s blue-chip stalwarts.
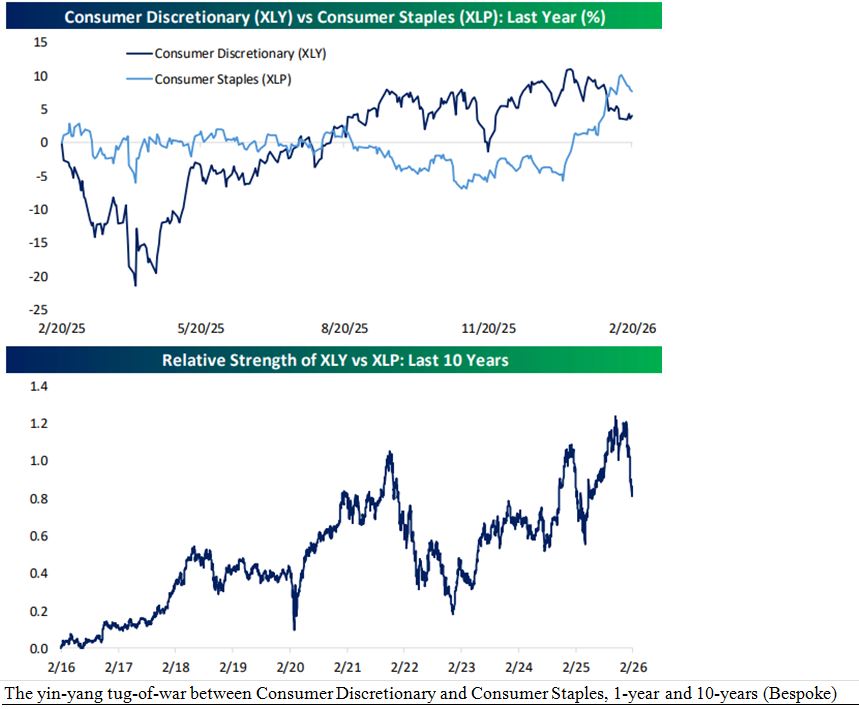
In April, Consumer Discretionary stocks tumbled during a tariff-driven selloff. Although they initially sank, they’ve since rebounded strongly. Betting against the U.S. consumer has historically been a mistake, especially when sentiment temporarily sours.
Over the past year, Consumer Discretionary shares outpaced Consumer Staples, though a recent rotation has narrowed that gap.
Yes, the NASDAQ can test your patience — even break your heart — but history suggests that endurance can pay off.
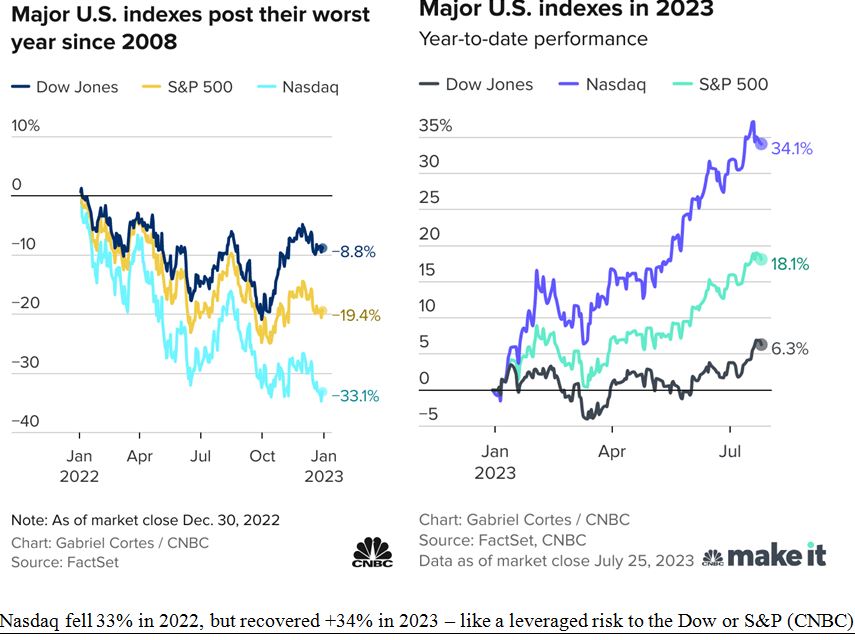
Consider late 2021. While Federal Reserve officials were still describing inflation as “transitory,” markets began adjusting. On November 19, 2021, the NASDAQ reached an all-time high of 16,057. Over the next 13 months, it plunged 36.4%, closing at 10,213 on December 28, 2022. During that same stretch, the S&P 500 fell about 19%, and the Dow declined just 7.65%.
Investors heavily concentrated in high-growth tech during 2022 likely felt significant pain. Yet those wounds healed quickly. From 2023 through 2025, the NASDAQ surged 122%, compared with a 78% gain for the S&P 500 and a more modest 45% rise for the Dow.
Short-term breakdowns in tech can be dramatic — but historically, they have often laid the groundwork for powerful long-term outperformance.
The Biggest NASDAQ Disaster – The Y2K Crash
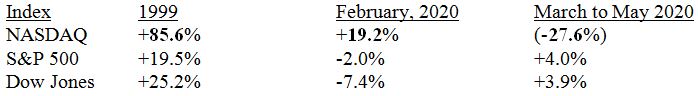
In 1999, the NASDAQ Composite was on a tear, doubling between June 1999 and March 2000, while the Dow Jones Industrial Average seemed half-asleep by comparison. That divergence flipped abruptly in March 2000. The Dow began climbing just as the NASDAQ collapsed, ultimately losing 50% or more in short order.
In February 2000, the NASDAQ experienced a classic “melt-up” even as the Dow drifted lower. By mid-April, the opposite occurred: the NASDAQ suffered its worst week, plunging while the Dow actually advanced. From the start of 1999 through the end of February 2000, the NASDAQ had soared 122%, compared with gains of just 16% for the S&P 500 and 17% for the Dow. Then came the reversal. Between March and May, the blue-chip indexes gained about 4%, while the NASDAQ tumbled 28%. In a single week — April 11–15 — the NASDAQ dropped 25.3%, even as the Dow rose 3.4%.
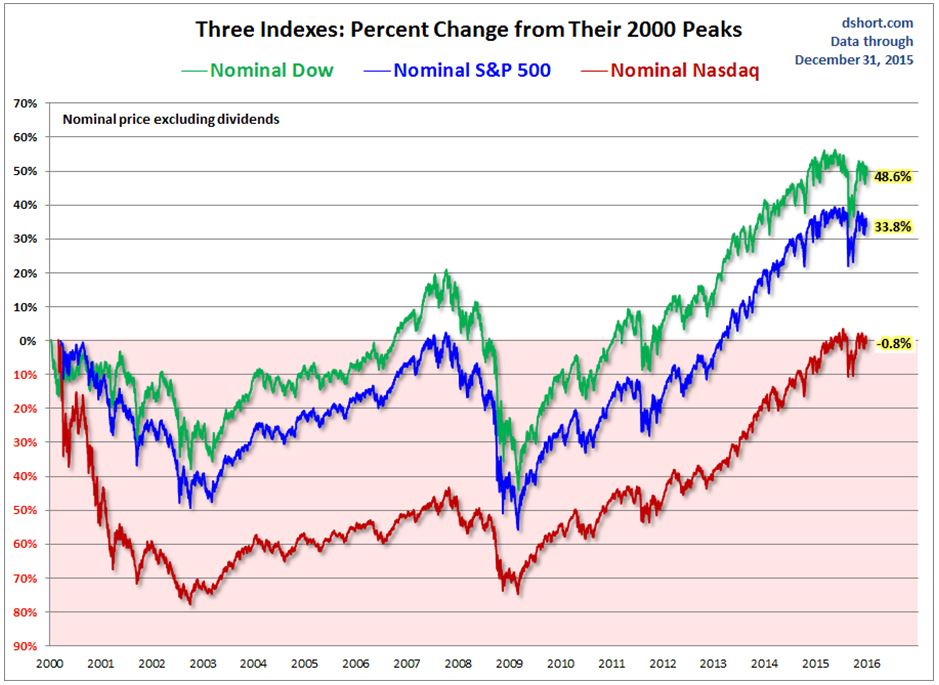
The aftermath was even more sobering. It took 16 years for the NASDAQ to reclaim its March 2000 peak. Meanwhile, the Dow and S&P 500 briefly reached new highs by 2007 and went on to establish lasting all-time highs by 2012. Over that 16-year span, the Dow climbed 48.6%, the S&P 500 gained 33.8%, and the NASDAQ was still slightly below its prior peak.
Still, comparisons between 2026 and the dot-com era can be misleading. The 1999 boom was driven largely by speculative internet companies with little or no earnings. Today’s technology leaders, by contrast, generate substantial revenues and profits, with strong forward guidance tied to tangible business applications. This is a very different foundation.
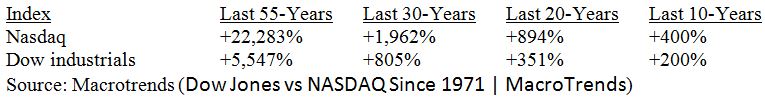
Over the long haul — since its launch 55 years ago — the NASDAQ has dramatically outperformed both the Dow and the S&P 500, often by multiples of two to four times. Since 1971, the NASDAQ has surged nearly 260-fold, rising from 89.61 to 23,242 at the start of 2026. Over the same period, the Dow has increased about 57-fold and the S&P 500 roughly 74-fold.
So while volatility can test investors’ patience, history suggests resilience. Not every four-letter ticker deserves a four-letter rebuke.
Each week, host and Zacks stock strategist Tracey Ryniec teams up with guest experts to break down the most compelling trends in stocks, bonds, and ETFs — and what they mean for investors’ everyday lives.
The era of the “Magnificent 7” may be winding down. Before that, investors rallied around the FANG stocks, which later evolved into FANGMAN. At one point, some pushed to include Tesla, transforming the group into the Magnificent 7.
Now, with several of those mega-cap names losing momentum, that once-dominant lineup appears to be fading.
Moving Past Apple and Microsoft
For years, mega-cap tech giants like Apple and Microsoft have led the market. But what if leadership shifts?
Tracey highlights five non–big tech companies that could emerge as the “new” magnificent stocks. All five are trading at fresh five-year highs and are projected to deliver double-digit earnings growth in 2026.
Are you prepared to look beyond Apple and Microsoft to discover the market’s next generation of winners?
5 New “Magnificent” Stocks to Consider for 2026
MasTec, Inc. (MTZ)
MasTec operates across communications, energy, and utilities infrastructure — positioning it as a potential AI infrastructure beneficiary. The stock has surged 225% over the past five years and is trading at fresh five-year highs.
While it has yet to report Q4 2025 results (due Feb. 26, 2026), earnings are projected to climb 61.8% in 2025 and another 28.6% in 2026. However, with a forward P/E of 33.5, the valuation is well above traditional value levels.
Does an infrastructure-focused growth name like MasTec deserve a spot on your watchlist?
Caterpillar Inc. (CAT)
Known for its construction and mining equipment, Caterpillar is benefiting from renewed infrastructure and development activity. Shares are up 262% over the past five years, also marking new five-year highs.
Earnings are expected to grow 18.9% in 2026. Yet, like MasTec, Caterpillar trades at a premium, with a forward P/E of 33.6.
Is there still upside ahead, or have investors already priced in the growth?
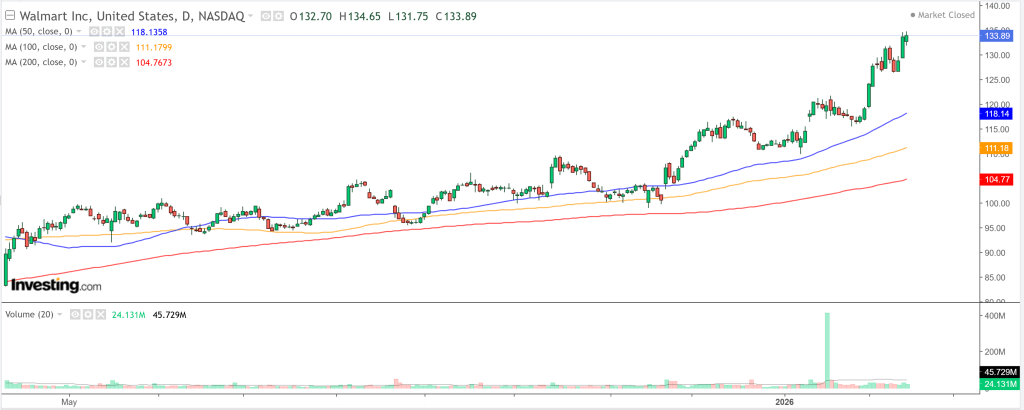
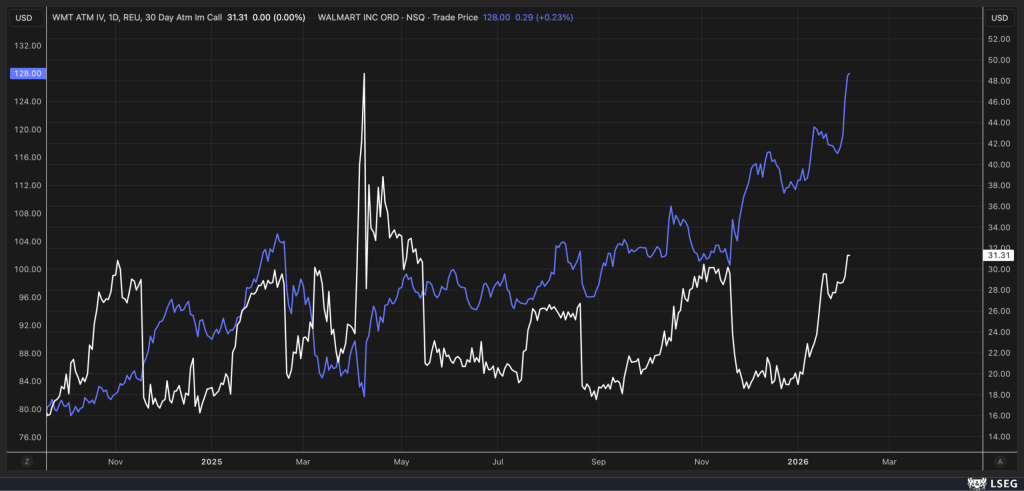
Walmart Inc. (WMT)
One of America’s largest retailers, Walmart has significantly expanded its online presence since 2020. The strategy appears to be paying off: shares have gained 164% over five years and sit at new highs.
Despite projected earnings growth of 11% in fiscal 2027, Walmart trades at a lofty 42.6 forward P/E — even higher than NVIDIA at roughly 25x.
Has Walmart become overheated, or is its transformation still underappreciated?
Eli Lilly & Company (LLY)
Eli Lilly, a pharmaceutical heavyweight, is riding strong momentum driven partly by its weight-loss treatments and an upcoming pill launch. The stock has soared 404% over five years, outperforming the S&P 500 and hovering near record highs.
Earnings are forecast to rise 39.6% in 2026. With a forward P/E of 30, Lilly isn’t cheap, but it’s more moderately valued compared to some peers.
Could healthcare leadership define the next “magnificent” cycle?
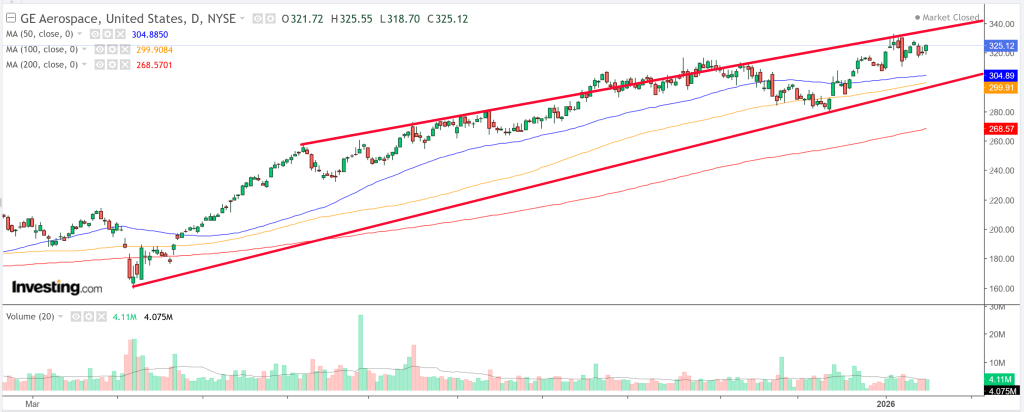
Howmet Aerospace Inc. (HWM)
Operating in aerospace and defense, Howmet has delivered one of the most remarkable runs of the group, climbing 798% over the past five years and reaching new all-time highs.
Earnings are projected to grow 18.8% in 2026. Still, its forward P/E of 56 signals a steep premium.
Can a high-growth defense supplier sustain its momentum at these levels?
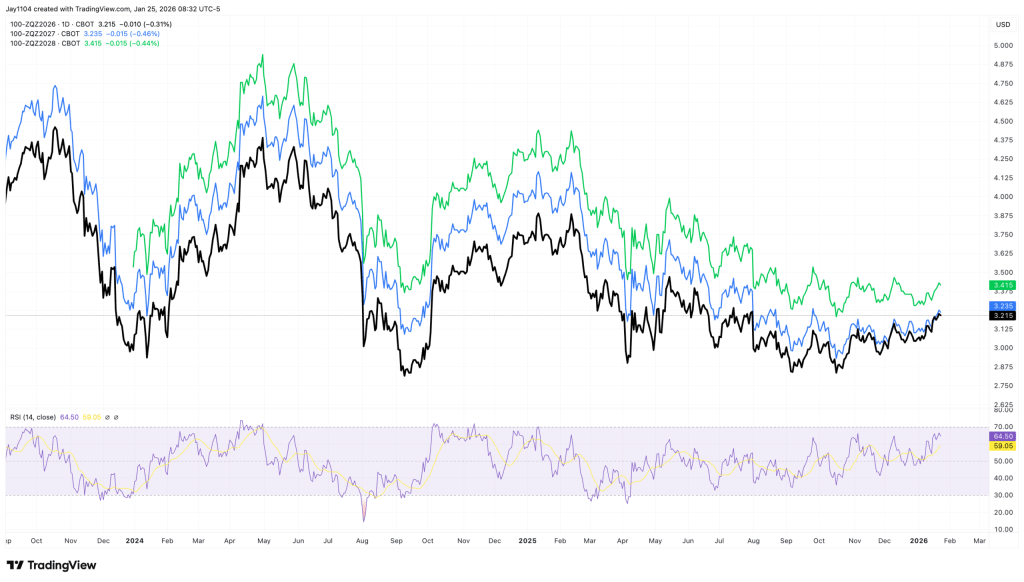
The benchmark 10-year Treasury yield is testing critical support, with downside pressure beginning to build.
Equities and bond yields are sliding in tandem — an unusual combination that may reflect deteriorating macro-risk conditions.
A strengthening US dollar alongside declining yields could point to a broader defensive rotation across markets.
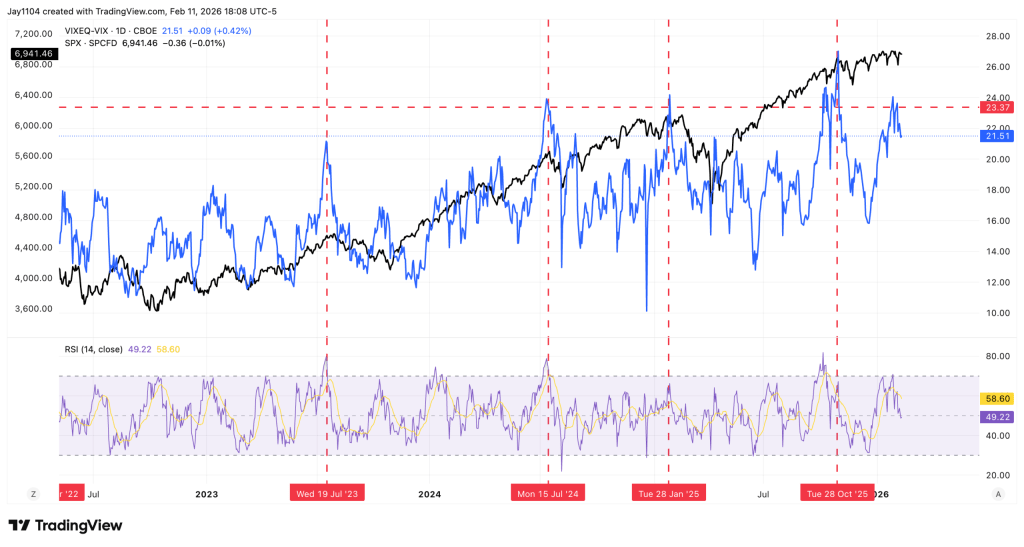
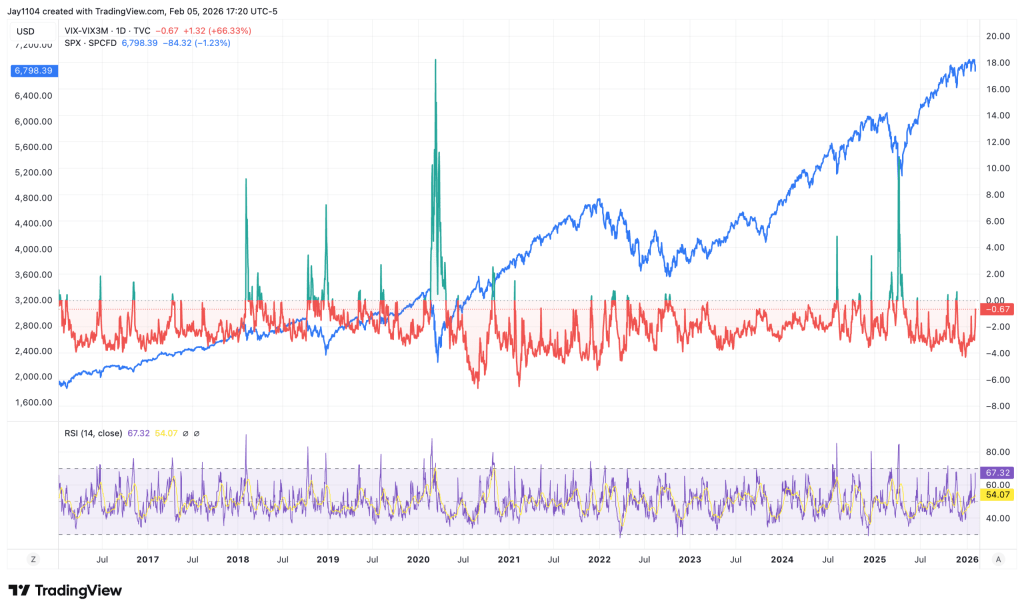
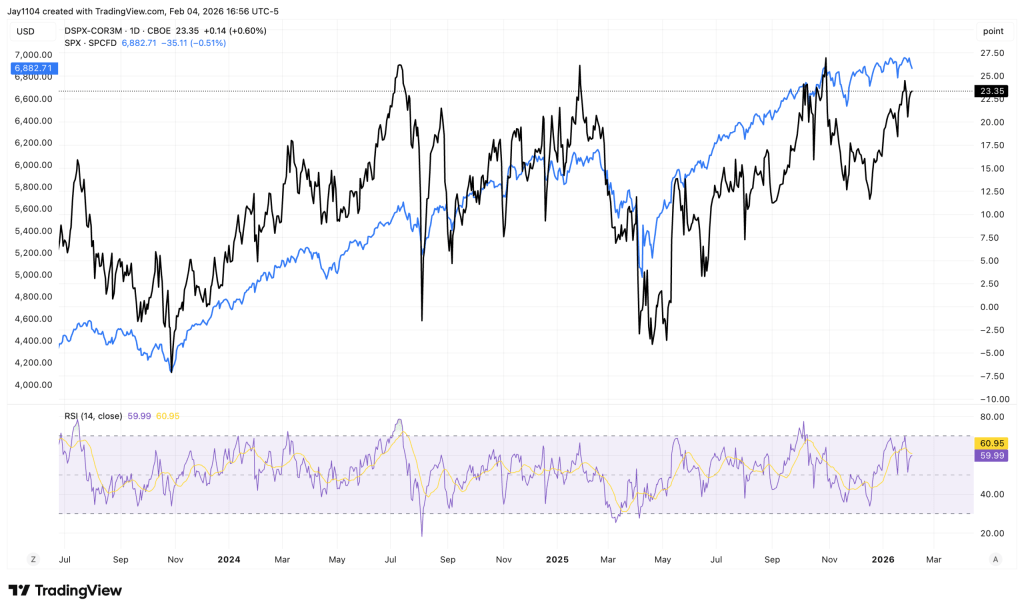
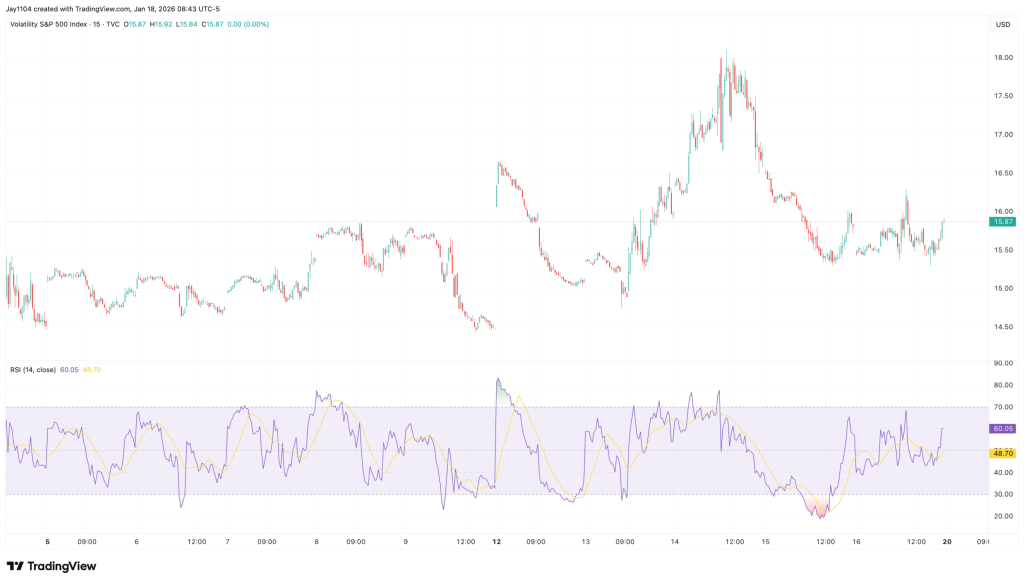
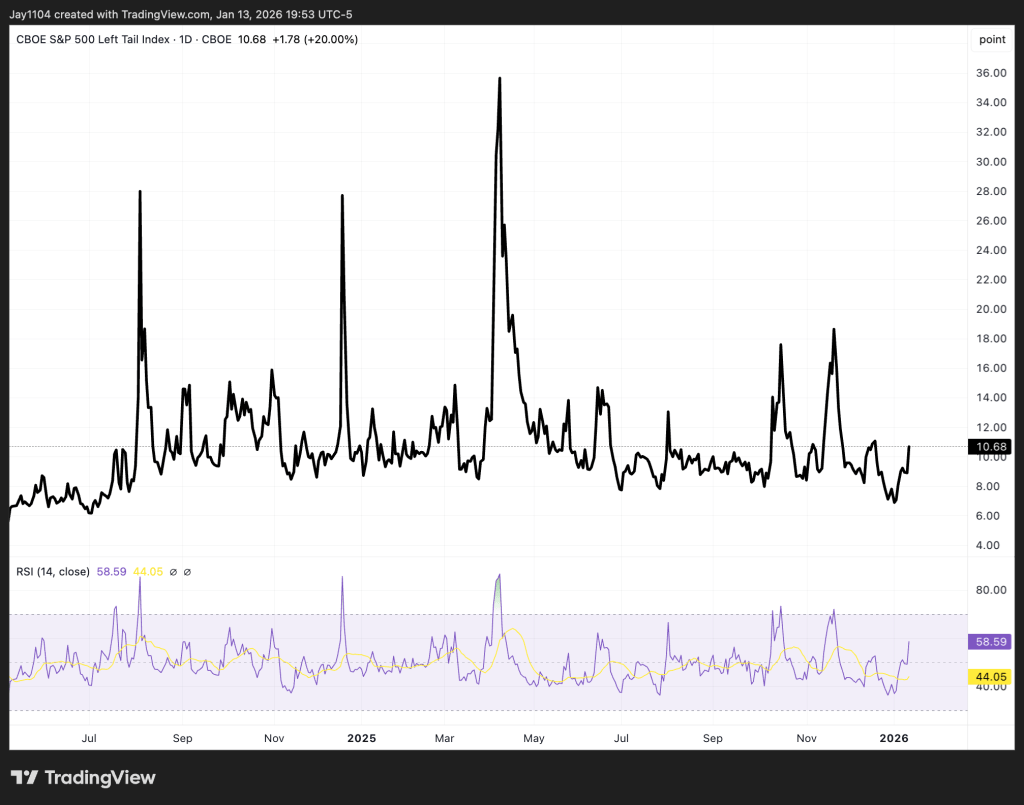
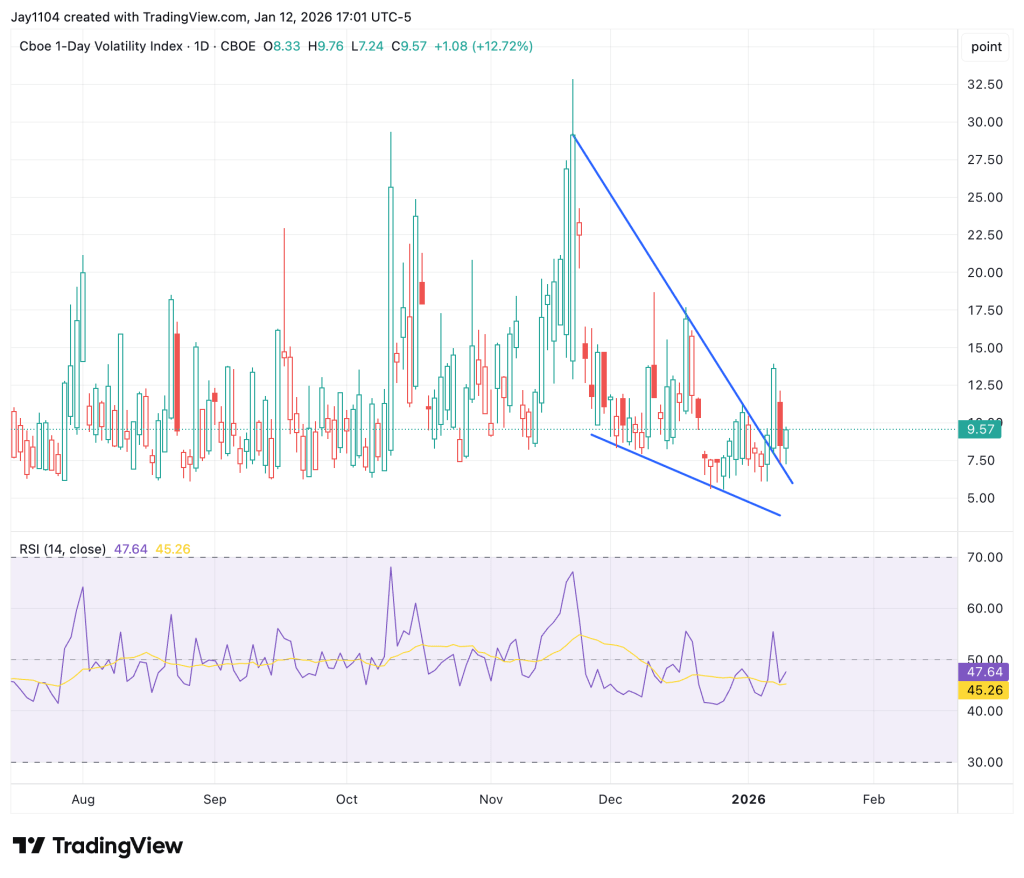
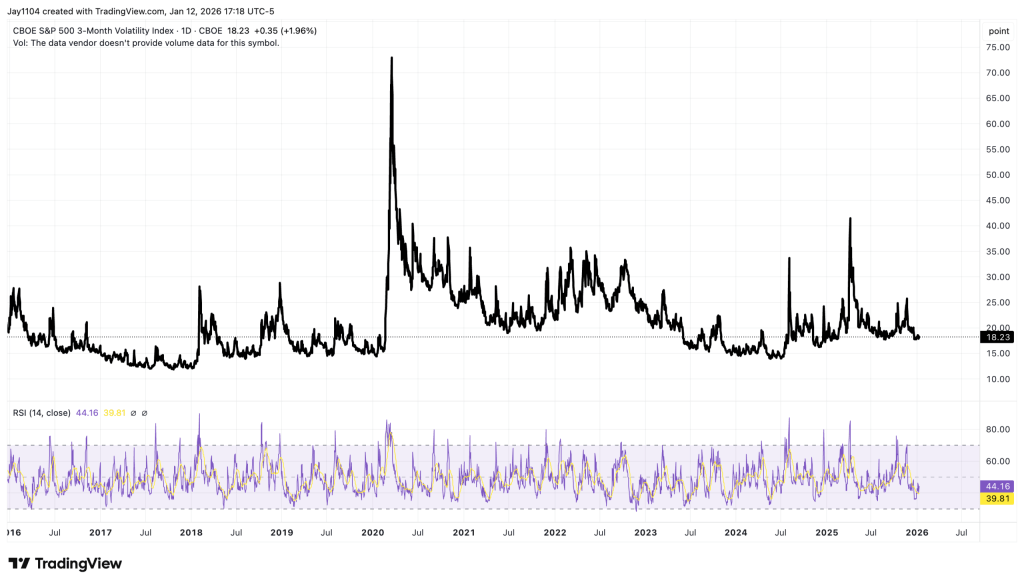
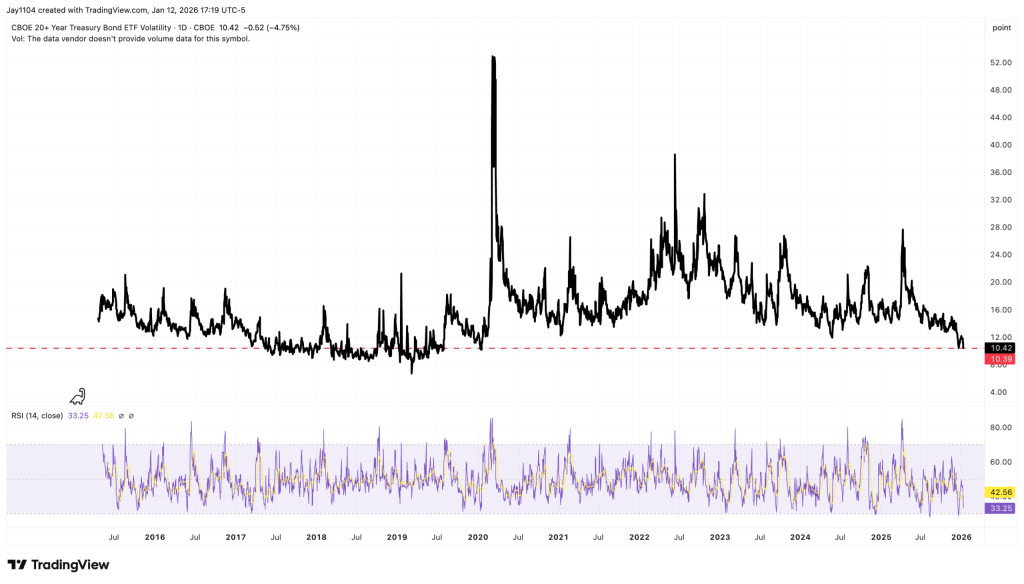
Last week, attention was drawn to the danger zone in the CBOE Volatility Index. Historically, when Wall Street’s “fear gauge” climbs into the mid-20s, equity markets have tended to experience heightened turbulence.
Now, focus shifts to the benchmark 10-year US Treasury yield. Recently, declining yields have supported the S&P 500 — particularly small- and mid-cap shares — since the so-called Liberation Day and the development of the expansive One Big Beautiful Bill Act (OBBBA). Additional fiscal stimulus or tax relief may still be forthcoming, as suggested by Donald Trump during Tuesday night’s State of the Union address.
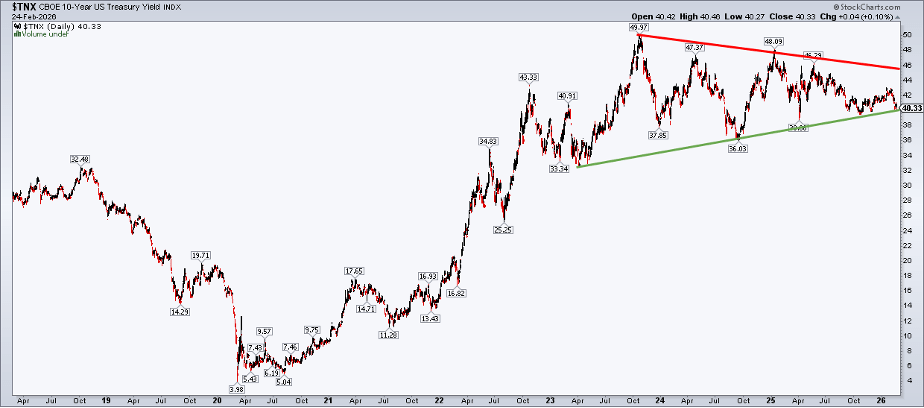
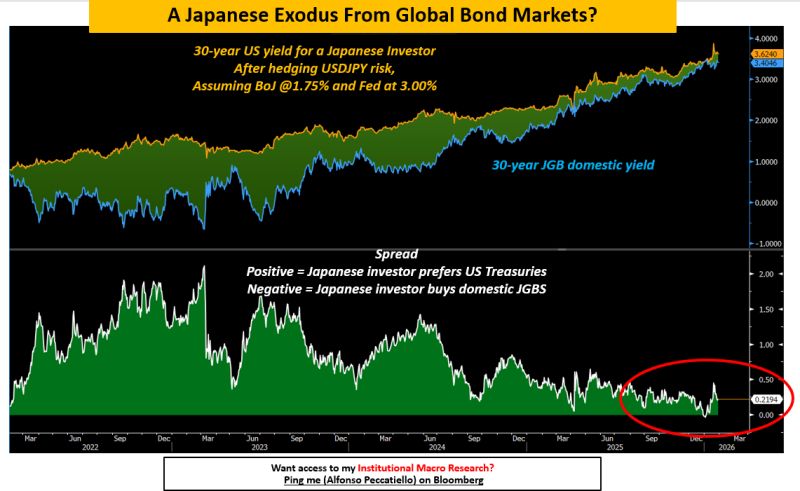
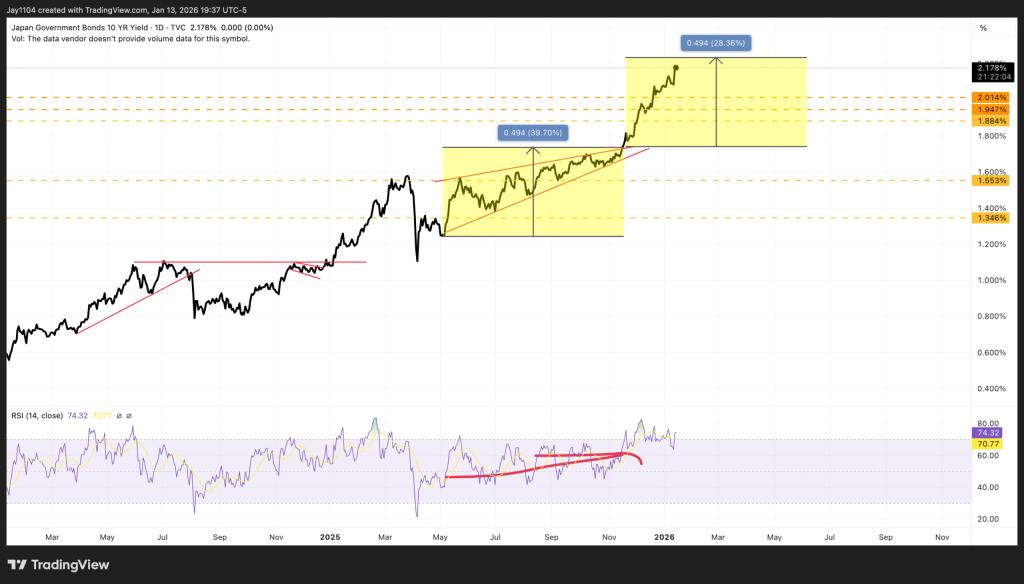
Importantly, the surge in yields last April and May was not confined to the United States. Global bond markets reached multi-decade highs, pulling US Treasuries higher in tandem. Despite narratives around “selling America,” the primary US bond bear market unfolded between August 2020 and October 2023, when the 10-year yield climbed sharply from 0.504% to 4.997%. The past two and a half years have largely represented a consolidation phase rather than a fresh structural breakout.
The key question now: is that consolidation nearing resolution — and if so, in which direction?
10-Year Treasury Yield: A historic tightening pattern after the major bond bear market. Chart courtesy of StockCharts.com.
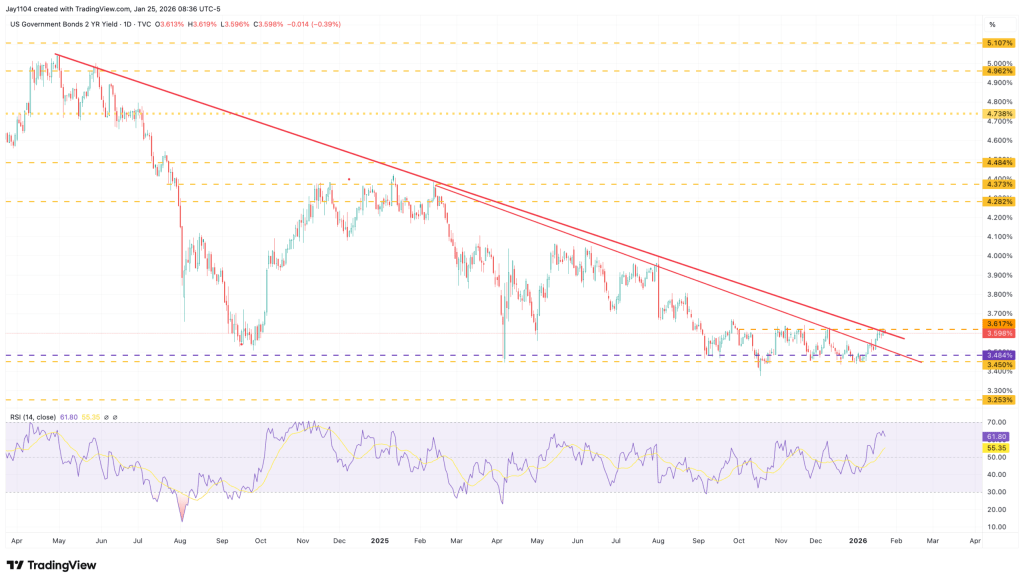
Treasuries Under the Spotlight
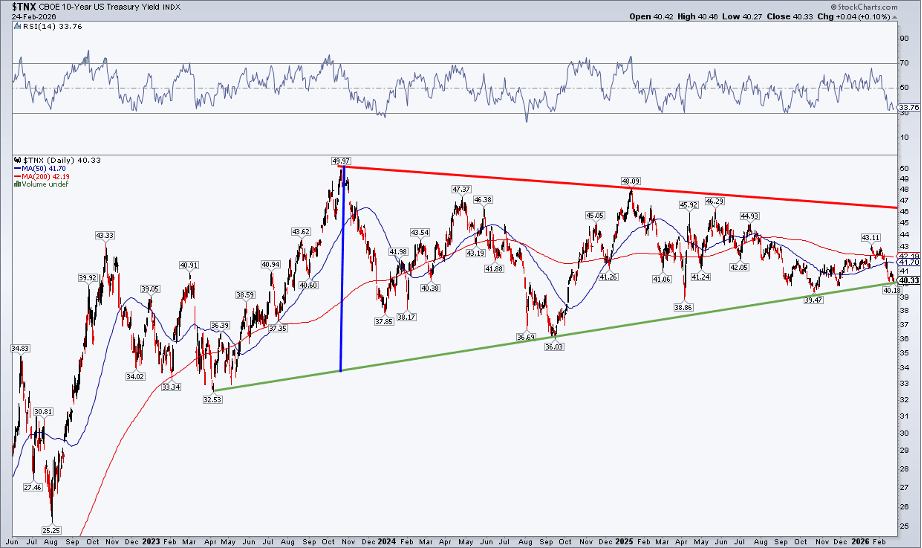
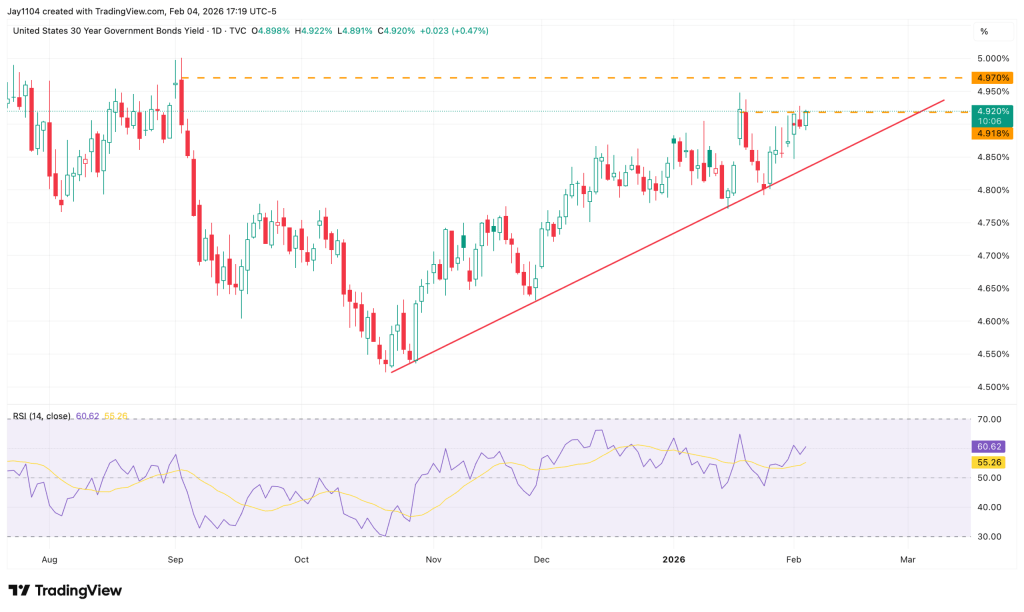
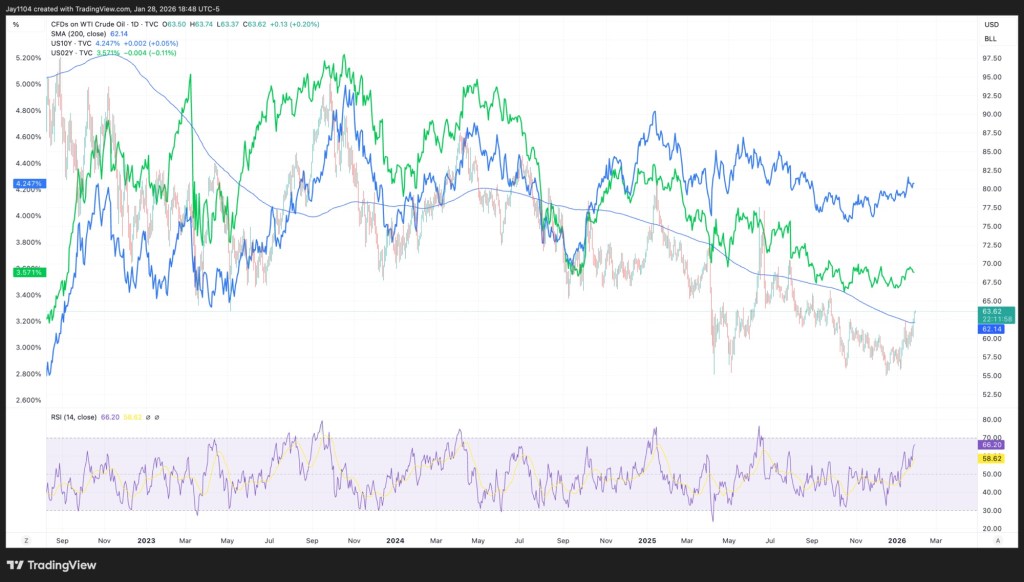
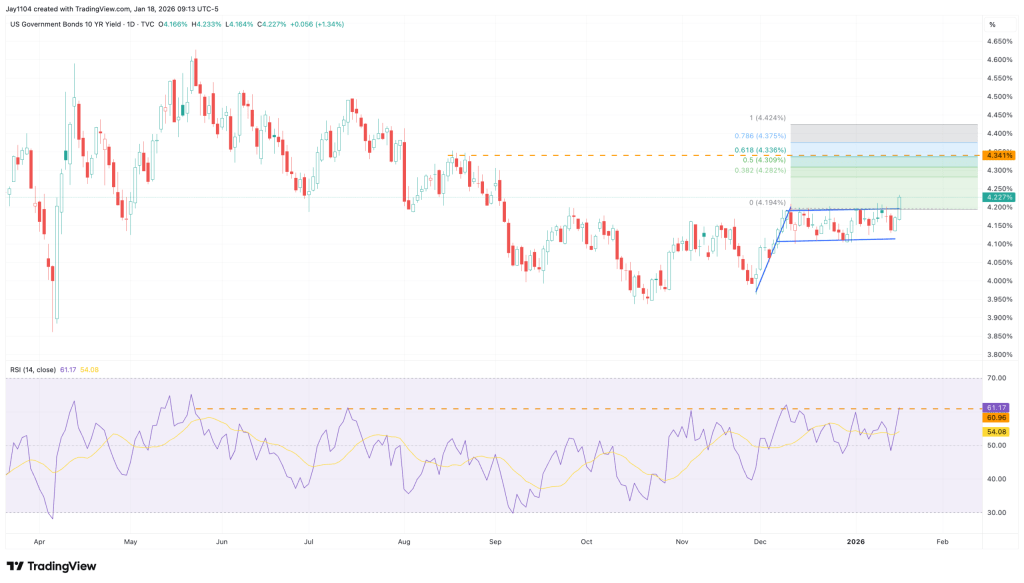
The chart below suggests that the 10-year Treasury yield could be slipping beneath a critical support level. A brief upside breakout in January quickly reversed as sellers stepped in, and now the benchmark rate is hovering near the 3% mark. It’s worth reminding traders that diagonal trendlines can be unreliable, while horizontal support and resistance levels tend to carry more weight. Additionally, log-scale charts are generally better suited for evaluating wide swings in price or yield.
With those caveats noted, what is the chart signaling? Trading below both the 50-day and 200-day moving averages, the primary trend favors Treasury price bulls (and lower yields). Meanwhile, the RSI has eased back toward the 30 level after failing to reach 70 during the fourth-quarter rate advance. The green upward-sloping support line is now pivotal — a decisive break beneath it, along with a drop below the late-2025 low of 3.947%, could push the 10-year yield down into the low 3% range.
10-Year Treasury Yield: Multi-Year Consolidation With Key Support at Risk (Log Scale). Chart courtesy of StockCharts.com.
In isolation, increasing exposure to Treasuries would be logical if yields break down and bond prices attract strong demand. But stepping back with an intermarket perspective, the bigger question becomes: what would that move signal for the broader financial markets?
A Potential Shift in the Stock–Bond Dynamic?
For stocks, a move toward 3–4% intermediate-term rates would likely coincide with softer economic conditions — perhaps a weak jobs report, sharply cooling CPI or PCE inflation, a downturn in sentiment indicators such as the ISM Manufacturing survey, or another disappointing Retail Sales release.
That said, with the fourth-quarter earnings season mostly wrapped up — including NVIDIA’s (NASDAQ: NVDA) results released Wednesday — it would probably take truly bleak off-season earnings updates or a wave of negative preannouncements to significantly rattle equities.
Another potential driver of a renewed bond bull market could be the ever-intensifying AI theme. In a “sell first, ask questions later” climate, fresh cautionary analyses or existential-impact discussions around artificial intelligence could further unsettle investors and sustain demand for safe-haven assets.
When Trading Ranges Start to Break Down
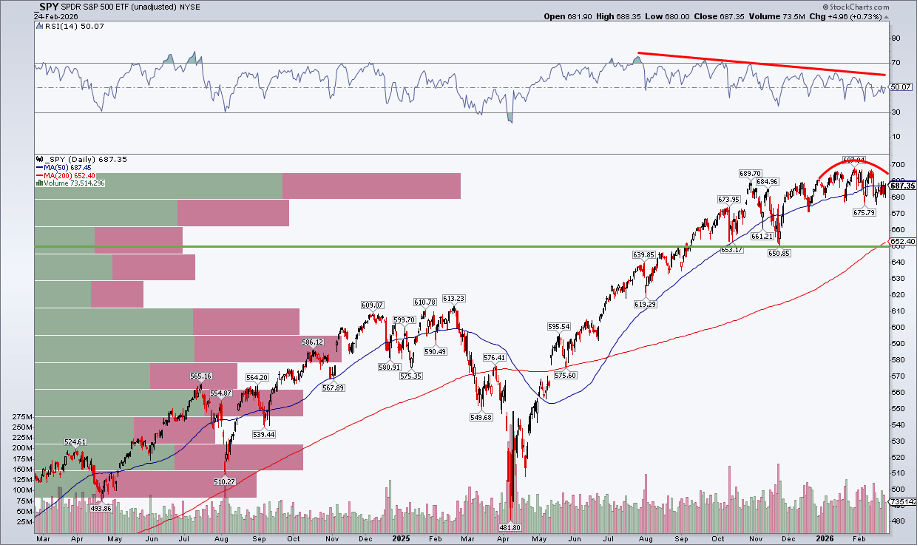
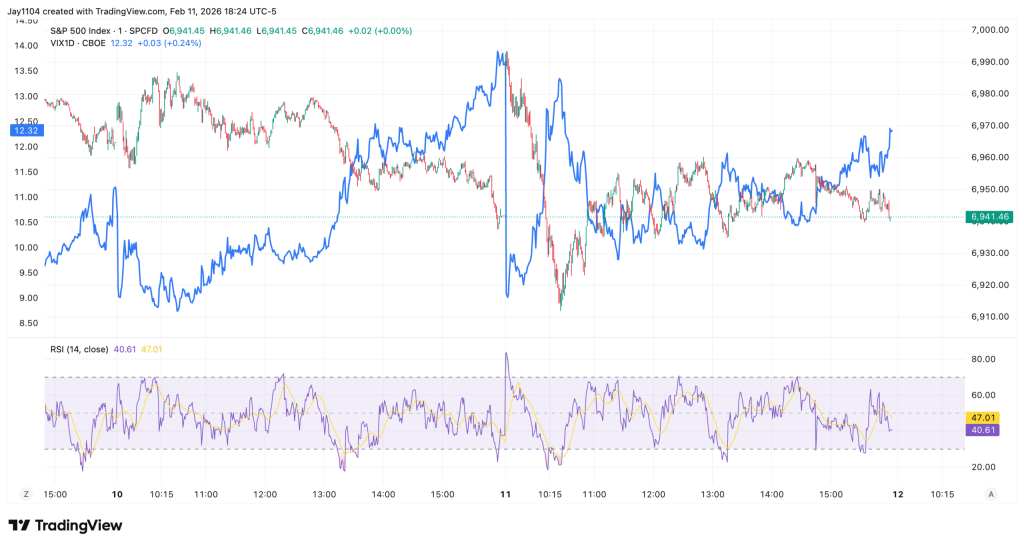
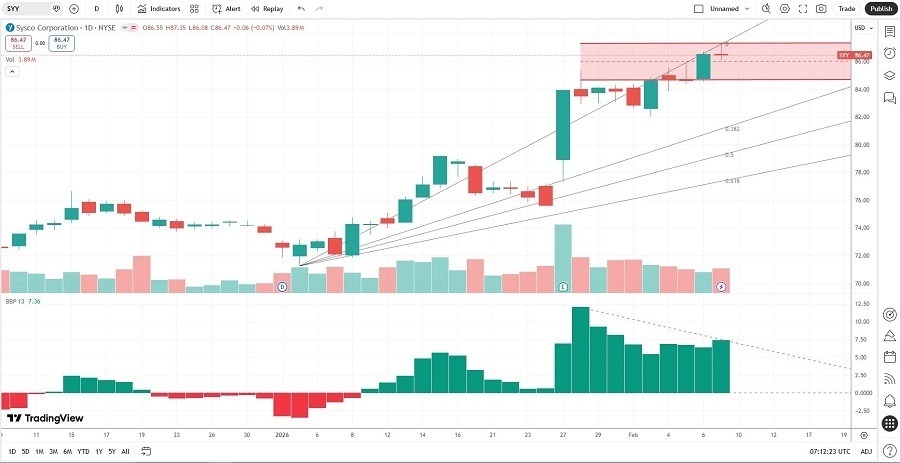
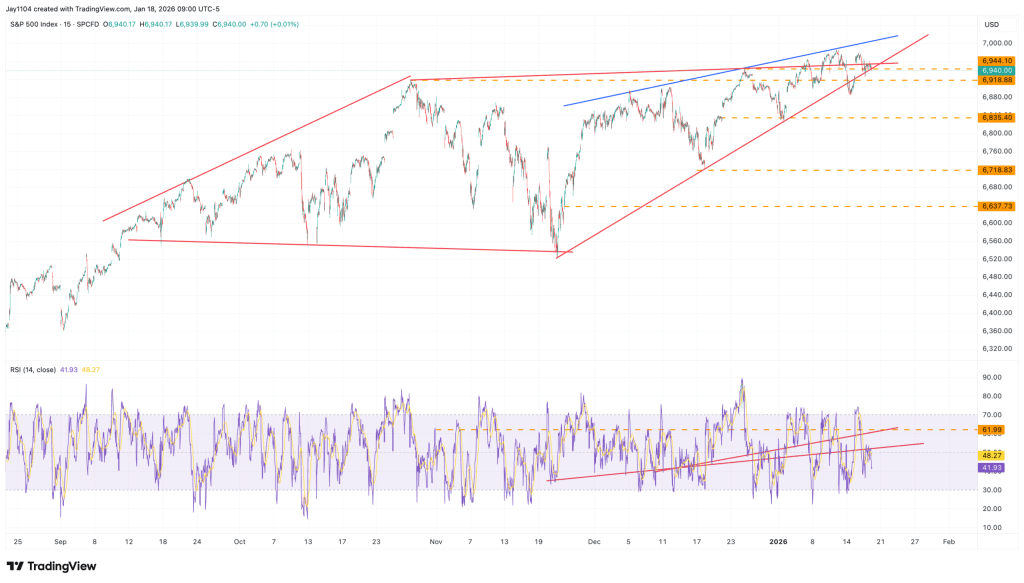
Regardless of the underlying catalyst, it’s evident that stocks and bonds are no longer moving in sync the way they did last spring and summer. The S&P 500 — like the 10-year Treasury yield — has been edging lower in recent weeks. We’re now nearly a month past the SPDR S&P 500 ETF Trust (SPY) intraday record of $697.84. Although much attention has focused on the tight trading range since late November, one could argue that a rounded-top formation is beginning to take shape.
A glance at the RSI momentum oscillator reinforces this view. Momentum has been trending lower since July. Much like a ball tossed into the air slows before changing direction, RSI often decelerates ahead of a price reversal. The unfolding narrative could be this: bond yields break down first — and equities eventually follow.
SPY: Emerging Rounded-Top Pattern, RSI Deteriorating, 200-Day Moving Average Around $650. Chart courtesy of StockCharts.com.
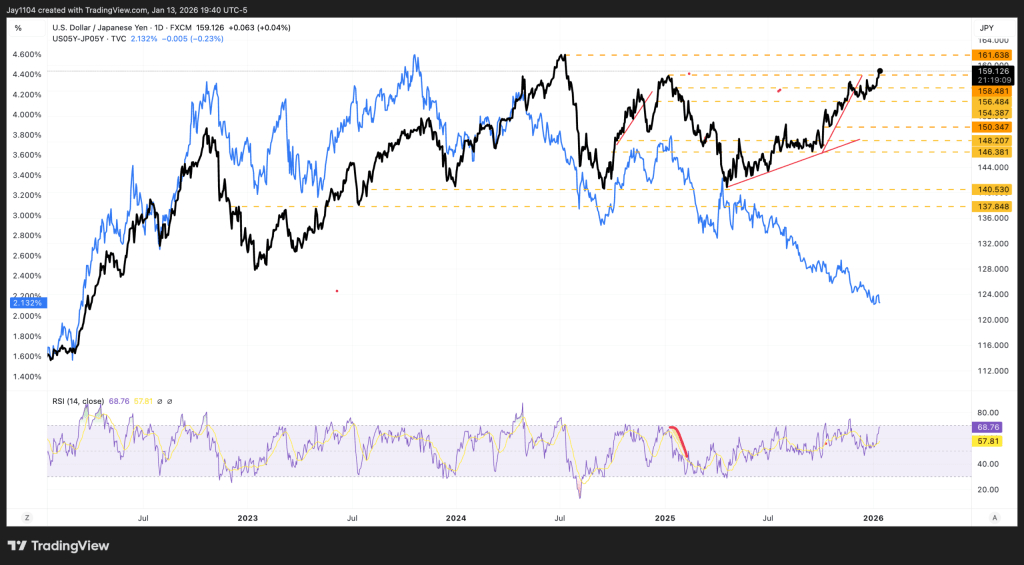
Don’t Overlook the Dollar
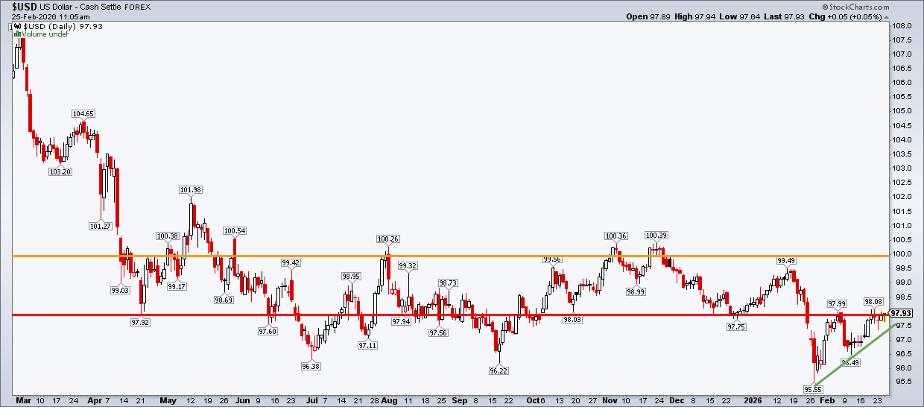
Largely flying under the radar is the US Dollar Index (USD). The greenback carved out a low near 95.55 around the same time U.S. large-cap equities peaked. Since then, the 98 level has surfaced as a potential breakout zone.
A setup featuring falling Treasury yields, declining stocks, and a strengthening dollar would reflect a classic risk-off macro environment. Based on a measured-move projection, the USD could target the 100 area — just shy of the zone where the dollar encountered resistance from May through November 2025.
US Dollar Index: Short-Term Ascending Triangle Pattern Points Toward 100. Chart courtesy of StockCharts.com.
The Bottom Line
Is this a doomsday forecast? Not at all. Market corrections are a normal part of the cycle. On average, the S&P 500 experiences an intra-year drawdown of about 14.2%, yet it has still finished higher in 35 of the past 46 years.
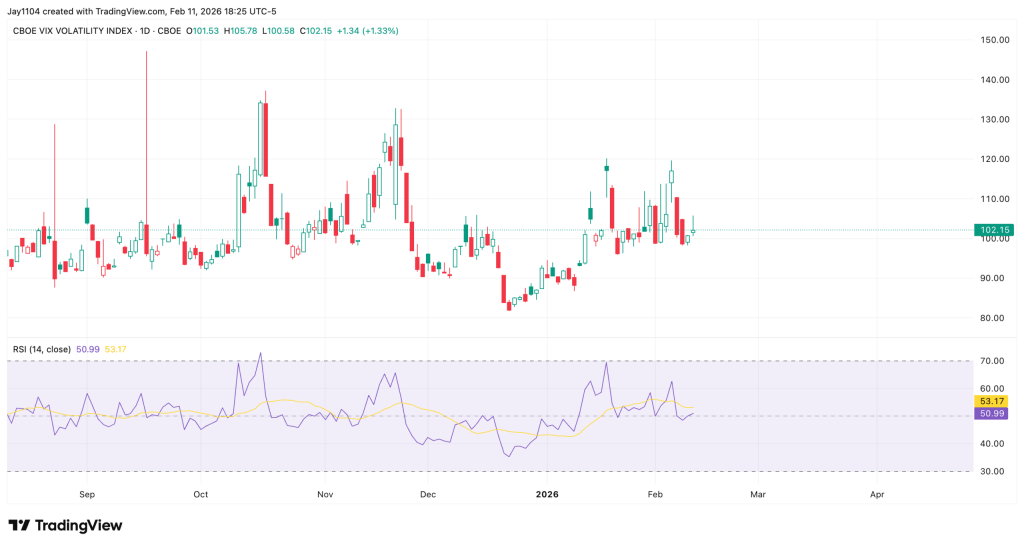
Rather than sounding alarms, this is simply a cross-asset check-in as we head into a month that has historically delivered heightened volatility. I tend to think of March as October’s little brother — price swings can become exaggerated. And with the CBOE Volatility Index still hovering around 20, disciplined risk management deserves to remain front and center.
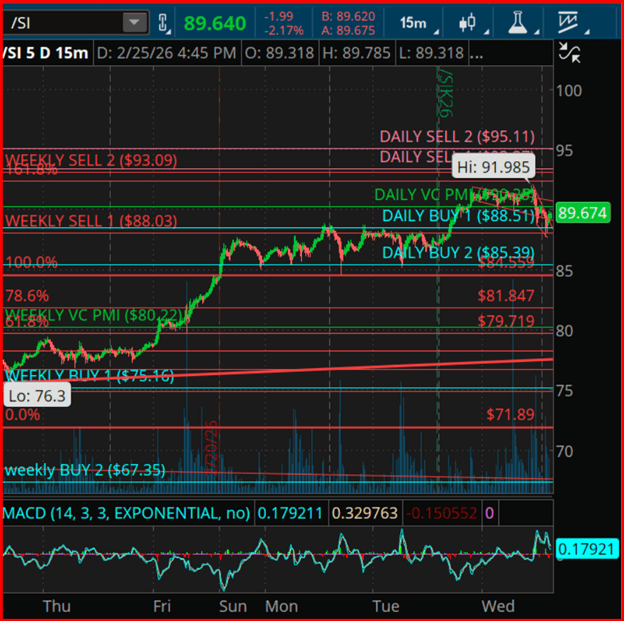
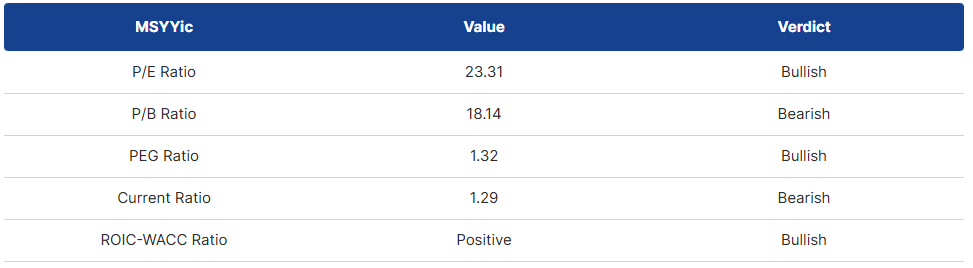
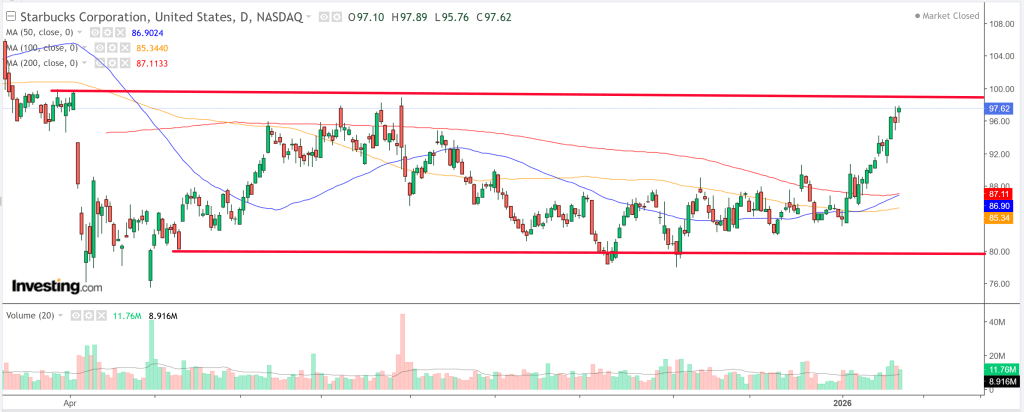
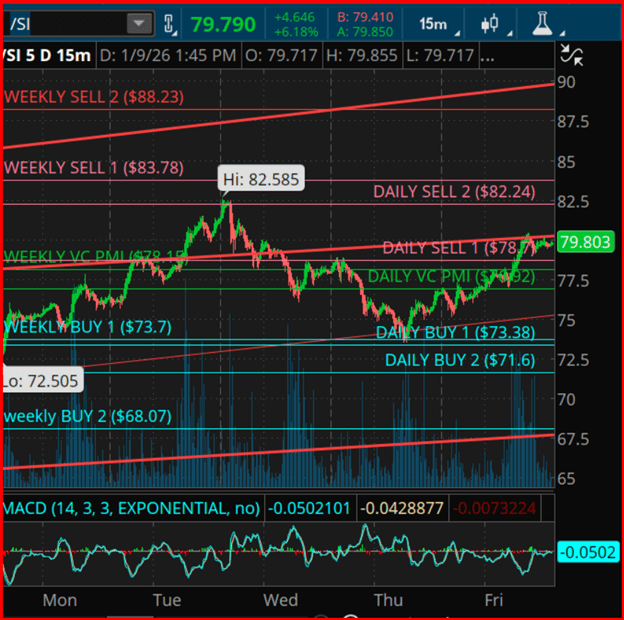
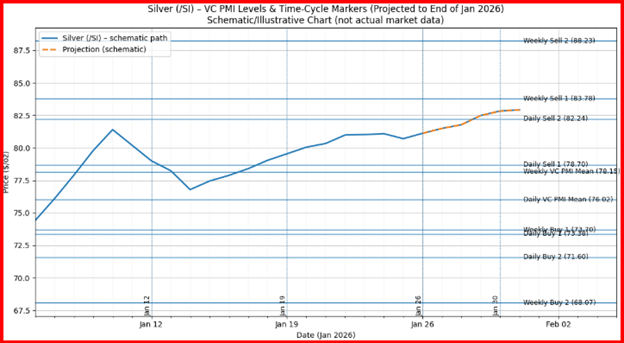
The February 26–March 3 cycle represents a projected volatility expansion window. If price maintains support above the weekly mean and regains upside momentum, the next bullish targets come in at $98, $105, and potentially $120. However, a breakdown below the $85.39 daily Buy-2 level would postpone the expansion phase and shift the market back into a deeper accumulation range between $81.85 and $79.71.
Silver futures are currently trading within a structured VC PMI mean-reversion model, signalling a transition from distribution into a fresh decision phase as price oscillates around both the daily and weekly averages. Within the VC PMI framework, the mean represents equilibrium — the point where supply and demand balance. Moves toward Buy-1/Buy-2 or Sell-1/Sell-2 define statistically extreme zones, carrying a 90%–95% probability of reverting back toward the mean.
Around the $89 area, silver has pulled back from upper resistance and is now rotating toward the daily mean in the $89–$90 zone. The weekly Sell-1 level at $88.03 and Sell-2 at $93.09 frame the upper distribution band. A decisive close above $93.09 would confirm a bullish breakout into the next fractal structure, flipping resistance into support and opening harmonic upside projections toward $98–$105 based on Square of 9 geometric expansion.
On the downside, failure to sustain trade above the weekly mean near $80.22 would keep silver locked in a broader consolidation pattern. In that scenario, Buy-1 at $75.16 and Buy-2 at $67.35 define longer-term accumulation levels.
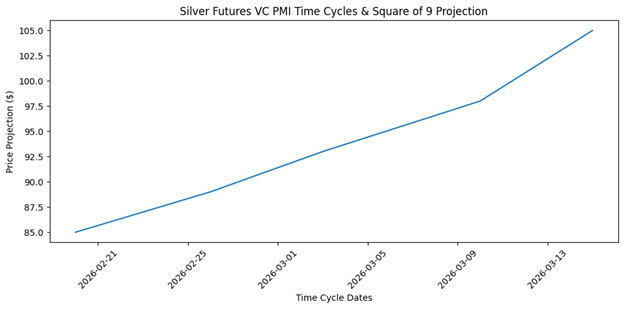
Time-cycle analysis highlights February 26 to March 3 as a pivotal rotational window — a period when corrective phases often conclude and directional momentum emerges. This timing aligns with the current consolidation around the mean, increasing the probability of volatility expansion into early March. A secondary cycle window between March 8 and 12 historically signals either continuation or reversal, depending on whether price holds above or below the mean established during the initial cycle.
These cyclical harmonics are derived from recurring liquidity patterns and repetitive market behavior rather than macro fundamentals, underscoring the quantitative foundation of the VC PMI framework.
Square of 9 geometry reinforces the current technical framework, highlighting harmonic resistance around $93 and $100 as key angular levels projected from prior lows and rotational pivot points. On the downside, support harmonics cluster near $85, $81.85, and $79.71, creating a geometric staircase of demand zones where the probability of institutional accumulation increases. When time and price harmonics converge, markets tend to generate accelerated directional moves — particularly if price pushes above the Sell-2 extreme or breaks below the Buy-2 threshold.
By integrating VC PMI, cyclical timing analysis, and Square of 9 geometry, this methodology offers a structured, rules-based trading approach. The emphasis remains on statistical probability, market structure, and disciplined execution rather than emotional decision-making.
Futures tied to the main U.S. stock benchmarks edged lower as investors focused on key earnings from the technology sector. Nvidia, a heavyweight in the U.S. equity market, delivered stronger-than-expected results, though investors are seeking clearer guidance on when its substantial cash flow will translate into greater shareholder returns. Salesforce shares declined after issuing a softer revenue outlook. Meanwhile, oil prices held steady ahead of crucial nuclear negotiations between U.S. and Iranian officials.
Futures Edge Lower
U.S. equity futures moved down Thursday as markets digested earnings from AI leader Nvidia.
As of 03:05 ET (08:05 GMT), Dow futures were down 122 points, or 0.3%, S&P 500 futures slipped 0.1%, and Nasdaq 100 futures also fell 0.1%. This followed gains across all major Wall Street indices in the previous session, when investors positioned ahead of Nvidia’s earnings release.
Sentiment had improved on renewed optimism surrounding artificial intelligence, marking another shift in what has been a volatile narrative around the emerging technology. The Nasdaq led prior gains as investors regained confidence that AI could eventually deliver broad economic benefits — contrasting with earlier concerns that new AI models might disrupt software firms and limit returns on heavy data center spending.
Remarks from Richmond Fed President Tom Barkin also supported equities, as he noted uncertainty over whether automation would significantly raise unemployment and suggested AI could instead improve labor market efficiency.
Nvidia Little Changed Despite Strong Results
Nvidia reported better-than-expected earnings for the January quarter and issued revenue guidance above forecasts for the current period, yet its shares were mostly flat in after-hours trading.
Some investors questioned whether the chipmaker is returning sufficient capital to shareholders. Yvette Schmitter, CEO of Fusion Collective, pointed out that while Nvidia generated $35 billion in cash during the fourth quarter, it returned just 12% to shareholders — sharply lower than 52% a year earlier.
She also raised concerns about reduced buybacks despite record cash generation, especially as Nvidia highlights strong demand for its sold-out Ampere chips.
These concerns echoed questions raised during the company’s earnings call, including from a UBS analyst who asked whether Nvidia plans to distribute more of the anticipated $100 billion in cash expected this year. CFO Colette Kress emphasized ongoing investment in the broader AI ecosystem, while CEO Jensen Huang underscored AI’s foundational role in the future of computing.
Salesforce Drops on Soft Revenue Outlook
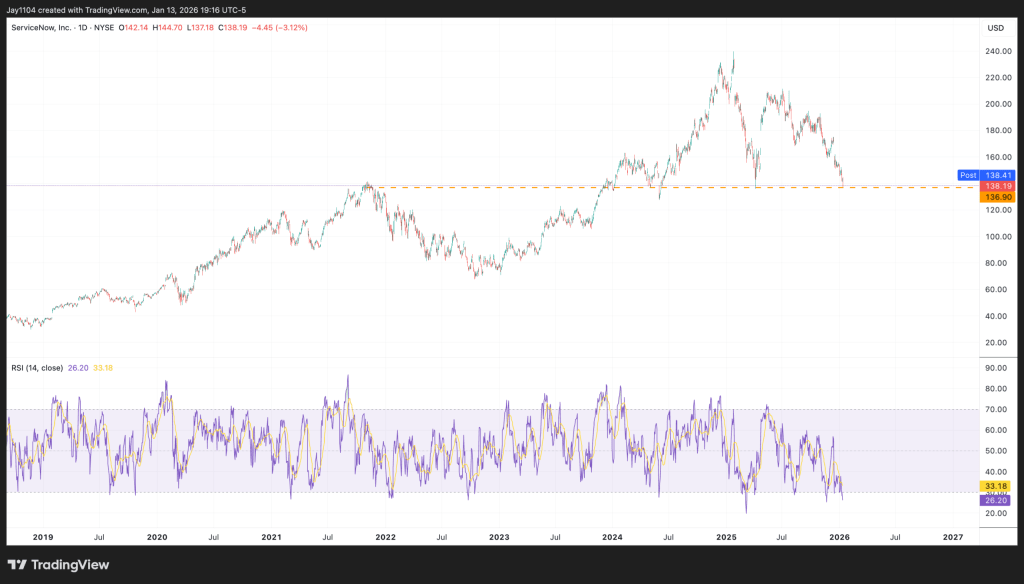
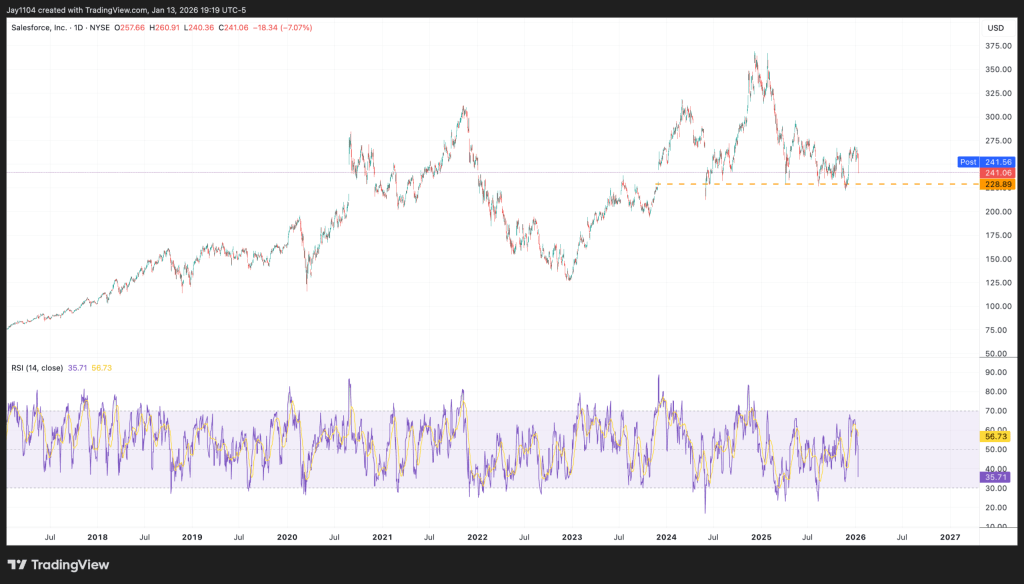
Salesforce shares fell in extended trading after the company issued fiscal 2027 revenue guidance below Wall Street expectations, suggesting softer demand for enterprise software amid economic uncertainty and tighter corporate budgets.
The company projected full-year revenue between $45.80 billion and $46.20 billion, slightly below consensus estimates at the midpoint.
Salesforce continues to invest heavily in artificial intelligence to counter investor concerns that emerging AI models, such as those developed by startups like Anthropic, could erode demand. These pressures have contributed to stock volatility as the company works to defend its position within the software-as-a-service industry.
However, Salesforce raised its fiscal 2030 revenue forecast to $63 billion from $60 billion, citing expected growth from agentic AI offerings. Analysts at Vital Knowledge described the report as not flawless but “good enough,” highlighting strong AI product momentum, stable core performance, and solid cash flow generation.
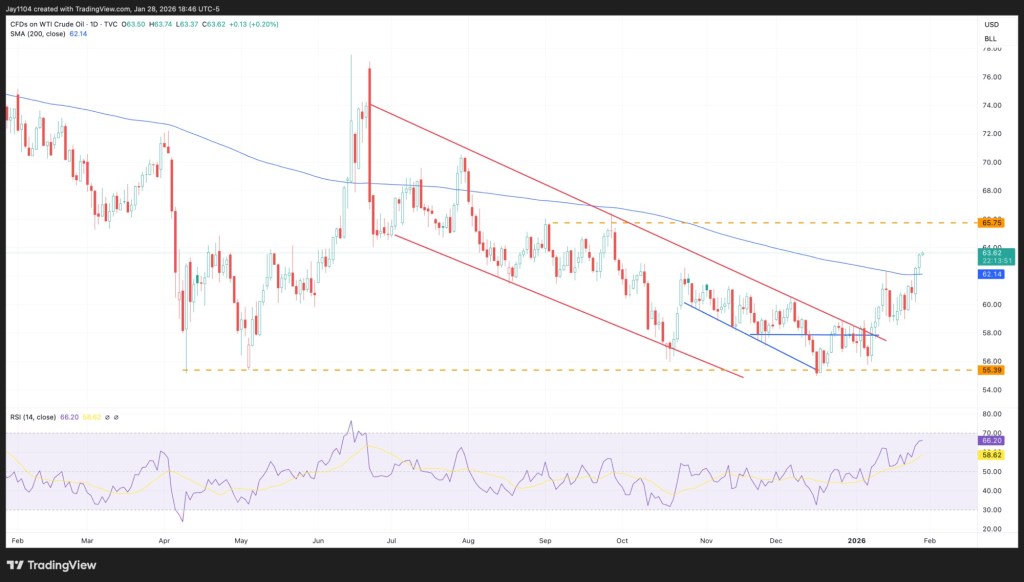
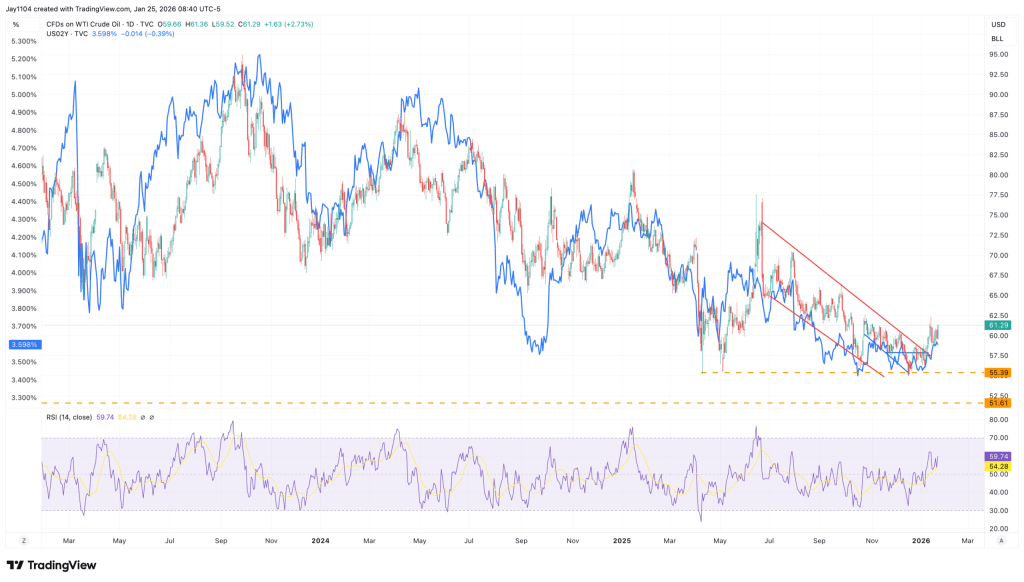
Oil Steady Before U.S.- Iran Talks
Oil prices were largely unchanged Thursday, remaining near seven-month highs as markets prepared for a third round of nuclear discussions between Washington and Tehran.
Brent crude gained 0.2% to $70.84 per barrel, while U.S. West Texas Intermediate rose 0.2% to $65.62 per barrel.
U.S. representatives, including special envoy Steve Witkoff and adviser Jared Kushner, are scheduled to meet Iranian officials in Geneva as negotiations continue over Iran’s nuclear program. President Donald Trump has warned that failure to make meaningful progress could lead to serious consequences, raising concerns that prolonged tensions may disrupt supply from Iran, a key OPEC producer.
Gold Edges Higher
Gold prices ticked up as uncertainty surrounding U.S. trade tariffs bolstered safe-haven demand, with investors also monitoring developments in the U.S.-Iran nuclear talks.
Spot gold rose 0.6% to $5,196.55 per ounce, while U.S. gold futures dipped 0.5% to $5,200.54 per ounce.
Markets are also evaluating the implications of newly announced U.S. tariffs following a Supreme Court ruling that struck down President Trump’s sweeping reciprocal tariff measures. Attention now turns to upcoming U.S. economic data, including weekly jobless claims. So far this year, gold has remained supported by geopolitical tensions, central bank buying, and portfolio diversification trends.
U.S. stock index futures edged higher on Monday night after growing uncertainty surrounding Donald Trump’s tariff policies and concerns about AI-related disruption in the software sector triggered steep losses on Wall Street.
Lingering unease over a potential U.S.-Iran conflict, along with caution ahead of this week’s closely watched earnings from NVIDIA Corporation (NASDAQ: NVDA), also kept sentiment restrained.
As of 19:30 ET (00:30 GMT), S&P 500 Futures were up less than 0.1% at 6,855.0 points. Nasdaq 100 Futures gained 0.1% to 24,781.0 points, while Dow Jones Futures added nearly 0.1% to 48,873.0 points.
FedEx sues U.S. government to recover tariff payments
FedEx Corporation (NYSE: FDX) filed a lawsuit against the U.S. government on Monday evening, seeking a “full refund” of emergency tariffs it paid over the past year.
The action comes only days after the Supreme Court of the United States ruled the levies illegal, with the tariffs scheduled to be lifted from midnight Tuesday.
FedEx is the first company to formally pursue reimbursement following the Court’s decision, joining a broader wave of firms mounting legal challenges against tariff measures introduced under Donald Trump.
However, the ruling did not clarify how the more than $160 billion in revenue already collected from the invalidated tariffs will be handled.
Wall Street battered by tariff uncertainty and AI concerns
Wall Street’s major indexes each dropped more than 1% on Monday as uncertainty surrounding Donald Trump’s tariff policies and mounting concerns about artificial intelligence disrupting the software industry kept investors in a risk-off mood.
Technology sentiment remained fragile ahead of quarterly results from NVIDIA Corporation (NASDAQ: NVDA), scheduled for Wednesday. Widely viewed as a key gauge of AI demand, the world’s most valuable company is expected to post robust earnings growth compared with last year.
Markets also grappled with renewed tariff worries after Trump unveiled a 15% universal tariff under a different legal authority. A report from The Wall Street Journal indicated the administration is considering additional levies on at least six more sectors.
The president appeared to double down on his trade agenda, even as several countries that recently reached agreements with Washington sought greater clarity on the scope and implementation of the tariffs. He also cautioned that nations retreating from newly negotiated trade deals could face steeper duties.
The S&P 500 declined 1%, while the NASDAQ Composite fell 1.1%. The Dow Jones Industrial Average led losses, tumbling 1.7%.
Technology stocks continued to lag, with software names hit by renewed selling pressure amid rising anxiety over AI-driven disruption. Part of the concern stemmed from a speculative note by Citrini Research envisioning a June 2028 scenario in which rapid AI adoption leads to widespread displacement of white-collar jobs.
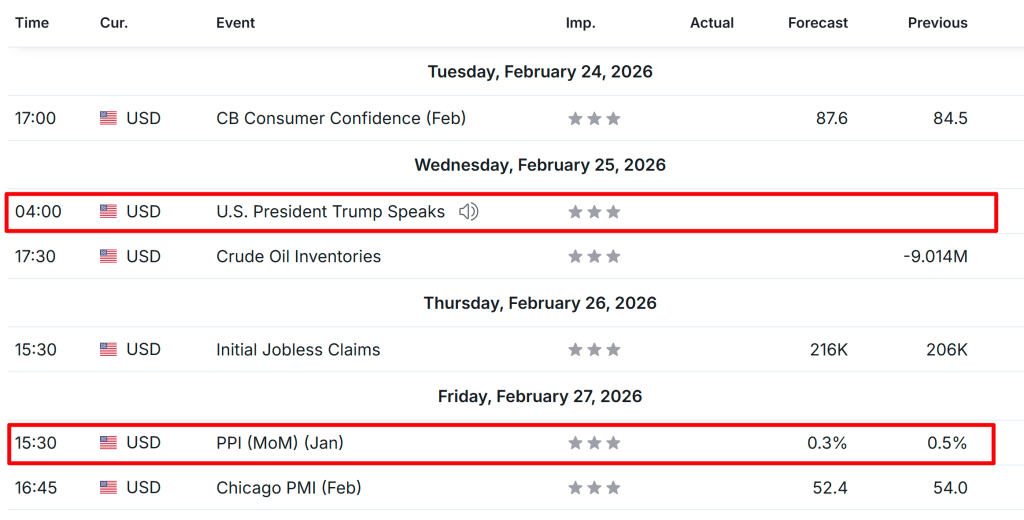
U.S. PPI inflation data and Nvidia’s earnings will take center stage in the coming week.
Nvidia appears set to post another standout quarter.
Meanwhile, Intuit is confronting mounting fundamental and technical pressures ahead of its results.
U.S. equities closed higher on Friday after the Supreme Court invalidated President Donald Trump’s tariffs. Trump criticized the decision as a “disgrace” and said in a Truth Social post on Saturday that he would introduce a new 15% global tariff, just one day after announcing a 10% levy.
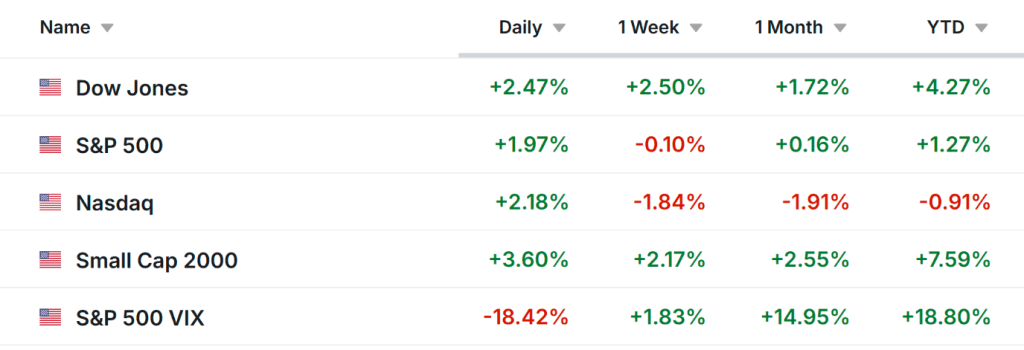
After Friday’s gains, the 30-stock Dow Jones Industrial Average finished the week up about 0.3%. The S&P 500 advanced 1.1%, while the tech-heavy Nasdaq Composite broke a five-week slide with a 1.5% surge. The small-cap Russell 2000 added nearly 0.7%.
Markets may see heightened swings in the days ahead as investors weigh prospects for growth, inflation, interest rates, and corporate earnings against a backdrop of renewed trade frictions.
With a relatively light economic calendar, attention will center on Friday’s January U.S. producer price index report. As of Sunday morning, traders are pricing in slightly better than even odds that the Federal Reserve will lower rates by its June meeting.
On the earnings front, Nvidia’s (NASDAQ: NVDA) report will headline the week as the season winds down. Beyond Nvidia, investors will be tracking several major tech names, particularly software companies facing pressure from concerns that AI could disrupt their core businesses, including Salesforce (NYSE: CRM), Intuit (NASDAQ: INTU), Snowflake (NYSE: SNOW), Zscaler (NASDAQ: ZS), and Zoom Video Communications (NASDAQ: ZM).
AI infrastructure providers Dell Technologies (NYSE: DELL) and CoreWeave (NASDAQ: CRWV) are also set to post results. Outside the tech space, prominent retailers such as Home Depot (NYSE: HD), Lowe’s Companies (NYSE: LOW), and TJX Companies (NYSE: TJX) are scheduled to report.
At the same time, markets will be parsing President Trump’s State of the Union address on Tuesday and monitoring any developments involving the U.S. and Iran.
No matter which way markets move, below I outline one stock that could attract buying interest and another that may face renewed downside pressure. Keep in mind, this outlook covers only the week ahead—Monday, February 23 through Friday, February 27.
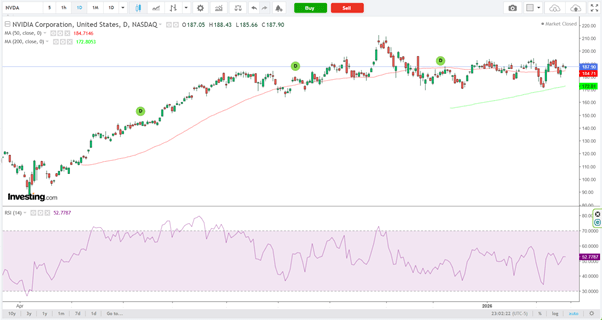
Stock to Buy: Nvidia
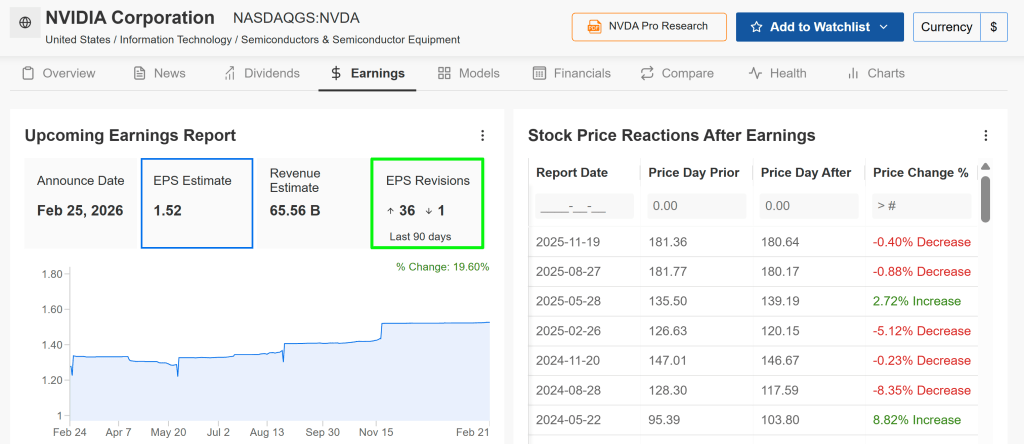
Nvidia heads into its earnings report with analysts anticipating another “beat-and-raise” performance, fueled by robust demand for AI infrastructure. Fourth-quarter results are scheduled for release after Wednesday’s market close at 4:20 p.m. ET, followed by a 5:00 p.m. ET conference call with CEO Jensen Huang.
According to an InvestingPro survey, profit forecasts have been lifted 36 times in recent weeks, compared with just one downward revision—highlighting growing optimism around Nvidia’s earnings outlook. In the options market, traders are pricing in a potential move of roughly ±6% in NVDA shares following the announcement.
Wall Street expects the AI powerhouse to deliver earnings of $1.52 per share, up 71% from a year earlier. Revenue is forecast to climb 67% to $65.6 billion, underscoring the company’s ongoing strength in the AI chip space.
Citi recently suggested that January-quarter revenue could exceed $67 billion, with projections pointing to even stronger results in the April quarter.
Another solid showing in data-center sales, along with widening margins and healthy free cash flow, would bolster the view that Nvidia remains firmly in the midst—not at the tail end—of an AI supercycle.
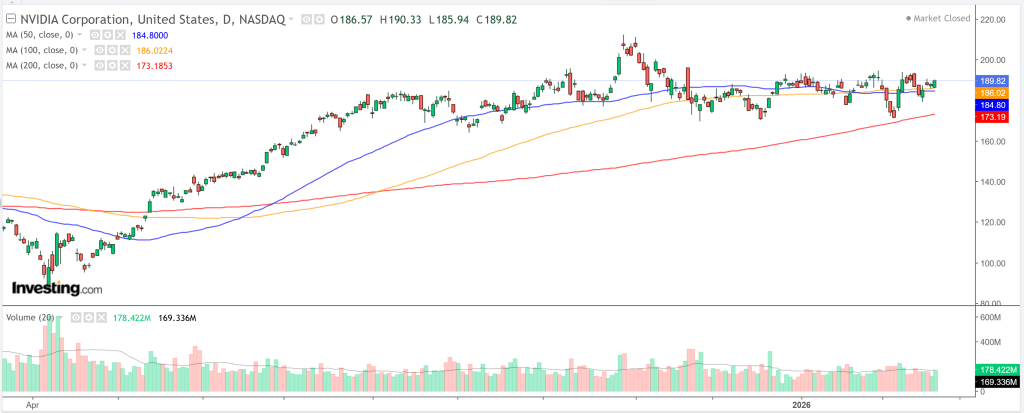
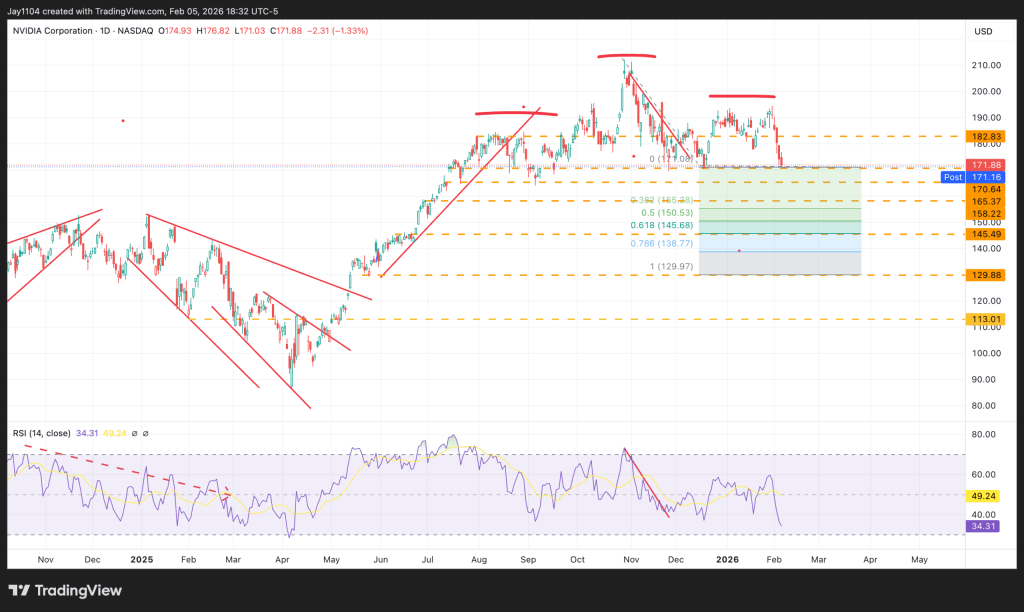
NVDA shares ended Friday at $189.82, consolidating after a strong advance but still positioned to move higher on favorable catalysts. Across multiple timeframes—from intraday charts to the monthly view—technical indicators and moving averages continue to signal a “strong buy.”
A beat-and-raise report could ignite another leg up, particularly if management emphasizes longer-term visibility into 2026–2027 growth driven by next-generation architectures such as Rubin.
Trade Setup:
Entry: Near current levels (around $190)
Target: $210 (approximately 10% upside)
Stop-Loss: $184 (roughly 3.5% downside risk)
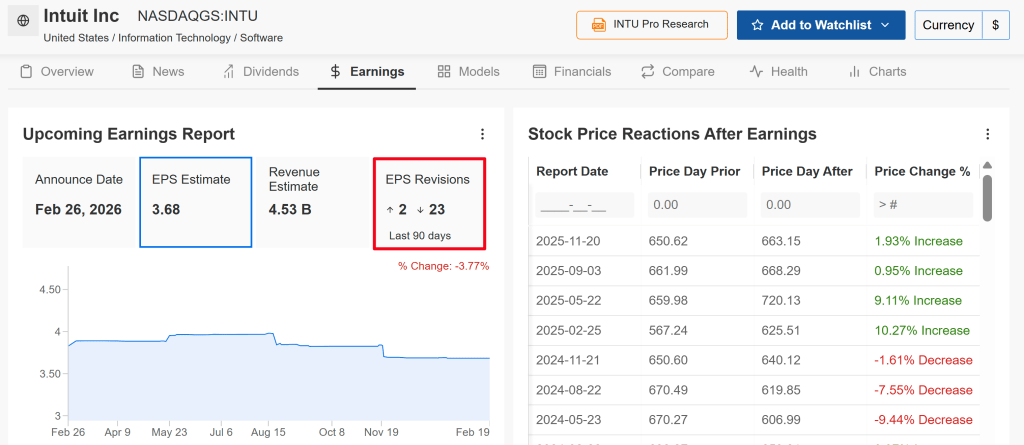
Stock to Sell: Intuit
Intuit—the parent company of TurboTax, QuickBooks, Credit Karma, and Mailchimp—heads into earnings week facing mounting pressure. Concerns have escalated in early 2026 that generative AI tools could weaken its competitive moat across tax prep, accounting, and financial software by enabling free or lower-cost alternatives, custom AI agents, or in-house solutions for small businesses and consumers.
This anxiety has fueled broader “SaaSpocalypse” sentiment, with the software sector shedding trillions in market value. INTU shares have been particularly hard hit in recent months, sliding sharply alongside peers such as Salesforce.
Analyst sentiment has also turned more cautious ahead of the report, with 23 of the last 25 estimate revisions moving lower—signaling growing skepticism around near-term performance.
Wall Street expects Intuit to post earnings of $3.68 per share, up roughly 11% year over year, on revenue of about $4.5 billion. The bigger concern, however, centers less on the headline numbers and more on the narrative surrounding AI-driven disruption.
Although Intuit has made significant investments in artificial intelligence, investors seem to view these efforts as largely defensive—designed to protect its existing franchises rather than meaningfully expand them or counter broader competitive threats. TD Cowen recently cut its price target, pointing to doubts about the strength of Intuit’s AI strategy and intensifying competition.
Any remarks about rising competitive pressures, decelerating growth in key segments, or conservative forward guidance could amplify downside risks—particularly in a stock that may be technically oversold but remains vulnerable in a sentiment-driven market.
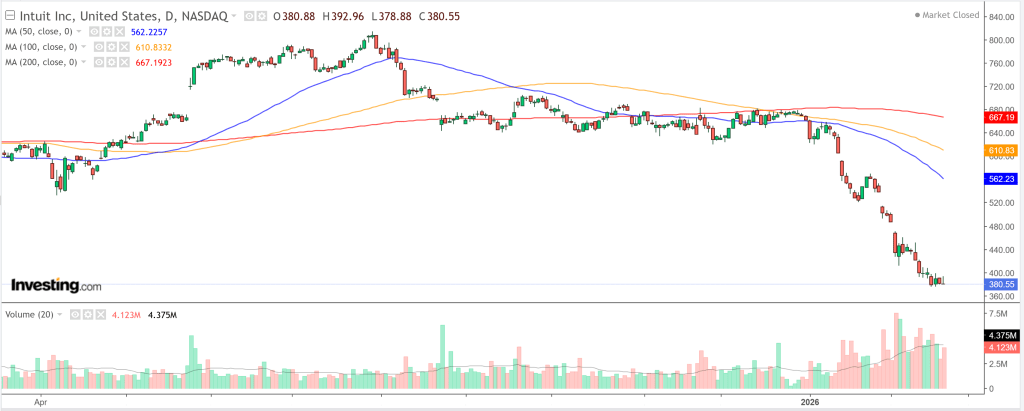
Shares of Intuit have fallen 42.5% over the past three months and are now hovering just above their 52-week low of $375.40. Technical signals remain decisively negative: across timeframes—from hourly charts to the monthly view—both moving averages and momentum indicators continue to flash “strong sell.”
With management’s outlook likely to face intense scrutiny, any earnings miss or cautious commentary reflecting a more competitive, AI-driven environment could deepen the selloff.
The artificial intelligence trade faces its biggest test of the year this week as three cornerstone companies in the AI infrastructure ecosystem prepare to deliver quarterly earnings. With tech stocks showing signs of fatigue, investors want more than simple earnings beats. They’re looking for proof that heavy capital expenditure is translating into the successful deployment of next-generation hardware. All attention will turn to the after-market close (AMC) on Wednesday and Thursday to see whether the AI rally still has momentum.
NVIDIA: The undisputed AI infrastructure leader
NVIDIA (NVDA) is set to report fiscal Q4 2026 results on Wednesday, Feb. 25, after market close. As the dominant supplier of GPUs powering large language models, NVIDIA remains the clearest gauge of the AI trade’s health. Wall Street is anticipating a “beat and raise,” with consensus revenue estimates around $65.6 billion — an impressive 67% year-over-year increase.
Investors are especially focused on the production ramp of its Blackwell architecture chips. Any updates on supply chain constraints or the development timeline for the upcoming Rubin platform could influence not only tech stocks but the broader S&P 500. Options markets imply a potential 6.5% swing in either direction, making NVIDIA’s earnings the week’s must-watch event for global investors.
Hardware and cloud players: CoreWeave and Dell under the spotlight
On Thursday, Feb. 26, AMC, attention shifts to the physical backbone of AI infrastructure. CoreWeave (CRWV), a specialized cloud provider and key NVIDIA partner, will report against high expectations driven by its sizable revenue backlog. Analysts project Q4 revenue of roughly $1.53 billion, but the more significant figure is its $56 billion backlog — a forward-looking signal of how much computing capacity AI firms and tech giants are securing
Also reporting Thursday is Dell Technologies (DELL), which has repositioned itself as a major supplier of AI-optimized servers. Consensus forecasts call for earnings of $3.53 per share on $31.6 billion in revenue. Dell recently earned a spot on Evercore’s “Tactical Outperform” list, supported by a sharp rise in AI server orders and an $18.4 billion backlog exiting last quarter. The key question for Dell will be whether it can preserve margins while rapidly scaling production to meet surging demand for AI infrastructure.
After a powerful rally in large-cap technology shares, investors are once again asking whether smart money is beginning to rotate.
With AI enthusiasm pushing tech valuations higher and energy names still trading at comparatively modest multiples, there are early signs that capital flows may be shifting beneath the surface. Here’s a closer look at the current landscape — and where institutional positioning may be headed.
The Case for Tech: Structural Growth Still Intact
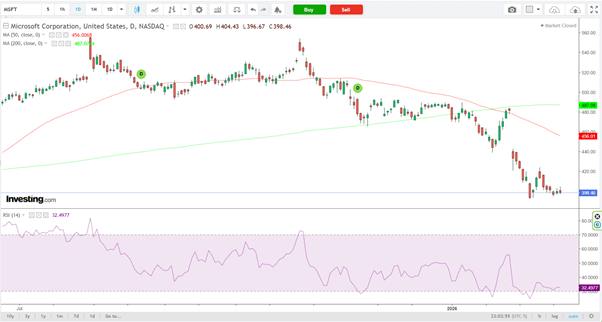
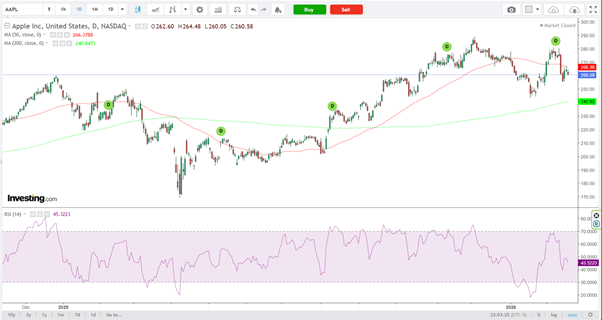
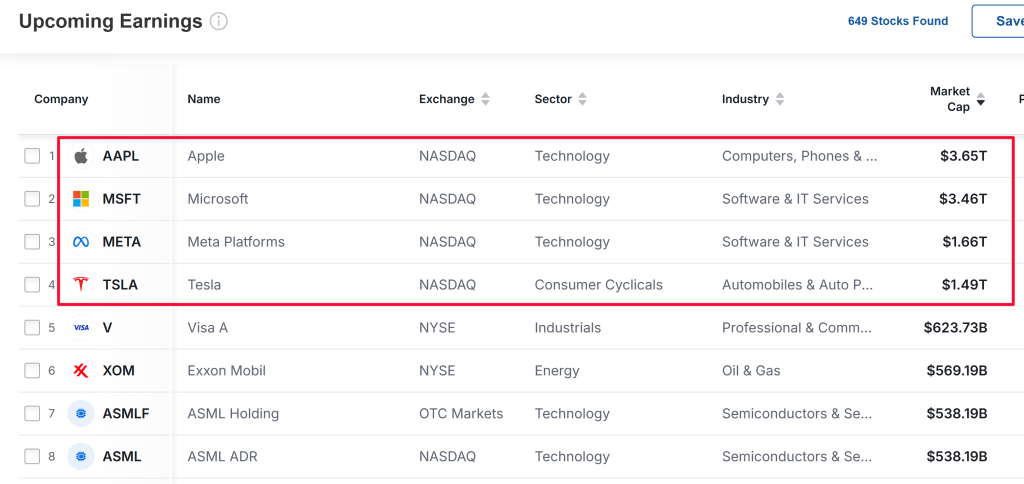
Companies such as Nvidia (NASDAQ: NVDA), Microsoft (NASDAQ: MSFT), and Apple (NASDAQ: AAPL) remain central pillars of institutional portfolios.
Technology continues to lead in earnings expansion, fueled by AI infrastructure investment, cloud migration, and ongoing software monetization.
Why capital is still favoring tech:
Revenue growth outpacing the broader market
High operating margins and robust free cash flow
Sustained AI-driven capex cycles
Strong balance sheets with significant liquidity
Mega-cap tech remains a structural core holding for institutional investors. Even during brief pullbacks, dip-buying has been persistent — a sign that long-term conviction in the sector remains strong.
That said, valuations in select segments have stretched beyond historical norms. If earnings momentum moderates, the probability of sector rotation increases, particularly as investors reassess risk-reward at elevated multiples.
The Case for Energy: Undervalued and Cash-Generative
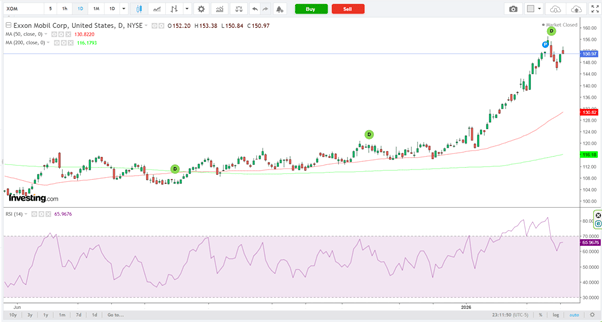
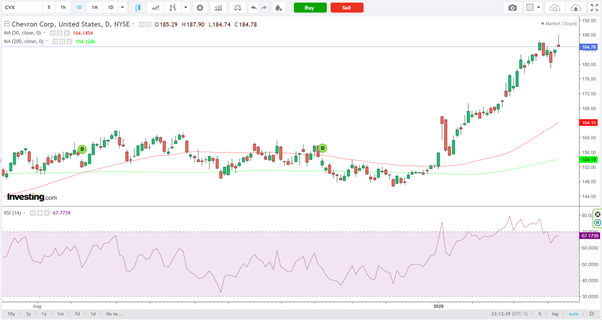
Integrated majors such as Exxon Mobil (NYSE: XOM) and Chevron (NYSE: CVX) are drawing renewed attention as investors reassess sector allocations.
Energy equities typically trade in cycles influenced by crude prices, global demand dynamics, and geopolitical developments. After extended periods of relative underperformance, the sector often becomes a magnet for value-oriented capital.
Why institutional money may rotate toward energy:
Lower forward P/E multiples compared to technology
Strong and visible free cash flow generation
Dividend yields frequently above the broader market average
Ongoing share repurchase programs
If crude prices remain stable or trend higher, integrated oil majors can produce substantial cash flows, offering a mix of income, capital return, and relative defensiveness.
In an environment where parts of the technology sector appear valuation-stretched, energy provides a compelling contrast on both multiples and yield.
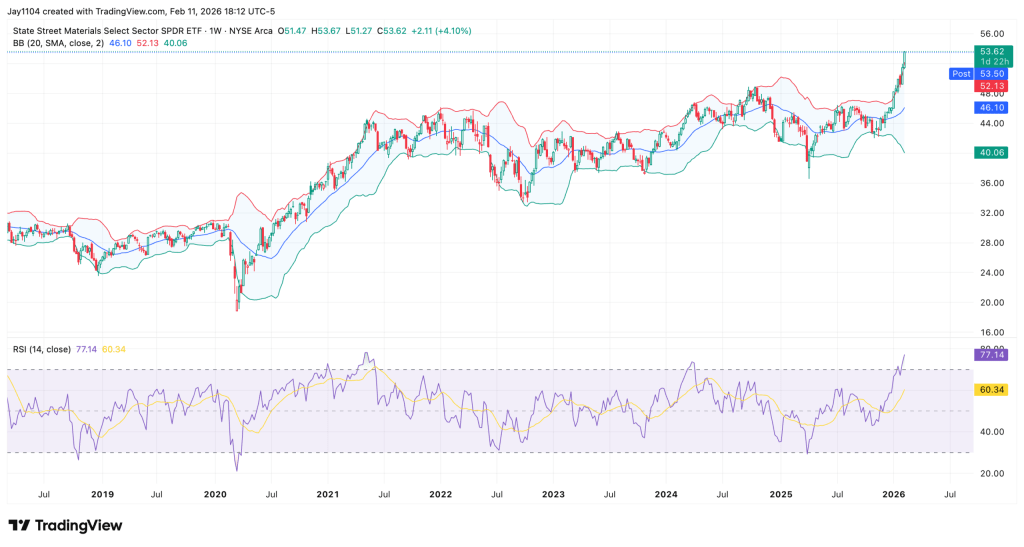
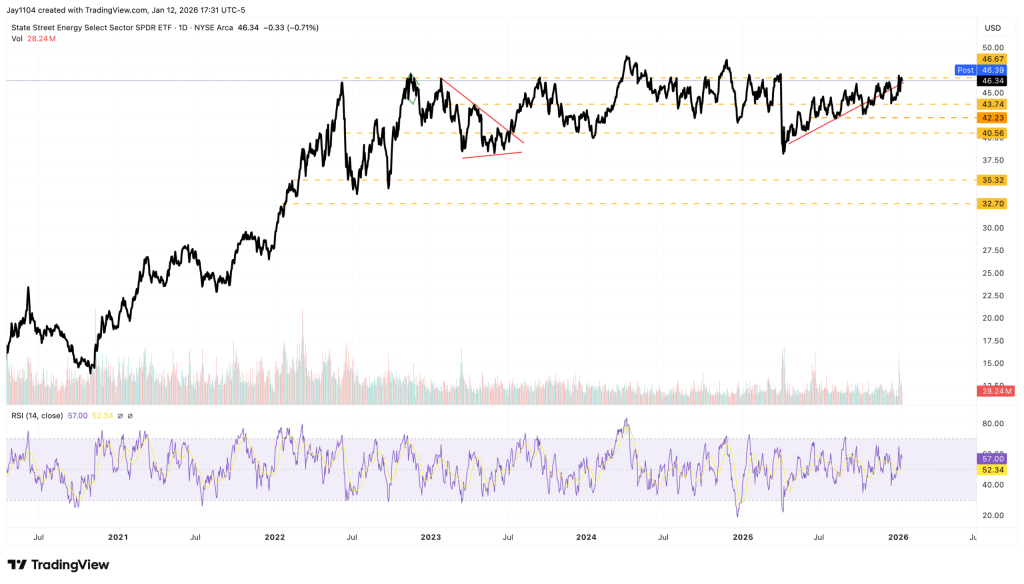
Sector ETF Signals: Tracking Institutional Flows
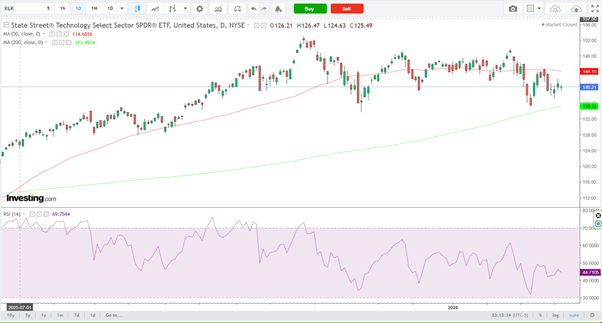
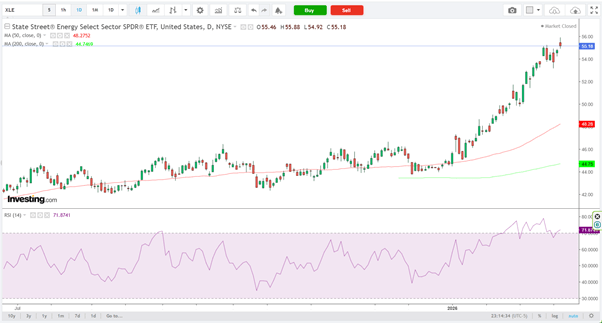
Sector ETFs can offer valuable insight into how institutional capital is rotating beneath the surface. Two key vehicles to monitor are the Technology Select Sector SPDR Fund (NYSE: XLK) and the Energy Select Sector SPDR Fund (NYSE: XLE).
ETF performance and fund flow data often act as real-time indicators of positioning shifts:
If XLK continues to outperform, it suggests growth leadership remains firmly in place.
If XLE begins to show sustained relative strength versus XLK, it may signal that rotation into energy is gaining traction.
Historically, sector leadership transitions tend to coincide with:
Shifts in interest rate expectations
Narrowing earnings growth differentials
Sharp moves in commodity prices
Monitoring the relative strength ratio between XLE and XLK can provide early confirmation of whether capital is merely rebalancing tactically — or whether a broader structural rotation is unfolding.
Macro Forces Driving Sector Rotation
1. Interest Rates Elevated yields tend to weigh more heavily on high-multiple technology stocks, as future cash flows are discounted at higher rates. In contrast, energy companies—often valued on nearer-term cash generation—can prove more resilient. If bond yields move higher, defensive value sectors may attract incremental capital at the expense of growth.
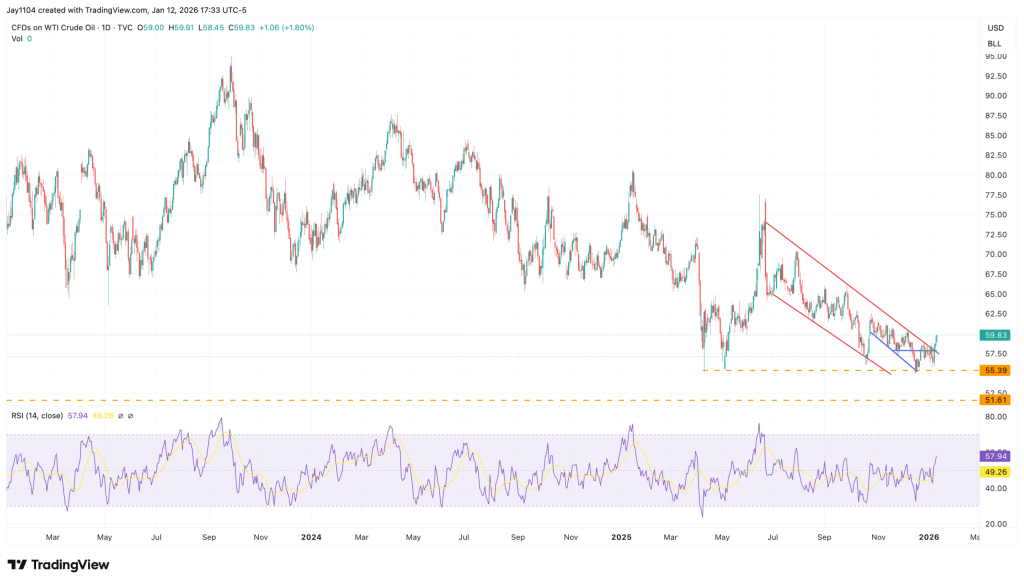
2. Commodity Prices Oil prices remain a primary earnings driver for energy producers. A sustained rally in crude can rapidly alter sector performance dynamics, drawing capital into integrated majors and upstream names as profit expectations improve.
3. Earnings Revisions Institutional allocation models closely track forward earnings revisions. If analyst upgrades begin to slow in technology while turning more constructive for energy, portfolio rebalancing flows may follow.
4. Risk Appetite Technology typically outperforms in strong risk-on environments characterized by abundant liquidity and growth optimism. Energy, by contrast, can gain relative strength during inflationary phases or periods of geopolitical tension, when commodity exposure and cash yield become more attractive.
What Institutional Capital Is Likely Doing Now
Rather than making an outright “either/or” shift, institutional investors typically adjust exposure more subtly. That can mean trimming extended technology positions, selectively adding energy holdings, or rotating within sectors—such as moving from mega-cap AI leaders into second-tier beneficiaries of the theme.
The real driver is relative earnings momentum, not headlines.
Which Sector Offers More Upside?
Tech Upside Scenario
Continued acceleration in AI-related spending
Consistent earnings beats from mega-cap leaders
Declining bond yields that support higher valuation multiples
Energy Upside Scenario
Oil prices establish a sustained uptrend
Inflation concerns re-emerge
Technology valuations compress
In the near term, technology remains the structural growth narrative, supported by AI infrastructure, cloud expansion, and software monetization. However, energy presents potential asymmetric upside if commodity dynamics shift in its favor.
Sector rotation is rarely abrupt. More often, it unfolds gradually through portfolio rebalancing rather than wholesale liquidation.
While tech continues to dominate leadership, energy’s relative valuation discount and strong cash generation could attract incremental capital if macro conditions evolve.
Key indicators to monitor:
Relative strength between the Energy Select Sector SPDR Fund and the Technology Select Sector SPDR Fund
Forward earnings revisions
Oil price trends
Bond yield movements
The critical question is not whether rotation will occur — but whether it is already quietly underway beneath the surface.
Volatility in the S&P 500 has led to repeated swings without the steady upward momentum that characterized much of late 2025. With concerns about a potential correction—such as the bursting of an AI-driven bubble—investors may look toward more defensive options like dividend-paying stocks.
That said, dividend investing spans a wide spectrum. While many gravitate toward globally recognized, ultra-stable companies favored by figures like Warren Buffett, lesser-known firms can sometimes offer both dependable income and greater growth potential. Three under-the-radar dividend payers worth noting are Hancock Whitney Corp., NewMarket Corp., and Horace Mann Educators Corp..
A Well-Capitalized Southern Bank Gaining Momentum
Hancock Whitney Corp. is a bank holding company best known in the Gulf South. Through Hancock Whitney Bank, it provides commercial and retail banking along with wealth management services.
The company offers a solid 2.53% dividend yield and maintains a conservative payout ratio of 31.7%. In Q4 2025, earnings per share narrowly exceeded expectations by one cent, though revenue fell short.
Looking ahead to 2026, several factors strengthen its outlook. The company recently completed a bond portfolio restructuring expected to lift net interest margin by about 7 basis points and boost annual EPS by roughly $0.23. Loan growth is improving, and a strong capital position supported share buybacks totaling about 3% of outstanding shares in Q4 alone. That same capital base reinforces dividend sustainability, making it appealing for risk-conscious investors.
NewMarket: Resilient Income Despite Market Pressures
NewMarket Corp., a specialty chemicals company focused on lubricants and petroleum additives, has seen its shares decline roughly 14% year to date following its latest earnings release.
Lower net income and EPS in 2025—largely due to a higher effective tax rate—pressured results, while fourth-quarter petroleum additive shipments fell about 6% year over year amid softer demand.
However, its specialty materials division has performed strongly, bolstered by the October acquisition of aerospace propellant firm Calca. The company plans to invest $1 billion to expand this segment further in 2026.
Despite a Wall Street “Hold” rating, NewMarket continues generating strong cash flow. Last quarter alone, it returned $183 million to shareholders through dividends and buybacks. The stock yields 2.01%, carries a payout ratio just over 27%, and has consistently raised its dividend over multiple years.
Horace Mann’s Broad Strength Supports Its Dividend
Horace Mann Educators Corp., which provides retirement, property, and casualty insurance products tailored to U.S. school employees, has posted several strong quarters.
Its latest results included a 3-cent EPS beat and record full-year EPS of $4.71. Forecasts for 2026 align with the company’s 10% compound annual growth target.
Much of this improvement stems from its property and casualty segment, where both the combined ratio and core earnings improved significantly—more than doubling last year. Growth in individual supplemental and group sales has further diversified the business.
An early retirement initiative is expected to generate $10 million in annual savings, helping the company reduce its expense ratio by 100–150 basis points over the next three years. This should enhance cash flow for additional buybacks—after $21 million in repurchases in 2025—and continued dividend support. The stock currently offers a 3.25% yield with a 35.9% payout ratio.
In a market environment marked by uneven performance, these lesser-known dividend stocks combine income stability with strategic growth initiatives, making them compelling options for investors navigating potential turbulence in 2026.
U.S. stock index futures were largely unchanged Wednesday night after the minutes from the Federal Reserve’s January meeting delivered mixed signals on interest rates, adding to uncertainty about the longer-term policy path.
Investors are now turning their attention to upcoming earnings from retail heavyweight Walmart Inc (NYSE:WMT) for fresh insight into the health of the U.S. economy.
Markets were also pressured by rising geopolitical tensions involving Iran, as reports pointed to a stronger U.S. military presence in the Middle East despite continued talks between Tehran and Washington.
As of 20:00 ET (01:00 GMT), S&P 500 Futures dipped slightly to 6,892.0, Nasdaq 100 Futures edged down nearly 0.1% to 24,942.75, and Dow Jones Futures slipped 0.1% to 49,685.0.
Futures held steady after Wall Street posted gains in the regular session, driven mainly by an ongoing rebound in technology stocks and data showing resilience in the U.S. economy. However, caution surrounding the Fed’s outlook kept major indexes below their intraday peaks.
Fed minutes reveal divisions on inflation and rates
Minutes from the Fed’s January meeting showed officials unanimously agreed to keep interest rates steady at 3.50%–3.75%. Still, policymakers appeared divided over the next move. Several members warned that inflation could take longer than expected to return to the central bank’s 2% target.
A number of officials also suggested that rate hikes could be considered if inflation remains elevated for an extended period — a tone that contrasts with market expectations for further easing this year.
Artificial intelligence emerged as a key area of debate, with officials split on whether the rapidly expanding sector will ultimately fuel inflation or help contain it.
Walmart earnings in focus
Walmart Inc (NYSE:WMT) is scheduled to report fourth-quarter results on Thursday, with particular attention on its 2026 outlook, which may offer broader clues about U.S. consumer strength.
According to Investing.com data, Walmart is expected to post earnings per share of $0.7269 on revenue of $190.4 billion.
As the world’s largest retailer by valuation and a widely followed barometer of U.S. consumer spending, Walmart’s results come at a time when sticky inflation is showing signs of straining retail demand.
Also due Thursday are U.S. December trade data and weekly jobless claims.
Wall Street gains led by tech rebound
Wall Street ended higher on Wednesday, led by technology stocks as the sector extended its recovery from recent declines.
Still, both major indexes and tech shares retreated from session highs amid lingering concerns about the impact of artificial intelligence. Worries over AI-driven disruption have recently weighed on software and logistics companies, while concerns about heavy AI-related capital spending have pressured firms exposed to data centers.
The S&P 500 rose 0.6% to 6,881.32, the NASDAQ Composite gained 0.8% to 22,753.64, and the Dow Jones Industrial Average added 0.3% to 49,662.66.
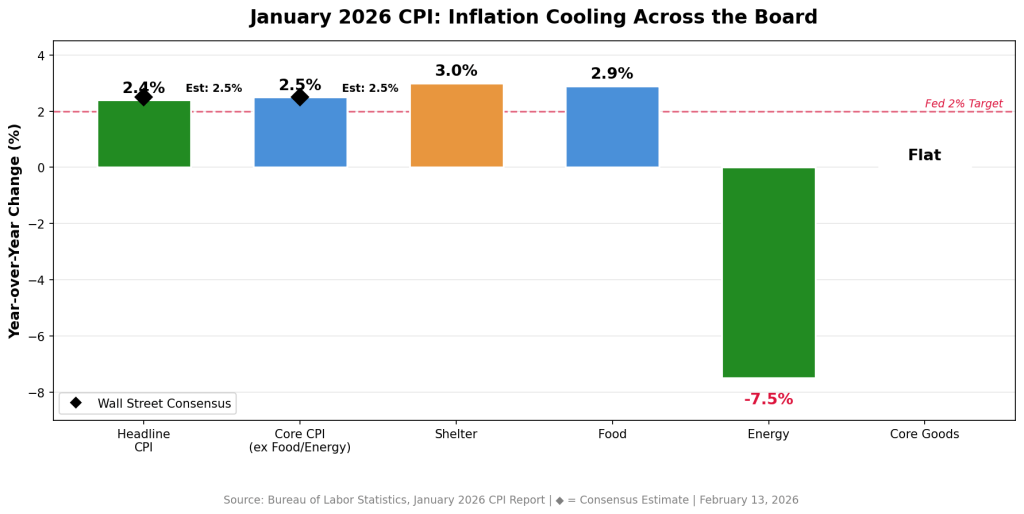
The inflation print investors had been bracing for came in cooler than expected.
Friday’s January CPI showed headline inflation at 2.4%—below the 2.5% consensus forecast and the lowest annual reading since May 2025. Core CPI, which excludes food and energy, eased to 2.5%, marking its softest level since April 2021. On a monthly basis, prices rose just 0.2%, the smallest increase since July.
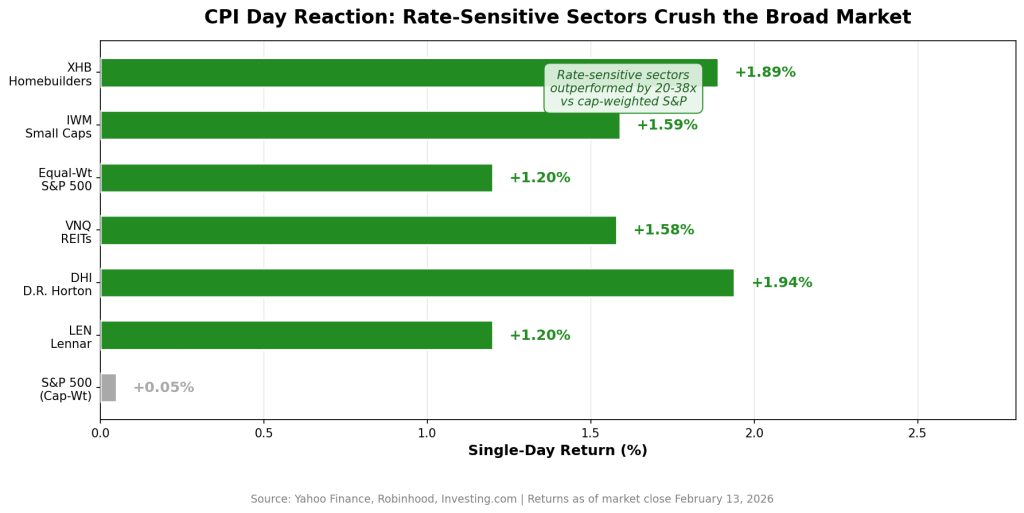
Markets reacted swiftly. Homebuilder stocks rallied sharply, small caps climbed 1.2%, and the 10-year Treasury yield slid to its lowest point since early December.
My takeaway: the market may have just received the confirmation it was waiting for. And the most compelling opportunities from here likely aren’t the mega-cap tech leaders that have dominated performance, but rather rate-sensitive sectors that were punished under the “higher for longer” narrative and are now repricing for a potentially different 2026 backdrop.
What the CPI Report Really Signals
Shelter—by far the largest CPI component and the category that has stubbornly kept headline inflation elevated—rose only 0.2% in January, bringing the annual rate down to 3%. That’s a notable slowdown and perhaps the clearest indication yet that the housing inflation lag is beginning to unwind.
Energy prices declined 1.5%, with gasoline tumbling 3.2% during the month. Food inflation held at 2.9% year over year—still somewhat elevated, but not alarming. Importantly, core goods prices were flat, helping to counter concerns that renewed tariffs would reignite goods inflation.
“Headline CPI inflation was a touch softer than expected in January, delivering a welcome surprise to the downside at the beginning of the year,” said Bernard Yaros, lead economist at Oxford Economics. He added that tariff-related price pressures “are largely behind us.”
Lindsay Rosner of Goldman Sachs Asset Management was even more direct: “Trust the groundhog. The Fed’s path to normalization cuts appears clearer now.”
The timing is critical. A stronger-than-expected January jobs report—130,000 payrolls versus forecasts of 55,000—had pushed expectations for rate cuts further out, likely into the summer. This softer CPI reading shifts that outlook. Economists surveyed by Bloomberg now anticipate as much as 100 basis points of easing this year, with the first cut potentially arriving in June—or even March if disinflation continues.
Why Rate-Sensitive Stocks Stand Out
One key dynamic investors often overlook is that by the time the Federal Reserve actually begins cutting rates, much of the upside in rate-sensitive sectors has already played out. Markets tend to price in policy shifts well in advance.
Friday’s CPI data appeared to give institutional investors the confidence to begin reallocating toward sectors poised to benefit from lower yields. The equal-weight version of the S&P 500 and the Russell 2000 both climbed 1.2%, notably outperforming the traditional cap-weighted S&P 500, which was little changed.
That divergence is often viewed as a textbook signal of sector rotation—away from mega-cap dominance and toward more rate-sensitive, economically cyclical areas of the market.
Capital is rotating down the market-cap ladder and into economically sensitive groups. Three segments stand out most clearly: homebuilders, REITs, and small caps.
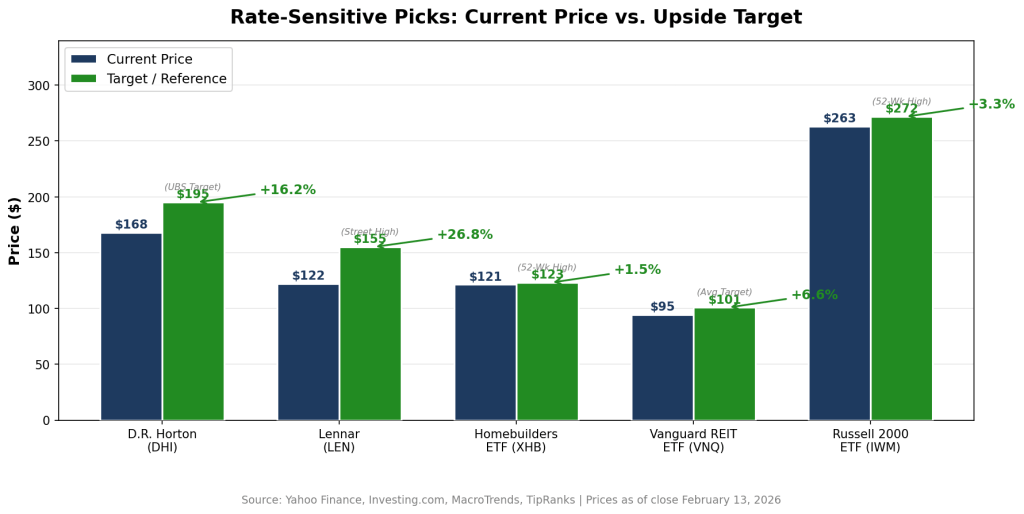
How to Position
D.R. Horton (DHI)
Closing Friday at $167.78, DHI is arguably the purest expression of the housing-affordability theme. The largest U.S. homebuilder by volume posted solid fiscal Q1 results in January, with revenue of $6.89 billion (ahead of $6.59 billion estimates) and EPS of $2.03 (vs. $1.93 expected).
At roughly 15.3x trailing earnings, the stock trades at a notable discount to the broader market. Beyond the rate backdrop, there’s also a policy angle: the Trump administration’s reported “Trump Homes” initiative has involved direct engagement with builders around affordability measures—potentially creating a dual tailwind of lower mortgage rates and regulatory support.
The median analyst price target is $170, with UBS as high as $195—suggesting upside potential of roughly 16%.
Lennar (LEN)
Trading at $122.28, Lennar offers a slightly different profile as the second-largest U.S. builder. Its “land-light” model—optioning land instead of holding it outright—reduces balance-sheet risk and positions it well for a rate-cutting cycle.
The stock has rebounded about 40% from its April 2025 lows but remains below its 2024 peak. With fiscal Q1 earnings due in late March, improving mortgage application trends could serve as a near-term catalyst if rates continue to ease.
SPDR S&P Homebuilders ETF (XHB)
At $121.36, XHB is up nearly 18% year-to-date and recently marked a fresh 52-week high of $123.13. As an equal-weighted ETF, it offers diversified exposure across the housing ecosystem—not just large builders, but also building products manufacturers, home improvement retailers, and construction suppliers.
For investors who prefer sector exposure over single-stock risk, XHB provides a balanced approach.
Vanguard Real Estate ETF (VNQ)
Trading near $94.59—close to its 52-week high—VNQ provides broad exposure to the REIT space, one of the most rate-sensitive areas of the market. The ETF holds over 150 REITs across healthcare, industrial, data center, and retail subsectors.
Its largest holdings include Welltower, Prologis, and American Tower.
With an average analyst target near $100.81, implied upside sits around 8%, in addition to a dividend yield of roughly 3.6%. After significant underperformance during the rate-hiking cycle, REITs are positioned to benefit mechanically as yields decline.
iShares Russell 2000 ETF (IWM)
At approximately $263, IWM tracks small-cap equities—arguably the most interest-rate-sensitive segment of the equity market. Smaller firms tend to carry more floating-rate debt and are disproportionately affected by elevated borrowing costs. That dynamic can reverse sharply when policy eases.
IWM surged 1.6% on Friday’s CPI release alone. With its 52-week high of $271.60 within reach, sustained rate declines could drive a prolonged catch-up rally in small caps.
The Big Picture
If inflation continues to moderate and rate-cut expectations firm, the leadership baton may continue shifting away from mega-cap growth and toward housing, real estate, and smaller domestically oriented companies. Markets typically front-run the policy cycle—and this rotation suggests that repositioning may already be underway.
The Bear Case (and Why It May Be Overstated)
There are valid reasons for caution. Fox Business pointed out that January’s CPI could carry a downward bias tied to last fall’s government shutdown. During that period, the Bureau of Labor Statistics missed portions of October data collection and relied on a “carry-forward” methodology that may influence inflation readings into spring 2026. In short, the 2.4% headline figure could be somewhat understated.
There’s also the Federal Reserve itself. Policymakers are not signaling urgency. Oxford Economics continues to project cuts in June and December rather than March. Meanwhile, although the labor market is cooling—annual benchmark revisions show 2025 job growth was the weakest since 2003 outside recessionary periods—it is far from collapsing. Jerome Powell has consistently emphasized the need for a sustained disinflation trend, not a single favorable report.
The Counterargument
Even if the Fed waits until June, markets won’t. Yields have already declined meaningfully. Mortgage rates are edging lower. And sectors that trade on rate expectations—rather than the actual fed funds rate—are beginning to reprice now. By the time the first official cut arrives, much of the move in rate-sensitive equities could already be behind us.
What to Watch
Three near-term catalysts will likely shape the next phase:
Fed Minutes (Feb. 18): The release of the latest policy meeting minutes could shift expectations quickly. Any dovish commentary on inflation progress or labor-market softness may pull forward rate-cut pricing.
Walmart Q4 Earnings (Feb. 19): As the largest U.S. retailer—now with a market cap above $1 trillion and up 13% year-to-date—Walmart’s guidance will offer real-time insight into consumer spending trends. If easing inflation is translating into stronger purchasing power, that reinforces the soft-landing narrative.
PCE Price Index (Later This Month): The Fed’s preferred inflation gauge will be pivotal. Confirmation of CPI’s cooling trend would likely solidify expectations for a June cut and intensify debate around a possible March move—potentially fueling the next leg higher in rate-sensitive stocks.
Bottom Line
The inflation backdrop has shifted in a way that favors investors. The opportunity isn’t complex—but it does require stepping away from the mega-cap tech trade that has dominated for the past two years and leaning into sectors positioned to benefit most from falling yields.
U.S. stock index futures slipped modestly on Tuesday night as a fragile rebound in technology shares showed signs of strain, with investors remaining cautious ahead of a wave of economic data and Federal Reserve signals.
Futures pulled back following a mildly upbeat session on Wall Street, where tech stocks attempted to bounce from recent declines. The recovery, however, was uneven, as lingering concerns over AI-driven disruptions continued to cloud sentiment in the sector.
By 19:55 ET (00:55 GMT), S&P 500 futures were down 0.1% at 6,851.50, Nasdaq 100 futures fell 0.2% to 24,721.0, and Dow Jones futures slipped 0.1% to 49,553.0.
Economic data, Fed minutes in focus
Attention now turns to several key economic releases and the minutes from the Fed’s January meeting, due Wednesday afternoon. Investors are looking for greater clarity on the central bank’s interest rate outlook after policymakers kept rates steady last month and signaled ongoing caution over persistent inflation and softening labor market conditions.
January industrial production figures are scheduled for Wednesday, followed by December’s PCE price index on Friday — the Fed’s preferred inflation measure and a key input into its longer-term rate projections.
Uncertainty surrounding the Fed has weighed on markets in recent weeks, particularly after President Donald Trump’s nomination of Kevin Warsh as the next Fed Chair was interpreted as a less dovish shift in leadership.
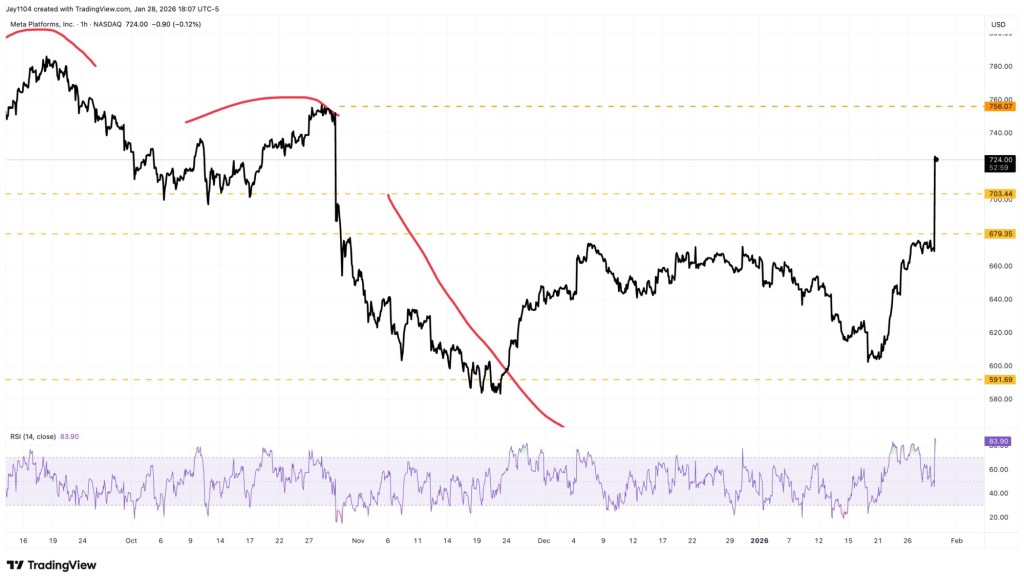
Nvidia, Meta pare gains; AMD cuts losses
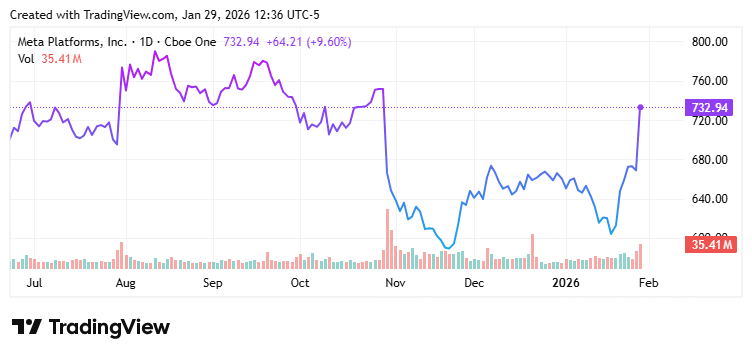
NVIDIA and Meta Platforms gave back some after-hours gains but still rose about 0.6% each after announcing a multi-year partnership to expand AI infrastructure, with Nvidia set to supply millions of chips to Meta.
Rival AMD, which had dropped as much as 4% following the announcement, reduced its losses to trade roughly 2% lower.
Technology stocks remain sensitive after weeks of declines fueled by concerns about AI-related disruption — especially within software — as well as skepticism over elevated AI spending and the sector’s long-term growth outlook.
Wall Street posts modest gains
Major indexes ended Tuesday slightly higher, supported by a patchy tech rebound and strength in financial stocks. The S&P 500 rose 0.1% to 6,843.22, the Nasdaq Composite added 0.1% to 22,578.38, and the Dow Jones Industrial Average gained 0.07% to 49,533.19.
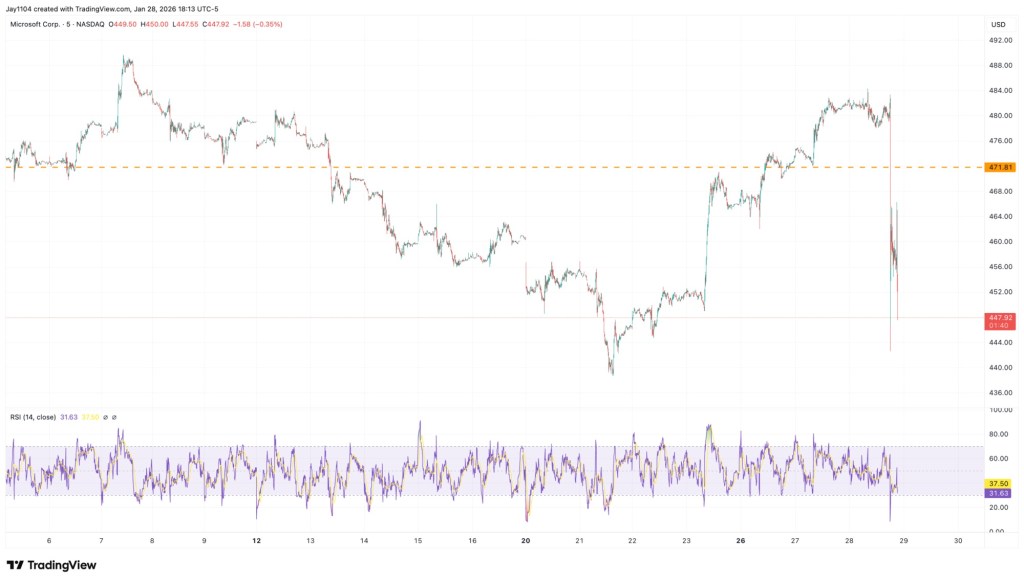
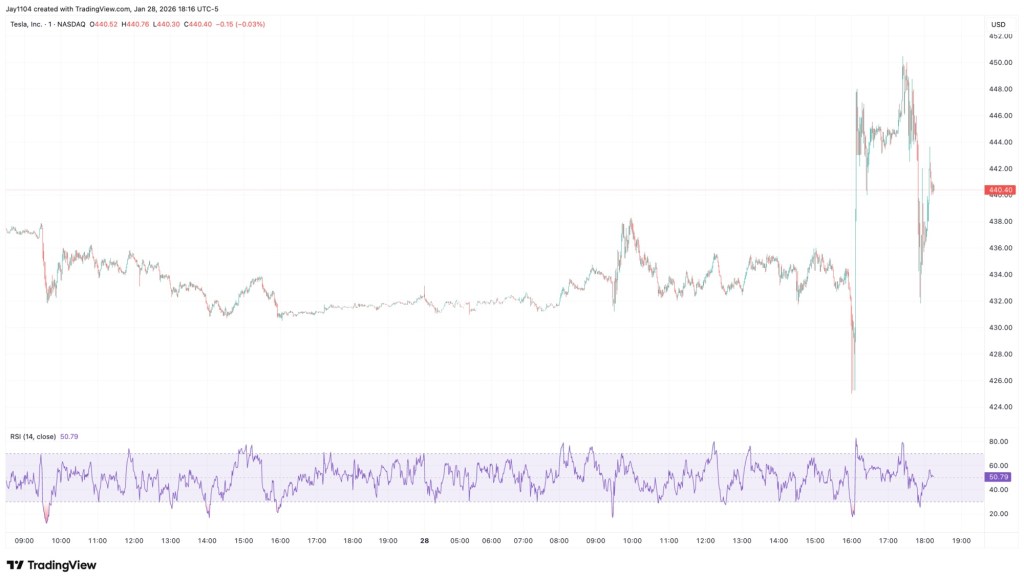
While some dip-buying helped tech shares recover modestly, heavyweight names including Microsoft, Tesla, Alphabet, and Oracle extended last week’s declines.
Markets also drew limited support from reports of progress in U.S.-Iran nuclear discussions, easing some concerns about escalating geopolitical tensions in the Middle East.
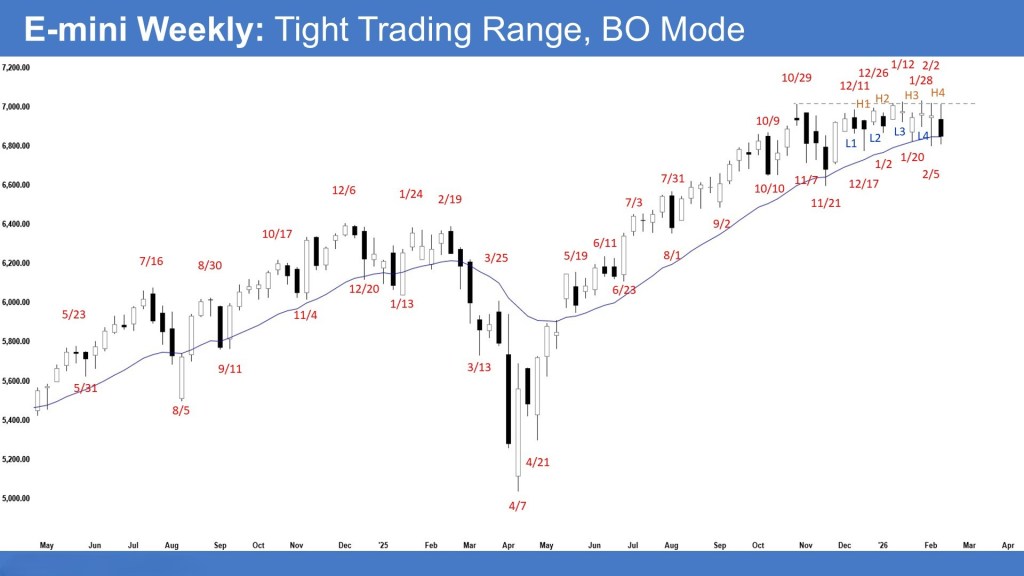
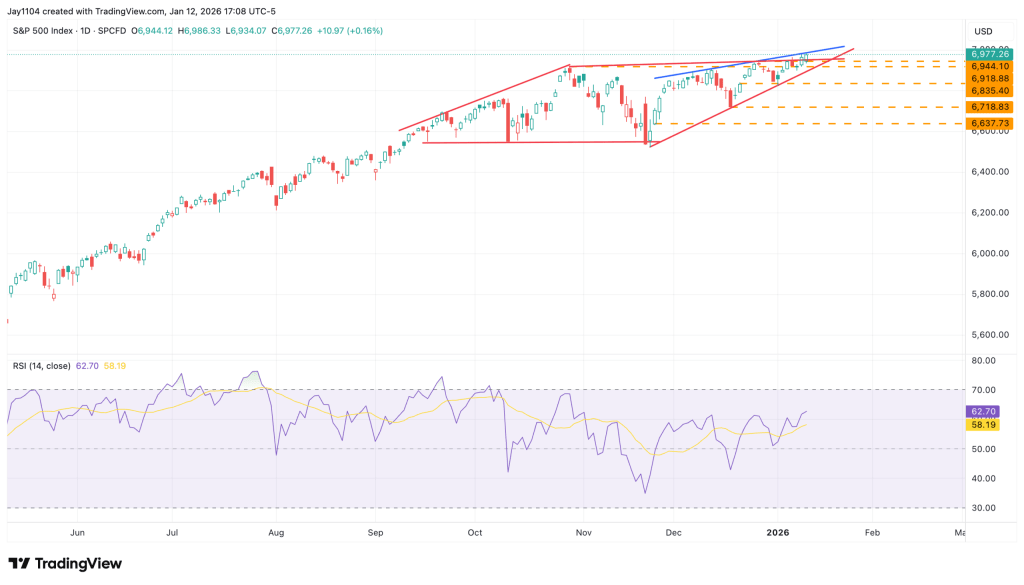
The S&P 500 E-mini bears are targeting a decisive breakdown below the February 5 low and the 20-week EMA, followed by strong and sustained selling pressure. In contrast, bulls want the 20-week EMA to hold as support, and if prices decline, they are looking to the November 21 low as a key support level.
S&P 500 E-Mini Futures – Weekly Chart
This week’s candlestick formed an inside bear bar that closed in the lower half of its range while testing the 20-week EMA. As mentioned last week, the market was likely to continue moving sideways in the near term, and so far it remains confined within an 11-week tight trading range.
From the bearish perspective, the chart shows a wedge top (December 11, December 26, and January 12), a double top (October 29 and January 28), and a smaller double top (January 12 and January 28). Bears want the October 29 high to serve as resistance. Their goal is a strong breakout below the February 5 low and the 20-week EMA, followed by continued selling that could project a measured move down toward 6,500, based on the height of the 11-week range. To shift the market into an Always In Short condition, bears need consecutive strong bear bars closing well below the 20-week EMA. If the market moves higher, they prefer weak follow-through buying to raise the probability of a failed breakout.
Bulls, on the other hand, see a large double-bottom bull flag (December 17 and February 5), along with a High 4 buy setup. They need a powerful breakout above the January 28 high with sustained follow-through to increase the likelihood of trend continuation, targeting a measured move toward 7,300, based on the range height. Bulls want the 20-week EMA to hold as support, and if prices fall, they expect the November 21 low to provide backing.
The market has traded in a tight range for 11 weeks, reflecting a balance between buyers and sellers as bearish pressure has caught up with the prior uptrend. Over the past two weeks, bulls have been unable to break above previous highs and have seen progressively lower closes within the range.
Until a decisive breakout occurs, traders may continue to apply a Buy Low, Sell High strategy within the range. Market participants will watch whether bears can push through the bottom of the 11-week range with strong follow-through selling, or whether bulls can retest and break above the all-time high. However, even if a new high is reached, lack of sustained buying would increase the risk of a failed breakout.
Alternatively, the market may continue to consolidate around the October 29 high. Most traders will likely wait for a clear breakout with strong follow-through—either above the all-time high or below the 20-week EMA—before committing aggressively. The longer price stalls near the October 29 high without breaking higher, the greater the probability of a deeper pullback.
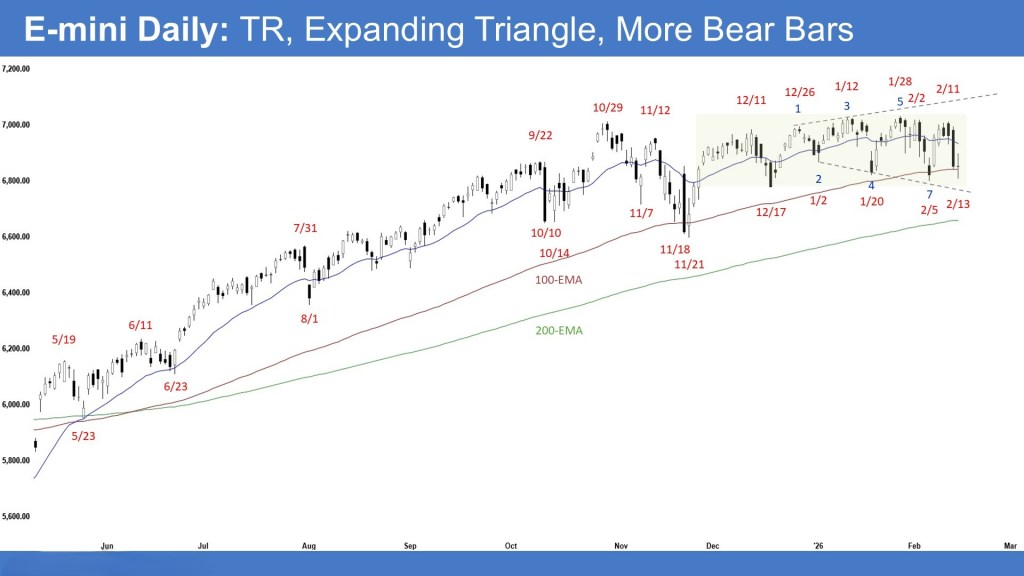
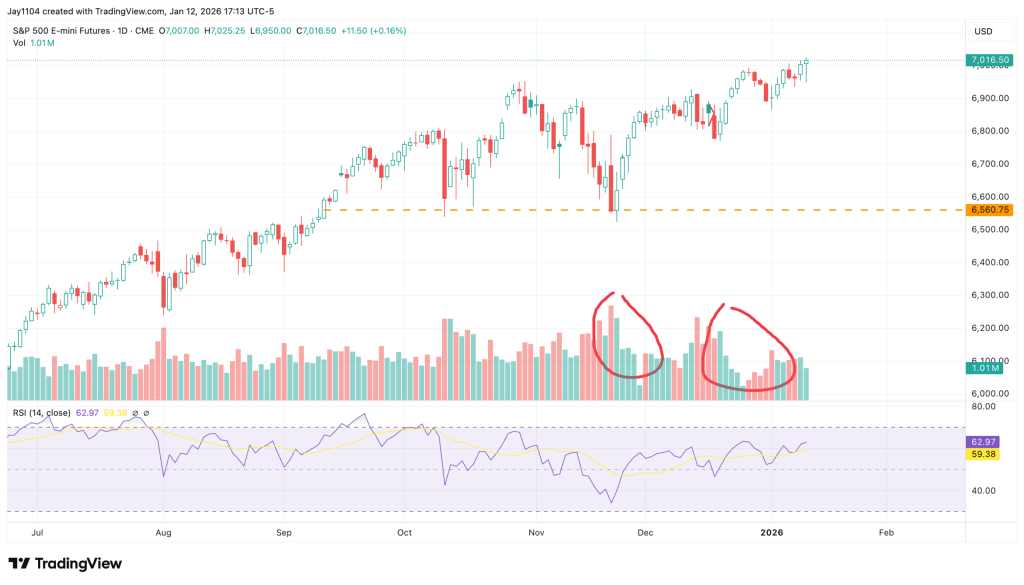
Daily S&P 500 E-Mini Chart
The market edged higher early in the week. Although Tuesday and Wednesday opened with gap-ups, both sessions reversed and closed as bear bars. On Thursday, a large bear bar formed, testing the 100-day EMA, and Friday printed a doji, signaling hesitation.
Last week, traders were monitoring whether price would stall near the 20-day EMA and develop a second sideways-to-down leg, or whether bulls could produce enough follow-through buying to push to new all-time highs. So far, price action is pausing around both the 20-day EMA and the all-time high zone.
From the bullish perspective, the chart shows a large double-bottom bull flag (December 17 and February 5), a wedge bull flag (January 2, January 20, and February 5), and a smaller double bottom (February 5 and February 13). Bulls are aiming for a decisive breakout above the January 28 high with sustained buying momentum, targeting a measured move toward 7,300 based on the height of the 11-week range. If the market declines, they want the November 21 low or the 200-day EMA to provide support. To improve the odds of a successful breakout and renewed uptrend, bulls need consecutive strong bull bars.
Bears, meanwhile, want the 20-day EMA to cap price as resistance. Their objective is a clear breakdown below the 11-week trading range, with a projected move toward 6,500 based on the same range measurement. To shift the market into an Always In Short condition, they need consecutive strong bear bars breaking below the December 17 low and the 100-day EMA. If the market rallies to a new all-time high, bears prefer to see weak follow-through buying to raise the likelihood of a failed breakout.
The market continues to trade within a range that began in late November, with bulls seeking an upside breakout and bears pushing for a downside resolution. Since late December, price action has shaped an expanding triangle, which can serve as either a continuation or reversal pattern and often traps traders with false breakouts before reversing.
Over the past two weeks, bear bars have been more pronounced than bull bars, suggesting gradually increasing and cumulative selling pressure. Traders are closely watching whether the market keeps stalling around the 20-day EMA and the all-time high area. A pattern of slightly lower highs accompanied by stronger bear bars would increase the probability of a downside breakout. Conversely, if bulls manage a breakout to new highs, traders will look for strong follow-through; without it, the risk of a failed breakout rises.
Until a decisive move with sustained momentum occurs in either direction, traders may continue applying a Buy Low, Sell High (BLSH) approach — buying near the lower third of the range and selling near the upper third.
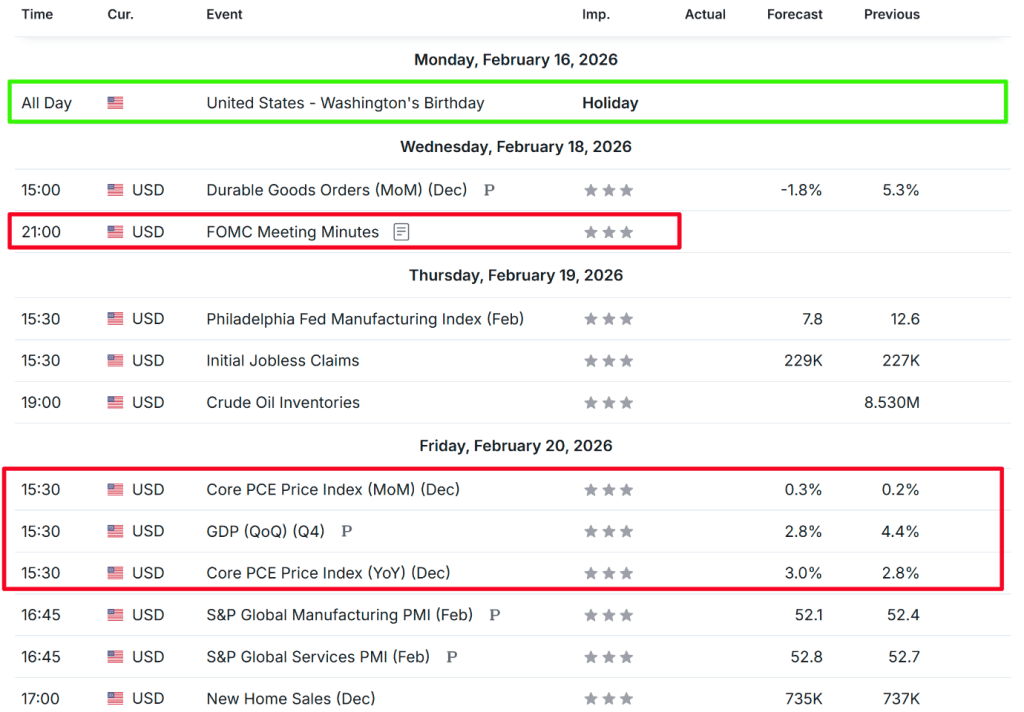
The upcoming holiday-shortened trading week will spotlight the Federal Reserve’s FOMC minutes and Walmart’s earnings report.
Analog Devices enters its earnings release with Wall Street projecting a strong 41% increase in EPS alongside 28% revenue growth. Meanwhile, Walmart may face downside risk, as expectations appear stretched and the stock looks “priced for perfection” ahead of results.
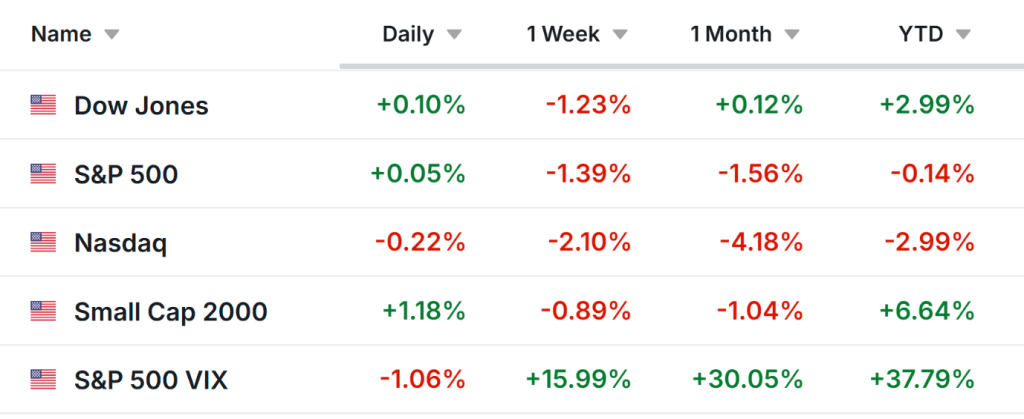
On Friday, U.S. equities finished largely flat as investors digested softer-than-expected inflation data, reinforcing expectations that the Federal Reserve remains on course to cut interest rates this year.
Despite the muted close, major indexes posted weekly losses. Concerns over AI-driven disruption extended beyond technology shares, weighing on brokerages, commercial real estate companies, and logistics firms.
The S&P 500 declined 1.4%, marking its second straight weekly drop. The Dow Jones Industrial Average lost 1.2%, while the Nasdaq Composite slid 2.1%, notching its fifth consecutive weekly loss — its longest downturn since May 2022.
The week ahead is shaping up to be active as investors continue evaluating the outlook for growth, inflation, and monetary policy. U.S. markets will be closed Monday in observance of Presidents Day.
With limited economic data on the calendar, attention will center on the minutes from the Fed’s January FOMC meeting, which could provide further clues on the interest-rate trajectory. Friday will also bring the release of the latest core PCE price index, a key inflation gauge.
As of Sunday morning, markets are pricing in two 25-basis-point rate cuts by the end of 2026, with about a 50% probability of an additional reduction, according to Investing.com’s Fed Monitor Tool.
On the corporate front, Walmart’s earnings will headline the final stretch of reporting season. Other notable reports due include Deere, Palo Alto Networks, and Toll Brothers.
Investors are also awaiting a U.S. Supreme Court decision expected Friday regarding the legality of President Donald Trump’s global tariffs.
Regardless of market direction, below are one stock that could attract buying interest and another that may face renewed selling pressure in the week of Monday, February 16 through Friday, February 20.
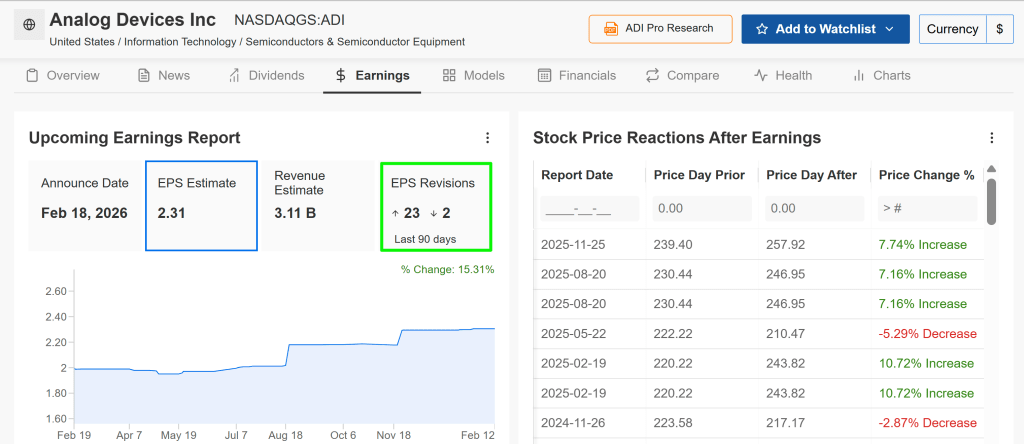
Stock to Buy: Analog Devices
Analog Devices (NASDAQ: ADI) remains well-positioned at the center of the industrial semiconductor recovery. The company is set to release its fiscal first-quarter results on Wednesday at 7:00 a.m. ET, with analysts forecasting a 41% jump in earnings per share and 28% revenue growth, driven by accelerating demand in robotics, automation, and AI-related infrastructure.
Sentiment heading into the report has been increasingly upbeat. InvestingPro data shows that 23 of the past 25 EPS revisions have been upward, reflecting rising confidence in the company’s growth trajectory. In the options market, traders are pricing in a potential post-earnings swing of approximately ±4.2%.
Analog Devices continues to benefit from long-term structural themes, including electrification, factory automation, and data-center expansion. Following prior inventory adjustments, recent quarters have demonstrated a solid rebound, supported by strong free cash flow generation that underpins dividends and share repurchases.
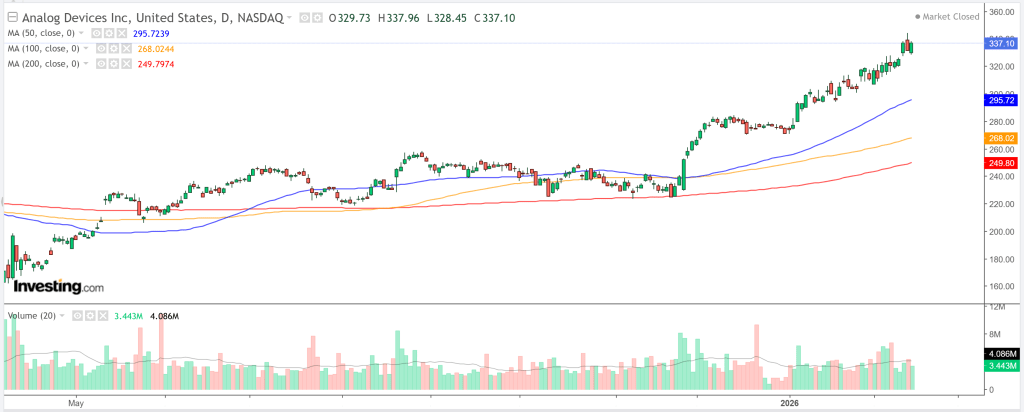
Technically, ADI has maintained a firm uptrend, recently reaching highs near $344 before experiencing a modest pullback. The stock remains comfortably above key moving averages and is showing relative strength versus the broader market. Immediate support lies in the $325–$330 range, while resistance stands near its record high around $344.
Across multiple timeframes, indicators point to strong bullish momentum. If earnings meet or exceed expectations, the technical setup suggests the potential for a breakout move.
Trade Setup:
Entry: Near current levels (~$337)
Target: $350–$360 (approximately 4%–7% upside)
Stop-Loss: $325 (around 3.5% downside risk)
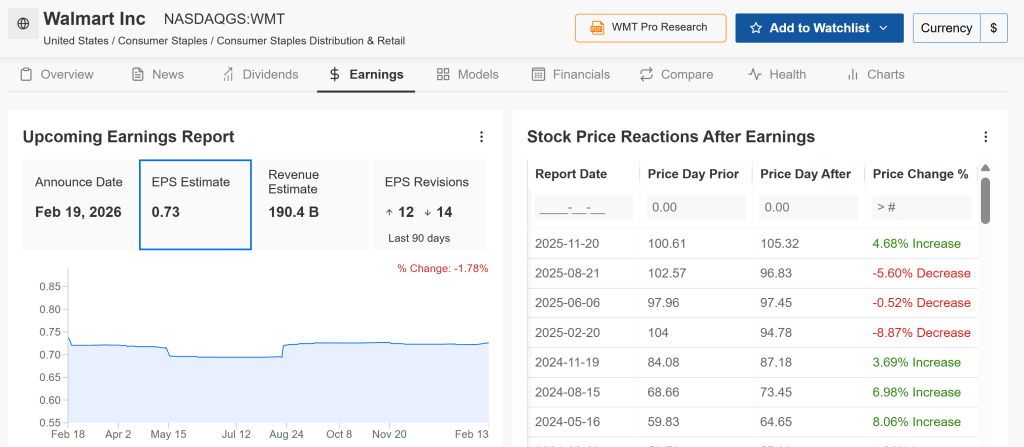
Stock to Sell: Walmart
Walmart (NASDAQ: WMT) has just crossed the historic $1 trillion market cap milestone and is set to release earnings Thursday at 7:00 AM ET. Fundamentally, the company remains strong: it’s expanding grocery market share, scaling its high-margin advertising segment, and leveraging AI to improve efficiency.
However, valuation is the key concern. With a forward P/E of 50.6x, the stock appears priced for flawless execution. That leaves minimal margin for disappointment. Even a slight miss in forward guidance could spark a notable pullback as expectations reset. Options markets are implying a post-earnings swing of just over 8 points in either direction.
Wall Street expects EPS of $0.73 (around 10% year-over-year growth) on roughly $190 billion in revenue. This will be the first earnings report under new CEO John Furner, adding another layer of scrutiny. Analyst sentiment has turned more cautious recently, with more than half of the latest estimate revisions skewing lower.
Oppenheimer anticipates solid results but cautions that guidance may underwhelm—similar to last year’s Q4 report, when the stock dropped about 8%. Jefferies notes that Walmart benefits from price normalization and tighter consumer spending, but much of that optimism seems fully reflected in the share price.
After a sharp rally to fresh record highs in the $134–$135 range, momentum appears stretched. Short-term technical indicators, including RSI, signal overbought conditions. Buying volume has begun to fade, and a negative surprise could push shares back toward support near $125.
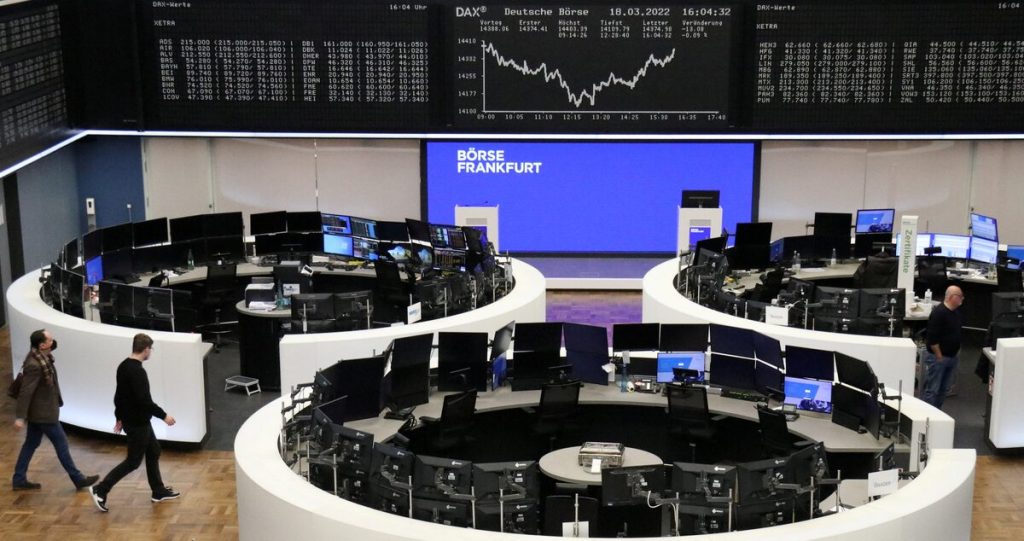
European equities moved modestly higher on Monday, helped by a broadly supportive earnings season, though trading volumes were thin due to holidays in both Asia and the United States.
At 03:02 ET (08:02 GMT), Germany’s DAX advanced 0.4%, France’s CAC 40 added 0.2%, and the UK’s FTSE 100 gained 0.2%.
Earnings season supports sentiment
The week began quietly, with much of Asia observing the Lunar New Year holiday and U.S. markets closed for George Washington’s birthday. Still, investor mood in Europe remained constructive, as corporate results have generally exceeded expectations amid signs of a gradual economic recovery.
According to LSEG data, companies accounting for 57% of Europe’s total market capitalization have reported fourth-quarter results so far, delivering average earnings growth of 3.9%—well above earlier projections for a 1.1% contraction. Around 60% of firms have beaten analyst estimates, compared with a typical quarterly average of 54%.
While Monday’s earnings calendar is light, attention this week will center on Europe’s four largest mining groups—Rio Tinto, Glencore, Anglo American, and Antofagasta—as metals prices hover near recent highs.
Meanwhile, Volkswagen is in focus after Manager Magazin reported that the carmaker plans to reduce costs by 20% across all brands by the end of 2028.
In the U.S., the key earnings event will be results from Walmart on Thursday, with the retail heavyweight’s report expected to provide fresh insight into consumer spending trends.
Economic data and oil markets
On the macro front, Eurozone industrial production data for December is due later Monday and is forecast to show a 1.5% monthly decline.
In the UK, property website Rightmove reported that average asking prices for newly listed homes dipped by just £12 in February to £368,019, following a sharp 2.8% rise in January.
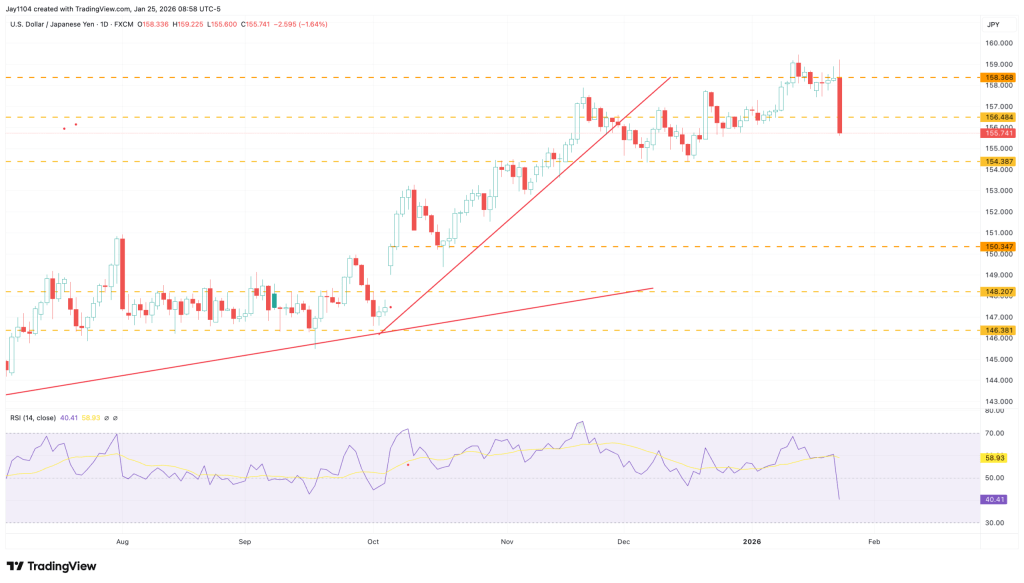
Earlier in Asia, Japan’s fourth-quarter GDP rose just 0.2% on an annualized basis, significantly below the 1.6% forecast, reinforcing the case for stronger fiscal support under Prime Minister Sanae Takaichi.
Oil prices were broadly steady in holiday-thinned trading. Brent Crude futures edged down 0.1% to $67.66 per barrel, while West Texas Intermediate slipped 0.1% to $62.68. Both benchmarks had already fallen between 0.5% and 1% last week after comments from U.S. President Donald Trump suggesting a potential deal with Tehran.
The U.S. and Iran are scheduled to hold a second round of talks in Geneva on Tuesday as they continue efforts to address longstanding tensions over Tehran’s nuclear program.
The AI-driven displacement trade weighed on multiple sectors this week.
Logistics companies were particularly pressured, with C.H. Robinson (CHRW) dropping more than 14% on Thursday amid AI-related concerns. The stock has fallen over 10% for the week.
Brokerage firm Charles Schwab slid starting Tuesday and is down roughly 9% over the past week. Its CEO told Bloomberg TV that management was “disappointed and surprised” by the sell-off, noting the firm is actively integrating AI to benefit clients.
Real estate services company CBRE sank sharply on Wednesday and Thursday, leaving shares down about 15.2% for the week. While AI-related concerns contributed to the decline, weaker-than-expected revenue in its latest earnings report also weighed on sentiment.
Applied Materials
Applied Materials is on track to finish the week higher, surging more than 8% Friday (as of 13:20 ET) after posting quarterly results.
The company exceeded consensus estimates and delivered strong second-quarter guidance. Brokerage Summit Insights upgraded AMAT to Buy, citing anticipated strength in wafer fabrication equipment (WFE) spending through the second half of 2026.
Pinterest
Shares of Pinterest tumbled more than 18% Friday following its post-close earnings release Thursday, bringing its weekly loss to over 22%.
The company reported fourth-quarter earnings and revenue below analyst expectations and issued first-quarter guidance that also missed consensus. Loop Capital analyst Rob Sanderson said that while Pinterest has a compelling platform and strong user growth, challenges in monetization and exposure to unusual macro conditions are overshadowing its strengths.
Sanderson downgraded PINS to Hold, noting it may take several quarters to complete its sales reorganization, manage higher spending, and rebuild investor confidence.
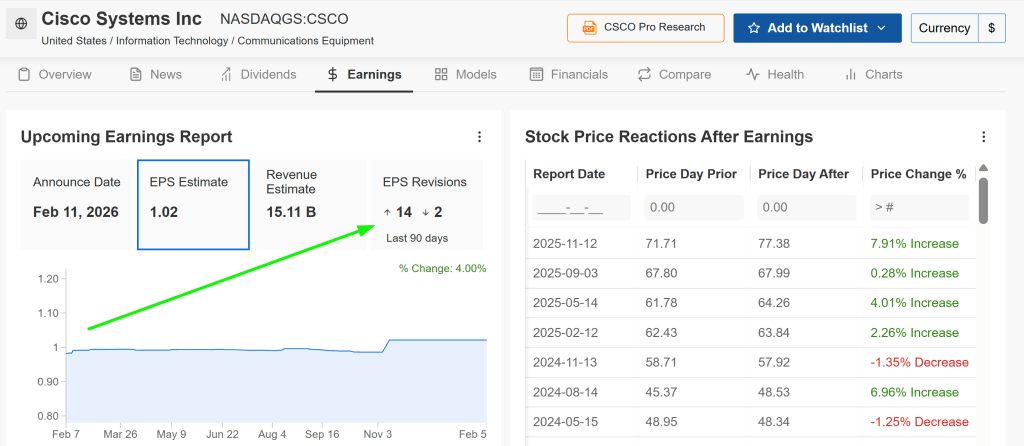
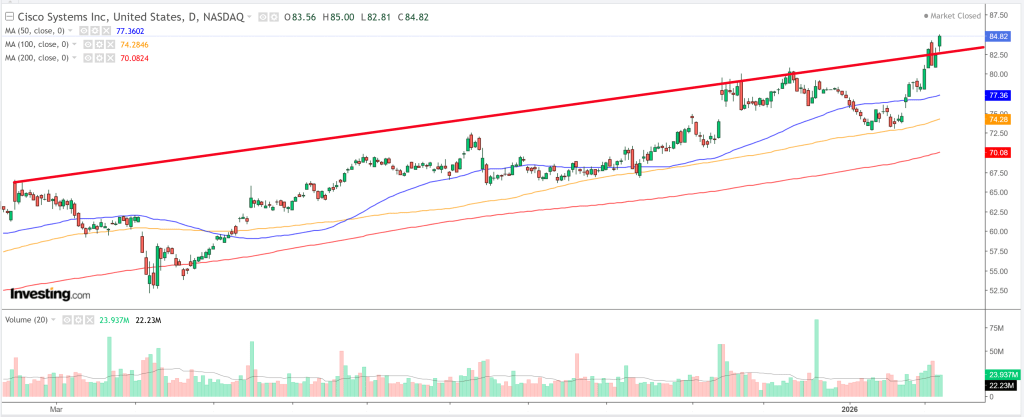
Cisco Systems
Shares of Cisco Systems dropped more than 12% Thursday following earnings.
Although Cisco beat profit and revenue expectations and offered upbeat guidance, investors reacted negatively to weaker-than-anticipated gross margins. UBS analyst David Vogt noted that higher memory input costs are expected to pressure margins over the next several quarters, lowering FY26 gross margin forecasts.
Unity Software
Unity Software plunged more than 26% Wednesday after earnings, with losses extending into Thursday and Friday. The stock is now down 21% over the past week.
While fourth-quarter results beat expectations, first-quarter revenue guidance disappointed investors. Despite that, Citizens analyst Andrew Boone maintained a positive stance, arguing that despite uncertainty around AI’s long-term impact, Unity’s platform remains essential for developers given the complexity of game creation and operations.
Oracle
After several weeks of declines tied to AI data center concerns, Oracle rebounded strongly, gaining more than 15% this week.
On Monday, DA Davidson analyst Gil Luria upgraded Oracle to Buy from Neutral. He suggested that a restructured OpenAI could reestablish itself as a leading challenger to Google and meet its commitments to Oracle this year, potentially removing a key overhang for the stock.
U.S. stock index futures edged down Thursday night after a sharp selloff in technology shares triggered heavy losses on Wall Street, with investors now awaiting key inflation data for further direction.
Wall Street declines as tech losses deepen; Cisco plunges.
Tech stocks slid as markets worried about fresh disruptions linked to artificial intelligence, while disappointing earnings from Cisco added to the pressure. Lingering uncertainty around U.S. rate cuts—particularly after this week’s strong nonfarm payrolls report—kept buyers cautious and prompted some profit-taking. By 19:57 ET, S&P 500 and Nasdaq 100 futures were each down 0.1%, while Dow futures were slightly lower.
On Thursday, major indexes fell steeply, led by renewed weakness in technology amid concerns over AI-driven disruption. Logistics and transportation stocks were also hit following reports that a new tool from Algorhythm Holdings could significantly streamline freight operations, potentially dampening demand across the sector.
The news sent trucking and logistics shares sharply lower, while Algorhythm surged nearly 30%. Meanwhile, Cisco Systems dropped 12% after posting weaker-than-expected results, dragging other major tech names lower, with the “Magnificent Seven” declining between 0.6% and 3%. The S&P 500 lost 1.6%, the Nasdaq Composite fell 2%, and the Dow Jones Industrial Average dropped 1.3%.
Investors await CPI report as interest rate uncertainty intensifies.
Attention now turns to January’s consumer price index data due Friday, which is expected to show a modest cooling in both headline and core inflation.
However, CPI has exceeded expectations in January for the past four years, keeping markets wary of an upside surprise. Stronger-than-expected jobs data earlier this week reinforced views of a tight labor market, reducing the Federal Reserve’s urgency to cut rates. Persistent inflation could further dampen sentiment, with CME FedWatch indicating markets see a high likelihood that rates will remain unchanged in March and April.
Asian equities retreated on Friday, following a decline in U.S. technology stocks overnight as fresh concerns about stretched artificial intelligence valuations weighed on investor sentiment. Despite the pullback, regional markets remained on track for solid weekly gains after a strong rally earlier in the week fueled by AI enthusiasm and upbeat corporate earnings.
On Nasdaq Composite, shares fell as investors reassessed elevated AI-related valuations, pressuring semiconductor and growth stocks across Asia. Meanwhile, U.S. stock index futures were mostly flat by late evening trading (22:04 ET / 03:04 GMT).
KOSPI climbed to a new all-time high and is on track to post a weekly gain of about 9%.
In South Korea, the KOSPI rose 0.5% to a fresh record of 5,558.82, bucking the broader regional weakness and heading for an impressive weekly gain of nearly 9%, driven by major chipmakers. Samsung Electronics climbed almost 15% this week on optimism surrounding its HBM4 high-bandwidth memory rollout and expanding edge AI prospects, while SK Hynix was poised for a roughly 6% weekly advance.
Japan’s Nikkei 225 slipped 0.7% after reaching record highs above 58,000 in the prior session but remained on course for a weekly rise of about 6%, supported by renewed trade optimism following the election victory of Sanae Takaichi. The broader TOPIX fell 1% on Friday, though it was still set for a weekly gain of around 4%.
Australian shares were poised for a weekly advance, supported by strong earnings from major banks.
Elsewhere, Australia’s S&P/ASX 200 dropped 1.3% on the day but remained on track for a 3% weekly increase, supported by strong bank earnings. Singapore’s Straits Times Index fell 1%, while futures linked to India’s Nifty 50 were little changed.
Hong Kong’s Hang Seng Index declined 2% on Friday and was poised to finish the week flat, diverging from the broader regional trend. In mainland China, the CSI 300 slipped 0.5% and the Shanghai Composite fell 0.7%, though both were still set for modest weekly gains of around 1%.
Investors were also looking ahead to upcoming U.S. consumer price index data for further guidance on the Federal Reserve’s rate outlook, after stronger-than-expected U.S. employment figures earlier in the week reduced expectations for near-term interest rate cuts.
The S&P 500 climbed early in the session, gaining roughly 50–60 basis points at its intraday peak, but those advances faded as the volatility crush quickly ran out of steam. As mentioned previously, the 1-day VIX had closed at 13.6—levels that typically coincide with 50–60 basis-point moves when volatility compresses. However, the 1-day VIX opened near 9, steadily increased during the session, and finished around 12, making the volatility unwind even more short-lived than anticipated.
More notably, subtle signs of stress are emerging beneath the surface. The VVIX—which tracks implied volatility of the VIX itself—moved higher, and the S&P 500 left-tail index also rose. While the index may appear calm on the surface, these indicators suggest that underlying volatility is building and becoming harder to ignore.
Single-stock volatility, reflected by VIXEQ, remains unusually elevated compared with the headline VIX, which measures index-level volatility. The spread between the two sits near 21.5. Historically, when this gap widens to such levels, it has often preceded meaningful market pullbacks.
Although the surface looks stable, significant shifts are occurring underneath, serving as a cautionary signal. As earnings season progresses, implied volatility for individual stocks should continue to ease, as is typical. If that happens, the spread is likely to compress. That normalization process may require the unwinding of positioning, which could trigger a sharp downside move. This risk has been a recurring theme in prior commentary.
Meanwhile, several sectors appear technically stretched. The Materials ETF (XLB) now shows a weekly RSI of 77 and is trading above its upper weekly Bollinger Band—classic overbought signals that suggest near-term vulnerability.
The Industrials ETF (XLI) is even more extended, trading above its upper monthly Bollinger Band with an RSI of 78.3. Historically, similar conditions—in 2007, 2013–2014, and 2018—have led to prolonged consolidation phases. When monthly momentum reaches these extremes, sustaining further upside typically becomes difficult without first easing overbought pressures.
The complication is that Industrials, Materials, Staples (XLP), and Energy (XLE) have been key drivers of the equal-weight S&P 500 (RSP) outperforming the cap-weighted index. This rotation helps explain why the headline S&P 500 often appears relatively steady: leadership shifts from one group to another, offsetting weakness elsewhere. The large-cap “Mag 7” stocks alone are no longer carrying the market.
One possible factor behind this dynamic is the growing influence of zero-DTE options and heavy trading in short-dated contracts. While definitive proof is lacking, the pattern suggests dealer hedging flows may be shaping price action around heavily concentrated strike levels.
For instance, if substantial open interest exists at a strike like 6,950, positioning could effectively pin the index near that level. As a result, underlying sector rotation may occur to keep the index aligned with options pricing. This could drive increased dispersion beneath the surface, with individual sectors making larger moves even as the broader index appears relatively unchanged.
GBP/USD is hovering around the critical 1.3508 level, where competing Elliott Wave counts are in play. The bullish scenario remains intact above 1.3508, while a sustained move below this level would strengthen the bearish case. A significant directional move is expected once one count clearly takes control.
On January 14, when GBP/USD was trading at 1.3428, we projected a modest pullback followed by a rally to kick off wave (iii). Price action has largely followed that script, although the drop from January 27 to February 6 was deeper than expected. This larger-than-anticipated decline opens the door to a possible revision in our wave interpretation.
GBP/USD Elliott Wave Analysis
We have been accurately tracking the broader GBP/USD structure, anticipating further upside. However, the sharper decline between January 27 and February 6 raises concerns that an alternative pattern may be unfolding. While no Elliott Wave rules have been violated, the structure now warrants closer scrutiny.
Bullish Scenario
The primary bullish view assumes wave (ii) завершed at 1.3339, near the upper boundary of our projected 1.3125–1.3333 reversal zone. Under this interpretation, wave ‘i’ of (iii) advanced to 1.3869 on January 27, and the subsequent decline into February 6 represents wave ‘ii’ of (iii).
The complication lies in the size of this wave ‘ii’ pullback. At 360 pips, it is considerably larger than its higher-degree counterpart wave (ii), which measured only 147 pips. While this does not breach any Elliott Wave rules, it is unusual for a lower-degree correction to significantly exceed the size of its higher-degree equivalent.
Typically, subwaves within an extended wave maintain proportions comparable to higher-degree waves. With this second wave nearly double the size, we must stay alert for an alternative count if GBP/USD continues to weaken.
For the bullish case to remain valid, Cable needs to rebound swiftly and push above 1.39. A retest of the February 6 low at 1.3508 would serve as an early warning that the bullish interpretation may be losing credibility.
Bearish Alternative Scenario
Should GBP/USD break decisively below 1.3508, the bearish alternative would gain traction.
Under this view, wave ‘2’ did not finish at the November low and remains in progress. The January 27 peak would represent wave ((b)) of 2, and the decline since then marks the early stages of wave ((c)) of 2. If this scenario unfolds, the pair could revisit the November support level near 1.3010.
Bottom Line
GBP/USD stands at a pivotal juncture, with both bullish and bearish Elliott Wave scenarios in contention. While the primary outlook favors a strong upward move, a continued slide toward 1.35 would shift focus toward the bearish alternative.
Most Asian equities advanced on Thursday, led by a record-breaking surge in South Korea, where chip stocks powered gains. Japanese shares were mostly steady after earlier climbing to a new all-time high above 58,000, supported by optimism surrounding the so-called “Takaichi trade.”
Regional upside was limited, however, after stronger-than-expected U.S. employment data underscored the resilience of the labor market. While the figures eased worries about the health of the world’s largest economy, they also reduced expectations for near-term interest rate cuts by the Federal Reserve.
On Wall Street, major indexes finished largely unchanged overnight, with futures trading flat during Asian hours.
KOSPI sets record as Samsung rallies on AI momentum
In Seoul, the KOSPI surged nearly 3% to a historic high of 5,515.8, extending gains fueled by robust demand for AI-related semiconductors.
Samsung Electronics jumped more than 6% to record levels after a senior executive emphasized the firm’s technological leadership in next-generation HBM4 (high-bandwidth memory) chips. The comments boosted confidence in Samsung’s production plans and its competitive positioning in advanced AI memory markets.
Investors are increasingly viewing HBM4 as a key driver of the next phase of AI hardware expansion, supporting profit margins and earnings visibility.
SK Hynix also rose 3.5%, buoyed by expectations of sustained demand for high-end memory chips used in AI servers.
Nikkei surpasses 58,000 milestone
Japan’s Nikkei 225 briefly broke above the 58,000 mark for the first time, hitting a new record before trimming gains to trade flat. The broader TOPIX index climbed 1.5% to a fresh all-time high of 3,888.94.
The rally has been partly linked to optimism over Prime Minister Sanae Takaichi’s election win. Investors have responded positively to her pro-growth agenda, which includes backing domestic industries, increasing defense spending, and maintaining supportive financial conditions—policies seen as favorable for exporters and cyclical sectors.
Strong U.S. jobs data tempers Fed cut expectations
U.S. data released Wednesday showed nonfarm payrolls increased by 130,000 in January, well above forecasts, while the unemployment rate unexpectedly dipped to 4.3% from 4.4%. The figures highlighted ongoing strength in the labor market.
Although the report eased fears of an economic slowdown, it also dampened hopes for imminent Federal Reserve rate reductions.
Elsewhere in Asia-Pacific, Australia’s S&P/ASX 200 gained 0.5% and Singapore’s FTSE Straits Times rose 0.7%. China’s CSI 300 and Shanghai Composite were mostly unchanged, while Hong Kong’s Hang Seng fell more than 1%, diverging from regional trends. India’s Nifty 50 futures edged up 0.1%.
The Nasdaq 100 has experienced heightened volatility over the past two weeks. As of this morning, futures are trading near the 25,280 level, rebounding from last Thursday’s sharp drop to around 24,200 during a wave of aggressive selling. For context, the index was trading near 26,260 on January 28. Recent sessions have delivered fast-moving conditions, demanding disciplined tactics from short-term traders.
Yesterday, the Nasdaq 100 reached a high near 25,350. At this stage, risk management is essential. While today’s modest pullback does not reflect panic selling, underlying nervousness remains evident. Determining whether this anxiety presents a buying opportunity or signals further downside is particularly challenging for short-term traders.
Interpreting Current Market Conditions
Technical traders may feel relatively comfortable navigating the volatility, but the rebound from last Thursday’s lows has not provided strong justification for aggressive bullish positioning. A key issue for buyers is the index’s inability to hold higher levels. Although this creates intraday opportunities to trade support and momentum, maintaining a cautious stance remains prudent.
The Nasdaq 100 is historically a fast-moving market, and sharp swings are part of the landscape for day traders. Today’s U.S. Retail Sales data and tomorrow’s employment report may generate volatility. However, the most influential release is likely Friday’s CPI inflation report. A softer-than-expected inflation reading could provide renewed bullish momentum.
Searching for Positive Catalysts
Still, Friday is several trading sessions away, leaving ample time for continued fluctuations. In the near term, choppy price action appears likely.
While it may be simplistic to label the environment as merely volatile, a balanced approach may be best. Conservative traders could consider looking for modest pullbacks while remaining alert for potential upside reversals.
Cautious sentiment continues to weigh on the market, and traders would be wise to remain disciplined as institutional investors await clearer economic signals and stronger catalysts.
Nasdaq 100 Short-Term Outlook: Volatility Likely to Persist
Consider initiating a short position between $84.57 (the lower boundary of the horizontal support range) and $87.35 (the upper boundary of that support zone).
Market Index Overview
Sysco Corporation (SYY) is a constituent of the S&P 500 Index.
While the index is trading near record highs, declining trading volume raises concerns about the sustainability of the rally. The Bull Bear Power Indicator has turned positive but remains below its downward-sloping trendline, suggesting that bullish momentum lacks full confirmation.
Market Sentiment
Equity futures are edging lower after the Dow Jones Industrial Average posted another all-time high, with the S&P 500 closing in on a record level of its own.
Retail sales data may introduce short-term volatility today, though the primary macro catalyst this week is tomorrow’s January Nonfarm Payrolls (NFP) report. Investors are also watching Coca-Cola’s earnings and price swings in gold, silver, and Bitcoin.
Despite a recent two-day rebound, technology stocks face renewed downside risks as rising memory costs pressure margins. Meanwhile, Alphabet is reportedly planning to issue its first 100-year bond since the dot-com era.
Fundamental Analysis of Sysco Corporation
Sysco is the world’s largest foodservice distributor, serving more than 700,000 customers through 340 distribution centers across ten countries.
Why Bearish After a 22%+ Rally?
Despite its strong rally, several factors support a cautious outlook:
The $52 million whistleblower ruling, while not materially damaging on its own, adds headline risk.
Continued margin compression reinforces broader profitability concerns.
The latest earnings report lacked strong positive catalysts.
Insider selling has increased in recent weeks.
The stock is trading near the consensus analyst price target, limiting apparent upside.
Elevated debt levels and negative free cash flow raise financial concerns within a structurally low-margin distribution business.
Signs of market saturation may restrict organic growth potential.
Taken together, these factors suggest limited upside and increasing downside risk at current levels.
Sysco’s price-to-earnings (P/E) ratio of 23.31 suggests the stock is relatively inexpensive. In comparison, the S&P 500 trades at a higher P/E multiple of 29.90.
Meanwhile, the average analyst price target of $89.94 implies limited upside from current levels, while downside risks appear to be increasing.
Sysco Corporation Technical Analysis
Today’s SYY Signal
The daily (D1) chart for SYY shows the formation of a new horizontal resistance area. Price is currently trading between the 0.0% and 38.2% levels of the ascending Fibonacci Retracement Fan.
The Bull Bear Power Indicator remains in bullish territory but is displaying a negative divergence, signaling weakening upside momentum. Additionally, average bearish volume exceeds average bullish volume, suggesting stronger selling pressure.
Although SYY has moved higher alongside the S&P 500 — typically a positive confirmation — bearish signals are beginning to build.
Despite ongoing noise around elevated valuations, rapid price swings, and a general sense of unease surrounding major U.S. equity indices, the S&P 500 continues to hover near record territory. Futures have edged higher again this morning, with the index trading around the 6,979.50 level.
Early last Friday, the S&P 500 dipped toward the 6,738.00 area, marking its lowest point since mid-December. However, a swift rebound restored upside momentum, pushing the index back within striking distance of all-time highs. The 7,000.00 mark remains a powerful psychological milestone for investors and short-term traders alike, especially those closely monitoring daily price action.
The 7,000 Milestone in a Cautious Environment
Although the S&P 500 typically moves less aggressively than the Nasdaq 100, it remains a popular vehicle for speculative positioning, particularly among retail traders using CFDs. Recent weeks have brought heightened volatility, yet the index has consistently stayed near the 7,000.00 threshold—a level it briefly surpassed in late January and early February.
Still, maintaining sustained breakouts has proven challenging. For bullish conviction to strengthen, traders may look for a decisive and lasting move above 7,000.00. Until such confirmation materializes, choppy and range-bound conditions are likely to persist—especially with key economic releases on deck, including Retail Sales, employment data, and Friday’s Consumer Price Index report.
Short-Term Positioning Amid Lingering Caution
While it may seem contradictory to speak of nervousness with the index near record highs, institutional sentiment appears notably guarded. This caution could serve as a defensive posture in case markets experience renewed downside volatility, similar to the sharp pullbacks seen in recent weeks.
Although the S&P 500’s ability to test upper-tier levels is encouraging, persistent headwinds have so far prevented a confident breakout into fresh territory. A series of strong U.S. economic readings may be needed to fuel a sustained advance. Whether that catalyst emerges remains to be seen.
Asian equities climbed further on Tuesday, led by tech stocks, with Japan’s market hitting new records as investors embraced the “Takaichi trade” after PM Sanae Takaichi’s election win. Sentiment was supported by modest gains on Wall Street overnight, where the Nasdaq outperformed on a rebound in tech and AI shares, while U.S. futures were mostly flat in Asian trading.
Nikkei jumps to a fresh record, closing in on 58,000 after Takaichi’s victory.
Japan’s Nikkei 225 surged as much as 3% to a fresh record of 57,960, while the broader TOPIX advanced about 2.2% to an all-time high of 3,863.90. The gains followed a strong session on Monday, when the Nikkei rose nearly 4% and the TOPIX added 2.3%.
The rally underscored growing investor confidence in Prime Minister Sanae Takaichi’s policy agenda, widely seen as supportive of economic growth, corporate earnings, and domestic investment. Her decisive election victory over the weekend has reinforced expectations of continued pro-business reforms, expansionary fiscal policy, and initiatives to boost capital spending, innovation, and strategic sectors.
ING analysts said the landslide win strengthens the case for “responsible but expansionary” fiscal spending and a more Japan-centric foreign policy, adding that risk-on sentiment is likely to dominate markets in the near term.
Asian tech stocks extend gains
Technology shares across Asia extended recent gains after last week’s sharp global sell-off driven by AI and valuation concerns. South Korea’s KOSPI rose 0.5% after a more than 4% surge previously, while Hong Kong’s Hang Seng added 0.5%, led by a 1% gain in the tech subindex. Mainland Chinese benchmarks were flat, Australia’s ASX 200 edged up 0.2%, Singapore’s STI slipped 0.3%, and India’s Nifty 50 futures were little changed. Investors are also awaiting key U.S. jobs and inflation data later this week for signals on interest rates and global growth.
Japan equities rally: Japanese stocks surged after Prime Minister Sanae Takaichi’s landslide election victory, boosting expectations of higher government spending on defense and AI. The Nikkei jumped as much as 4.2% to a record high, while the Topix rose up to 2.6%, led by gains in electronics and banking stocks.
Gold rebounds: Gold climbed above $5,000 an ounce, rising as much as 1.6% early on as dip buyers returned following a volatile week. The move was supported by Japan’s election outcome, which fueled expectations of looser fiscal policy and a weaker yen—both supportive for bullion. Gold remains about 11% below its Jan. 29 peak but is still up roughly 15% year to date.
Oil slips: Oil prices edged lower as easing Middle East tensions reduced near-term supply disruption risks. Talks between Iran and the U.S. in Oman on Tehran’s nuclear program were described by Iran as “a step forward.”
Asia markets higher: Asian equities opened higher, tracking Friday’s rebound on Wall Street. Stocks jumped in Japan and South Korea, with the Kospi—popular among AI-linked trades—surging 4%. U.S. futures were firmer after the S&P 500 closed about 2% higher on Friday amid dip-buying and improved consumer sentiment.
Algo-driven risks flagged: Goldman Sachs warned that trend-following algorithmic funds could accelerate U.S. equity selling this week. A renewed decline could trigger around $33 billion in automated sales immediately, with a break below 6,707 on the S&P 500 potentially unleashing up to $80 billion more over the next month. Thin liquidity and short-gamma positioning may keep volatility elevated.
AI fears spark selloff: Concerns over AI’s economic impact intensified after Anthropic unveiled new tools, triggering a broad selloff that erased $611 billion in market value across 164 software, financial services, and asset management stocks. Despite the selloff, fundamentals remain intact, with S&P 500 software and services earnings expected to grow 19% in 2026 and valuations becoming more attractive.
Wall Street rebound: U.S. equity futures ticked higher late Sunday after a strong rebound on Friday. Bitcoin jumped following steep losses, the Dow hit a fresh record above 50,000, and the S&P 500 reclaimed its 50-day moving average. The Nasdaq, however, remained below that key level and ended the week notably weaker.
U.S. Economic Data and Corporate Earnings Schedule
Investors are set to focus on the delayed January labor market data, alongside upcoming consumer inflation (CPI) and retail sales releases. The jobs and CPI reports were postponed due to a brief government shutdown last week, while December retail sales figures were also delayed following the 2025 shutdown.
The Federal Reserve continues to view inflation as “somewhat elevated,” with January’s CPI report, due Friday, expected to provide further clarity. As the central bank assesses risks to both inflation and employment as having eased, markets are pricing in no additional rate cuts before the June meeting. By then, Kevin Warsh—President Trump’s nominee for Fed chair—could be in office.
Despite the Fed’s year-end rate cut, futures markets still anticipate roughly two additional 25-basis-point cuts by December, a pricing stance that has remained largely unchanged since Warsh’s nomination last month.
Economic calendar:
Monday, Feb 9 Remarks from Fed officials including Governors Stephen Miran and Christopher Waller, along with Atlanta Fed President Raphael Bostic.
Tuesday, Feb 10 Key U.S. data releases include December retail sales, NFIB Small Business Optimism, the Q4 Employment Cost Index, December import prices, and November business inventories. Cleveland Fed President Beth Hammack is also scheduled to speak.
Wednesday, Feb 11 The January U.S. employment report is due, alongside remarks from Vice Chair for Supervision Michelle Bowman. The monthly U.S. federal budget for January will also be released.
Thursday, Feb 12 Data highlights include January existing-home sales and weekly initial jobless claims for the week ending Feb 7. Governor Stephen Miran is scheduled to speak.
Friday, Feb 13 The January Consumer Price Index (CPI) will be released.
Earnings Calendar:
Monday, Feb. 9 Earnings are due from Apollo Global Management, Onsemi, Loews, and Principal Financial.
Tuesday, Feb. 10 A heavy earnings slate includes Coca-Cola, AstraZeneca, Gilead Sciences, BP, CVS Health, Spotify, Duke Energy, Marriott, Ferrari, Ecolab, Robinhood, Cloudflare, Ford, Honda Motor, and Barclays.
Wednesday, Feb. 11 Reports are expected from Cisco, McDonald’s, T-Mobile, AppLovin, and Shopify.
Thursday, Feb. 12 Applied Materials, Arista Networks, Unilever, Vertex Pharmaceuticals, Brookfield, Airbnb, and Coinbase Global are scheduled to report.
Friday, Feb. 13 Enbridge and Moderna round out the week.
Cisco is set to report fiscal Q2 results after Wednesday’s close. Consensus estimates call for adjusted EPS of $1.02, up 9% year over year, on revenue of $15.1 billion, an 8% increase. Product orders are expected to soften slightly following 13% growth last quarter, while AI-related orders may cool after reaching $1.3 billion in Q1. Investors will be watching for upside tied to Cisco’s AI-networking partnership with Nvidia and signs of a recovery in its security segment following a weak prior quarter despite the Splunk acquisition.
AstraZeneca reports Q4 results early Tuesday, with analysts forecasting flat adjusted EPS and roughly 4% sales growth. The company’s recent move from Nasdaq to the NYSE has helped propel shares sharply higher, up around 108% in February.
Robinhood is expected to post a roughly 38% decline in EPS to $0.63, even as revenue is seen rising nearly 34% to $1.36 billion on stronger options, equities, and transaction activity. Crypto revenue is projected to fall about 28% to $259 million. The company has recently faced regulatory scrutiny related to prediction markets, including halting sports-related contracts in Nevada, contributing to a sharp pullback in the stock last week.
Elsewhere, McDonald’s earnings are expected to show about 8% EPS growth—its strongest quarter since late 2023—while Coca-Cola is forecast to report modest slowing growth, despite shares gaining around 8% since breaking out in January.
By the end of the week, more than 80% of Dow Jones Industrial Average constituents will have reported earnings.
Technical Analysis:
DJIA Index The index confirmed a breakout from a bullish rectangular consolidation on Friday. As long as support at 49,970 holds, the upside target remains at 51,000. DJIA daily candlestick chart.
Nasdaq 100 Index The NDX broke below the 25,200 support level last Wednesday, in line with the view that a sustained move under 25,200 would open the door toward 24,650. The index subsequently dropped to 24,455 before reclaiming 24,650. It is now rebounding toward 25,200, with further upside toward 25,370. A decisive break above 25,370 would expose resistance near 25,850. NDX daily candlestick chart.
SPX Index The SPX successfully defended the 6,790–6,780 support zone during its second pullback of the year. The index is now consolidating within a rectangular range. As long as support at 6,780 holds, the upside target remains 7,010. SPX daily candlestick chart.
Weekly Probability Outlook for U.S. Indices
The U.S. weekly market probability map for Feb. 9–13, 2026 points to a mixed open for U.S. equity indices, followed by a stronger close and a rally developing midweek. The probability maps are based on historical seasonality trends, with sentiment readings generated through a seasonality-driven scoring model.
Key U.S. economic data—including the jobs report, CPI inflation, retail sales—and another round of corporate earnings will be in focus this week.
Cisco is expected to post strong earnings along with upbeat guidance, positioning the stock as a high-conviction potential outperformer in the near term.
By contrast, Moderna faces pressure from declining revenue and anticipated losses, leaving the stock vulnerable to downside risk this week.
Wall Street stocks surged on Friday, posting their strongest gains in months as the Dow Jones Industrial Average finished above the landmark 50,000 level for the first time.
The rally came after three consecutive sessions of declines driven by artificial intelligence-related concerns, with software stocks particularly pressured on fears that AI could intensify competition across the sector.
For the week, the benchmark S&P 500 and the tech-heavy Nasdaq Composite edged lower by 0.1% and 1.8%, respectively, while the 30-stock Dow Jones Industrial Average gained 2.5% and the small-cap Russell 2000 advanced 1.8%.
Volatility may remain elevated in the days ahead as investors weigh the outlook for economic growth, inflation, interest rates, and corporate earnings.
On the economic front, delayed December retail sales data is set for release on Tuesday. However, Wednesday’s postponed January U.S. jobs report could prove more influential amid mounting concerns over labor-market conditions. January CPI inflation data due on Friday will also be closely watched for further evidence on whether price pressures are truly easing.
Earnings season also rolls on, with a busy slate of high-profile results due in the coming days. Notable reports include Coca-Cola, McDonald’s, Ford, Cisco, Robinhood, Coinbase, and Arista Networks, alongside key software names such as AppLovin, Shopify, and Datadog.
Regardless of broader market direction, below I highlight one stock that is likely to attract buying interest and another that could face renewed downside pressure. Note that this view is strictly short term, covering the week ahead from Monday, February 9 through Friday, February 13.
Stock To Buy: Cisco
Cisco’s upcoming earnings report is the key catalyst for the stock this week, with the risk–reward profile appearing skewed to the upside. CSCO is set to report fiscal second-quarter results after the market closes on Wednesday at 4:05 p.m. ET.
Market expectations remain relatively modest, suggesting that even a small beat on revenue and earnings per share, coupled with steady or slightly optimistic guidance, could be enough to spark a post-earnings rally.
Analyst sentiment has been notably constructive heading into the release. According to InvestingPro data, 14 of the last 16 EPS revisions have been upward, underscoring growing confidence in Cisco’s ongoing expansion.
As a leading player in networking hardware, cybersecurity, and an increasingly important provider of AI infrastructure, Cisco is well positioned to capitalize on multiple tailwinds that could support a strong quarterly performance despite a mixed macroeconomic backdrop.
Consensus forecasts call for adjusted earnings per share of $1.02, representing a 9% increase from a year earlier. Revenue is expected to rise 8% year over year to $15.1 billion, supported by AI-driven demand and solid product sales.
Analysts see potential for longer-term upside from Cisco’s partnership with Nvidia to develop AI networking solutions for the enterprise market. Meanwhile, Cisco’s security segment underperformed in fiscal first quarter results despite the acquisition of Splunk, and investors will be watching closely for signs of a rebound in that business.
Cisco’s shares have been on a strong run, notching a string of fresh 52-week highs in recent sessions. The stock closed at $84.82 on Friday, underscoring solid momentum heading into the earnings release.
Valuation and sentiment also remain supportive. Cisco continues to trade at a reasonable earnings multiple relative to both the broader technology sector and its own historical averages, while offering an appealing dividend yield underpinned by robust free cash flow.
Trade setup:
Entry: Near current levels (~$84–85)
Target: $90–$95 (potential upside of ~5.8%–10.8%)
Stop-loss: $80 (downside risk of ~5.8%)
Stock To Sell: Moderna
Moderna, meanwhile, faces a tougher setup this week as it heads into its fourth-quarter earnings release scheduled for before Friday’s opening bell at 6:35 a.m. ET. Options markets are pricing in a sharp post-earnings swing of around ±16%, underscoring the heightened risk of a downside surprise.
After its blockbuster pandemic-era success with the mRNA COVID-19 vaccine, the biotech company has struggled with the transition from reliance on a single product to a broader—yet still largely unproven—development pipeline.
Analyst sentiment has turned increasingly cautious ahead of the report, with consensus sales estimates cut by roughly 14%, reflecting growing concerns over Moderna’s near-term revenue outlook.
Consensus expectations point to a sizable loss, with earnings per share projected at around –$2.62 on revenue of $662.8 million, representing a steep year-over-year decline of more than 30% from sales of $966 million.
Moderna is grappling with slowing revenue growth and a lack of near-term catalysts to counter weakening demand, as vaccine sales continue to fade.
At the same time, the company must maintain elevated spending on research, development, and manufacturing to advance a broad pipeline spanning respiratory viruses, oncology, and other therapeutic areas. This combination is weighing on near-term profitability and increasing pressure on cash burn.
Moderna’s share price has started to lose momentum after a strong recent rally, ending Friday at $41.01. While the stock remains up 67.1% over the past three months and 21.1% in the last month, last week’s 7% decline points to waning upside traction.
In a market increasingly favoring growth and AI-linked themes, high-beta biotech stocks like Moderna are vulnerable to rotation, particularly if earnings fall short or forward guidance disappoints.
Trade setup:
Entry: Near current levels (~$40–41)
Target: $35 (potential gain of ~15%)
Stop-loss: $45 (risk of ~12.5%)
Whether you’re a newer investor or an experienced trader, tools like InvestingPro can help uncover opportunities while managing risk in a challenging and fast-moving market environment.
U.S. stock futures ticked higher on Sunday evening after Wall Street mounted a strong rebound late last week, even as investors remained cautious ahead of delayed U.S. employment and inflation data scheduled for release in the coming days.
S&P 500 futures rose 0.4% to 6,978.75 points, while Nasdaq 100 futures advanced 0.6% to 25,319.0 points by 19:12 ET (00:12 GMT). Dow Jones futures were up 0.2% at 50,327.0 points.
Wall Street bounced back late last week as AI disruption fears eased
Wall Street’s major indexes surged on Friday after several days of losses, as investors stepped in to scoop up beaten-down technology stocks and found reassurance in easing bond yields.
The S&P 500 advanced 2%, while the Nasdaq Composite climbed 2.2%. The Dow Jones Industrial Average rose 2.5%, notching its first close above the 50,000-point mark.
Gains were led by chipmakers and AI-linked stocks, which had faced intense selling pressure amid concerns over technology disruption and lofty valuations.
Earlier in the week, the technology sector had suffered sharp declines as investors rotated away from high-growth names, worried that rapid advances in artificial intelligence could upend software business models and squeeze profit margins.
For the week as a whole, the Dow gained roughly 2.5%, supported by strength in industrial and financial stocks. The S&P 500 slipped 0.1%, while the Nasdaq fell about 2%, underscoring the sector’s pronounced weakness.
Jobs, inflation data in focus with major earnings ahead
Market attention is shifting toward key U.S. economic data releases that were postponed due to the partial government shutdown.
The closely watched January employment report, originally due last week, is now scheduled for release on Wednesday. A private-sector jobs report published last week showed weaker-than-expected hiring, sparking concerns that labor market momentum may be starting to cool after months of strength.
Focus will then turn to January consumer price index data, set for release on Friday following the shutdown-related delay. The inflation report will be closely examined for indications that price pressures are easing enough to give the Federal Reserve scope to consider interest rate cuts later this year.
Corporate earnings may also influence markets in the days ahead, with companies such as Coca-Cola Co (NYSE:KO) and Ford Motor Company (NYSE:F) among the notable firms due to report quarterly results this week.
Most Asian markets climbed sharply on Monday, tracking Wall Street’s tech-led rebound, while Japanese shares jumped to record highs after Prime Minister Sanae Takaichi’s coalition won a decisive lower-house victory. Risk sentiment improved across the region following Friday’s strong U.S. rebound from AI-driven losses, with U.S. stock futures also edging higher in Asian trade.
Nikkei tops 57,000 following Takaichi’s election victory
Japan’s Nikkei 225 jumped as much as 5.6% to a new record of 57,337.07, supported by improved political certainty after Prime Minister Sanae Takaichi’s coalition won a commanding majority in Sunday’s lower-house election. The broader TOPIX index also surged 3.4% to an all-time high of 3,825.67.
Analysts said the decisive victory gives Takaichi greater latitude to push through policy initiatives, with markets anticipating higher public spending, tax incentives, and measures to lift wages and corporate investment, alongside continued backing for key sectors such as technology, defense, and energy. While the outcome is seen as positive for Japanese equities, it is expected to pressure government bonds and the yen.
Asian tech stocks jump, with South Korea’s KOSPI surging nearly 5%
Asian tech stocks rallied at the start of the week, supported by gains in U.S. chipmakers and AI-linked shares. South Korea’s KOSPI surged nearly 5%, rebounding from sharp losses, as Samsung Electronics jumped more than 5% on reports it will begin mass production of HBM4 chips later this month, while SK Hynix also climbed over 5%.
Elsewhere, Hong Kong’s Hang Seng rose 2% with the tech subindex up 1.5%, while China’s CSI 300 and Shanghai Composite gained 1.3% each. Australia’s ASX 200 advanced 2%, Singapore’s STI added 1%, and India’s Nifty 50 futures edged higher. Despite the rebound, investors remain cautious amid recent volatility in tech stocks and ahead of key U.S. jobs and inflation data due later this week.
Stifel downgrades Microsoft to Hold, says it’s “time to pause”
Microsoft (NASDAQ: MSFT) saw a rare Wall Street downgrade this week as Stifel analyst Brad Reback lowered the stock to Hold from Buy, cautioning that expectations for fiscal and calendar 2027 appear overly optimistic. He cited ongoing cloud capacity constraints, rising capital intensity, and intensifying AI competition as key concerns.
Reback cut Stifel’s price target to $392 from $540, saying the stock may need a breather after its strong run. Persistent limitations in Azure capacity remain a major headwind. Given well-known supply issues, along with strong results from Google’s GCP and Gemini platforms and increasing momentum at Anthropic, Reback believes meaningful near-term acceleration at Azure is unlikely.
He also noted that revenue tailwinds from overlapping product cycles that benefited fiscal 2026 should fade, limiting upside in subsequent years. Meanwhile, investment spending is expected to surge. Stifel raised its fiscal 2027 capex estimate to roughly $200 billion, about 40% growth and well above the Street’s $160 billion forecast. As a result, Reback lowered his FY27 gross margin outlook to around 63%, versus a consensus near 67%.
Operationally, Microsoft is entering what Reback described as a new — though still efficient — phase of elevated spending as it builds and monetizes proprietary AI platforms, a shift likely to weigh on operating margin leverage. While Stifel remains positive on Microsoft’s long-term strategic position, Reback said near-term visibility has become less clear, arguing the stock is unlikely to re-rate until capital spending moderates relative to Azure growth or cloud demand reaccelerates meaningfully.
DA Davidson cuts Amazon as AWS cedes cloud leadership
DA Davidson downgraded Amazon (NASDAQ: AMZN) to Neutral from Buy, warning that the company is losing its leadership position in cloud computing and showing early strategic strain in an AI-driven retail landscape. The firm lowered its price target to $175, arguing Amazon is now playing catch-up through increasingly aggressive investment.
Analyst Gil Luria said AWS continues to trail Microsoft Azure and Google Cloud. While AWS posted 24% year-over-year growth, Google Cloud accelerated to 48%, and Azure grew 39% despite capacity constraints. Luria highlighted Amazon’s lack of a frontier AI research lab and the absence of a flagship partnership like Microsoft’s alliance with OpenAI as factors driving customer preference toward rivals.
Falling behind, he warned, is forcing Amazon into heavier spending, pointing to more than $200 billion in projected capex. Luria suggested Amazon may ultimately need to pursue a $50 billion OpenAI investment to remain competitive in frontier AI models. He also raised concerns that Amazon’s retail business could face a structural disadvantage in a chat-centric internet dominated by Gemini and ChatGPT, where merchants embedded directly in leading AI platforms may gain superior traffic and advertising leverage.
Wolfe sees massive long-term upside in Tesla robotaxis, but near-term pressure
Wolfe Research said Tesla’s (NASDAQ: TSLA) robotaxi platform could become a major long-term growth engine, estimating the business could scale to $250 billion in annual revenue by 2035 as autonomous adoption expands. Analyst Emmanuel Rosner described 2026 as a catalyst-heavy year, with investor focus on robotaxi rollout, Optimus production, and the launch of unsupervised full self-driving.
Wolfe’s model assumes 30% autonomous penetration, a 50% market share for Tesla, and pricing of $1 per mile, which could support roughly $2.75 trillion in equity value, or about $900 billion on a discounted basis. Additional upside could come from Optimus and FSD licensing.
Despite the long-term optimism, Rosner remains cautious on near-term fundamentals, sitting below consensus earnings estimates for 2026 and 2027. He expects margin pressure from higher costs, pricing dynamics, and changes in FSD monetization, along with heavy AI-related investment weighing on earnings. Still, strong momentum in Tesla’s energy storage business provides some offset, and Wolfe remains tactically constructive given the steady flow of upcoming catalysts.
Truist tells investors to “buy the dip” in AMD
Truist Securities reiterated a bullish long-term view on AMD (NASDAQ: AMD), urging investors to buy the weakness after the stock fell more than 14% over the past week to its lowest level since October 2025. Analyst William Stein said AMD continues to compound earnings at roughly a 45% CAGR through 2030, while trading at just 11x estimated 2030 EPS.
Although fourth-quarter results benefited from a one-off China-related dynamic, AMD still reaffirmed its outlook for 60% data-center growth and 35% overall sales growth, which management believes could drive more than $20 in EPS by 2030. Stein cited strong customer engagement, accelerating adoption of Instinct MI350 GPUs, and solid demand for fifth-generation EPYC processors as key drivers. Truist raised its 2027 EPS forecast and lifted its price target to $283, arguing long-term fundamentals outweigh short-term noise.
Jefferies warns Palantir valuation still has room to fall
Jefferies said Palantir Technologies (NASDAQ: PLTR) remains vulnerable to further downside despite a steep year-to-date decline of roughly 27%. Analyst Brent Thill emphasized that the call is based on valuation rather than fundamentals, noting that even after compressing from 73x to about 31x forward revenue, Palantir still trades at nearly double the valuation of other large-cap software peers.
While acknowledging improving fundamentals, expanding addressable markets, and strengthening competitive positioning, Thill argued that valuation risk outweighs operational progress. The stock’s premium leaves it highly sensitive to shifts in AI sentiment and broader software sector trends. Jefferies believes cooling enthusiasm could push Palantir toward more sustainable valuation levels, reiterating its Underperform rating and $70 price target, even after strong quarterly results failed to justify the stock’s elevated multiple.
It’s striking that the S&P 500 is only about 2–3% below its all-time high given the turmoil seen across other areas of the market. On Thursday alone, silver and bitcoin fell by roughly 20% and 13%, respectively. For the moment, the index is hovering near the 6,800 level, supported by gamma-related positioning, though that support can shift quickly. A break below 6,800 would likely expose the next support zone around 6,700–6,720.
Based on some of the post-earnings price action late last evening, there is also a meaningful risk that the index opens with a downside gap.
At present, the VIX remains below the three-month VIX index, indicating that the volatility curve has not yet moved into backwardation. This suggests that implied volatility is increasing across maturities, but the market has not yet experienced a full-fledged spike in fear.
In addition, the dispersion index minus the three-month implied correlation index is still near the top of its range, indicating that the broader unwind has yet to begin.
At this stage, NVIDIA (NASDAQ: NVDA) appears to be one of the few pillars supporting the broader market, having held above the $170 level since July. That area represents a key support zone and can reasonably be viewed as the neckline of a potential head-and-shoulders pattern. A decisive break below $170 would likely signal further downside for NVIDIA and could also act as a catalyst for a wider breakdown across the major equity indexes.
Viewed through a second-order lens, the prevailing narrative suggests that AI could disrupt—or even undermine—the traditional SaaS business model. That naturally leads to a third-order question: if the SaaS model falters, who will be left to purchase AI models from the hyperscalers? And if hyperscalers struggle to earn adequate returns, who ultimately continues to drive demand for GPUs from NVIDIA?
Ironically—or perhaps predictably—the software sector topped out before NVIDIA did. With software stocks now turning lower, the key question is whether NVIDIA will eventually follow the same trajectory.
After posting disappointing earnings after the market closed on February 4, Qualcomm (NASDAQ: QCOM) left investors questioning what has gone wrong. The stock has since fallen below $140, down from $185 just a month ago—a sharp decline in a short time, capped by a steep selloff following Thursday morning’s earnings reaction.
Most notably, Qualcomm has now erased all the gains it painstakingly built over the past two years. The stock has fallen back to its 2020 levels—an unsettling spot for a company that has consistently positioned itself as a semiconductor player well placed to benefit from the AI boom.
Heading into earnings with already fragile sentiment, Qualcomm’s Q1 results did little to reinforce confidence in its long-term story. (Qualcomm’s fiscal year runs ahead of the calendar year.) While the headline figures stopped short of a major miss, management’s downbeat forward guidance was enough to spark another sharp deterioration in investor sentiment. That said, does this selloff present an opportunity for risk-tolerant investors, or was the pessimistic outlook a warning that’s simply too loud to dismiss? Let’s dig in.
Why Long-Term Investors Should Take This as a Red Flag
The key concern raised by the latest report is what it reveals about Qualcomm’s underlying structural headwinds. Management cited continued industry pressures stemming from memory supply limitations and weaker handset demand. While these challenges are not exclusive to Qualcomm, they carry greater weight given the company’s ongoing reliance on smartphones, despite its efforts to diversify. Automotive, Internet of Things (IoT), and licensing are still presented as growth drivers, but so far they have not been sufficient to counterbalance downturns in the core business when market conditions weaken.
This is significant because Qualcomm has a history of failing to sustain upside momentum. Each time enthusiasm builds around a rally or its diversification story, the stock has ultimately reversed course, and the latest selloff aligns uncomfortably well with that pattern. As a result, the market is once again justified in questioning whether Qualcomm can generate lasting growth rather than short-lived recoveries.
Analyst sentiment has also clearly deteriorated. In response to the earnings release, several firms reiterated neutral ratings or downgraded their outlooks. In some instances, the commentary turned explicitly bearish, with HSBC noting that it may be “difficult to forecast a potential bottom.”
The consequence is a meaningful erosion of credibility. Long-term shareholders who endured multiple cycles are now faced with a stock that has delivered little progress over the past five years, despite repeated assurances of strategic transformation. Viewed through that lens, this earnings report appears less like a reset and more like a clear warning sign.
Where Short-Term Traders May Spot an Opportunity
That said, while the long-term outlook appears impaired, the near-term technical picture may be telling a different story. The speed and severity of the selloff have driven Qualcomm into deeply oversold territory, with momentum indicators reaching extremes rarely seen over the past decade. While this does not guarantee a sustained recovery, it does raise the likelihood of a sharp relief bounce, particularly as selling pressure begins to fade.
There are already tentative signs of this process taking shape. After opening sharply lower in the session following earnings, the stock began to find support by the afternoon. How this behavior develops in the days ahead will be worth watching.
Even among analysts who have adopted a more cautious stance, many updated price targets still sit well above current levels. Bank of America, for instance, maintains a $155 target, while Cantor Fitzgerald sees value up to $160. Rosenblatt went a step further, reiterating its Buy rating with a $190 price target.
Whether those targets are ultimately justified over the coming year remains open to debate, but in the near term, they support the notion that bearish sentiment may have become stretched.
How to Approach the Current Setup
The crucial point is to clearly distinguish between investing and trading. From a long-term investment perspective, this report surfaces some uncomfortable issues. Until Qualcomm demonstrates an ability to deliver consistent growth and maintain its gains, a cautious and patient approach is justified.
For short-term traders, however, the setup looks different. Deeply oversold conditions, sharp price swings, and widespread pessimism can create conditions where relief rallies are swift and potentially lucrative—provided risk is managed carefully.
Global equities fell for a third straight session on Friday as the selloff on Wall Street intensified, while precious metals and cryptocurrencies were swept up in sharp volatility.
MSCI’s broad Asia-Pacific index excluding Japan dropped 1%, extending losses for a second day, led by a 5% plunge in South Korea’s Kospi that triggered a brief trading halt shortly after the open. S&P 500 e-mini futures declined 0.2%, while Nasdaq e-mini futures slid 0.4%. IG market analyst Tony Sycamore said investors were increasingly questioning their exposure to assets that have driven markets over the past six months—namely AI, cryptocurrencies and precious metals—raising the risk of a deeper unwinding. U.S. stocks sold off overnight on fears that new AI models could erode software-sector profitability, with the S&P 500 turning negative for the year amid growing labor market concerns.
U.S. employers announced a surge in layoffs in January, marking the highest level for the month in 17 years, according to data released Thursday by Challenger, Gray & Christmas.
Precious metals rebounded from session lows but remained weaker on the day. Gold slipped 0.1% to $4,764.43, while silver plunged as much as 10% before paring losses, last down 1.4% at $70.26.
Cryptocurrencies staged a rebound after suffering a $2 trillion market wipeout on Thursday. Bitcoin jumped 3.7% to $65,446.07 after earlier falling nearly 5% to a low of $60,008.52, while ether climbed 4.4% to $1,928.12 after reversing a prior 5.1% decline.
The S&P 500 software and services index sank 4.6%, shedding roughly $1 trillion in market capitalization since January 28 in a selloff dubbed “software-mageddon.” Pepperstone’s head of research Chris Weston said aggressive unwinding of crowded positions had driven large capital flows, warning that some companies—particularly outside the so-called Magnificent Seven—could face difficulties later this year as capital markets become less accommodating.
Amazon shares slid 11.5% in after-hours trading after the company projected capital spending to surge by more than 50% this year.
Markets have also begun to price in a higher probability of Federal Reserve policy easing, though expectations still favor no change at the next meeting. Fed funds futures imply a 22.7% chance of a 25-basis-point rate cut at the Fed’s March 18 meeting, up from 9.4% the previous day, according to CME Group’s FedWatch tool.
The U.S. dollar index was flat at 97.92, while the yield on the 10-year Treasury note fell 2.8 basis points to 4.18%. The yen strengthened 0.3% to 156.58 per dollar, and Japanese government bonds attracted buying ahead of Sunday’s election.
In energy markets, Brent crude slipped 0.4% to $67.31.
U.S. stock index futures slipped on Thursday evening, extending Wall Street’s losses as the selloff in technology shares showed little sign of abating. Amazon.com led declines after forecasting a sharp increase in capital expenditures for 2026.
Futures weakened after another steeply negative session on Wall Street, where technology stocks fell amid ongoing concerns over AI-driven disruption within the software sector. Investors were also unsettled by elevated spending across the industry, with Amazon’s outlook echoing similar guidance from other major tech firms. By 18:30 ET (23:30 GMT), S&P 500 Futures were down 0.5% at 6,789.25, Nasdaq 100 Futures slid 0.9% to 24,422.0, and Dow Jones Futures fell 0.3% to 48,857.0.
Amazon plunges 11% after projecting higher-than-expected 2026 capex
Amazon.com Inc (NASDAQ: AMZN) was among the biggest laggards in after-hours trading, plunging 11% following the release of its December-quarter earnings. The company projected capital expenditures of roughly $200 billion in 2026, far exceeding both last year’s spending and analyst estimates of about $146.1 billion.
Quarterly profit came in at $1.95 per share, narrowly missing expectations, while the outlook for the current quarter also fell short as the e-commerce giant factored in rising AI-related costs. Revenue from Amazon Web Services—the core of the company’s artificial intelligence strategy—climbed 24% to $35.6 billion, topping analyst forecasts.
Despite the strong AWS performance, investors were unsettled by the scale of the planned spending, amid growing uncertainty over when heavy AI investments will begin to generate meaningful returns. In sympathy, shares of Microsoft (NASDAQ: MSFT), Alphabet (NASDAQ: GOOGL), and Meta Platforms (NASDAQ: META)—all of which have recently outlined elevated AI spending plans for 2026—fell by as much as 3% in after-hours trade following Amazon’s results.
Wall Street declines again on heavy tech losses, weak employment figures
Wall Street benchmarks extended their decline on Thursday, led lower by the Nasdaq Composite, which fell 1.6%. The S&P 500 dropped 1.3%, while the Dow Jones Industrial Average slid 1.2%. Both the Nasdaq and the S&P fell to their lowest levels since late November and mid-December, respectively.
Technology stocks continued to be the main drag on U.S. equities, as investors grew increasingly concerned about elevated AI-related spending and the potential disruptive effects of artificial intelligence on the software sector. Additional pressure came from disruptions tied to AI’s heavy demand for memory chips. Qualcomm (NASDAQ: QCOM) tumbled 8.5% after warning about the impact of a global memory-chip shortage, while data from Counterpoint Research showed memory-chip prices have surged by as much as 90% quarter-on-quarter so far this quarter.
Broader economic worries also weighed on sentiment. Data from Challenger indicated that U.S. layoffs in January rose to their highest level since the 2009 financial crisis. Weekly jobless claims came in above expectations, while December job openings data also fell short of forecasts, reinforcing concerns about a slowing labor market.
Although signs of labor market weakness have raised expectations for additional Federal Reserve rate cuts, investors remained focused on the outlook for monetary policy under Kevin Warsh, President Donald Trump’s nominee to become the next Fed chair. Warsh has been perceived as a less dovish choice, a view that has also weighed on Wall Street sentiment.
Stocks ended lower on Wednesday, though the S&P 500 slipped just 50 basis points. In contrast, the equal-weight S&P 500 ETF (RSP) gained nearly 90 basis points, highlighting a notable degree of dispersion beneath the surface. This divergence was reflected in the Dispersion Index, which climbed to 37.6 and is once again approaching the upper end of its historical range. As earnings season draws to a close, dispersion is likely to ease, with correlations gradually moving higher.
The spread between the Dispersion Index and the three-month implied correlation index widened on Wednesday. As earnings season comes to an end, this gap is likely to narrow in the coming weeks as dispersion trades begin to unwind and correlations normalize.
One explanation for the notable strength in Walmart (NASDAQ: WMT) and the broader consumer staples sector may be the rise in implied volatility. While IV typically increases ahead of earnings season, this year it appears to be climbing to levels well above those seen in prior quarters. With Walmart not scheduled to report until February 19 and most retailers releasing earnings later in the cycle, the recent strength in XLP may not reflect a true sector rotation. Instead, it could be driven by the same dispersion dynamics observed ahead of the major technology earnings releases.
Long-term rates edged higher on Wednesday, with the 30-year yield rising about 2 basis points to 4.92%, once again testing the upper end of its resistance range. Whether it ultimately breaks higher remains uncertain. Fundamentally, yields have had ample justification to move higher for weeks, yet they remain stubbornly range-bound. The 30-year could arguably already be above 5%, but the market continues to wait.
The latest QRA released Wednesday continues to point to mounting stress at the long end of the curve, though those pressures have yet to fully materialize. The report noted that the Treasury General Account (TGA) is expected to exceed $1 trillion around tax season—roughly $150 billion above current levels. That represents a significant liquidity drain from the system, and based on rough estimates, the Fed’s bill purchases would dilute, rather than offset, that impact.
Looking ahead, Kevin Warsh’s arrival in May adds another layer of uncertainty around balance-sheet policy. As a result, liquidity conditions are likely to remain tight for some time.
The bull market has expanded beyond technology, and a number of upcoming Investor Days, Analyst Days, and business updates across non-tech sectors may provide valuable insight into the health of the broader, Main Street economy. Improving manufacturing sentiment creates a constructive backdrop for renewed corporate commentary. Together with fourth-quarter earnings reports and early-year industry conferences, these events are expected to deliver both qualitative perspectives and quantitative data points for investors.
Technology stocks and the AI theme have driven global markets since the bull run began in October 2022. This year’s rally—marked by record highs across regions from Japan to Europe—has been led by a new group of sectors. In the United States, Energy and Materials are out in front, delivering double-digit gains through early February, with other “real economy” areas such as Consumer Staples and Industrials close behind.
This kind of sector rotation is often viewed constructively, particularly when the S&P 500 holds elevated levels as market leadership shifts. Still, some observers have raised concerns that late-cycle industries and even traditionally defensive segments are starting to outperform more than three years into the bull market.
Regardless of whether the shift proves bullish or bearish, attention has clearly moved toward cyclical and value-oriented stocks. While two more members of the Magnificent Seven are set to report earnings this week, meaningful macro signals are increasingly expected to come from outside the technology sector. In addition, corporate events—including investor conferences, shareholder meetings, interim updates, analyst days, and business briefings—add important context alongside formal earnings releases.
Our team has identified several upcoming events hosted by non-tech, blue-chip companies over the next few weeks that could provide insight into the health of the manufacturing sector and the broader Main Street economy. These meetings follow the strongest U.S. ISM Manufacturing PMI reading since August 2022, released earlier this week. The next phase of the bull market may be taking shape—not in technology, but in more traditional sectors. Below are the key events that will help clarify that trajectory.
Thursday, February 5: Xcel Energy 2025 Year-End Webcast
Power generation is expected to be a central theme at Xcel Energy’s (XEL) Analyst Day, which will take place shortly after the release of its Q4 2025 earnings. The $44 billion market-cap utility has pulled back after reaching record highs late last year, though the weakness has been broadly shared across the sector. Utilities within the S&P 500 continue to face volatility as significant structural changes reshape what has historically been a relatively quiet corner of the market.
A Dividend Aristocrat, Xcel Energy shares are up roughly 10% over the past year. Management signaled a more aggressive capital expenditure strategy in its Q3 update last October. Investors will be looking for greater detail on project developments, as well as insight into trends tied to the expanding AI-driven infrastructure buildout, when the company presents tomorrow morning.
Tuesday, February 10: Williams Companies 2026 Analyst Day
Williams (WMB) is also expected to spotlight developments in the energy market. The $81 billion market-cap oil and gas storage and transportation company navigated several major winter storms with limited disruption. In November, management outlined a significant investment plan, announcing a $5.1 billion capital expenditure initiative focused on power innovation, alongside an ambitious 9% annualized growth outlook.
Midstream energy companies have long appealed to income-focused investors for their stable and growing dividends, but a meaningful growth angle may now be emerging. After years of subdued demand, U.S. power consumption is beginning to accelerate. Investors will gain updated insight into these trends next Tuesday, following the company’s Q4 earnings release.
Thursday, February 12: FedEx 2026 Investor Day
One of the most closely watched events this month is FedEx’s (FDX) Investor Day on February 12. CEO Raj Subramaniam has navigated a series of macroeconomic challenges during his tenure, prompting strategic shifts and operational adjustments. This year, the Memphis-based air freight and logistics company plans to spin off its FedEx Freight division by June 1.
FedEx delivered an earnings beat in December, triggering a long-awaited rally in the stock. Shares are up more than 50% over the past six months, setting a constructive backdrop for the Investor Day. While the specific announcements remain uncertain, companies typically do not convene such high-profile events to deliver negative news, suggesting an optimistic tone is likely.
Monday, February 23: JPMorgan Chase & Co. 2026 Update
JPMorgan Chase (JPM) may use its Business Update on Monday, February 23, to address several housekeeping items. While the largest U.S. bank by market value is shifting back to a first-quarter reporting cadence, that change is unlikely to capture investors’ attention. Instead, the focus will be on an operational overview and a potentially market-moving Q&A session with company leadership.
JPM shares reached an all-time high on January 6 before pulling back around earnings, ultimately sliding into a roughly 12% drawdown early in the year. Whether the stock can regain momentum following the upcoming update remains an open question. Investors may get early signals on Tuesday, February 10, when co-CEO Troy Rohrbaugh is scheduled to present at the UBS Financial Services Conference.
Wednesday, February 25: L3Harris Technologies 2026 Investor Day
Tuesday, March 10: Howmet Aerospace 2026 Technology & Markets Presentation
Two Aerospace & Defense companies—L3Harris (LHX) and Howmet Aerospace (HWM)—are set to host investor briefings in the coming weeks. Similar to banks, defense stocks have faced early pressure to start 2026. Both companies were also referenced unfavorably in recent Truth Social posts from President Trump. Proposals such as a potential cap on credit card interest rates weighed on financial stocks like JPMorgan, while threats of capital controls—including restrictions on dividends and share buybacks—were directed at defense names such as LHX, HWM, and their peers.
L3Harris shares declined following last week’s Q4 earnings release, while Howmet Aerospace is scheduled to report results before the market opens on Thursday, February 12.
The Bottom Line
Market leadership within the bull run appears to be widening, as capital increasingly rotates toward cyclical, value-oriented, and real-economy sectors. A slate of upcoming corporate events across Utilities, Energy, Industrials, and Financials could provide important clues as to whether economic momentum is gaining traction beyond technology. Should these updates confirm improving fundamentals, they may point to a more resilient and broadly based next stage of the bull market.
Uncertainty surrounding AI is driving market volatility on several fronts. Beyond accelerating layoffs as AI replaces certain roles, software stocks continue to sell off amid concerns that rapid AI deployment threatens all but companies with strong client-relationship moats. At the same time, surging demand for large-scale data centers has boosted memory chipmakers, while early winners in other semiconductor segments are now facing valuation pressure. Meanwhile, advances in quantum computing are gaining traction and could fundamentally reshape the landscape if fully realized—particularly in the area of security, where quantum systems are widely viewed as capable of breaking existing encryption methods, including those used in blockchain technology. Despite the turbulence, the longer-term outlook still points toward meaningful gains in labor productivity and improved corporate profit margins.
This morning, the Dow Jones Industrial Average and the equal-weighted S&P 500 are the only major indexes trading in positive territory. Both the NASDAQ and the “Magnificent Seven” are now negative year to date. While the S&P 500 is up 0.9% YTD, the equal-weighted S&P has gained 4.6%, highlighting the underperformance of mega-cap technology stocks. The Dow is up 3.2%, and the Russell 2000 continues to lead with a 6.3% gain YTD, despite a 0.5% decline over the past week. Market volatility remains elevated, with the VIX jumping to 19.1 at the open from 18 previously and currently holding near 18.8.
Sector performance year to date shows Financial Services (-2.3%), Technology (-1.3%), and Healthcare (-0.5%) as the only groups in negative territory. In contrast, Energy (+15.6%), Basic Materials (+11.8%), and Consumer Staples (+10.5%) are posting double-digit gains.
Interest rates are little changed, with the U.S. 2-year Treasury yield at 3.57% and the 10-year at 4.27%. International yields are similarly flat. The U.S. dollar index is higher by 0.25 at 97.55, up 1.3% over the past week.
Precious metals are experiencing sharp swings today, with gold climbing as high as $5,113 per ounce before retreating to $4,939, while silver fell from $92.0 to $86.5 per ounce. Copper prices declined 2.7% to $5.92 per ounce. Energy markets are relatively quiet, with crude oil trading flat near $63.20 per barrel.
Cryptocurrencies continue to weaken, as Bitcoin has fallen 3.7% to $73.9K and is now down 26.4% over the last twelve months. Ethereum is lower by 4.2% and down 31% LTM. Even with the prospect of clearer regulation, many investors remain cautious given the sector’s persistent volatility.
On the earnings front, AMD delivered solid top- and bottom-line beats, but weaker-than-expected data center revenue and rising costs weighed heavily on the stock. Shares are down a sharp 15.9%—their worst session in years—bringing performance to -4.9% YTD, though still up 70.4% LTM, and sending ripples through the broader hardware space. The semiconductor sector is down 3.9% on the day, including a 3.1% decline in NVIDIA. In contrast, Eli Lilly posted a strong earnings beat, exceeded expectations on both revenue and profit, and raised guidance. Its shares are up 9.8%, now +2.6% YTD and +33.7% LTM. Investors are also looking ahead to Alphabet’s results tonight and Amazon’s tomorrow.
As trading continues, the Dow Jones Industrial Average and the equal-weighted S&P 500 are holding onto gains, while the NASDAQ has slid more than 1% and the Magnificent Seven is down 0.9%. The S&P 500 has dipped below 6,900, off 0.3%, and the Russell 2000 is down 0.8%. The ongoing pullback in technology stocks reflects elevated valuations and persistently high interest rates. Even so, the Dow and the equal-weighted S&P remain near record highs, the broader trend is still positive, and a rebound in tech following this correction would not be unexpected.
Asian stock markets declined on Thursday, pulling back from record highs reached earlier in the week, as heightened volatility in global technology shares and concerns over AI-driven disruption dampened investor sentiment.
The retreat followed a sharp overnight selloff in U.S. technology stocks, with the Nasdaq underperforming broader market indexes. Meanwhile, U.S. stock index futures were largely flat during early Asian trading hours on Thursday.
AI fears drag tech stocks lower
The decline follows a volatile week for technology and semiconductor stocks, as rising concerns that rapid advances in artificial intelligence could disrupt established business models and squeeze profit margins prompted investors to take profits after a strong rally.
South Korea’s benchmark KOSPI fell 3.7% after hitting record highs over the previous two sessions. Shares of Samsung Electronics and SK Hynix dropped more than 5% each as investors moved to lock in recent gains.
In China, the blue-chip CSI 300 index and the Shanghai Composite both slipped nearly 1%. Hong Kong’s Hang Seng Index declined 1.2%, while the Hang Seng TECH Index fell 1.5%.
Japanese stocks slip, earnings help stem losses
Japanese equities edged lower on Thursday, with the Nikkei 225 slipping 1% from record highs reached earlier in the week as technology stocks followed overnight losses on Wall Street.
The decline was cushioned by strong gains in select stocks. Panasonic shares surged after the company reported solid earnings and issued upbeat guidance, while Renesas Electronics jumped following the announcement that it will sell its timing business to U.S.-based SiTime in a deal valued at around $3 billion.
The broader TOPIX index was largely unchanged, highlighting relative resilience outside the technology sector.
Elsewhere in the region, Singapore’s Straits Times Index eased 0.4% after closing at a record high in the previous session. Australia’s S&P/ASX 200 also slipped 0.4%, tracking regional weakness as investors digested trade data released earlier in the day.
Australia’s trade surplus widened less than expected in December, reflecting modest export growth and softer imports, which reinforced concerns over uneven global demand.
Futures linked to India’s Nifty 50 were slightly lower, down 0.3%.
Nasdaq has put forward a proposal to accelerate the inclusion of newly listed large companies into its indexes, aiming to reduce the lengthy delays that have often kept major IPOs and exchange transfers out of benchmark indexes for months.
The move comes as 2026 is shaping up to be a particularly active year for high-profile listings, with potential IPOs from companies such as Elon Musk’s SpaceX and artificial intelligence startup Anthropic. According to a source familiar with the discussions, advisers to SpaceX—following its recent acquisition of xAI—have contacted major index providers, including Nasdaq, to explore earlier-than-usual index entry. SpaceX did not immediately respond to a request for comment, and Nasdaq declined to comment.
Under the proposed “Fast Entry” rule, a newly listed Nasdaq company would qualify for expedited inclusion if its market capitalization ranks within the top 40 of existing index constituents. Eligible companies would receive at least five trading days’ notice and be added to the index after 15 trading sessions.
The proposal would waive the usual seasoning and liquidity requirements. Rather than replacing an existing constituent, the new entrant would temporarily expand the index’s size until the next annual reconstitution, consistent with Nasdaq’s approach to handling spin-offs.
Michael Ashley Schulman, partner and chief investment officer at Running Point Capital Advisors, said faster inclusion would enhance Nasdaq’s appeal for large issuers by improving liquidity and narrowing bid-ask spreads through greater passive fund ownership.
The lack of a fast-track mechanism has frequently created a gap between index composition and broader market realities, particularly given the scale and market influence of newly listed giants. Investors also expect major additions to be reflected promptly in the index, something the current framework often fails to deliver.
The proposed rule could prove especially consequential in 2026, as artificial intelligence–driven technology leaders may seek valuations in the hundreds of billions of dollars. Nasdaq remains the preferred exchange for U.S. technology heavyweights, including trillion-dollar companies such as Alphabet and Nvidia.
The Nasdaq 100 index, which includes the exchange’s largest listed firms, is closely watched by investors and analysts and is widely viewed as a key gauge of the health of technology and growth-focused sectors.
“As this proposal shows, Nasdaq is signaling that no company is too large and no system is too established to be improved,” Schulman said.
U.S. stock index futures ticked up slightly on Wednesday night after a weaker close on Wall Street, as technology stocks remained under pressure amid concerns over AI-driven disruption, while investors assessed Alphabet’s earnings report and new labor market data. S&P 500 futures rose 0.3% to 6,923.0, Nasdaq 100 futures advanced 0.4% to 25,088.75, and Dow Jones futures were mostly unchanged at 49,589.0.
Technology stocks extended their sell-off, while investors turned their attention to Alphabet’s earnings report.
In regular trading, the S&P 500 and the Nasdaq Composite fell 0.5% and 1.5%, respectively, as renewed selling pressure hit heavyweight technology and AI-related stocks. In contrast, the Dow Jones Industrial Average rose about 0.5% as investors shifted toward defensive and value names.
Technology and AI shares led the decline, extending a sector-wide selloff that has persisted into early February. Software and services stocks slid amid growing concerns that rapid advances in AI could disrupt traditional business models and squeeze margins for established companies.
Advanced Micro Devices was a key drag on market sentiment, with its shares plunging around 17% after the company reported earnings and issued guidance that failed to meet lofty market expectations. Although AMD pointed to strong AI-driven demand, investors focused on pricing pressures and intensifying competition in data centers, resulting in the stock’s sharpest one-day drop in years.
Focus also turned to Alphabet’s earnings after the close. The Google parent posted solid advertising revenue and reaffirmed plans for significant investment in AI infrastructure, but caution lingered over the near-term impact on profitability. Alphabet shares fell more than 1% in extended trading.
Meanwhile, Qualcomm shares slid nearly 10% after hours after the company forecast second-quarter revenue and profit below Wall Street estimates, citing a global memory chip shortage expected to weigh on smartphone sales and broader device demand.
U.S. private-sector payrolls rose by less than expected in January, signaling some cooling in the labor market.
Broader market sentiment was also influenced by economic data. Figures released on Wednesday showed private-sector employment increased by just 22,000 jobs last month, well short of the 50,000 gain expected, following a downwardly revised rise of 37,000 in December.
A brief government shutdown led to the postponement of the closely watched monthly jobs report, which had been scheduled for release on Friday.
Investors are now turning their attention to weekly jobless claims data due on Thursday, which should offer a near-term snapshot of labor market conditions ahead of the delayed nonfarm payrolls report.
On December 7, 2025, we advised maintaining a market-weight stance rather than an overweight position in the S&P 500’s Information Technology and Communication Services sectors. Since then, their combined share of the index’s market capitalization has fallen from a record 46.7% on November 5, 2025, to 43.9% as of Monday (see chart). This decline has occurred even as their combined contribution to S&P 500 earnings continued to climb, reaching a new high of 39.8% by Monday.
Despite strong growth in the two sectors’ combined forward earnings, their aggregate forward P/E multiple has compressed from 28.9 on November 5, 2025, to 24.3 currently (see chart).
On December 7 last year, we argued that AI was intensifying competition among the Magnificent Seven, compelling them to sharply ramp up investment in AI infrastructure. On that basis, we recommended an underweight position. We expect the primary beneficiaries of this dynamic to be the broader S&P 500—often referred to as the “Impressive 493”—which are leveraging AI tools to boost productivity rather than competing on infrastructure scale.
Technology has always been a highly competitive industry, and AI is intensifying that dynamic even further. In my 2018 book Predicting the Markets, I described the tech sector as a textbook case of “creative destruction,” where new innovations relentlessly displace older technologies.
More recently, software stocks have come under pressure as AI tools become increasingly proficient at writing code (see charts). While forward earnings for the sector have climbed to record levels, investors have compressed valuation multiples in response to the growing competitive threat posed by AI.
On Tuesday, software stocks were hit particularly hard after Anthropic unveiled new tools for its Cowork product. While it remains too early to assess their practical impact, investors responded by marking down valuation multiples across the software sector.
By contrast, semiconductor stocks have proven relatively resilient, even as the industry’s forward P/E multiple has declined amid a sharp surge in forward earnings (see chart). Competitive pressures are intensifying, particularly among chips designed to rival Nvidia’s (NASDAQ: NVDA) GPUs. At the same time, tight memory supply has driven prices sharply higher, though history suggests that once capacity expands to meet demand, those prices are likely to retreat.
Shares of semiconductor equipment makers have continued to climb, alongside rising earnings and expanding valuation multiples (see chart). This strength reflects the industry’s relative insulation from competitive pressures, as these companies benefit whenever demand is strong for equipment that enables chipmakers to expand production capacity.
The brief sense of relief following the easing selloff in metals quickly faded after news emerged that Anthropic—an AI startup backed by Amazon and Google—had launched a new AI tool capable of performing legal and research tasks traditionally handled via paid databases. The announcement rattled markets, sparking fears that AI-driven disruption is accelerating and threatening the core business models of software firms that provide data analytics and decision-support tools to law firms, banks, and corporations.
The result was a renewed bout of panic selling, particularly across software stocks. In Europe, RELX and London Stock Exchange Group plunged 14% and 12% respectively, while Thomson Reuters dropped 15%. Experian, Pearson, and Sage were also caught in the downdraft. In the US, shares of FactSet, Salesforce, and Adobe fell sharply, with Adobe sliding to its lowest level in nearly six years as concerns mounted that AI competition could severely undermine parts of its core business. Even tech heavyweights were not spared: Microsoft declined 2.87% and is now roughly 25% below its November peak.
Broader technology markets also weakened. VanEck’s Semiconductor ETF fell 2.5%, while Google—despite being one of the leading AI beneficiaries—slipped 1.22% after recently hitting a record high. The selloff spilled into Asia as well, with Tencent down around 3%. South Korea’s Kospi, however, largely avoided the turmoil, supported by continued strength in Samsung Electronics and SK Hynix amid tight memory supply and strong pricing power.
On the earnings front, AMD reported a solid beat, posting revenue above $10 billion and adjusted EPS of $1.53, both exceeding expectations. Growth was driven by robust demand for data-center and AI products, alongside solid performance in PCs and gaming. Despite impressive figures—including 39% growth in data-center revenue and 34% growth in PCs—and an upbeat message from CEO Lisa Su, the company’s outlook failed to meet elevated market expectations. AMD shares fell roughly 8% in after-hours trading.
Nasdaq futures are modestly lower at the time of writing, suggesting no immediate intensification of the software-led selloff. Still, recent earnings reactions highlight a broader issue: even companies delivering strong results are being punished, as investors demand ever-higher performance to justify stretched valuations.
Attention now turns to upcoming earnings from Google and Qualcomm later today, with Amazon reporting after Thursday’s close. By week’s end, markets may have a clearer picture of where the AI trade is headed. So far, enthusiasm has been muted—Meta, for instance, failed to sustain its post-earnings rally despite AI-driven revenue growth.
It increasingly appears that the AI rally is being unwound, largely irrespective of earnings strength.
Elsewhere, geopolitical tensions between the US and Iran escalated after reports that the US Navy shot down an Iranian drone approaching a US aircraft carrier in the Arabian Sea. That development pushed US crude prices up about 2.4%, with prices now consolidating just below $64 per barrel. While geopolitically driven spikes can offer short-term trading opportunities, risks remain skewed to the upside given the fragile situation.
Zooming out, gold has climbed back above $5,000 per ounce. In the past, this might have signaled a classic flight to safety amid equity volatility and geopolitical stress. Today, however, it is less clear whether this reflects genuine risk aversion or a rapid rotation from one crowded trade—AI—into another—metals.
Safe-haven options appear increasingly constrained. Gold remains volatile, US 10-year yields are elevated amid debt concerns and potential further Fed balance-sheet tightening, and the Japanese yen continues to struggle. USDJPY is testing its 50-day moving average near 156.30 and could push higher ahead of the weekend’s snap election. That leaves the Swiss franc, with USDCHF encountering resistance near 0.78. Meanwhile, EURUSD is gradually recovering after holding support near 1.1780, while sterling is consolidating above 1.37.
Both moves are largely driven by dollar dynamics. The dollar index has come under renewed pressure ahead of US labor data, though the Bureau of Labor Statistics has announced it will not release payroll figures this Friday due to a partial government shutdown. As a result, today’s ADP report takes on added significance and is expected to show roughly 46,000 private-sector job gains—a weak figure that would reinforce the view that US economic strength remains narrowly concentrated in AI-related investment rather than broad-based growth. This two-speed economy complicates the Fed’s policy outlook.
Soft labor data would likely support a more dovish Federal Reserve stance, which—absent policy shifts from the ECB or the Bank of England—could further bolster the euro and sterling against the dollar. I continue to expect EURUSD to move back toward, and ultimately above, the 1.20 level.
The Dow Jones continues to trade within an increasingly narrow range, as buyers find support along the December trendline while sellers cap advances near 49,580. The longer this compression persists, the higher the likelihood of a decisive and volatile breakout once the range is resolved.
Triangle pattern continues to tighten as pressure mounts.
49,580 stands as the critical upside barrier.
The breakout will determine direction, not strength.
Something has to give in the Dow Jones contract as price action continues to compress within an ascending triangle. Buyers remain active along the trendline support drawn from early December, while sellers continue to defend the 49,580 area. The market is effectively locked in a stalemate, and the longer this coiling persists, the greater the likelihood of a sharp, potentially explosive move once the pattern finally resolves.
Traditionally, this setup favors a bullish resolution, opening the door to fresh record highs, with a push beyond 51,000 possible given the placement of the triangle. A decisive break and close above 49,580 would allow long positions to be established above the level, with stops placed just below for risk management. While the 50,000 mark will naturally attract close attention due to its psychological importance, I would prefer to see a clear topping formation before reassessing whether to trim, exit, or maintain positions.
That said, technical conventions do not always play out—particularly against a backdrop of elevated valuations—so traders should remain mindful of the potential for a downside break from the pattern.
For now, the December uptrend is tracking closely alongside the 50-day moving average, creating a key zone where both long and short opportunities could emerge, depending on price behavior, should another pullback unfold.
A successful test and rebound from support could offer opportunities to establish long positions, targeting a retest of resistance near 49,580. Conversely, a decisive break and close below this zone would flip the bias, opening the door for short positions with stops placed above the trendline for protection. On the downside, 47,840 emerges as the first notable objective, aligning with multiple rebound points seen in December. Below that, 47,200—where the current uptrend originated—comes into focus, followed by the 46,875 area, which saw considerable two-way price action in the final quarter of 2025.
Adding some support to the bullish case, the 14-period RSI has broken its downward trend and is holding above the 50 level, indicating that downside momentum has stalled for now. The MACD echoes this view, turning back toward its signal line from below while remaining in positive territory. Overall, the signals suggest a neutral near-term bias, though with a slight edge still favoring the bulls.
European stocks inched higher on Tuesday, supported by a solid overnight close on Wall Street, as the recent sell-off in precious metals appeared to be short-lived.
By 03:05 ET (08:05 GMT), Germany’s DAX was up 0.8%, France’s CAC 40 added 0.4%, and the U.K.’s FTSE 100 edged 0.1% higher.
Global markets—including European equities—have steadied after several days of heightened volatility, marked in particular by sharp declines in gold and silver prices late last week and over the weekend.
Precious metals rebounded on Monday, restoring some investor confidence and helping lift the blue-chip Dow Jones Industrial Average by more than 500 points, or around 1%, on Wall Street.
Market sentiment also improved after U.S. President Donald Trump announced late Monday that the United States had reached a trade agreement with India, cutting tariffs on Indian goods to 18% from 50%.
The deal followed months of negotiations during which punitive tariffs had climbed as high as 50% and was widely viewed as a step toward normalizing trade relations.
Publicis draws investor attention.
Back in Europe, focus has returned to the quarterly earnings season, with a large number of major companies across the region scheduled to report results this week.
Publicis Groupe is in focus on Tuesday after a series of strong client wins helped the French advertising group deliver underlying fourth-quarter revenue ahead of expectations. The company generated €2.03 billion in free cash flow before working capital movements in 2025, up 10.6% from the previous year, and proposed a fully cash dividend of €3.75 per share, representing a 4.2% increase.
Elsewhere in France, asset manager Amundi posted a 6% rise in adjusted pretax income for 2025 to €1.86 billion, supported by record net inflows of €88 billion as it rolled out a new strategic plan aimed at driving growth through 2028.
In the Netherlands, Akzo Nobel reported a solid improvement in fourth-quarter margins compared with a year earlier, as the paints manufacturer contends with subdued demand while pursuing a potential merger with U.S. rival Axalta Coating Systems.
Attention is also on U.S. earnings later Tuesday, with results due from companies such as PayPal, Pfizer, and Marathon Petroleum, ahead of Advanced Micro Devices’ earnings after the close. Sentiment toward AI-related stocks remains fragile following poorly received results from Microsoft last week.
French consumer prices decline.
Data released earlier in the session indicated that inflation pressures remain subdued in France, the eurozone’s second-largest economy.
French consumer prices declined 0.3% month on month in January, while annual inflation stood at just 0.3%, undershooting expectations of 0.6%.
Attention now turns to the European Central Bank’s policy meeting later this week, where policymakers are widely expected to leave interest rates unchanged at 2% for a fifth consecutive meeting.
ECB President Christine Lagarde may also be pressed on the implications of a stronger euro for inflation, after the single currency briefly climbed above $1.20 last week, marking its highest level since 2021. It has since retreated but remains more than 2% higher over the past two weeks.
Crude prices continue to edge lower
Oil prices edged lower on Tuesday, extending losses for a second straight session, as easing tensions between the United States and Iran reduced the geopolitical risk premium in crude markets.
Brent futures slipped 0.4% to $65.96 a barrel, while U.S. West Texas Intermediate crude fell 0.4% to $61.90.
Both benchmarks dropped more than 4% in the previous session after President Donald Trump said Iran was “seriously talking” with Washington, signaling a potential de-escalation with the OPEC member.
Further pressure came from reports that Iran and the U.S. are set to resume nuclear talks on Friday in Turkey, according to Reuters.
Oil prices were also weighed down by a firmer U.S. dollar, with the dollar index hovering near a more-than-one-week high, dampening demand from holders of other currencies.
S&P 500 futures edge lower as investors prepare for a packed week of corporate earnings and major central bank meetings.
The U.S. payrolls report looms as a critical test for market direction following the Fed’s pause in rate cuts.
Japan’s Nikkei records a rare gain, supported by polls pointing to a likely LDP majority victory.
Gold and silver extend sharp losses after Friday’s volatility, adding to broader market unease.
The dollar stabilizes while the yen stays weak; Asian equities mostly track Wall Street futures lower.
Roughly 25% of S&P 500 companies report earnings this week, including Alphabet, Amazon, and Eli Lilly.
The dollar jumped after reports that President Trump nominated Kevin Warsh as Fed chair, while CFTC data show asset managers increased bearish dollar positions by $8.3 billion in the week to Jan. 27.
Copper falls further, extending last week’s steep declines as metals traders brace for continued volatility; U.S. natural gas futures slump, reversing Friday’s spike on milder weather forecasts.
Bitcoin slips below $76,000 in thin weekend trading, down about 40% from its 2025 peak, with demand fading amid thinning liquidity and subdued investor sentiment.
Dow Jones, S&P 500, and Nasdaq futures fell on Sunday night. The U.S. federal government entered another shutdown on Saturday, although it is widely expected to be resolved quickly.
A busy week of earnings lies ahead, led by Alphabet (NASDAQ: GOOGL), Amazon (NASDAQ: AMZN), Eli Lilly (NYSE: LLY), Palantir (NASDAQ: PLTR), Advanced Micro Devices (NASDAQ: AMD), and Disney (NYSE: DIS), with Disney set to report early on Monday.
Key U.S. Economic Data and Earnings Ahead
Wall Street will also be closely focused on the U.S. monthly jobs report due on February 6, after the Federal Reserve signaled some stabilization in the labor market by pausing its rate-cutting cycle last week.
Following the decision to hold interest rates steady, Fed officials will be watching hiring trends closely, balancing persistent inflation risks against signs of cooling job growth. Some policymakers continue to argue that additional rate cuts may be needed to support employment. Investors will also keep an eye on February consumer sentiment, consumer credit figures, and PMI data for both manufacturing and services.
Economic calendar:
Mon, Feb 2: ISM manufacturing PMI (Jan); Atlanta Fed President Raphael Bostic speaks.
Tue, Feb 3: Job openings (Dec).
Wed, Feb 4: ADP employment (Jan); remarks from Fed Governor Lisa Cook; ISM services PMI (Jan) in focus.
Thu, Feb 5: Initial jobless claims (week ending Jan 31).
Fri, Feb 6: U.S. employment report (Jan); preliminary consumer sentiment (Feb) and consumer credit data also due.
Earnings calendar:
Mon, Feb 2: Palantir (PLTR), Disney (DIS), Mizuho Financial (MFG)
Wed, Feb 4: Alphabet (GOOG, GOOGL), Eli Lilly (LLY), AbbVie (ABBV), Novartis (NVS), Novo Nordisk (NVO), Uber (UBER), Qualcomm (QCOM)
Thu, Feb 5: Amazon (AMZN), Philip Morris (PM), Shell (SHEL), ConocoPhillips (COP), Bristol-Myers Squibb (BMY)
Fri, Feb 6: Toyota Motor (TM)
Amazon (AMZN) shares jumped after the company reported strong third-quarter results, posting adjusted EPS of $1.95, up 36% year over year, on revenue of $180.2 billion, a 13% increase. AWS revenue rose 20% to $33 billion, while advertising sales climbed 24% to $17.7 billion. According to The Wall Street Journal, Amazon is in discussions to invest as much as $50 billion in OpenAI, having already committed $8 billion to Anthropic, for which AWS serves as the primary cloud and AI-training partner using its Trainium and Inferentia chips. Looking ahead, FactSet forecasts Amazon’s fourth-quarter EPS at $1.96, up 6%, with revenue expected to rise 13% to $211.4 billion.
FactSet estimates that Advanced Micro Devices (AMD) will report fourth-quarter EPS of $1.32 on revenue of $9.65 billion, while analysts forecast EPS of $1.23 and revenue of $9.38 billion for the following quarter. Some analysts expect AMD to exceed fourth-quarter expectations when it reports on February 3.
Analysts also anticipate that Alphabet (GOOGL) will report quarterly EPS of $2.58, representing 20% year-over-year growth, on revenue of $94.7 billion, up 16%. Consensus EPS estimates for the quarter have been trimmed by 0.4% over the past 30 days.
Technical Analysis:
DJIA Index
The Dow Jones Industrial Average is currently trading in a rectangular consolidation pattern, with prices compressing between 49,700 and 48,450. A decisive breakout above or breakdown below this range is likely to set the direction of the next major trend.
DJIA Daily Candlestick Chart
Nasdaq 100 Index
The Nasdaq 100 (NDX) failed to sustain gains above 25,860 last week and remains range-bound between 25,860 and 25,200, with stronger support near 24,650. A clear break below 25,200 would increase the risk of a decline toward 24,650. Conversely, if 25,200 continues to hold on repeated tests, the index is likely to remain choppy within the 25,860–25,200 range.
NDX Daily Candlestick Chart
SPX Index
The S&P 500 (SPX) has been hovering around the 6,900–6,890 zone for several weeks, with 7,000 acting as a key psychological resistance for bulls. For now, price action is expected to remain range-bound between 7,000 and 6,880. A decisive break below 6,880 would likely open the door to a deeper pullback toward 6,830.
European stocks moved lower on Monday as a selloff in precious metals rattled investor sentiment at the start of a week packed with corporate earnings, central bank meetings, and key economic data.
By 03:05 ET (08:05 GMT), Germany’s DAX was down 0.4%, France’s CAC 40 slipped 0.5%, and the U.K.’s FTSE 100 fell 0.6%.
Investor sentiment pressured by further declines in precious metals
Market sentiment was sharply dented on Monday as gold and silver extended their selloff, deepening losses from Friday’s rout. The nomination of Kevin Warsh as the next Federal Reserve chair sparked a strong rebound in the U.S. dollar, triggering widespread profit-taking and bringing an end to a rally that had pushed precious metals to record highs only days earlier.
Spot gold slid just under 6% to $4,597 per ounce on Monday, after plunging nearly 10% on Friday—its steepest single-day decline since 1983.
Silver, which had surged alongside gold on safe-haven demand and speculative inflows, also remained under heavy pressure following last Friday’s 30% collapse, marking its worst session since March 1980.
Adding to investor unease, CME announced increases to margin requirements on several metals contracts effective from Monday’s market close, suggesting some traders may be struggling to meet margin calls and could be forced to sell liquid assets.
Intesa Sanpaolo posts strong 2025 profit
Shifting back to the corporate sector, another heavy week of quarterly earnings is ahead, with roughly 30% of the EuroSTOXX index’s market capitalization due to report results.
Earlier on Monday, Intesa Sanpaolo (BIT: ISP) posted a 7.6% increase in 2025 net profit to €9.3 billion and unveiled plans to return €8.8 billion to shareholders through dividends and share buybacks, reinforcing its status as one of Europe’s most profitable banks.
Meanwhile, Swiss lender Julius Baer (SIX: BAER) reported 2025 net profit of CHF 764 million, down 25% from the previous year but slightly above market expectations of CHF 679 million.
In the U.S., attention this week will focus on technology heavyweights Alphabet (NASDAQ: GOOGL) and Amazon (NASDAQ: AMZN), especially as sentiment toward AI-related stocks has weakened after Microsoft (NASDAQ: MSFT) flagged rising costs from heavy AI investment, raising doubts over near-term returns.
German retail sales edge up
Data released earlier in the session showed that German retail sales increased by 0.1% in December from the previous month, improving from a 0.5% decline in November.
Manufacturing activity figures for January are due later in the session for the eurozone and are expected to show a modest improvement, although remaining in contraction territory.
Meanwhile, data released on Saturday indicated that China’s official manufacturing PMI fell further below the 50 threshold in January, signaling continued contraction in factory activity and underscoring ongoing weakness in domestic demand.
Both the European Central Bank and the Bank of England are set to hold policy meetings this week, with each widely expected to leave interest rates unchanged.
Oil falls as geopolitical risk premium fades
Oil prices dropped sharply on Monday as fears of a potential U.S. strike on Iran eased after President Donald Trump said the Middle Eastern oil producer was “seriously talking” with Washington.
Brent crude futures fell 4.8% to $65.97 a barrel, while U.S. West Texas Intermediate crude slid 5% to $61.91 a barrel.
Oil prices had surged last week as markets priced in a higher risk of supply disruptions from the region, following repeated threats by Trump toward Iran over its nuclear program and ongoing domestic unrest.
Those geopolitical risks appeared to recede after Trump’s comments over the weekend.
Meanwhile, the Organization of the Petroleum Exporting Countries and its allies, known collectively as OPEC+, left output levels unchanged at their weekend meeting, in line with expectations.
The U.S. jobs report, ISM PMI data, and another round of AI-driven tech earnings will be in the spotlight this week. Alphabet is poised to deliver robust results and upbeat guidance, making it an attractive buy. Meanwhile, Strategy heads into a difficult week as Bitcoin volatility and concerns over its BTC holdings weigh on the stock.
Wall Street stocks closed lower on Friday after President Donald Trump nominated former Federal Reserve Governor Kevin Warsh as the next Fed chair. Sharp sell-offs in gold and silver prices further unsettled markets.
Despite Friday’s pullback, the major U.S. stock indexes ended the month higher. The Dow Jones Industrial Average and the S&P 500 posted January gains of 1.1% and 1.2%, respectively, while the Nasdaq Composite rose 1%. Small caps outperformed, with the Russell 2000 climbing more than 4% for the month.
Volatility may pick up in the days ahead as investors weigh the outlook for economic growth, inflation, interest rates, and corporate earnings.
The key economic release will be Friday’s January U.S. jobs report, which is expected to show payroll growth of 67,000, with the unemployment rate unchanged at 4.4%. Ahead of that, the ISM manufacturing and services PMI readings will also be in focus.
A busy earnings calendar is also on tap, featuring reports from several major companies. These include “Magnificent Seven” members Alphabet and Amazon (NASDAQ: AMZN), along with AI-focused leaders Palantir Technologies (NASDAQ: PLTR) and Advanced Micro Devices (NASDAQ: AMD). Other high-profile reporters include Eli Lilly, Novo Nordisk, Pfizer, PepsiCo, Walt Disney, PayPal, Uber, Reddit, Roblox, Snap, Qualcomm, and Super Micro Computer.
Meanwhile, the federal government entered another shutdown on Saturday, though it is expected to be resolved by Monday.
No matter how markets move, I outline below one stock that could attract buying interest and another that may face renewed downside pressure. Keep in mind that this outlook applies only to the week ahead, from Monday, February 2, through Friday, February 6.
Buy Call: Alphabet
Alphabet goes into its quarterly earnings release with expectations for an upside surprise on both profit and revenue, driven by two key growth engines: a rebound in advertising and rising AI-driven contributions across Search, YouTube, and Google Cloud.
The company is set to report fourth-quarter results after the market closes on Wednesday at 4:00 p.m. ET. Options markets are pricing in a potential move of about ±6.4%, with positioning tilted to the upside as roughly 80% of whisper estimates point to a beat.
Earnings forecasts have been raised 29 times in recent weeks, compared with just five downward revisions, underscoring increasing confidence in Alphabet’s earnings outlook.
Wall Street expects Alphabet to deliver earnings of $2.64 per share, up 21.8% from a year earlier, while revenue is projected to rise 15.7% year over year to $111.1 billion. Cloud remains a standout performer, with Google Cloud Platform revenue forecast to grow more than 37% annually, driven by robust demand for AI infrastructure and enterprise offerings.
A meaningful earnings beat, paired with upbeat forward guidance, could propel the stock to fresh record highs as the search giant continues to unlock monetization from its expanding suite of AI initiatives and builds on accelerating cloud momentum.
GOOGL shares are trading near their 52-week high of $342.29 and remain above the 50-day moving average at $317.97. The stock is up about 8% year to date and has gained 66.3% over the past 12 months. From a technical perspective, the shares have held up well, consolidating above key support near $325 and setting up for a potential breakout above $350 if earnings exceed expectations.
Trade Setup:
Entry: $338–$340 (ahead of earnings)
Target: $350–$355 (approximately 5% upside)
Stop-Loss: $330 (around 2.4% downside risk)
Sell Call: Strategy
Strategy heads into its earnings release under markedly different conditions. The Michael Saylor–led company, which has transformed itself into the world’s largest corporate holder of Bitcoin, is facing mounting pressure as cryptocurrency markets turn volatile.
The firm holds roughly 712,647 Bitcoin, accumulated at an average cost of about $76,037 per coin, representing more than $54 billion at recent market prices. Over the weekend, however, Bitcoin fell below Strategy’s average purchase price for the first time since October 2023, pushing the company’s holdings into an unrealized loss position and heightening investor concerns.
Strategy is scheduled to report its fourth-quarter earnings after the market closes on Thursday at 4:20 p.m. ET.
Wall Street is forecasting a loss of $0.08 per share on revenue of $118.8 million, though investors’ attention will center less on the core figures and more on the company’s Bitcoin treasury and any related impairment charges.
In the third quarter of 2025, the company booked a massive $17.44 billion in unrealized losses tied to cryptocurrency price declines, and the prospect of similar write-downs could pressure fourth-quarter results as well.
Even with the stock trading at an estimated 0.7x the value of its Bitcoin holdings, Strategy’s elevated beta of 3.4 magnifies downside exposure in a risk-off market environment.
MSTR shares have plunged 55.3% over the past year and are currently trading around $149.71, just above their 52-week low of $139.36. From a technical standpoint, the stock has fallen below both its 50-day and 200-day moving averages, while momentum indicators point to oversold conditions without signaling a decisive reversal.
Elevated short interest and negative sentiment leave the shares vulnerable to additional downside, particularly if the earnings report points to slower Bitcoin accumulation or greater dilution from further capital-raising efforts.
What’s going on? On Monday, Needham upgraded AppLovin Corp (NASDAQ: APP) to Buy and set a $700 price target.
TL;DR: Needham turns bullish, lifting its 2026 ecommerce revenue forecast to $1.45B.
The full picture: Needham raised its rating after a deeper dive into AppLovin’s ecommerce business, strengthening its conviction in accelerating revenue growth by 2026—particularly as the stock has pulled back from last month’s highs. The firm views the recent weakness as a market mispricing, arguing that opportunistic advertisers are stepping in despite typical seasonal softness.
Needham increased its 2026 ecommerce revenue estimate to $1.45B from $1.05B, citing upcoming self-service launches that should expand the advertiser base and drive higher spending. This, in their view, could overpower usual Q1 seasonality and deliver sequential growth.
Even with the higher forecast, Needham sees further upside in a bull-case scenario—especially if AppLovin’s ecommerce trajectory begins to resemble TikTok’s rapid monetization curve, reinforcing the idea that in markets, replication can be a powerful catalyst for outsized returns.
American Axle
What’s going on? On Tuesday, BWS Financial launched coverage of American Axle & Manufacturing with a Buy rating and set a $17 price target.
TL;DR: AXL is merging with Dowlais, and the shares appear undervalued.
The bigger picture: American Axle & Manufacturing Holdings Inc. (AXL), which plans to rebrand as Dauch Corp. (NYSE: AXL), is nearing completion of its merger with Dowlais Group plc (DWLAF). According to BWS Financial, the deal will significantly diversify the business—expanding its automaker customer base, strengthening its global footprint, and broadening its product offerings. The combined company is expected to become a major force among auto suppliers, able to capitalize on greater scale, geographic reach, and meaningful operating efficiencies.
These advantages are projected to drive a sharp increase in free cash flow starting in 2027.
At the same time, AXL is adjusting its pricing and bidding approach to improve gross margins. While this strategy may weigh on revenue in 2025, it should support stronger cash generation. The analyst believes this near-term revenue softness has pushed the stock into deeply discounted territory.
Despite trading at valuation levels often associated with distressed companies, AXL remains profitable and continues to generate free cash flow. For investors searching for overlooked value opportunities, BWS Financial sees a compelling disconnect between fundamentals and the current share price.
Applied Materials
What happened? On Wednesday, Mizuho raised its rating on Applied Materials (NASDAQ: AMAT) to Outperform and lifted its price target to $370.
TL;DR: Mizuho expects stronger wafer fab equipment (WFE) growth and rising global capex to power further upside for AMAT.
The full story: Mizuho upgraded AMAT from Neutral with a $275 target to Outperform at $370, citing a much more favorable industry backdrop. As the world’s second-largest supplier of wafer fab equipment, Applied Materials is seen as a prime beneficiary of a powerful upswing in semiconductor capital spending across the U.S., Taiwan, and Japan.
The bank points to sharply improving WFE forecasts, with 2026 estimates now projected to jump 13% year over year, followed by another 12% increase in 2027—a dramatic acceleration compared with earlier expectations and a meaningful boost to AMAT’s earnings potential.
Core growth drivers include foundry and logic, which account for about 65% of revenue, supported by TSMC’s substantially higher capital spending plans for 2026–2028 versus 2023–2025, alongside a more constructive outlook for Intel’s tool purchases in 2026. On the memory side, DRAM—roughly 30% of revenue—stands to benefit from strong demand for high-bandwidth memory.
Concerns around China have also eased, as about 70% of AMAT’s revenue now comes from outside China, where growth is accelerating. With global WFE momentum building and major customers like TSMC and Intel increasing investment, Mizuho believes the setup strongly favors AMAT and justifies the Outperform call.
First Solar
What happened? On Thursday, BMO Capital Markets cut its rating on First Solar (NASDAQ: FSLR) to Market Perform and set a $263 price target.
TL;DR: BMO turns cautious on FSLR, citing competitive risks from Tesla and concerns that rising capacity could pressure module pricing.
The full story: BMO downgraded First Solar amid growing uncertainty around Tesla’s expanding solar ambitions. The firm questions how much of Tesla’s excess module capacity—given its proven ability to scale clean-energy platforms such as energy storage systems and inverters—could spill into the broader market rather than being used internally.
With U.S. utility-scale solar demand running at roughly 45–50 GW per year, First Solar’s 14.1 GW of capacity, alongside T1 Energy’s 2.1 GW (with potential expansion to 5.3 GW), could face intensified competition if Tesla moves toward its stated 100 GW capacity goal. Such a scenario could weigh on long-term module pricing or leave a persistent overhang on FSLR shares.
BMO notes that the bullish case for First Solar depends heavily on elevated U.S. module average selling prices (ASPs). However, after the stock’s 56% gain over the past 12 months, valuation now implies module pricing of about $0.29 per watt, even as backlog pricing sits closer to $0.30–$0.33 per watt. Earlier analysis suggested prices could climb into the high-$0.30s or low-$0.40s if Section 232 tariffs on polysilicon imports tightened supply—each $0.01 per watt increase potentially adding $23 per share in value.
That upside, however, may be tempered by a recent presidential order on semiconductors that includes exemptions for data centers, an area where Tesla could focus its solar deployments, potentially easing pressure from polysilicon-related restrictions.
Taken together—rising industry capacity, uncertain pricing durability, and Tesla’s looming presence—BMO sees limited justification for sustained pricing optimism and adopts a more neutral stance on First Solar.
Broadcom Inc.
What happened? On Friday, Wolfe Research upgraded Broadcom (NASDAQ: AVGO) to Outperform and raised its price target to around $370–$400.
TL;DR: Stronger expectations for TPU-driven AI growth led Wolfe to lift its outlook for Broadcom.
The full story: Wolfe Research upgraded Broadcom to Outperform, citing accelerating demand tied to the AI buildout—particularly from Google’s Tensor Processing Units (TPUs). Channel checks suggest TPU deployments could reach 7 million units by 2028, and Alphabet’s decision to offer TPUs to external customers is seen as creating a credible alternative to Nvidia’s ecosystem. Wolfe views Broadcom as the primary beneficiary of this shift.
As a result, the firm raised its long-term forecasts, projecting CY27 revenue of $154.5 billion and EPS of $16, implying a valuation of roughly 21x earnings. Additional upside could come from AI accelerator (XPU) programs at companies like Meta and OpenAI that are not yet fully reflected in estimates.
Wolfe also revised its AI ASIC revenue outlook higher, estimating $44 billion in CY26 based on 3.3 million TPU shipments, rising sharply to $78.4 billion in CY27 on 5.1 million units. TPUs are expected to account for the bulk of this growth, with other AI projects contributing smaller portions. Networking revenue is forecast to jump 75% to $15.1 billion in CY26, followed by 55% growth in CY27, while non-AI semiconductor and software segments are expected to remain relatively stable.
From a valuation standpoint, Wolfe argues the stock remains attractive. Its base case of $16 EPS in CY27 suggests room for multiple expansion, while a bullish scenario—with AI revenue doubling again—could push earnings toward $18 per share. Wolfe’s upper-end target reflects a valuation below Broadcom’s three-year average multiple of around 25x since the AI cycle began, reinforcing its positive stance on the stock.
Major stock indexes slipped slightly as markets weighed President Trump’s pick of Kevin Warsh to replace Fed Chair Jerome Powell in May.
Verizon jumped on robust subscriber additions and optimistic guidance for 2026, while American Express declined even after topping revenue expectations.
Silver tumbled more than 17% in a sharp reversal from record levels, sparking broad profit-taking across precious metals.
Even with Friday’s retreat, the three main benchmarks still delivered solid gains for January, rounding off a strong opening to 2026.
The Dow Jones Industrial Average fell about 200 points on Friday, down 0.2%, as investors assessed President Donald Trump’s nomination of former Fed Governor Kevin Warsh to replace Jerome Powell as Federal Reserve Chair when his term ends in May. The S&P 500 also slipped 0.2%, while the Nasdaq Composite declined 0.3%.
Even so, January ended on a strong note overall, with all three major indexes posting solid monthly gains: the Dow climbed 2.1%, the S&P 500 rose 1.8%, and the Nasdaq advanced 1.9%.
Warsh nomination puts an end to months of Fed leadership speculation
President Trump announced on Friday morning that Kevin Warsh would be his choice to lead the Federal Reserve, bringing an end to months of uncertainty over who would succeed Jerome Powell. Warsh, 55, served on the Fed’s Board of Governors from 2006 to 2011 and played a prominent advisory role during the 2008 financial crisis.
Investors generally see Warsh as a relatively hawkish nominee who would favor lower interest rates, though likely with more restraint than some other contenders. His nomination now heads to what could be a difficult Senate confirmation process, as Republican Senator Thom Tillis has warned he will block Fed nominees until a Justice Department investigation into Powell is concluded.
Verizon jumps after posting record subscriber additions
Verizon Communications Inc. (VZ) stood out among Dow stocks, jumping 6.6% after reporting its strongest quarterly subscriber growth since 2019. The telecom operator added 616,000 postpaid wireless phone customers in the fourth quarter, well above forecasts of about 417,000.
The surge was driven by new CEO Dan Schulman’s aggressive promotions, including offers such as four phone lines for $100 a month, which proved popular with holiday shoppers. Investors were further encouraged by Verizon’s 2026 outlook, as the company projected adjusted earnings of $4.90 to $4.95 per share, comfortably exceeding consensus estimates of $4.76.
Financial shares pull back amid mixed earnings results
American Express Company (AXP) slid 3.1% after posting fourth-quarter results that broadly met expectations but failed to excite investors. The payments firm reported earnings of $3.53 per share on revenue of $18.98 billion, marking a 10.5% year-over-year increase. However, sentiment was dampened by higher credit loss provisions and rising costs, despite management lifting its 2026 outlook above consensus and announcing a 16% dividend hike.
Elsewhere in the sector, Visa Inc. (V) fell 2.3% even after beating both revenue and earnings forecasts, while International Business Machines (IBM) declined 1.6%, giving back part of its roughly 5% rally following earnings the previous day.
Big oil companies top forecasts as production hits record levels
Chevron Corporation (CVX) edged up 0.5% after delivering quarterly earnings that topped expectations, despite weaker oil prices weighing on the broader energy sector. The company highlighted record output from the Permian Basin and its offshore Guyana assets.
ExxonMobil Corporation (XOM) also surpassed profit estimates but slipped 0.8% as both oil majors faced pressure from a global supply surplus that has driven crude prices lower. Management at both companies stressed strong cost discipline and resilience, noting they can remain profitable even with oil at $35 a barrel, although full-year profits have fallen from prior peaks.
Apple slips even after posting a blockbuster iPhone quarter
Apple Inc. (AAPL) slipped 1.2% on Friday even after delivering fiscal first-quarter results that far exceeded expectations. The company reported revenue of $143.8 billion, a 16% year-over-year increase, fueled by a 23% surge in iPhone sales to $85.27 billion. CEO Tim Cook described demand for the iPhone 17 lineup as “simply staggering,” with Apple setting record revenues across all geographic regions. The company’s installed base climbed to more than 2.5 billion devices, up from 2.35 billion a year earlier.
Despite the standout performance, some investors chose to lock in profits after Apple’s recent rally. Broader weakness in the technology sector also weighed on the stock, following a sharp 10% drop in Microsoft shares a day earlier after the company issued disappointing cloud guidance.
Silver tumbles sharply in a dramatic pullback from record highs
Silver prices plunged as much as 21% on Friday, pulling back sharply from record highs in what analysts described as the metal’s steepest one-day decline in 14 years. After surging to an all-time peak of $122 an ounce on Thursday, heavy profit-taking sparked a broad selloff across precious metals.
Even with the abrupt correction, silver was still poised to finish the month up more than 30%, underpinned by heightened geopolitical risks, a weaker dollar, and tight physical supply. Trading volumes in the iShares Silver Trust (SLV) spiked as retail investors who had chased the rally rushed to exit positions. Gold also eased, retreating from recent record levels above $5,500 an ounce.
This may be the single most important chart in global bond markets right now.
Japanese investors rank among the world’s largest exporters of capital. Collectively, they hold a substantial share of European sovereign debt and U.S. Treasuries, with ownership running into the trillions of dollars. However, the economics underpinning these investments may soon begin to break down.
If that happens, Japan could see a meaningful repatriation of capital—away from foreign bond markets and back into domestic fixed-income assets.
The consequences for both global bond yields and currency markets would be significant. To understand why, it helps to look at the basic math.
The chart compares the 30-year Japanese government bond yield (blue) with the hedged yield on the 30-year U.S. Treasury (orange), adjusted for USD/JPY currency-hedging costs. The scenario assumes the Bank of Japan gradually lifts policy rates toward 1.75%, while the Federal Reserve cuts rates to around 3% over time.
Note how the two yields are now converging.
At current levels, Japanese investors gain little—if any—advantage from purchasing 30-year U.S. Treasuries on a currency-hedged basis versus simply holding long-dated Japanese government bonds at home. The picture becomes even more compelling when considering a longer-standing behavior.
For years, Japanese investors have also allocated heavily to foreign bonds without hedging currency risk—and for a clear reason.
The prevailing assumption was that the yen would continue to depreciate, allowing Japanese investors to benefit not only from higher foreign yields but also from favorable FX moves.
Earn higher yields in foreign bond markets
Gain additional returns from yen depreciation
With the United States signaling its willingness to prevent further yen weakness, and Japanese bond yields having risen sharply, this long-standing equation no longer holds.
Should Japanese investors begin to scale back capital outflows to overseas bond markets, the ripple effects across global bond yields and currency markets could be substantial.
A sharp pullback in Microsoft (MSFT) has cascaded into a broader market correction. While the company beat earnings expectations on both the top and bottom lines, investors were disappointed by slower cloud performance and higher-than-anticipated capital expenditure plans. Microsoft shares have fallen 11.8% on the day (-12.3% YTD, -4.1% LTM), dragging the broader technology sector lower.
The NASDAQ slid 2.3%, with semiconductor stocks posting similar losses. The Magnificent Seven index declined 1.6%, pulling the S&P 500 down 1.3%, although the equal-weighted S&P slipped just 0.3%. The Dow Jones Industrial Average fell 0.4%, while the Russell 2000 dropped 1.1% in sympathy. Market volatility picked up, with the VIX jumping to 19.4.
Adding to the pressure, precious metals sold off, with gold down 2.2% and silver falling 3.5%. By contrast, copper surged 3.4% to a fresh all-time high of $6.58. Crude oil rallied 3.7% to $65.20 per barrel—after briefly touching $66.50—marking a gain of more than 10% over the past week amid rising risks of conflict involving Iran, the highest level since June 2025. Natural gas and gasoline prices also moved higher.
Risk-off sentiment was further evident in cryptocurrencies, with Bitcoin sliding 5% to below $85,000, its lowest level in a year.
Bond markets remained relatively calm. The U.S. 2-year yield eased 2 basis points to 3.55%, while the 10-year slipped 1 basis point to 4.23%. International yields, including those in Japan, were largely unchanged, and the U.S. dollar index was flat on the session.
Overall, the market damage remained concentrated in technology and basic materials. Energy stocks advanced, and communication services outperformed, supported by strength in Meta Platforms (META). Meta shares jumped 7.6% following solid earnings beats and a well-received conference call, lifting the stock to gains of 9% year-to-date and 6.3% over the past 12 months. Meanwhile, consumer staples, utilities, industrials, financials, and real estate sectors all traded in positive territory.
This selloff increasingly looks like a textbook buying opportunity, with early signs of a rebound already emerging across the major equity indexes. Another factor weighing on sentiment is the renewed risk of a government shutdown, which is especially challenging given the ongoing data blackout following last year’s record-length shutdown.
While the recent swing—from the S&P 500 touching 7,000 just yesterday to bottoming near 6,870 today—represents a level of volatility that has unsettled some investors, the fundamental backdrop of the economy remains solid. Volatility has clearly picked up, but the broader trend continues to point higher.
After spending months in the doldrums, Meta Platforms appears to have reshaped the narrative around its business. The Magnificent Seven stock slumped 11% in October following its third-quarter earnings release, as investors grew increasingly concerned about runaway spending on artificial intelligence.
That skepticism now looks to be fading after Meta’s fourth-quarter 2025 earnings report, released on Jan. 28. Shares climbed roughly 8% in after-hours trading by 7:00 p.m. ET, prompting investors to rethink the company’s outlook, with growth prospects increasingly overshadowing prior worries about spending.
Meta delivers strong earnings beat and upbeat guidance
In the fourth quarter, Meta reported revenue of $59.9 billion, representing growth of about 24% and comfortably exceeding expectations of $58.3 billion, or 21% growth. Adjusted earnings per share (EPS) came in at an impressive $8.88, up nearly 11% year over year and well above the consensus estimate of $8.16.
The standout highlight, however, was Meta’s guidance for the first quarter of fiscal 2026. At the midpoint, the company forecasts revenue of $55 billion, far surpassing analysts’ expectations of $51.3 billion.
This outlook implies quarterly revenue growth of roughly 30%, which would mark Meta’s fastest expansion rate since the third quarter of 2021. Such an acceleration is precisely what investors had been hoping for and offers further confirmation that the company’s investments in artificial intelligence are beginning to pay off.
Among Meta’s underlying performance metrics, growth in ad impressions delivered was particularly notable. The measure, which tracks the number of ads shown across Meta’s platforms, rose 18% during the quarter—its strongest pace in nearly two years. Chief Financial Officer Susan Li attributed this performance to robust user engagement and growth, highlighting that watch time on Instagram Reels increased 30% year over year, signaling a meaningful rise in platform engagement.
Stronger engagement is an encouraging signal for Meta, indicating that its AI-driven recommendation and ranking algorithms—responsible for determining what content users see and when—are becoming more effective. As these systems improve, users spend more time across Meta’s platforms, enabling the company to serve a greater volume of advertisements.
Markets shrug off higher-than-expected spending outlook
Expectations of sharply higher capital spending have been the key drag on Meta’s shares in recent months. Against that backdrop, the company’s latest CapEx guidance came in well above even elevated market expectations.
Meta now projects capital expenditures of $115 billion to $135 billion in 2026, compared with Wall Street estimates of roughly $110 billion. At the midpoint, this implies a 73% jump from 2025 CapEx of $72.2 billion.
In addition, Meta guided for total expenses of $162 billion to $169 billion in 2026, materially higher than consensus forecasts of around $150 billion.
Reading between the lines, however, reveals a crucial detail in Meta’s 2026 outlook. Management stated that “despite the meaningful step up in infrastructure investment, in 2026, we expect to deliver operating income that is above 2025 operating income.”
Since revenue equals operating income plus total expenses, this guidance allows for an implied revenue estimate. Meta generated $83.3 billion in operating income in 2025, and using the upper end of its 2026 expense guidance at $169 billion implies potential full-year revenue of roughly $252.3 billion.
That figure would represent about 25.5% growth from Meta’s 2025 revenue of $201 billion—well above the approximately 18.3% growth rate analysts had been projecting for 2026.
Growth eclipses spending concerns as Meta’s AI strategy gains traction
Although Meta’s expense guidance initially appeared to be the primary concern for investors, the company ultimately rose above those figures with exceptionally strong growth projections. While critics continue to argue that Meta has yet to produce a best-in-class general-purpose AI model, the company’s financial performance tells a compelling story.
Meta’s AI strategy is proving effective, driving faster growth in its core business of social media advertising. After a challenging stretch, Meta Platforms appears to have delivered precisely what was needed to restore investor confidence.
U.S. stock index futures slipped slightly on Thursday evening after Wall Street ended mostly lower, as weaker-than-expected results from Microsoft rekindled doubts over the returns on heavy AI spending, while investors absorbed a wave of other corporate earnings.
S&P 500 futures dipped 0.3% to 6,975.0 points, Nasdaq 100 futures declined 0.3% to 25,916.75 points, and Dow Jones futures also fell 0.3% to 49,049.0 points by 19:36 ET (00:36 GMT).
Wall Street dips as Microsoft’s slide weighs; Apple earnings take center stage
The S&P 500 and NASDAQ Composite closed Thursday’s regular session on a weak note, with technology stocks among the session’s biggest laggards.
Shares of Microsoft Corporation (NASDAQ:MSFT) plunged 10% after the company’s quarterly earnings highlighted slower cloud revenue growth and record AI-related spending, failing to reassure investors about near-term returns.
Microsoft’s selloff dragged down broader technology sentiment, with software peers including ServiceNow Inc (NYSE:NOW) and SAP (NYSE:SAP) also posting steep declines following disappointing earnings and outlooks.
Investors were also focused on Apple Inc.’s (NASDAQ:AAPL) earnings released after the close, which topped expectations as strong iPhone demand and a recovery in Greater China boosted both revenue and profit.
Apple reported roughly $143.8 billion in revenue and earnings per share well above consensus estimates, sending its shares up nearly 1% in after-hours trading.
SanDisk jumps on earnings beat; Trump backs spending agreement
Elsewhere on the earnings front, shares of SanDisk Corporation (NASDAQ:SNDK) jumped 16% in after-hours trading after the storage-chip maker posted a strong profit beat and lifted its outlook, driven by stronger-than-expected demand for data-center and AI-focused memory products.
By contrast, Visa (NYSE:V) shares edged lower despite surpassing first-quarter earnings and revenue forecasts, as investors focused on weaker-than-expected transaction volumes and ongoing caution surrounding broader consumer spending.
On the political side, President Donald Trump voiced support for a bipartisan spending agreement crafted by Senate Republicans and Democrats aimed at avoiding an imminent government shutdown, expressing his backing on Truth Social and calling for cooperation.
The deal would provide funding for most federal agencies while deferring divisive immigration issues for future negotiations.
The S&P 500 ended the session largely unchanged ahead of a largely uneventful Federal Reserve meeting, which offered little new information beyond reaffirming that the U.S. economy remains in fairly solid condition. The tone of Chair Jay Powell’s press conference also suggested that, at least while he remains at the helm, there are likely to be few—if any—interest-rate cuts in the near term.
Earnings released after the close were mixed. Microsoft (NASDAQ: MSFT) fell roughly 6.5%, while Meta Platforms (NASDAQ: META) surged about 7.5%. From an options standpoint, both stocks had bearish setups heading into earnings, with elevated implied volatility and heavy call-delta positioning at higher strike levels. Following the results, implied volatility declined, causing higher-strike calls to lose value and prompting the unwinding of hedges.
For Meta, the key technical level was $700, which the stock managed to break through, at least initially. Revenue guidance significantly exceeded expectations, leading the market to overlook higher-than-expected capital expenditures for now. The key question will be whether Meta can hold above the $700 level once regular trading resumes.
For Microsoft, the key level was $500, which the stock failed to break despite reporting better-than-expected results. Investor sentiment was weighed down by weaker-than-expected growth in its Azure cloud business.
For Tesla (NASDAQ: TSLA), the setup ahead of earnings was more mixed, but $450 clearly stood out as the key level to break. So far, the stock has tested that threshold but has been unable to hold above it.
After-hours moves can be unpredictable, which is why it often makes sense to wait and see how price action develops during regular trading hours. How the CDS market trades tomorrow may be even more telling, potentially offering a clearer read on the true implications of the earnings reports.
For now, near-term rate expectations appear more closely tied to oil than to any other factor. Crude has broken out and moved above its 200-day moving average, a technical development that could set the stage for a rally toward $65 in the near term.
Whether looking at the 2-year or 10-year Treasury yield, the correlation with oil prices since late 2022 has been remarkably strong. As a result, if oil continues to move higher, it would likely put upward pressure on interest rates as well. In that sense, oil may have been the final missing link in the case for higher rates.
U.S. stock index futures were largely unchanged late Tuesday as investors remained cautious ahead of the Federal Reserve’s interest rate decision and a busy earnings schedule featuring major technology leaders.
S&P 500 futures edged up 0.1% to 7,017.50, while Nasdaq 100 futures rose 0.3% to 26,155.75 by 20:10 ET (00:10 GMT). Dow Jones futures were flat at 49,154.0.
S&P 500 closes at a record as Dow edges lower on Medicare concerns
During Tuesday’s regular session, the S&P 500 climbed 0.4% to a record closing high, extending its advance as investors rotated back into growth stocks and responded positively to broadly solid earnings results. Gains in technology shares led the move, pushing the benchmark to a fresh peak.
The Nasdaq Composite jumped 0.9%, driven by strength in megacap stocks.
Meanwhile, the Dow Jones Industrial Average fell 0.8%, weighed down by steep declines in healthcare and insurance shares. Major health insurers came under pressure after the U.S. government released a Medicare Advantage payment plan that the market perceived as less favorable than anticipated.
Markets focus on Fed decision and megacap earnings
Investor focus has shifted squarely to the Federal Reserve, which kicked off its two-day policy meeting on Tuesday. The central bank is widely expected to leave interest rates unchanged when it delivers its decision on Wednesday, with markets pricing in a pause as policymakers assess easing but still-elevated inflation alongside signs of steady economic growth and a resilient labor market.
Close attention will be paid to Fed Chair Jerome Powell’s remarks for indications on how long rates may remain at current levels and when eventual cuts could begin.
“The key will be any dissent and the Fed’s communication, particularly around questions of central bank independence,” ING analysts said, adding that the decision will also be overshadowed by President Trump’s upcoming nomination of a new Fed chair.
Corporate earnings are another major catalyst this week, with four members of the so-called “Magnificent Seven” technology group set to report. Tesla, Meta Platforms and Microsoft are scheduled to post results on Wednesday, followed by Apple on Thursday.
Given their heavy weighting in major equity indexes, guidance from these companies on artificial intelligence investment, cloud demand and consumer trends is expected to play a key role in shaping near-term market direction.
The year ahead offers a clear divide between bullish and bearish outcomes for investors. Will 2026 deliver another period of above-average returns, or mark a turning point toward disappointment? Optimists contend that the foundations for a sustained rally remain intact. A robust technology cycle, heavy corporate investment, and supportive policy settings all suggest further upside. Pessimists, however, warn that key growth drivers are losing momentum, market leadership has become uncomfortably narrow, and underlying economic stress is increasingly evident.
After a strong 2025, investors are entering a shifting market environment. Liquidity is still plentiful, but concerns over stretched valuations, labor-market pressure, and consumer resilience are mounting. Much hinges on how long optimism can outweigh economic realities, and whether expected gains from artificial intelligence and capital spending arrive quickly enough to counteract the drag from debt burdens, interest costs, and widening inequality.
Sentiment remains broadly constructive, though far from unanimous. Equity strategists are split, while bond markets reflect expectations of rate cuts alongside rising recession risk. Fiscal stimulus may postpone a downturn, but it also exacerbates longer-term imbalances. For investors, the central challenge is maintaining objectivity. Both the bullish and bearish narratives are credible, and timing will be decisive. In fact, 2026 could validate elements of both cases, making adaptability the most valuable strategy.
Below, we examine the bullish and bearish scenarios for 2026 in detail, assessing the macroeconomic and market forces behind each view. By translating these dynamics into practical portfolio considerations, investors can prepare for either outcome. Ultimately, success in 2026 will hinge less on forecasting accuracy and more on disciplined risk management.
The Bullish Case
The bullish thesis rests on several core pillars: a fresh surge in technology-led investment, accommodative fiscal policy, improving liquidity conditions, and the ongoing strength of both corporate balance sheets and consumer activity. Together, these forces have propelled markets higher, and proponents argue they will continue to support gains through 2026.
Central to the bull case is the rise of a potentially transformative technology cycle driven by artificial intelligence and large-scale infrastructure upgrades. Unlike earlier tech booms fueled primarily by optimism, this cycle is already translating into substantial capital spending. The so-called “Magnificent Seven” have collectively pledged over $600 billion toward data centers, semiconductor capacity, and AI-related services. This investment is rippling across software, energy, and industrial supply chains. Should the anticipated productivity improvements materialize, corporate earnings could accelerate, providing fundamental support for elevated valuations.
Fiscal policy is also positioned to support growth. Under a Trump-led administration, proposed tax cuts and direct transfers are expected to bolster both corporate activity and consumer spending. While $2,000 stimulus checks may not appear dramatic on their own, they can meaningfully lift short-term consumption and provide relief to small businesses. When paired with income tax reductions, these initiatives create a favorable backdrop for GDP growth and market sentiment. As recent history shows, following the 2022 market correction and widespread recession concerns, ongoing fiscal support has continued to play a stabilizing role in economic expansion.
The monetary environment is also turning more supportive for bulls. Quantitative tightening concluded in December 2025, and the Federal Reserve has since shifted toward what many describe as “QE Lite,” combining rate cuts with monthly purchases of roughly $40 billion in short-term Treasuries. Officially framed as “reserve management,” the objective is to maintain ample liquidity within the financial system. As interest rates decline, credit conditions are likely to loosen, providing a favorable backdrop for risk assets. Rising liquidity has historically supported higher equity valuations, with technology and growth stocks typically benefiting the most from this dynamic.
Corporate actions further reinforce the bullish narrative. Share buyback authorizations are projected to reach a new record of more than $1.2 trillion in 2026. Although often framed as a “capital return strategy”—a characterization that misses the point—buybacks have shown a strong correlation with equity market performance. Notably, since 2000, corporate repurchases have accounted for nearly all net equity demand, underscoring their outsized influence on stock prices.
Importantly, the notion that buybacks signal management’s confidence in future earnings is misleading. In practice, repurchases are frequently used as a form of financial engineering to boost per-share results and beat Wall Street expectations. This dynamic is likely to intensify in 2026, further supporting reported earnings growth and reinforcing the bullish case.
Finally, deregulation tied to the so-called “Big Beautiful Bill” is expected to relax capital requirements for banks, enabling them to hold a greater amount of collateral. While this should support the Treasury market, it also expands overall lending capacity. Much of that capacity is likely to flow into leverage for hedge funds and Wall Street trading desks, as looser regulatory constraints encourage greater risk-taking.
The bullish thesis ultimately rests on a reinforcing feedback loop: innovation spurs capital investment, rising investment lifts earnings, policy measures inject liquidity, and investors respond by increasing risk exposure. As long as each link in this chain remains intact, the upward trend can persist.
The Bearish Case
The bearish case starts with a key observation: many of the forces that powered the 2025 rally are now fading or already fully reflected in prices. Elevated valuations, softening economic data, and rising speculative excesses suggest that current market momentum may be masking deeper structural vulnerabilities. With that in mind, it is worth examining several of these risks more closely.
One of the most visible concerns is market concentration. In 2025, the bulk of equity gains came from just 10 companies on a market-capitalization-weighted basis, a dynamic amplified by the continued shift into passive ETF investing.
Passive investing has evolved from a niche approach into the dominant force shaping equity markets. Index funds and ETFs now represent more than half of U.S. equity ownership. Because these vehicles allocate capital according to market capitalization rather than valuation, fundamentals, or business quality, the largest companies attract a disproportionate share of inflows. This has created a powerful feedback loop in which rising prices draw in more capital, and those inflows, in turn, push prices even higher.
This narrow leadership is inherently fragile. Should investor flows into ETFs reverse, a disproportionate share of selling—roughly 40%—would be concentrated in the same 10 stocks. History shows that when market performance depends on a small handful of names, volatility tends to increase and drawdowns can be sharp.
Valuations present another clear risk. Price-to-earnings multiples on the S&P 500 remain near cycle peaks, leaving little room for error. Growth assumptions are ambitious, and even modest earnings disappointments could trigger a meaningful repricing. While enthusiasm around AI has driven a surge in investment, much of this spending is circular—companies are investing in AI largely to produce and sell AI-related products. That dynamic may prove self-limiting over time, particularly if end demand weakens or costs begin to outstrip returns.
A significant portion of the current investment cycle is also being financed with debt, as companies borrow to fund capital spending, repurchase shares, and sustain dividend payouts. If interest rates remain high or credit conditions deteriorate, rising debt-servicing costs could quickly erode earnings gains.
The broader economic risk is that the reallocation of capital toward technology and automation could sideline large segments of the workforce. While the buildout of data centers may employ thousands during construction, only a fraction of those jobs—perhaps a few hundred—remain once operations begin. Over time, this dynamic could weigh on employment growth, increase the risk of demand destruction, and may already be showing early warning signs.
This dynamic underpins the concept of a “K-shaped economy.” While high-income households and asset owners continue to prosper, lower-income consumers are facing increasing strain. Consumption patterns are diverging as financially pressured households cut back, leaving the top 20% of earners responsible for nearly half of total consumer spending. Signs of stress are already emerging, with rising auto loan and credit card delinquencies, stagnant real wages for many workers, and persistently high costs for housing and essential goods.
At the same time, risks within the credit system—particularly in private markets—are growing. Private credit has expanded rapidly in recent years, yet limited transparency makes it difficult to fully assess systemic vulnerabilities. Regulators have begun to pay closer attention, and default rates in middle-market lending are climbing. Should these stresses intensify, the fallout could extend across banks, hedge funds, and pension portfolios.
The bearish argument is not one of an imminent crash, but of growing fragility. Beneath the headline gains, the market appears increasingly exposed to earnings disappointments, tighter credit conditions, and weakening consumer demand.
The key takeaway is that 2026 may validate elements of both the bullish and bearish narratives. Preparation, rather than prediction, will be essential.
Navigating Whatever Comes Our Way
Investors should treat 2026 as a year in which both the bullish and bearish narratives may ultimately be validated. In the first half, bullish momentum is likely to persist, supported by strong sentiment, ample liquidity, and continued growth in corporate investment. Optimism around AI, fiscal support, and a potential pause in monetary tightening could propel equity indexes higher.
By the second half, however, underlying vulnerabilities may begin to surface. Elevated valuations increase sensitivity to earnings disappointments, while widening economic inequality could weigh on the outlook for consumer demand and corporate revenues. Should these pressures intensify, market sentiment could shift rapidly.
Navigating such a divided year will require a tactical approach—participating in early upside while avoiding excessive exposure to risks that may materialize later in the year.
Early 2026: Participate in Momentum, but Manage Exposure
Overweight sectors poised to benefit from capital spending and ample liquidity, including technology, industrials, and energy.
Prioritize high-quality growth companies with durable earnings and strong cash-flow generation, rather than momentum-driven narratives.
Implement trailing stop-loss strategies to protect gains if market sentiment shifts.
Use periods of volatility to add selectively, while scaling back position sizes as valuations become more stretched.
Avoid excessive concentration in AI-related stocks, even during strong rallies, as crowding increases dispersion and downside risk.
Mid-to-Late 2026: Emphasize Defense and Cash-Flow Stability
Gradually rotate toward defensive, value-oriented sectors such as healthcare, consumer staples, and utilities.
Increase exposure to dividend-paying companies with strong balance sheets and resilient cash flows.
Raise cash allocations or shift into short-duration Treasuries to preserve flexibility.
Allocate selectively to high-quality credit while reducing exposure to private credit and high-yield debt.
Monitor consumer credit conditions, labor-market trends, and bank earnings for early signs of financial stress.
Throughout the Year: Maintain Discipline and Objectivity
Adhere to valuation discipline regardless of shifts in market narratives.
Keep portfolios well diversified to withstand both volatility and sector rotation.
Let data—not headlines—drive allocation decisions.
Rebalance regularly, particularly if strong first-half performance leads to excessive concentration in certain sectors.
In 2026, tactical flexibility, risk awareness, and discipline are likely to matter more than adopting a purely bullish or bearish stance. It is a year in which both camps could be partially wrong. Markets rarely move in straight lines, but a sound investment process should remain consistent throughout.
The year ahead is likely to test investors with heightened volatility, as both the bullish and bearish arguments carry real weight. A new technology cycle may generate genuine economic momentum, yet it also introduces risks tied to elevated valuations, debt-fueled growth, and widening inequality. With markets effectively pricing in near-perfection, history suggests outcomes often fall short of expectations.
Whether 2026 delivers further gains or a sharp correction, performance will hinge on effective risk management. Avoid anchoring to any single narrative. Let data guide decisions, respect your signals, and remain willing to adjust as conditions evolve.
Ultimately, the objective is not to chase short-term returns, but to endure—and compound—across full market cycles.
Wednesday brings the FOMC meeting and Chair Powell’s press conference, and it wouldn’t be surprising if President Trump chose that moment—ideally around 2:30 p.m. ET—to announce his pick for the next Fed chair. Such timing would dominate headlines, catch financial media off guard, and inject maximum uncertainty into markets.
That said, the Fed is not expected to cut rates at this meeting, which should keep the event relatively uneventful. In the bigger picture, what the Fed does between now and May may prove less important, particularly if a new chair is appointed and moves quickly toward easing.
Markets appear to be dialing back expectations for aggressive rate cuts. Current pricing suggests the fed funds rate settles near 3.25% by December, with little additional easing beyond that. To meaningfully shift those expectations, the nominee would likely need to be notably dovish—something markets already anticipate, given the widespread assumption that Trump will select a policy-leaning accommodator.
As a result, the risk of a breakout in the 2-year Treasury yield appears increasingly credible, with initial resistance near 3.62%. Beyond that, a move back toward the 4% level cannot be ruled out. From a technical perspective, the setup supports this view: the 2-year yield has formed multiple bottoms in recent months, and the RSI has begun to turn higher, signaling building upside momentum.
The direction of the 2-year yield may ultimately be more closely linked to oil prices. With inflation still hovering near 3% and crude having fallen to around $60 from highs in the $120s, the message is clear: a rebound in oil prices could quickly reignite inflation pressures. That dynamic likely explains why the price action in oil and the 2-year yield charts has begun to look strikingly similar.
The Bank of Japan once again chose to kick the can down the road, leaving rates unchanged and, in my view, offering little in the way of a clear policy roadmap. The yen’s strength on Friday appeared to be driven solely by reports of a possible “rate check” by the New York Fed on behalf of the U.S. Treasury—widely interpreted as a warning signal that currency intervention could be imminent. Perhaps the strategy is to keep markets stable until after the snap election in February. It’s hard to say, but it should be telling to see how markets react once Japan reopens on Monday.
The Korean won also strengthened notably against the U.S. dollar on Friday. In recent weeks, there has been growing chatter that the KRW had become excessively weak, so it’s likely the currency took the developments around the yen as a warning signal and moved to reprice accordingly.
The Korean won likely matters more than many investors realize, given the sizable exposure South Korean investors have built up in U.S. equities. That dynamic is probably one of the reasons the KRW has weakened so significantly in the first place—buying U.S. stocks requires selling won for dollars.
If the KRW begins to strengthen from here, it could start to put pressure on that trade. For investors who are unhedged on the currency side, a stronger won increases the risk of FX-related losses on their U.S. equity holdings, potentially prompting position adjustments.
Of course, this week also brings major earnings reports from Microsoft, Apple, Tesla, and Meta. From what I can see, all four stocks are currently sitting in positive gamma with positive delta positioning. Implied volatility typically builds into earnings because of the event risk, which sets up a familiar dynamic: unless a company delivers truly blowout results, the reaction can easily turn into a sell-the-news move. Once earnings are released, implied volatility collapses and hedges are unwound as delta decays, potentially putting pressure on the shares.
This week’s spotlight will be on the Fed’s FOMC meeting, Chair Powell’s press conference, major Big Tech earnings, and the looming U.S. government shutdown deadline. Apple is set to report earnings after Thursday’s close, with expectations rising for a beat-and-raise quarter. Meanwhile, Starbucks looks like a sell, as profit growth continues to slow and a weaker outlook is anticipated.
The stock market finished Friday on a mixed note, as both the S&P 500 and Nasdaq Composite recorded their second consecutive weekly declines.
The Dow Jones Industrial Average slipped 0.5% for the week, while the S&P 500 edged down about 0.4%. The tech-heavy Nasdaq fell by less than 0.1%, and the small-cap Russell 2000 lost 0.3%.
Looking ahead, the coming week is set to be a blockbuster, packed with potential market catalysts. Investors will be watching a crucial Federal Reserve policy meeting alongside a wave of earnings from major technology companies.
The Fed is widely expected to hold interest rates steady on Wednesday, though markets could see volatility as Chair Jerome Powell addresses the media in his post-meeting press conference.
Other key economic releases on the calendar include durable goods orders on Monday and The Conference Board’s Consumer Confidence Index for January on Tuesday. Friday will also bring the release of the December producer price index.
At the same time, earnings season ramps up sharply, with four members of the “Magnificent Seven” set to report this week. Microsoft (NASDAQ:MSFT), Tesla (NASDAQ:TSLA), and Meta Platforms (NASDAQ:META) are scheduled to announce results Wednesday evening, followed by Apple (NASDAQ:AAPL) after the close on Thursday.
These mega-cap names will be joined by a long list of other major companies, including IBM (NYSE:IBM), ASML (NASDAQ:ASML), SanDisk, Exxon Mobil (NYSE:XOM), Chevron (NYSE:CVX), Visa (NYSE:V), Mastercard (NYSE:MA), American Express (NYSE:AXP), SoFi Technologies (NASDAQ:SOFI), UnitedHealth Group (NYSE:UNH), Boeing (NYSE:BA), UPS (NYSE:UPS), Caterpillar (NYSE:CAT), General Motors (NYSE:GM), Verizon (NYSE:VZ), AT&T (NYSE:T), Starbucks (NASDAQ:SBUX), American Airlines (NASDAQ:AAL), RTX (NYSE:RTX), and Lockheed Martin (NYSE:LMT).
Adding to the uncertainty, Congress faces a Friday deadline to fund the government once again, with the risk of a prolonged shutdown looming.
No matter how markets ultimately move, I outline below one stock that could attract strong buying interest and another that may face renewed downside pressure. Keep in mind, this outlook is strictly for the week ahead, from Monday, January 26 through Friday, January 30.
Stock to Buy: Apple
Apple is scheduled to report earnings after the market closes on Thursday, with conditions lining up for a possible upside surprise. Wall Street is increasingly calling for a beat-and-raise quarter, as consensus forecasts point to double-digit revenue growth fueled by steady iPhone demand and continued expansion in services.
Options markets are pricing in a post-earnings move of roughly plus or minus 4%. Meanwhile, earnings expectations have turned more optimistic, with profit estimates revised higher 21 times in recent weeks versus just three downward revisions, according to InvestingPro data—underscoring the growing bullish sentiment surrounding Apple’s results.
Apple is expected to post adjusted earnings of $2.67 per share, representing an 11.2% increase from a year ago, while revenue is projected to climb 10.6% year over year to $137.5 billion. Analysts are looking to the iPhone and Services segments to lead the charge, pointing to double-digit growth and a strong pipeline of upcoming products, including a foldable iPhone and an AI-enhanced Siri.
With sentiment leaning bullish, the market appears positioned for a positive surprise. Price targets reaching as high as $350—implying roughly 41% upside—suggest that even a modest earnings beat could be enough to trigger a rebound in the stock.
So far in 2026, Apple shares have struggled, falling roughly 9% year to date to finish Friday at $248.04. The decline has mirrored broader volatility across the tech sector, alongside investor concerns that Apple’s AI strategy may be lagging rivals such as Alphabet.
That said, the recent pullback is shaping up as a potential buying opportunity. The stock is trading in deeply oversold territory, and while daily technical indicators still signal a “Strong Sell,” key support sits near $247.53 (pivot S1). A decisive move above resistance at $248.87 could open the door to a rebound toward $260 or higher, particularly if earnings guidance exceeds expectations.
Trade Setup:
Entry: $248 (pre-earnings)
Target: $265 (gain ~7%)
Stop-Loss: $240 (risk ~3%)
Stock to Sell: Starbucks
Starbucks is set to report earnings Wednesday morning, but unlike Apple, it heads into the week on much shakier footing. The coffee chain is grappling with slowing same-store sales in core markets, intensifying competition, changing consumer spending habits, and persistent cost pressures from labor and commodities.
Options markets are pricing in a post-earnings move of about plus or minus 6.4%, highlighting elevated downside risk. Sentiment has also turned notably bearish, with 17 of the 19 analysts tracked by InvestingPro cutting their EPS forecasts over the past three months ahead of the report.
Wall Street is bracing for a difficult quarter, with earnings per share projected to fall 15.9% year over year to $0.59, even as revenue is expected to edge up 2.5% to $9.62 billion.
Starbucks is also contending with intensifying competition from value-focused fast-food chains such as McDonald’s and Dunkin’, alongside pressure from local coffee shops. At the same time, its China growth narrative—once a major upside driver—has increasingly become a source of investor concern.
Looking ahead, expectations are building that CEO Brian Niccol may caution about continued near-term weakness, citing softer customer traffic, higher operating costs, and lingering uncertainty around the company’s turnaround efforts.
So far in 2026, Starbucks has been one of the stronger performers, climbing roughly 16% year to date and closing Friday at $97.62. However, the technical setup suggests the stock may be overextended heading into earnings.
Key pivot support lies near $96.25, with resistance around $97.84. A downside break below support could open the door to a pullback toward the $90 level if earnings or guidance disappoint.
Asian equities traded mixed on Monday as investors positioned ahead of a pivotal Federal Reserve policy meeting later this week and awaited major technology earnings, while Japanese shares fell sharply as the yen strengthened.
U.S. stock indexes ended last week lower, and futures linked to Wall Street declined further during Asian trading on Monday.
Nikkei tumbles as yen surges
Japan’s Nikkei 225 fell nearly 2%, deepening losses in exporter stocks as the yen strengthened sharply against the U.S. dollar amid speculation that Japanese and U.S. officials could intervene in currency markets to support the battered currency.
A firmer yen typically weighs on Japanese exporters’ overseas earnings, reinforcing risk-off sentiment in Tokyo. Meanwhile, gold surged to record highs as safe-haven demand intensified, underscoring investor caution ahead of major global policy decisions.
Elsewhere in Asia, South Korea’s KOSPI slipped nearly 1% after touching an intraday record of 5,023.76 points, while China’s Shanghai Composite was little changed.
Australia’s S&P/ASX 200 added 0.1%, while Singapore’s Straits Times Index fell 0.4%.
Indian markets were closed for a public holiday.
Fed meeting and packed tech earnings slate in focus
Traders are firmly focused on this week’s Federal Reserve meeting, where officials are broadly expected to keep interest rates unchanged, with markets closely watching for any adjustment in forward guidance on future policy moves as inflation pressures persist. Remarks from Fed Chair Jerome Powell and other policymakers later in the week are likely to influence sentiment across global risk assets.
Investor attention is also fixed on a packed earnings calendar, featuring quarterly results from most of the so-called “Magnificent Seven” technology heavyweights, including Microsoft Corp (NASDAQ:MSFT), Meta Platforms Inc (NASDAQ:META), Tesla Inc (NASDAQ:TSLA) and Apple Inc (NASDAQ:AAPL), whose results often set the tone for wider markets.
In Asia, major technology names such as Samsung Electronics (KS:005930) and SK Hynix Inc (KS:000660) are also scheduled to report earnings.
Caution around AI-related stocks remains, with technology shares underperforming in some sessions amid growing concerns over elevated valuations and rising costs.
Overall, market participants remain guarded ahead of key policy and earnings catalysts, weighing optimism over artificial-intelligence-driven long-term growth against near-term macroeconomic and currency risks.
Monday – U.S. markets were closed for Martin Luther King Jr. Day.
Ciena Corp
What happened? On Tuesday, Bank of America lowered its rating on Ciena Corp. (NYSE: CIEN) to Neutral and set a price target of $260.
TL;DR: Ciena shares have jumped on strong hyperscaler-driven growth, but BofA turned more cautious due to concerns over potential backlog risks.
What’s the full story? Ciena’s shares have surged to record levels, now trading at roughly 40x forward earnings, about twice its 10-year average, reflecting strong expectations for sustained growth. Demand from hyperscale cloud providers has driven a sharp acceleration in revenue growth—from around 8% to approximately 30% in 1Q26—supported by a $5 billion backlog that provides solid visibility into next year’s revenues.
Analysts believe the current cycle has durability, fueled by rapid expansion in scale-across deployments, which are projected to rise 11-fold to $808 million by 2026, alongside continued leadership in 800G optical technology. Ciena’s market share has increased from 18% in 2024 to 22% in 9M25, with the company commanding roughly 50% share among major cloud providers, driven by its RLS systems and WaveLogic 6 Nano built on 3nm DSP, offering superior power efficiency versus competitors such as Cisco and Marvell.
However, risks remain. The company’s history offers a cautionary example: in 2022, backlog coverage fell sharply—from levels that once covered 96% of revenue to a 38% decline, triggering a 12% drop in the stock. With shares now valued at about 45x earnings, assumptions of peak growth leave little room for disappointment if backlog momentum weakens.
As a result, Bank of America downgraded the stock to Neutral, maintaining a $260 price objective, which implies only around 7% upside, suggesting much of the optimism is already reflected in the valuation.
Ulta Beauty
What happened? On Wednesday, Raymond James upgraded Ulta Beauty Inc. (NASDAQ: ULTA) to Strong Buy and raised its price target to $790.
TL;DR: Raymond James turns more bullish on ULTA, citing earnings upside from growth initiatives despite competitive and execution risks.
What’s the full story? Raymond James upgraded Ulta to Strong Buy from Outperform, lifting its price objective to $790 and modestly increasing its FY26 EPS forecast to $28.60 from $28.51. The firm sees a combination of strategic initiatives reigniting growth as Ulta enters FY26 following a year of restructuring.
Beauty demand remains resilient, while the company benefits from operational improvements implemented over the past year, including a refreshed leadership team, enhancements to its loyalty program, stronger digital capabilities, and expanded assortments in Wellness and Marketplace categories. Looking ahead, Raymond James highlights opportunities from deeper data analytics, adoption of agentic AI, and early-stage international expansion—initiatives expected to drive earnings growth without relying on valuation multiple expansion.
The firm believes Ulta is transitioning from an investment phase toward a period of return realization, with contributions expected across physical stores, e-commerce, and potential international markets. However, risks persist, including intensifying competition in beauty retail, potential softness in U.S. consumer demand, rising cost pressures, and execution risks tied to overseas expansion.
Overall, Raymond James views Ulta’s balanced exposure to both prestige and value-conscious consumers, its strong loyalty ecosystem, and improving operational leverage as creating an attractive risk-reward profile, supporting the Strong Buy rating.
Palantir
What happened? On Thursday, PhillipCapital initiated coverage of Palantir Technologies Inc. (NASDAQ: PLTR) with a Buy rating and a $208 price target.
TL;DR: PhillipCapital sees Palantir as a buying opportunity, driven by strong revenue and profit growth, and sets a $208 target.
What’s the full story? PhillipCapital expects Palantir’s FY25 revenue to rise 47% year over year to $4.2 billion, supported by a growing contribution from its commercial segment, which is forecast to expand 51% YoY, outpacing 43% growth in government revenue. The shift reflects accelerating enterprise adoption of AI-driven platforms beyond Palantir’s traditional defense and public-sector base. Net profit is projected to increase by approximately 1.9x, reflecting improving operating leverage.
The U.S. market, which accounts for roughly 66% of total revenue, is expected to remain the key growth driver. Revenue in the region is forecast to grow 66% YoY, supported by elevated government spending amid geopolitical tensions and a sharp acceleration in commercial contracts—nearly doubling in 3Q25—driven by demand for Palantir’s Artificial Intelligence Platform (AIP) and its ontology-based productivity tools.
PhillipCapital’s $208 price objective is derived from a discounted cash flow valuation, assuming an 8.3% WACC, 4.2% risk-free rate, and 8% terminal growth rate. While the stock trades at a lofty ~170x forward P/E, the firm argues this remains below prior peak valuation levels, leaving room for a potential re-rating as earnings visibility improves and Palantir’s addressable markets continue to expand.
Starbucks Co.
What happened? On Friday, William Blair upgraded Starbucks Corporation (NASDAQ: SBUX) to Outperform, without assigning a price target.
TL;DR: William Blair sees an imminent return to positive U.S. comparable sales, prompting an upgrade to Outperform.
What’s the full story? William Blair expects Starbucks to deliver its first positive domestic comparable-sales growth in two years during the December quarter, setting the stage for improved performance into fiscal 2026. While sales momentum is turning, the firm highlights margin recovery as the central investment debate. Americas operating margins are projected to fall to 13.4% in FY25, down from a peak of 20.8%, with an additional $500 million in labor-related cost pressures anticipated in the following year.
The firm is looking to Starbucks’ January 29 investor day for further clarity, anticipating a multi-year strategy focused on general and administrative cost reductions, productivity initiatives, and sustained comparable-sales growth. Over the longer term, William Blair models approximately 3% global unit growth combined with low-single-digit comparable sales, allowing consolidated margins to gradually approach 2023 levels by 2030.
Under this framework, Starbucks could generate a 15–20% compound annual growth rate in EPS over the next five years. Despite the stock being up roughly 15% year to date, William Blair sees a potential valuation path toward $140+ per share by 2029, based on a 30x multiple applied to $4.70+ in EPS, implying roughly 10% annual share price appreciation, with upside if comparable sales accelerate faster than expected.
As a result, William Blair upgraded Starbucks to Outperform, arguing that the recovery in sales is likely to precede and ultimately drive a more meaningful rebound in profitability beginning around 2027.
Micron (MU) is a global leader in advanced memory and storage technologies, playing a critical role in converting data into actionable intelligence. The stock has surged amid the AI-driven rally, as Micron’s products have become an essential component of AI infrastructure, particularly in addressing persistent memory bottlenecks.
The shares also highlight the effectiveness of the Zacks Rank framework. In August of last year, Micron was upgraded to the highly sought-after Zacks Rank #1 (Strong Buy) following upward revisions to earnings estimates, a shift that has since been accompanied by a strong and sustained rally in the stock price.
As illustrated above, the Zacks Rank may also have helped mitigate downside risk last March.
Why Micron Shouldn’t Be Overlooked
Micron delivered outstanding results in its latest earnings report, surpassing consensus expectations on both revenue and earnings, driven by rapidly accelerating demand tied to AI workloads. Revenue surged more than 55% year-over-year to a record high, while adjusted EPS jumped an impressive 185%.
The company’s cash-generation profile also strengthened significantly amid the favorable demand backdrop. Operating cash flow reached a record $8.4 billion during the period, sharply exceeding the $5.7 billion generated in the same period last year.
The positive momentum appears set to continue, with Micron’s Q2 guidance pointing to new records across revenue, margins, earnings, and free cash flow. In short, Micron plays a critical role in enabling the AI boom, as memory capacity remains a key bottleneck in advanced systems. This strategic positioning places the company in a strong overall stance and helps shield it from concerns about being an AI “also-ran” or laggard.
As illustrated below, Micron’s revenue has surged sharply in recent periods, reinforcing the strength of the current demand environment. The company’s top-line trajectory mirrors that of NVIDIA (NVDA – Research Report), widely regarded as the flagship beneficiary of the broader AI trade.
Micron vs. NVIDIA
While many AI-linked companies are likely to come under increased scrutiny in 2026, Micron represents a far more straightforward beneficiary of the broader infrastructure buildout. Memory remains a key bottleneck in AI systems, and MU has been capitalizing meaningfully on this constraint. The company recently announced its exit from the consumer memory segment, further underscoring its strategic focus on maximizing revenue from large-scale enterprise and data-center customers.
Micron noted that “AI-driven growth in the data center has led to a sharp increase in demand for memory and storage,” adding that the decision to wind down its Crucial consumer business was made to improve supply allocation and support for larger, strategic customers in faster-growing markets.
Overall, Micron stands out as one of the most compelling AI-related investment opportunities, drawing a clear parallel with NVIDIA. While NVIDIA dominates the GPU side of AI computing, Micron plays an equally critical role by supplying the high-performance memory required for those GPUs to operate efficiently.
Turning to NVIDIA, the company once again delivered a double beat versus consensus in its latest, record-setting earnings report. Revenue reached $57 billion, up 62% year-over-year, alongside a 67% surge in earnings per share. Data Center revenue climbed to $51.2 billion, representing a robust 66% annual increase and comfortably exceeding consensus expectations of $49.1 billion.
For investors looking to capitalize on the AI infrastructure buildout, both Micron (MU – Research Report) and NVIDIA (NVDA) stand out as premier choices, with each currently holding the highly sought-after Zacks Rank #1 (Strong Buy).
Shares of Apple (NASDAQ: AAPL) have come under sustained selling pressure, with the stock now trading around $245—nearly 15% below the record high reached just last month. The decline has been largely one-way, which is notable given Apple’s reputation as one of the market’s most reliable large-cap names. Broader market conditions have also weighed on the stock, as escalating geopolitical tensions have fueled a sharp risk-off move across equities in recent days.
What makes the current situation particularly striking is how stretched Apple’s technical signals have become. The stock’s relative strength index (RSI) has fallen into deeply oversold territory this month, currently hovering near 18—its lowest level since September 2008. Such an extreme reading suggests that selling may have been excessive and overly rapid, especially with the company’s earnings report scheduled for next week.
Understanding the Setup as Apple Heads Toward Earnings
An RSI reading this depressed would draw attention for any stock, especially one like Apple. With the company heading into a closely watched earnings report next week, the setup becomes even more compelling.
Apple has a well-established history of beating analysts’ expectations on a quarterly basis, and viewed through that lens, the current situation raises an important question. After such an aggressive sell-off, is it possible that the market has already priced in a worst-case outcome?
Apple’s Fundamentals Still Strengthen the Bullish Case
From a business perspective, Apple’s recent share price performance appears increasingly out of step with its underlying fundamentals. The company’s consistent ability to exceed earnings expectations is something few of its peers can rival. Gross margins remain solid, and its ecosystem-based model continues to deliver dependable cash flows.
Apple’s approach to returning capital also offers a meaningful buffer for investors considering an entry. A sizable share repurchase program alongside steady dividend growth means management is a regular buyer of its own stock during periods of weakness. While this doesn’t eliminate the risk of sharp pullbacks, it often helps prevent negative sentiment from persisting for long.
That said, the concerns driving the sell-off cannot be ignored. iPhone shipment volumes have softened, and the stock’s valuation is near the upper end of its recent range. These factors help explain investor caution, but they fall short of fully justifying the speed and magnitude of the recent decline.
Analyst Confidence Grows Ahead of Apple’s Earnings
The case for buying the dip is reinforced by steadfast analyst support for Apple. This week, Evercore added the stock to its tactical outperform list ahead of next week’s earnings, reflecting confidence that the company will deliver results above expectations.
Recent analyst commentary has focused on the composition of iPhone sales, with higher-end models reportedly making up a greater share of demand. This trend supports both average selling prices and margins. Meanwhile, services revenue is expected to continue providing a stable source of growth, helping to cushion any weakness in hardware volumes.
Evercore set a new price target of $330 for Apple, implying roughly 35% upside from current levels, and that still isn’t the most optimistic view on the Street. Wedbush released a bullish update last week, assigning a $350 price target and further supporting the argument that the market’s reaction has been excessive. With momentum already deeply washed out, even a modest beat on revenue or earnings could be enough to spark a meaningful shift in sentiment.
Apple’s Risk/Reward Looks Compelling at Current Prices
None of this suggests Apple is without risk. Next week’s earnings will carry more weight than usual, and a true disappointment could drive the stock lower—particularly if geopolitical tensions intensify.
That said, the risk/reward profile is becoming increasingly asymmetric. This is the most oversold Apple has been in nearly two decades, and for a company with its balance sheet strength, margin profile, and history of delivering shareholder returns, it’s difficult to ignore the appeal of buying at these levels.
U.S. stock index futures edged higher on Tuesday evening after Wall Street suffered sharp losses amid rising geopolitical tensions linked to President Donald Trump’s demands regarding Greenland. Netflix was a notable mover in after-hours trading, sliding nearly 5% after the streaming company issued guidance that disappointed the market.
Futures stabilized following Wall Street’s worst session in three months, as investors grew uneasy over President Trump’s push to acquire Greenland despite resistance from European leaders. S&P 500 futures gained 0.1% to 6,838.0 by 18:27 ET, while Nasdaq 100 and Dow Jones futures also rose 0.1% to 25,152.75 and 48,727.0, respectively.
Netflix falls after issuing a weaker-than-expected outlook; more earnings reports ahead
Netflix Inc (NASDAQ: NFLX) fell 4.8% despite reporting December-quarter earnings that topped market expectations, as its first-quarter guidance disappointed investors. The company pointed to weakening viewership for non-branded licensed content, signaling softer demand beyond its flagship in-house programming. Netflix’s outlook for 2026 also came in below expectations.
The results arrive amid a wave of mixed corporate earnings over the past week, particularly among major U.S. banks. The fourth-quarter earnings season continues in the days ahead, with Johnson & Johnson (NYSE: JNJ), Charles Schwab Corp (NYSE: SCHW), and Prologis Inc (NYSE: PLD) scheduled to report on Wednesday.
On Thursday, earnings are due from Procter & Gamble (NYSE: PG), GE Aerospace (NYSE: GE), Intel (NASDAQ: INTC), Abbott Laboratories (NYSE: ABT), and Intuitive Surgical (NASDAQ: ISRG). Elsewhere in Tuesday evening trading, United Airlines Holdings Inc (NASDAQ: UAL) jumped 5% after posting strong quarterly earnings and an upbeat outlook.
Wall Street rattled by Trump–Greenland dispute
Wall Street’s major indexes slumped sharply on Tuesday — the first trading day after a long weekend — as investors were unnerved by escalating geopolitical tensions tied to President Donald Trump’s aggressive push over Greenland and tariff threats against several European countries. The sell-off marked one of the market’s worst sessions in months, with the S&P 500, Dow Jones, and Nasdaq all posting significant declines amid heightened risk aversion.
Trump’s plan to pressure European allies with new tariffs in an effort to secure U.S. leverage over Greenland drew strong rejection from European leaders and amplified fears of broader trade conflict, prompting a flight from risk assets.
On the trading day, the S&P 500 dropped about 2.1%, the Nasdaq Composite slid nearly 2.4%, and the Dow Jones Industrial Average fell roughly 1.8%. Tech and broader market stocks led the weakness, underscoring how geopolitical uncertainty can quickly sour sentiment across sectors.
It’s been a long, cold and snowy weekend in New York—just enough snow to keep most people glued to the couch. For anyone hoping for a brief break from markets, U.S. trading is closed on Monday.
For committed market watchers, however, Weekend Wall Street and Weekend Tech offer little comfort. Both have been under pressure following the latest developments around Greenland, with Weekend U.S. Tech CFDs down roughly 75 basis points as of 8:30 a.m. ET on Sunday. While this move is not definitive, it suggests futures could open lower when trading resumes Sunday evening at 6:00 p.m. ET.
Attention also turns to Tuesday, when the Supreme Court may issue another opinion. Given how volatility was priced on Friday, it would not be surprising to see overnight volatility dynamics re-emerge, potentially pushing implied volatility higher into the 10:00 a.m. release window.
Tuesday also marks a $14 billion Treasury bill settlement, which is expected to tighten liquidity conditions further. As a result, the session could be eventful from the outset. If overnight funding rates begin to climb this week, pressure on usage of the Federal Reserve’s Standing Repo Facility would likely increase, with the key threshold for the overnight rate seen above 3.75%.
From my perspective, the technical setup in the S&P 500 looks fragile. The index appears likely to be in negative gamma when trading resumes on Tuesday, which could further amplify volatility. The rising wedge pattern remains intact, and a decisive break below the 6,900 support level would raise the risk of a more pronounced pullback.
Ten-year Treasury yields broke higher on Friday, and much of that move may have been linked to the quarterly refunding questionnaire sent to primary dealers later in the afternoon. The most notable steepening in the yield curve occurred in the belly, which would be consistent with speculation that the Treasury is considering shifting the 7-year note from a monthly new issue to a quarterly issuance with two reopenings.
This suggests the Treasury could be preparing the market for potential adjustments to issuance size or duration in the near to medium term, though that view remains speculative. Notably, yields rose most sharply in the 5- to 7-year sector, reinforcing this interpretation.
Had the move instead been driven by expectations around Kevin Hassett no longer being considered for Fed chair, yields would likely have increased more at the front end of the curve.
Regardless of the catalyst, the key point is that the 10-year yield has broken out in a meaningful way, suggesting that a move higher may now be unfolding. While confirmation on Tuesday will be important, it is clear that market dynamics have shifted.
PCE inflation data, the start of the fourth-quarter earnings season, a Supreme Court ruling on tariffs, and the Davos World Economic Forum will all be in focus during the holiday-shortened week ahead.
GE Aerospace appears well positioned for an earnings-driven rally, while United Airlines may face downside pressure amid weaker results and persistent sector headwinds.
U.S. equities slipped on Friday, ending the week with modest declines across the Dow Jones Industrial Average, S&P 500, and Nasdaq, as investors digested President Donald Trump’s latest remarks on the Federal Reserve and broader geopolitical developments.
For the week, the Dow Jones Industrial Average slipped 0.3%, the S&P 500 eased 0.4%, and the Nasdaq Composite declined 0.7%, while the small-cap Russell 2000 gained 2% to notch another record close on Friday.
Volatility may pick up in the week ahead as investors evaluate prospects for economic growth, inflation, interest rates, and corporate earnings against a backdrop of persistent trade and geopolitical tensions.
Over the weekend, President Donald Trump said eight NATO member countries could face tariffs of up to 25% unless an agreement is reached allowing the United States to purchase Greenland.
U.S. financial markets will be closed on Monday in observance of the Martin Luther King Jr. Day holiday. On the economic front, Thursday’s core PCE price index— the Federal Reserve’s preferred inflation measure—will be the key data release to watch.
The fourth-quarter earnings season also ramps up, with results due from several high-profile companies, including Netflix (NASDAQ:NFLX), Intel (NASDAQ:INTC), United Airlines (NASDAQ:UAL), Procter & Gamble (NYSE:PG), Johnson & Johnson (NYSE:JNJ), GE Aerospace (NYSE:GE), and 3M Company (NYSE:MMM).
Investors are additionally awaiting a U.S. Supreme Court ruling on the legality of President Donald Trump’s global tariffs, after the court declined to issue a decision last week. The justices are also set to hear arguments related to Trump’s effort to remove Federal Reserve Governor Lisa Cook.
Attention will also turn to Davos, Switzerland, where Trump is scheduled to attend the World Economic Forum, potentially generating fresh headlines.
Against this backdrop, regardless of broader market direction, I outline below one stock that appears positioned for upside demand and another that could face renewed downside pressure. These views are strictly short-term, covering the week ahead from Monday, January 19 through Friday, January 23.
Top Pick: GE Aerospace Poised for Gains
GE Aerospace is set to report earnings this week, with expectations calling for another strong quarter. Analysts are forecasting solid results, supported by robust aerospace demand and a new wave of engine orders, including Delta’s recent selection of GE’s GEnx engines for its expanding Boeing 787 fleet.
The company is scheduled to release its fourth-quarter update before the market opens on Thursday at 6:30 a.m. ET. Options markets are bracing for heightened volatility, with implied pricing suggesting a post-earnings move of approximately ±5.2% in GE shares.
Analysts are forecasting another strong quarter, with consensus estimates pointing to adjusted earnings of $1.44 per share, up from $1.32 a year earlier, alongside revenue growth of roughly 13% year over year to about $11.2 billion. Performance is being underpinned by structural tailwinds, including sustained demand for LEAP and GEnx engines—both of which are sold out for the remainder of the decade—as well as rising engine deliveries.
Investor focus is expected to center as much on GE’s forward guidance as on its headline results. Recent announcements around new orders and capacity expansions have bolstered confidence in the outlook for 2026, with analysts projecting full-year earnings of approximately $7.01 per share.
As a global leader in jet engines and aerospace systems, GE Aerospace continues to benefit from a recovery in commercial air travel and strong growth in its high-margin aftermarket services business.
GE remains in a strong upward trend, with its share price up 78.8% over the past year and trading just 2.3% below its 52-week high. Momentum indicators continue to point higher, with technical signals flashing a “strong buy” across multiple timeframes.
If GE delivers the anticipated double-digit revenue growth, maintains or expands margins, and provides upbeat commentary on future demand, the stock could extend its rally as investors further re-rate GE Aerospace as a high-quality, cash-generative industrial leader.
Trade Setup:
Entry: $326 (pre-earnings)
Targets: $340 → $350 (gain ~5%-7%)
Stop: $315 (risk ~3%)
Stock to Sell This Week: United Airlines
By contrast, United Airlines is confronting increasing headwinds ahead of its fourth-quarter earnings release, scheduled for Tuesday at 4:00 p.m. ET. While the carrier has demonstrated resilience in recent quarters, consensus expectations suggest growing challenges that could result in an earnings miss or a muted market response.
Options-implied volatility signals a potential post-earnings move of roughly ±5.9% in UAL shares, underscoring the elevated risk around the report.
Wall Street expects the Chicago-based carrier to post earnings of $2.96 per share, down 9.2% from $3.26 a year earlier. Revenue is forecast to come in around $15.4 billion, though rising operating costs, capacity-related pressures, and lingering issues such as service disruptions and softer international performance continue to cloud the outlook.
The broader airline industry remains challenged by ongoing operational strains, including flight delays, cancellations, and capacity constraints.
Adding to the uncertainty, renewed tariff pressures on European routes could further complicate United’s international operations. Heightened trade tensions and the risk of retaliatory measures may weigh on the airline’s sizable transatlantic network.
Recent technical signals reinforce the downside risk, with UAL’s one-hour indicators flashing a “strong sell” as both momentum and moving averages remain firmly tilted lower.
Against this backdrop, the stock appears vulnerable in the week ahead. Even if headline results come in near expectations, a cautious outlook or incremental pressure on key international routes could be sufficient to push shares lower.
Most Asian equities declined on Monday after U.S. President Donald Trump reignited global trade concerns by slapping tariffs on several major European countries over Greenland.
Chinese stocks limited their losses after fourth-quarter GDP data came in above expectations, with the economy also meeting Beijing’s 2025 annual growth target of 5%.
South Korean shares outperformed regional peers, driven by gains in chipmakers after U.S. memory giant Micron Technology said it would acquire a fabrication plant from Taiwan’s Powerchip Semiconductor Manufacturing for $1.8 billion.
Other regional markets largely followed the slide in Wall Street futures after Trump’s tariff threat, with S&P 500 futures dropping as much as 1% during Asian trading. U.S. markets are closed on Monday for a public holiday.
Asian stocks slip after Trump’s Greenland tariff move
Japan’s Nikkei 225 and TOPIX fell 1% and 0.5%, respectively, while Hong Kong’s Hang Seng index declined 0.8%.
Australia’s ASX 200 slipped 0.4%, Singapore’s Straits Times index lost 0.5%, and futures for India’s Nifty 50 dropped 0.4%.
Over the weekend, Trump threatened to impose trade tariffs of up to 25% on several European countries, saying the measures would stay in place until an agreement was reached for the United States to acquire Greenland.
European nations largely rejected Trump’s demands for the Danish territory, with France also reportedly preparing retaliatory economic steps against Washington.
Trump’s tariff threats compounded already elevated geopolitical tensions worldwide, keeping investors cautious toward risk-sensitive assets. Gold prices surged to a record high on Monday amid strong safe-haven demand.
Trump has repeatedly pressed for control of Greenland, arguing the territory is vital to U.S. national security. He has also floated the possibility of military action, a threat that appeared more credible following a U.S. incursion in Venezuela earlier this year.
China stocks steady as 2025 GDP hits official target
China’s CSI 300 and Shanghai Composite indexes traded within a narrow range on Monday after official data showed quarter-on-quarter GDP growth slightly exceeded expectations in the December period.
GDP expanded 4.5% year-on-year in the fourth quarter, matching forecasts and bringing full-year 2025 growth to 5%, in line with Beijing’s target.
The outcome was largely supported by resilient exports, as demand outside the United States remained strong, helping keep the manufacturing sector buoyant.
Consumer activity was also aided by ongoing stimulus measures, as policymakers worked to reverse a prolonged post-COVID confidence slump.
However, December data still pointed to uneven recovery, with fixed-asset investment contracting far more than expected and retail sales growth falling short of forecasts.
South Korean shares jump on chipmaker rally after Micron deal
South Korea’s KOSPI outperformed regional peers on Monday, climbing more than 1% on the back of gains in semiconductor stocks.SK Hynix and Samsung Electronics, the country’s two largest chipmakers, rose 0.2% and 1.9%, respectively.
Sentiment toward the memory-chip makers was boosted after rival Micron Technology announced a $1.8 billion investment to acquire a facility from Taiwan’s Powerchip Semiconductor Manufacturing.
Powerchip shares jumped 10% in Taipei trading following the announcement.Elsewhere in Asia, chip stocks retreated on Monday but remained supported by gains from last week after strong earnings from industry bellwether TSMC.
U.S. stock index futures were little changed Thursday evening as strength in tech shares and a strong report from TSMC helped Wall Street break a two-session slide.
Gains were further supported by upbeat results from Morgan Stanley and Goldman Sachs, though worries over escalating geopolitical risks in Iran limited the broader market advance.
S&P 500 futures edged up 0.1% to 6,988.50 by 18:35 ET (23:35 GMT). Nasdaq 100 futures also gained 0.1% to 25,727.0, while Dow Jones futures ticked up to 49,670.0.
Tech, chipmakers rise after TSMC’s bumper Q4
Chipmakers led Wall Street higher on Thursday after TSMC (NYSE:TSM) reported record fourth-quarter earnings and pointed to continued strong demand driven by artificial intelligence. As the world’s largest contract chip producer and a key industry barometer, TSMC surged 4.4% in U.S. trading.
Customer NVIDIA Corporation (NASDAQ:NVDA) advanced 2.2% after its report, while competitor AMD (NASDAQ:AMD) gained 1.9%. TSMC CEO C.C. Wei noted that both the firm’s clients and their own customers are still eager to secure more semiconductors amid a major buildout of AI infrastructure.
Wei also projected a steep increase in capital investment in 2026 as the company scales production to meet accelerating demand. Chip strength extended modestly into the wider tech sector, which had seen some profit-taking earlier in the week after sharp early January gains.
Wall St breaks 2-day losing streak, bank stocks gain
Wall Street’s major indexes ended a two-day slide on Thursday, helped by gains in tech stocks and upbeat earnings from several banks. Goldman Sachs Group Inc (NYSE:GS) and Morgan Stanley (NYSE:MS) jumped 4.6% and 5.8% after reporting strong December quarter results—boosting sentiment despite softer bank earnings earlier in the week.
The results effectively kicked off the fourth-quarter earnings season, with a wave of heavyweight names set to follow. Netflix Inc (NASDAQ:NFLX), 3M Company (NYSE:MMM), and U.S. Bancorp (NYSE:USB) will release earnings on Tuesday, while Johnson & Johnson (NYSE:JNJ) is due Wednesday.
Later in the week, Visa Inc (NYSE:V), Intel Corporation (NASDAQ:INTC), Abbott Laboratories (NYSE:ABT), and Intuitive Surgical Inc (NASDAQ:ISRG) are among many firms scheduled to report. By the close, the S&P 500 rose nearly 0.3%, the NASDAQ Composite added 0.25%, and the Dow Jones Industrial Average outperformed with a 0.6% gain fueled by bank strength.
The three major indexes had dropped for two consecutive sessions earlier this week amid market anxiety over escalating geopolitical tensions involving Iran.
Today may bring another chance for the Supreme Court to issue a ruling on tariffs—we’ll know around 10:00 a.m. whether an opinion is released. The timing is notable for equities, as the S&P 500 is tightly consolidating and approaching a point where it must break in one direction. I still believe the setup looks more like a market top than the beginning of a melt-up. Technically, it could even be interpreted as a terminal diagonal triangle.
Ultimately, the key factor is volatility, which remains extremely subdued. While Tuesday did bring a notable rise in the left-tail index to 10.7—still a relatively low level—it was higher than before. In any case, we’ll find out today which way things break.
For now, interest rates seem stuck in place, with neither strong nor weak economic data moving the long end of the curve. Even the CPI report—despite undershooting on core inflation—failed to budge the 30-year yield. The setup still resembles a bull flag, but at the moment, there’s little follow-through.
If you’re looking for rising yields, Japan is where to focus. The 10-year JGB continues its steady ascent and is now around 2.17%. Based on the wedge pattern and a forward projection, the yield could push toward 2.25%.
On Tuesday, USD/JPY broke out, climbing past the 159 resistance level. Currently, the market seems to be focusing more on Japan’s fiscal spending plans than on interest rate differentials. A move up to 162 is looking more and more probable.
Software stocks took a severe hit. Shares of Salesforce (NYSE:CRM), ServiceNow (NYSE:NOW), and Workday (NASDAQ:WDAY) were heavily battered. Notably, ServiceNow has fallen back to its 2021 highs, which also align with the lows seen in April 2025.
Workday’s performance is actually even more troubling.
Salesforce seems to be holding up better than the others, but that’s not exactly reassuring. It looks like the market fears these companies might get disrupted or cannibalized by AI. Honestly, the charts across the board look pretty bleak.
The VIX 1-Day index closed below 10 on Monday, indicating that if a significant price surge follows the CPI report, it is unlikely to be driven initially by increased implied volatility. Instead, any substantial move would need to be supported by actual buying activity rather than a rise in volatility. However, volatility could still spike overnight, setting the stage for the familiar CPI-driven market reaction.
The S&P 500 appears stable for now, but I don’t believe this is the significant breakout many have anticipated since late October. Currently, the index hasn’t even fully cleared resistance at the trendline by a single bar. We witnessed similar patterns at the beginning of 2022 and 2025.
The market could keep inching up by 10, 20, or even 30 basis points, but considering the unusually low levels of both realized and implied volatility, along with one-month implied correlation at just 7, the odds aren’t in favor of a strong move. Monday’s trading volume in S&P 500 futures was so thin, it felt like December 22 all over again.
It seems the authorities have the ability to push the 3-month VIX back down to its July 2024 lows.
Perhaps those same market forces can drive the 1-month implied correlation down to 2.
Alternatively, the VXTLT bond market volatility index might decline to levels unseen since 2019.
The main takeaway is that, in my opinion, the market’s current structure is not set up for a sharp, explosive rally. While it may continue to grind upward, eventually volatility is likely to mean-revert higher, triggering a pullback similar to the one seen from late October into November.
Interestingly, despite numerous challenges in the oil market over the past four years, XLE has largely avoided a significant breakdown, instead trading mostly sideways throughout this period. If oil prices were to break out decisively and start climbing, it could signal a strong bullish trend for the sector. Currently, XLE is approaching a critical resistance level and merits close attention.
This could prove significant if oil’s breakout above the downtrend sustains and prices start climbing back into the $60 range. For now, $55 seems to be a support level, and oil remains one of the few commodities yet to make a notable upward move. It’s definitely worth monitoring for potential gains.
With holiday decorations packed away and investment professionals back at their desks, the serious market work for 2026 is officially underway. So far, investor sentiment appears optimistic, as the S&P 500 has posted a 1.76% gain—a promising start to the year.
Looking ahead, nearly every major Wall Street firm forecasts another strong year for stocks. While leadership within the market may shift, the broad consensus remains that stock prices are poised for healthy gains in 2026.
You might wonder how this optimism holds up amid concerns about AI bubbles, geopolitical tensions, inflation, and lofty valuations. Having wrestled with this question myself, I believe it’s worthwhile to step back and review the fundamental drivers underpinning the stock market.
From my experience managing money for over 40 years, I’ve learned that while short-term market movements are nearly impossible to predict, understanding the broader macroeconomic environment helps to get the major market moves “mostly right, most of the time.” Simply put, aligning with the dominant primary market cycle is my foremost objective in this line of work.
So, without wasting any time, let’s briefly review the key macro drivers: the economy, corporate earnings, inflation, the Fed and interest rates, and, naturally, valuations.
Since there’s quite a bit to cover—and I doubt many of you want to read a 5,000-word report on a Monday morning—I’ve decided to split this analysis into several parts. Today, we’ll begin with a focus on the economy and corporate earnings.
Overview of the Economy
The U.S. economy is generally divided into three main sectors: manufacturing, consumers, and government. Of these, the consumer sector—also known as the services sector—is by far the largest, accounting for roughly 70% of overall economic activity in the United States.
Because of this, the sluggish manufacturing sector, which has been in a prolonged slowdown, is less of a concern. While an improvement there would be welcome, consumer sentiment remains the primary driver of economic growth today.
It’s also important to highlight that high-income earners now dominate consumer spending. Reports indicate that the wealthiest individuals account for just over 50%—a record high—of all U.S. consumer expenditures. These affluent consumers are less sensitive to price increases and tend to maintain their spending habits despite inflation.
Indeed, the labor market has shown signs of weakening, which could eventually affect consumer spending. However, current evidence suggests that job market softness is primarily impacting lower-income consumers at this stage. This situation remains fluid—if job losses accelerate, the services sector would likely feel the impact. But for now, this hasn’t been the case.
The key takeaway is that despite negative headlines, the economy appears to be performing well. U.S. GDP growth was strong last year, moving from a slight contraction of -0.6% in Q1 to +3.8% in Q2 and +4.3% in Q3.
More recently, the Atlanta Fed’s GDPNow model—a real-time GDP estimate—registered a robust +5.4% last week.
From my perspective, anyone claiming the economy is weak or unstable is overlooking the actual data.
Company Earnings Reports
Earnings are often described as the lifeblood of the stock market, making it crucial to stay informed about corporate profit trends. To get straight to the point, corporate earnings are very strong—remarkably so.
For example, Q3 results showed about a 15% increase, significantly surpassing analyst expectations.
Looking forward, consensus estimates from Wall Street analysts predict that S&P 500 companies will see earnings grow by approximately 17.3% in 2026. Quite impressive.
Of course, analysts rarely get their projections exactly right. Estimates often start off too optimistic and are revised downward over time. So, it would be unwise to assume that 2026 earnings per share (EPS) will definitively rise by 17% compared to last year.
The important takeaway is that EPS growth is still expected to be strong this year—significantly above the historical average. (Goldman Sachs recently released a report titled “2026: An Earnings Story.”) My view is that as long as earnings come reasonably close to these expectations, there should be plenty of room for stocks to advance.
Is There Further Upside Potential?
The key question is how much further the stock indices can climb. While I’ll address valuations in the coming weeks, it’s clear to everyone that current stock multiples are quite high. This likely explains why Wall Street analysts are forecasting relatively modest gains of around 10% for the year—roughly in line with the S&P’s average annual return since 1980—even with anticipated earnings growth.
Given the strong economic outlook and expected earnings growth, it’s difficult for me to take a negative stance on the stock market.
That said, it might be prudent to temper enthusiasm somewhat due to elevated valuations. However, from a broader perspective, I believe the best approach is to stay on the bullish path and trust the market leaders to navigate any near-term challenges.
What shapes our lives are the questions we ask, refuse to ask, or never think to ask.
Silver futures continue their strong upward momentum, trading near $79.80 after a significant rally that pushed prices well above the VC PMI (Variable Changing Price Momentum Indicator) average and into the upper resistance zone.
This pattern indicates the market has entered what we call escape-velocity behavior—where the trend’s acceleration temporarily outweighs short-term oscillators but still respects longer-term geometry and cycle pressures.
Looking at the VC PMI, the daily mean is holding steady around $76.02, providing dynamic support throughout the week. The market also successfully defended the Daily Buy 1 level at $73.38, confirming the strength of the current bullish setup.
Now, prices are approaching the Daily Sell 1 zone near $78.70, with the Daily Sell 2 resistance at $82.24 closely matching the previous swing high of $82.58. This overlap suggests a higher likelihood of short-term profit-taking or consolidation, rather than a reversal of the uptrend.
On the weekly VC PMI framework, silver stays solidly above the Weekly Buy 1 level at $73.70, with the Weekly VC PMI mean around $78.15, reinforcing that the prevailing trend is upward. However, the Weekly Sell 1 level at $83.78 and Weekly Sell 2 at $88.23 mark key resistance zones where momentum typically slows and volatility tends to increase.
From a time-cycle perspective, silver is currently trading within a compressed late-week cycle window, a phase where markets often pause, rotate, or experience slight retracements before the next move. Such pauses are common in strong trends and usually serve to reset momentum for continuation rather than signaling a reversal.
The present cycle alignment suggests an initial phase of range expansion, followed by consolidation, rather than signaling a trend exhaustion.
The Square of 9 geometry further supports this view. The $82–$83 area corresponds with a significant angular resistance band, while the $78–$76 range serves as a key rotational support zone. As long as prices stay above the VC PMI mean, the primary square rotation remains bullish, with higher-level targets pointing toward the mid-$80s in upcoming cycle windows.
In summary, silver maintains a strong bullish structure according to both the VC PMI and Square of 9 frameworks. Any short-term pauses or pullbacks should be seen as opportunities for mean reversion within the broader uptrend, rather than signs of trend reversal.
This week, market attention will be on CPI inflation figures, retail sales data, and the kickoff of the Q4 earnings season.
Morgan Stanley is expected to see gains driven by robust quarterly results.
Meanwhile, Capital One Financial is likely to face challenges due to a proposed cap on credit card interest rates.
The stock market closed the first complete trading week of 2026 with the Dow Jones Industrial Average and S&P 500 reaching record levels, buoyed by the latest employment report.
Wall Street’s major indexes enjoyed a strong week, with the Dow Jones Industrial Average rising 2.3%, the S&P 500 gaining 1.6%, the tech-focused Nasdaq Composite climbing 1.9%, and the small-cap Russell 2000 soaring 4.6%.
Looking ahead, the upcoming week promises significant market activity as investors assess economic prospects and interest rate trends.
Key events on the economic calendar include Tuesday’s U.S. consumer price inflation report for December, which could trigger market volatility if the data exceeds expectations. This report will be released alongside producer price figures, offering a broader view of inflation, as well as the December retail sales numbers.
Additionally, the Q4 earnings season is about to begin, featuring major companies such as JPMorgan Chase, Bank of America, Wells Fargo, Citigroup, Goldman Sachs, Morgan Stanley, BlackRock, Delta Air Lines, and Taiwan Semiconductor set to report their results.
Additionally, the Supreme Court may deliver a ruling on the Trump tariffs this week, after not doing so last Friday.
No matter how the market moves, below I identify one stock expected to attract buying interest and another that might face renewed selling pressure. Keep in mind, my outlook covers just the upcoming week, from Monday, January 12 to Friday, January 16.
Morgan Stanley: Top Stock Pick to Buy
Morgan Stanley is set to deliver one of the strongest earnings reports in the financial sector this quarter, fueled by a notable rebound in mergers and acquisitions, a thriving IPO underwriting business, and strong results across its core investment banking divisions.
The company will release its Q4 results before the market opens on Thursday at 7:30 AM ET. Investors anticipate significant volatility in MS shares following the announcement, with options markets pricing in a potential move of about ±4.2% post-earnings.
Analysts hold a positive outlook, with all nine recent earnings revisions reflecting upward adjustments, highlighting Morgan Stanley’s strong presence in high-growth sectors such as AI-related financing and capital markets.
Morgan Stanley is projected to earn $2.41 per share, an 8.5% increase compared to last year, while revenue is expected to rise 9.4% year-over-year to $17.72 billion. This growth is anticipated to be driven by a rebound in global mergers and acquisitions, alongside robust performance in IPO underwriting and trading revenues.
In recent quarters, Morgan Stanley has effectively increased its market share in high-margin advisory services while sustaining its leading role in equity and debt underwriting, both of which contribute significant fee income when market conditions are favorable.
Technically, Morgan Stanley’s shares closed near $186.50 on Friday, trading above key moving averages and displaying bullish momentum ahead of the earnings report. Should the company deliver strong results with an optimistic outlook, the stock could push toward $200 shortly, making it an appealing buy for investors confident in the financial sector’s continued strength.
InvestingPro’s AI-driven quantitative model assigns Morgan Stanley a ‘GOOD’ Financial Health Score of 2.65, indicating solid capital reserves, strong liquidity, and a long history of dependable dividends.
Capital One Financial: Recommended Sell
On the other hand, Capital One Financial, a leading credit card lender, is expected to face considerable selling pressure this week following President Trump’s announcement of a temporary 10% cap on credit card interest rates. This policy, designed to alleviate consumer financial strain, poses a direct threat to the profitability of lenders that depend heavily on interest income from credit cards.
Given its large consumer credit card portfolio, Capital One is particularly exposed. With average credit card interest rates typically between 20-30%, a 10% cap would wipe out most of the company’s net interest income, which forms the backbone of its overall profits.
The proposed interest rate cap poses an urgent and substantial challenge to Capital One’s financial results, forcing the company to either accept sharply lower profits or withdraw from large segments of the credit card market that would no longer be financially viable.
Even prior to this announcement, Capital One Financial was struggling with increasing charge-offs and slowing loan growth, leaving the stock susceptible to further declines.
Shares closed around $250 on Friday, but if upcoming earnings (due January 22) reveal worsening credit quality or management signals concerns about future profitability, the stock could drop to $229 or below—a decline of 8-10% from current levels.
Whether you’re a beginner investor or an experienced trader, using InvestingPro can help you discover investment opportunities while managing risks in today’s challenging market environment.