Tag: inflation

  • Strong Growth Forecasts Overlook a Lingering Confidence Red Flag

    Recent U.S. growth data have pointed to notable economic resilience — but consumer sentiment tells a more cautious story.

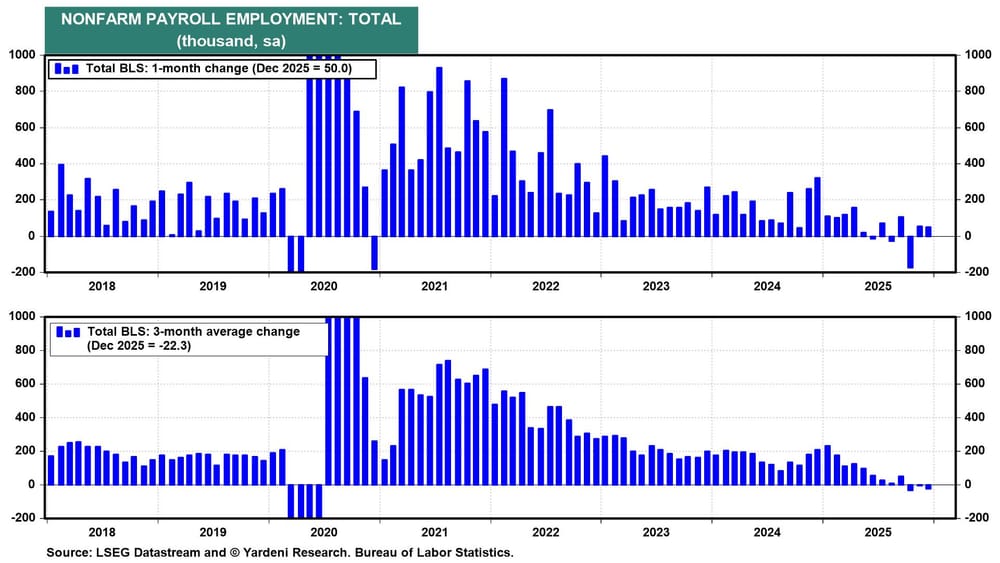
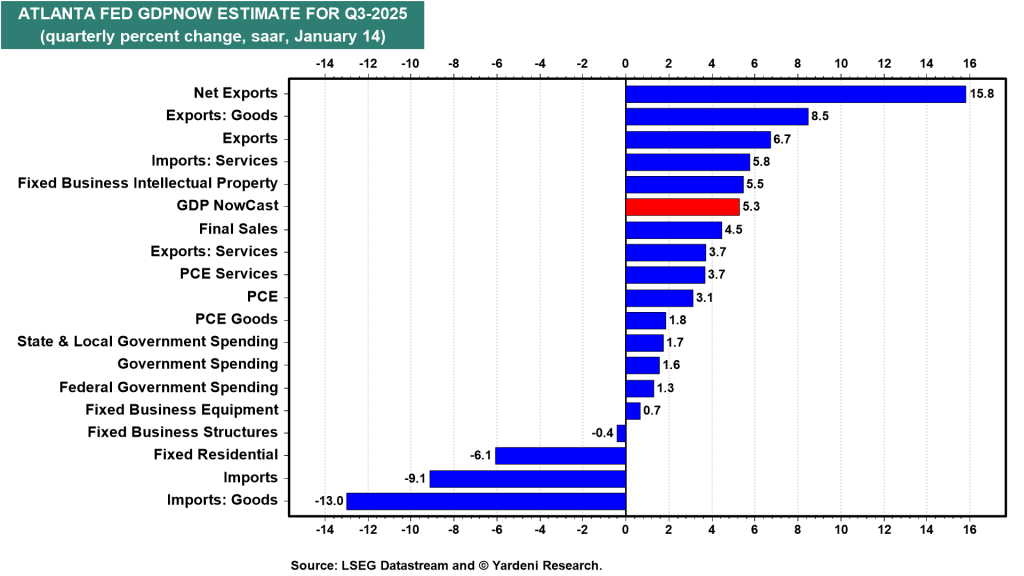
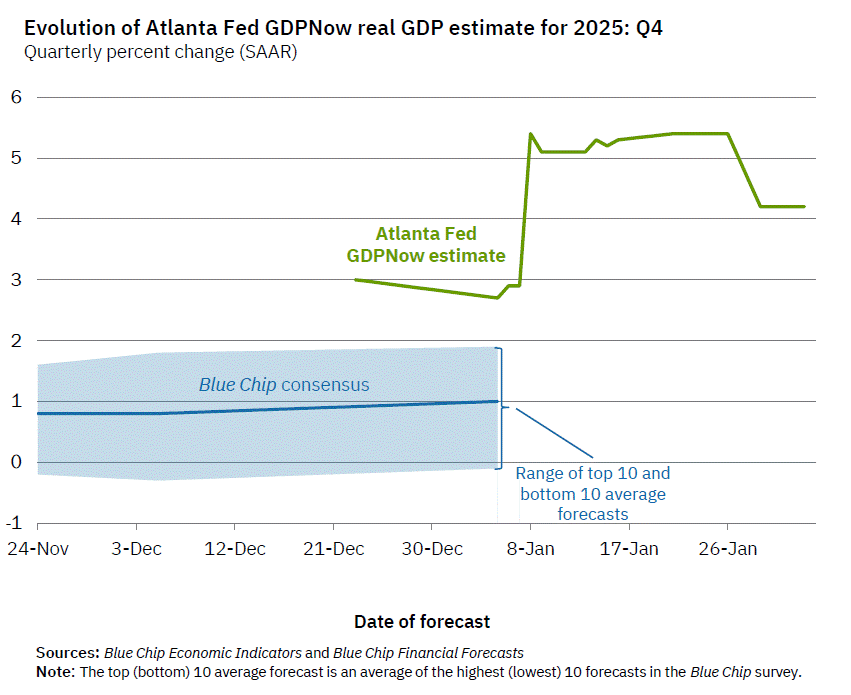
    According to the Federal Reserve Bank of Atlanta, real Gross Domestic Product is projected to have expanded at an annualized pace of 4.2% in the fourth quarter of 2025. That figure exceeded expectations and represents one of the strongest quarterly performances in the past two years.

    The expansion was supported by steady consumer spending, firmer exports, and higher government expenditures. Household consumption climbed 3.5%, its fastest rate of increase this year. On the surface, these numbers portray a macroeconomy that remains firmly in growth mode.

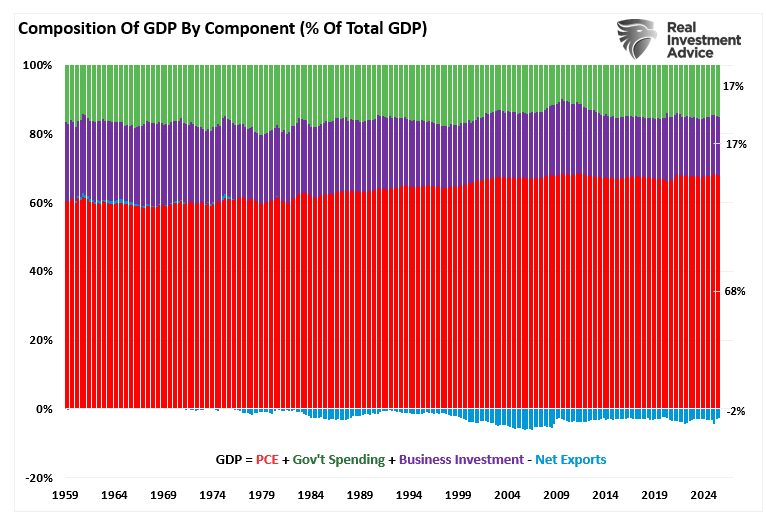
    Gross Domestic Product (GDP) represents the total value of goods and services produced within the United States. Of that total, personal consumption expenditures (PCE) account for roughly 68%. Put simply, the consumer is the backbone of the U.S. economy — as household spending goes, so too goes overall economic growth.

    When GDP rises, it reflects an increase in overall economic activity — stronger consumer demand that supports higher production and broader expansion. For that reason, growth rates are closely watched by policymakers, investors, and corporate leaders. Strong GDP figures are often interpreted as a signal of improving sales prospects and profit potential.

    However, GDP does not tell the whole story of household financial well-being.

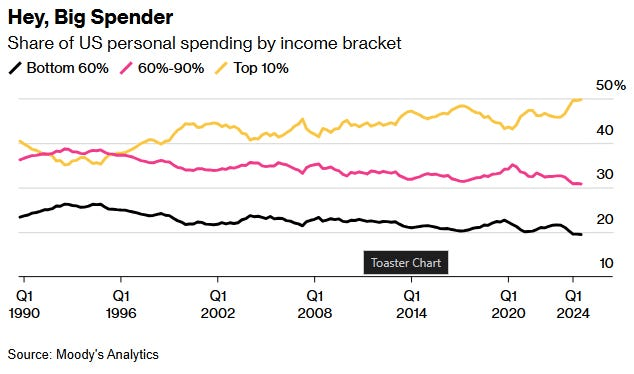
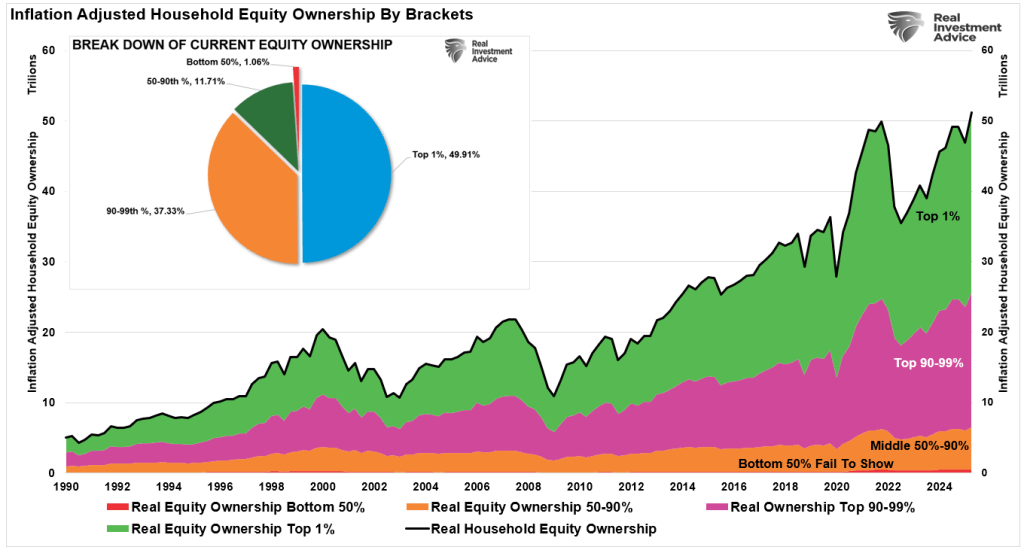
    By design, economic growth data measure aggregate output. They do not reveal how income is distributed, how conditions vary across regions, or how millions of families actually experience the economy. A clear illustration is the breakdown of consumer spending by income level. At present, roughly half of all U.S. consumer spending is driven by the top 10% of earners — a share that has been increasing — while the spending contribution from the bottom 90% has been declining.

    In other words, headline growth can appear solid even as the underlying breadth of participation narrows.

    In short, strong headline growth can conceal areas of financial strain among households and small businesses. Expansion driven primarily by exports or government spending may not meaningfully filter through to broad segments of workers, creating a disconnect between aggregate output and lived experience.

    A clear example of this distortion appeared in 2025. In the first quarter, a surge in imports aimed at front-running tariffs weighed heavily on GDP. When those trade fears subsided in the second quarter, import flows normalized, producing a sharp rebound in growth. Yet these swings in trade data had limited direct impact on most consumers. The volatility was largely statistical rather than reflective of a dramatic shift in household conditions.

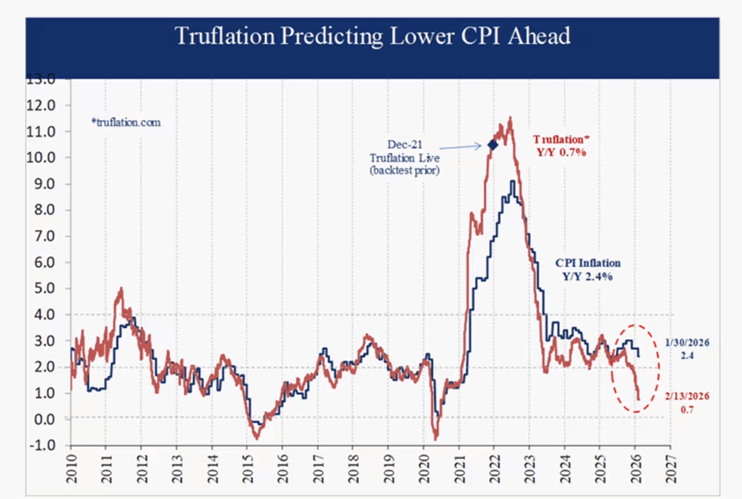
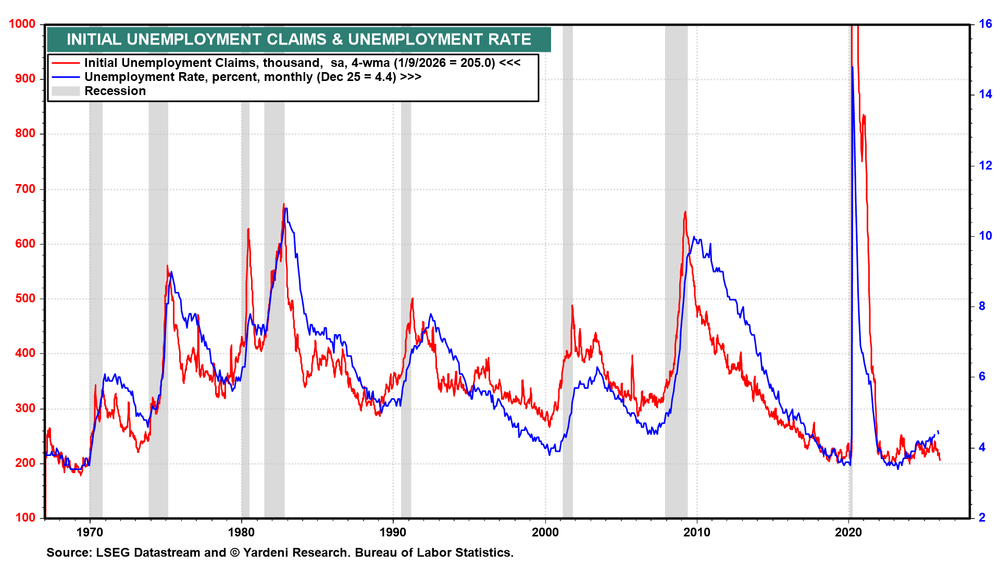
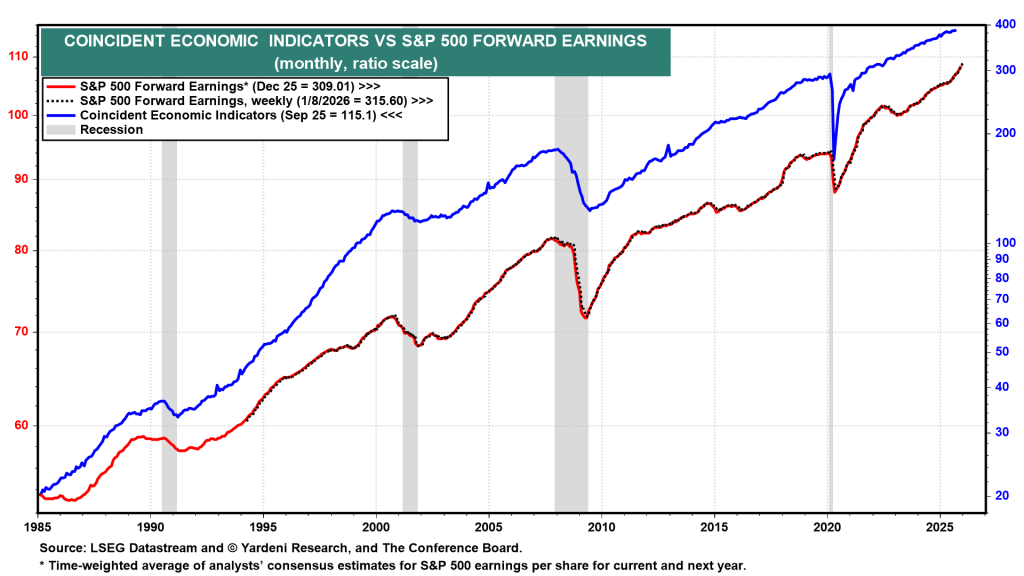
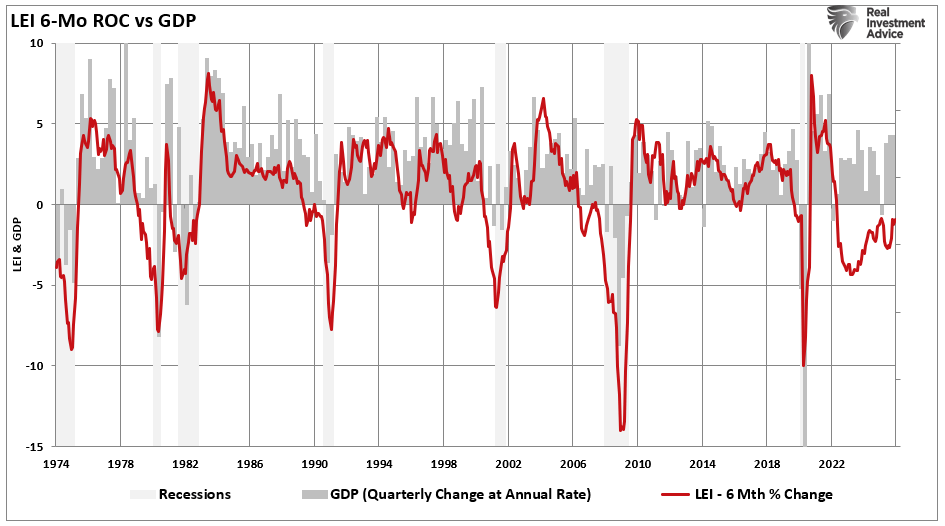
    While GDP figures suggest a sturdy economic backdrop, other coincident and leading indicators tell a more cautious story. The The Conference Board Leading Economic Index (LEI), which historically leads the U.S. economy by roughly six months, has remained in contraction for an extended period. Its six-month rate of change has long been regarded as one of the more reliable signals of impending slowdowns or recessions.

    Notably, however, despite the prolonged weakness in the LEI, the broader economy has not formally entered recession — underscoring the growing divergence between traditional warning signals and realized economic outcomes.

    At first glance, headline growth data suggest the economy remains on firm footing. Output is expanding, spending is holding up, and aggregate indicators point to continued resilience.

    But a closer examination reveals a more nuanced picture. Beneath the surface, several crosscurrents — from uneven income distribution and trade-related distortions to persistent weakness in leading indicators — point to a mixed underlying environment.

    That divergence helps explain why economic sentiment can feel far weaker than the headline numbers imply. Strong aggregate growth does not automatically translate into broad-based confidence, particularly if gains are concentrated or forward-looking indicators continue to flash caution.

    The Gap Between Rising Stocks and Weak Consumer Sentiment

    Historically, it makes sense that stock markets and economic data would trend in the same direction over the long run. Corporate earnings ultimately derive from economic activity, and sustained growth in output and income should support higher equity valuations over time.

    As discussed in “Return Expectations Are Too High,” long-term market returns are anchored to the growth of the underlying economy, productivity gains, and profit expansion — not simply short-term momentum or sentiment-driven rallies.

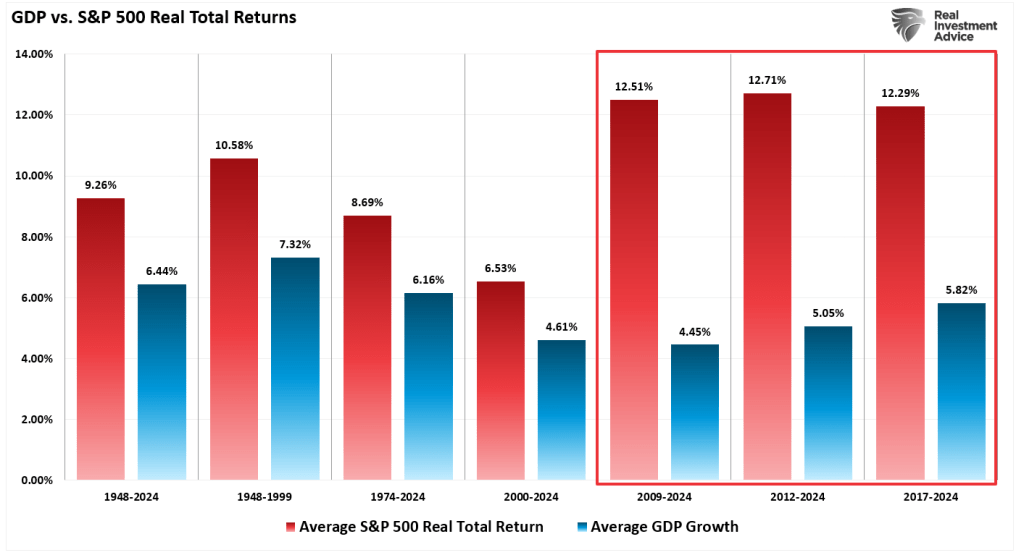
    “The chart illustrates average annual inflation-adjusted total returns (including dividends) dating back to 1948, using total-return data compiled by Aswath Damodaran at the NYU Stern School of Business. From 1948 through 2024, the stock market delivered an average real return of 9.26%.

    However, in the years following the 2008 financial crisis, inflation-adjusted total returns increased by nearly three percentage points across the last three measured periods.

    Here’s the challenge: real (inflation-adjusted) equity returns are relatively straightforward to conceptualize. Over time, they reflect economic growth (GDP) plus dividend income, minus inflation. That relationship broadly held from 1948 to 2000.

    Since 2008, though, the math has diverged. Nominal GDP growth has averaged roughly 5%, and dividend yields have hovered near 2%. Yet actual market returns have significantly exceeded what that underlying economic engine would normally justify in terms of sustainable earnings expansion.”

    That 15-year divergence is not particularly surprising. As discussed in “Pavlov Rings the Bell,” markets have repeatedly been cushioned from deeper corrections by aggressive fiscal and monetary intervention.

    Over the past decade and a half, major drawdowns were often met with policy stimulus — whether through deficit spending or actions by the Federal Reserve. Each episode of support was followed by market recovery, reinforcing a powerful feedback loop: intervention became associated with rising asset prices.

    In effect, investors were conditioned to expect rescue during periods of stress — to buy every dip under the assumption that policymakers would step in. That conditioning ties directly to the concept of “moral hazard.”

    Moral hazard (noun, economics): A reduced incentive to guard against risk when one is shielded from its consequences — as with insurance protection.

    Following the Global Financial Crisis, near-zero interest rates and repeated rounds of quantitative easing strengthened the belief that a policy backstop would reappear whenever volatility increased. Over time, that expectation hardened into a reflexive behavior: assume support, assume recovery, assume higher prices.

    Those sustained supports — in both the real economy and financial markets — helped drive a wedge between underlying economic fundamentals and realized financial returns. In other words, policy intervention became a key force behind the growing disconnect between economic reality and asset-price performance.

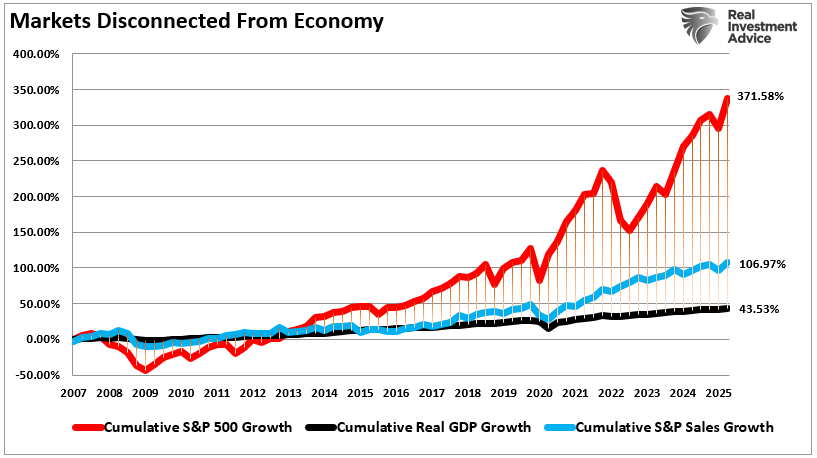
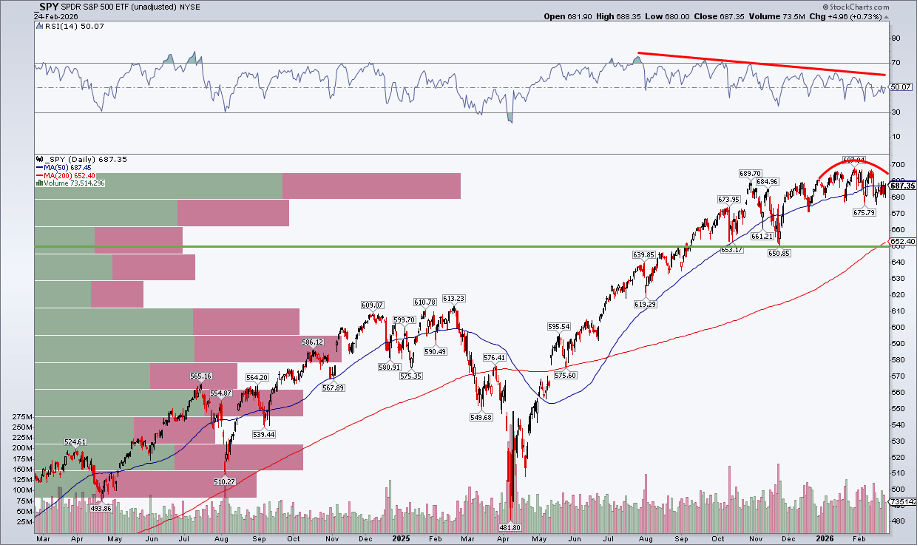
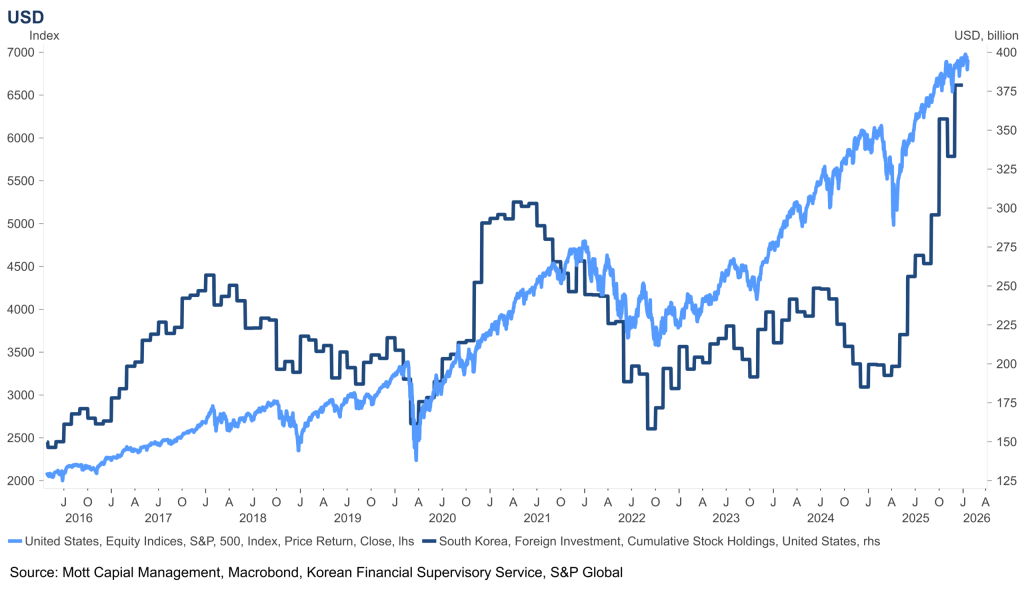
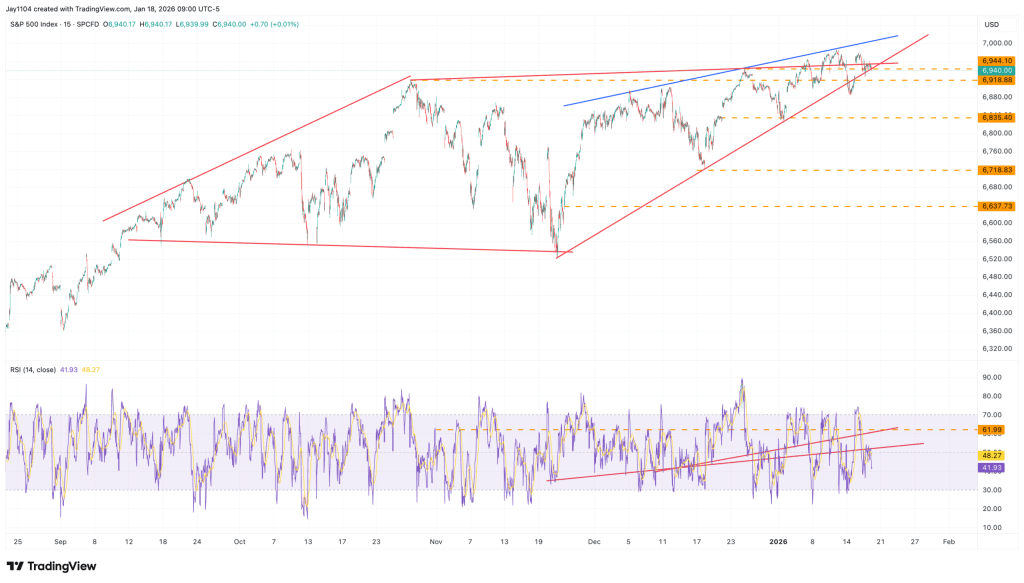
    At present, GDP growth has continued to surprise to the upside, and several macro indicators reflect ongoing resilience. At the same time, major equity benchmarks such as the S&P 500 have climbed to record levels. That advance has been fueled less by current consumer sentiment and more by expectations of future earnings growth.

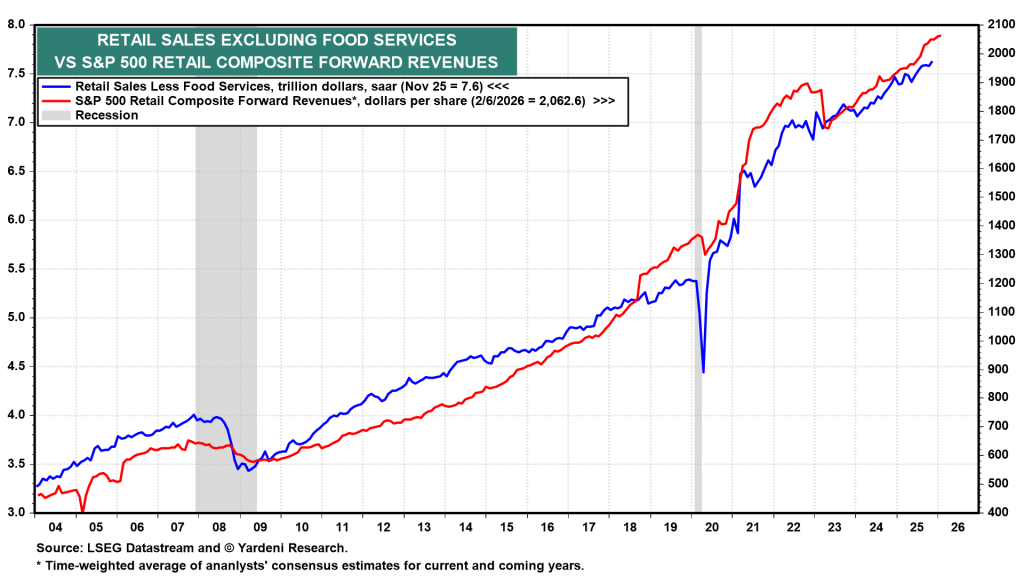
    The challenge, however, is that equity valuations appear increasingly disconnected from underlying revenue growth. Markets are pricing in optimism about future expansion, even as broad-based income and demand trends remain uneven.

    There is also a structural limitation embedded in the “wealth effect.” Rising stock prices can support consumption by boosting household net worth. Yet equity ownership in the United States is highly concentrated. Roughly 87% of equities are owned by the top 10% of households. As a result, the transmission from higher stock prices to broader economic activity is narrower than headline gains might suggest.

    That concentration is reflected in spending patterns as well. The top 40% of income earners now account for approximately 80% of total consumption. Consequently, while financial asset values have surged, the macroeconomic lift from those gains is disproportionately tied to higher-income households — leaving sentiment among the broader population more subdued than market performance alone would imply.

    That divergence goes a long way toward explaining the disconnect between subdued consumer sentiment and robust headline economic data.

    When growth and market gains are concentrated among higher-income households — and asset-price appreciation primarily benefits those with significant equity exposure — aggregate statistics can remain strong even as large segments of the population feel financial strain.

    In other words, the macro numbers reflect the strength of those driving the bulk of spending and asset ownership, while sentiment surveys capture the broader lived experience. The result is an economy that looks resilient on paper but feels far less secure to many households.

    Consumer Confidence Surveys Remain Soft Even as Economic Data Stays Strong

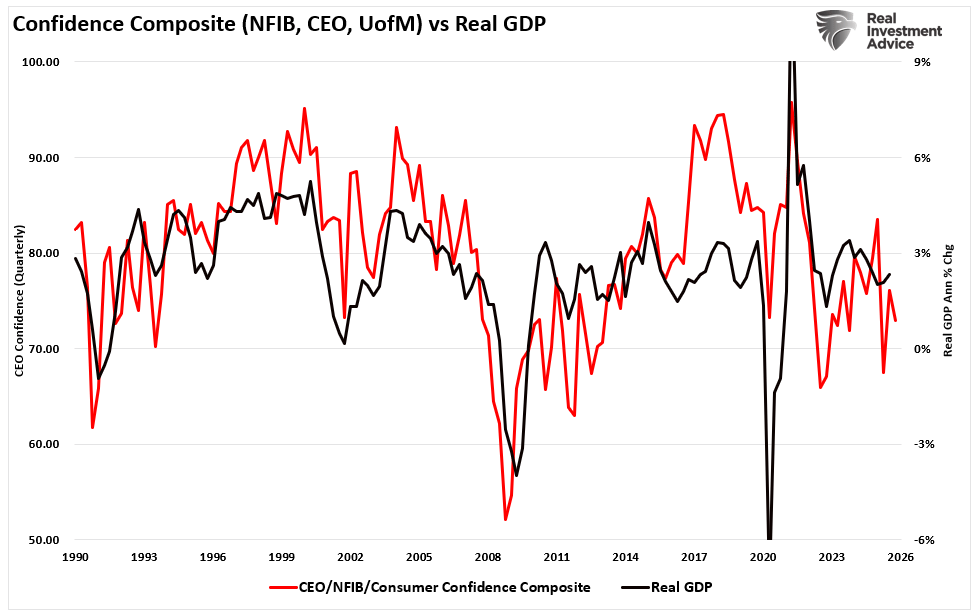
    In clear contrast to upbeat macroeconomic indicators and strong equity market gains, consumer sentiment readings have deteriorated significantly. Both the Conference Board Consumer Confidence Index and the University of Michigan Surveys have fallen steeply over the past two years, even as stock prices have climbed. Historically, consumer sentiment tends to move in tandem with rising markets, which is intuitive. The chart below presents a composite measure combining these two leading sentiment indicators.

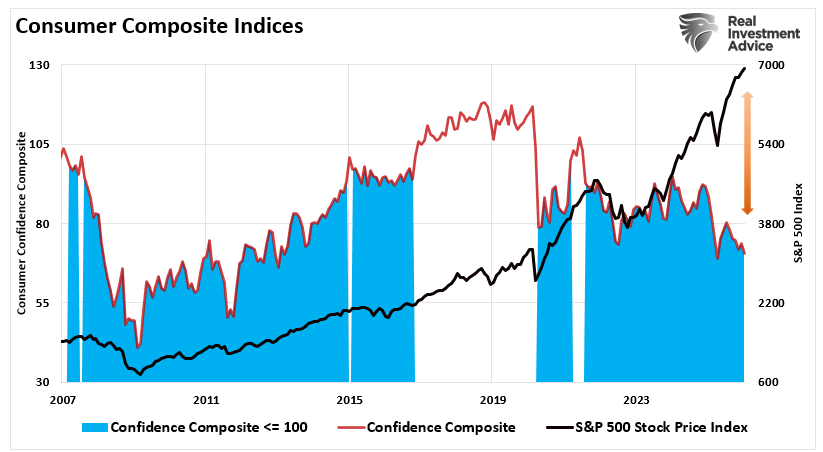
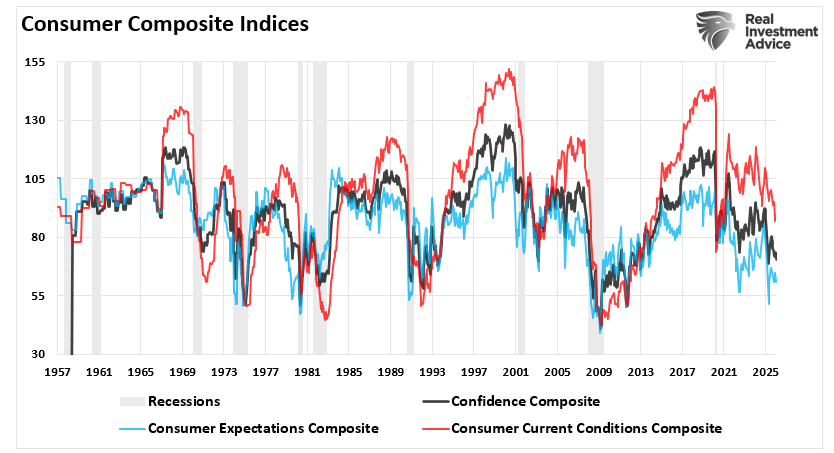
    In both surveys, readings on current conditions and future outlook remain notably subdued, with the expectations component dropping to levels that have historically been linked to recession warnings.

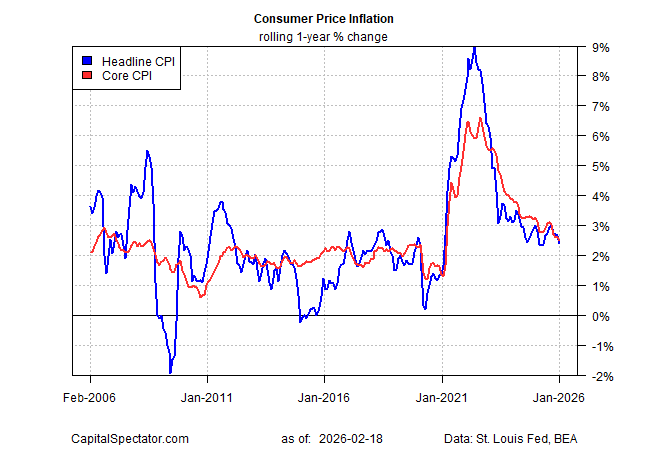
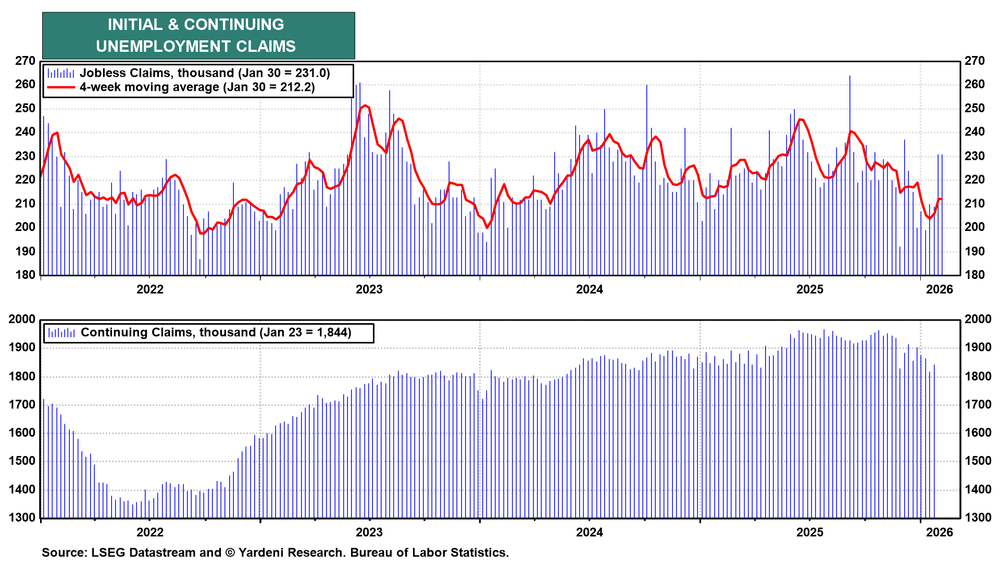
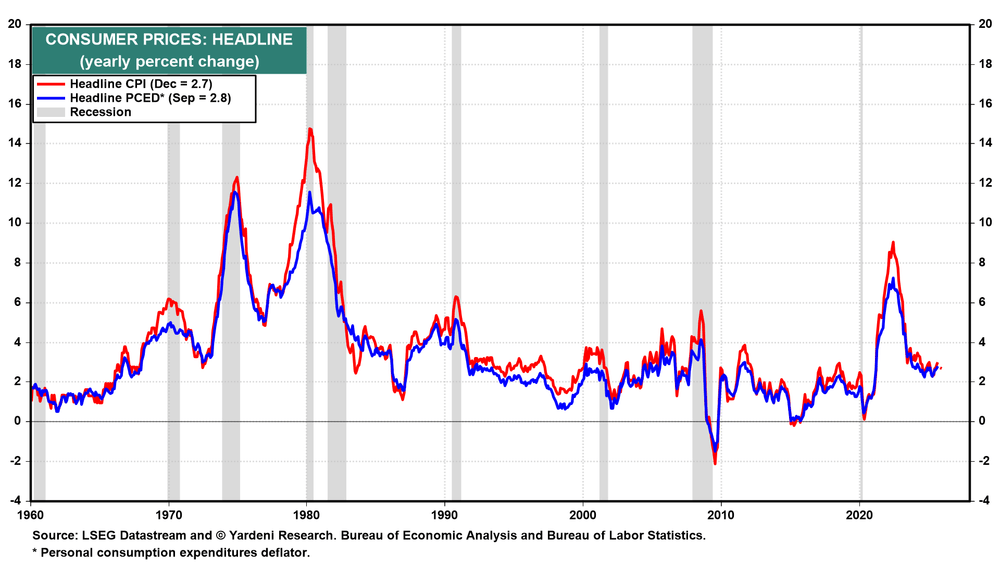
    The downturn in sentiment points to rising concerns over employment prospects, business conditions, and future income. Respondents frequently highlighted worries about inflation, elevated prices, food and energy expenses, the affordability of health insurance, and broader geopolitical and political uncertainty. Yet despite this widespread unease, GDP has continued to grow.

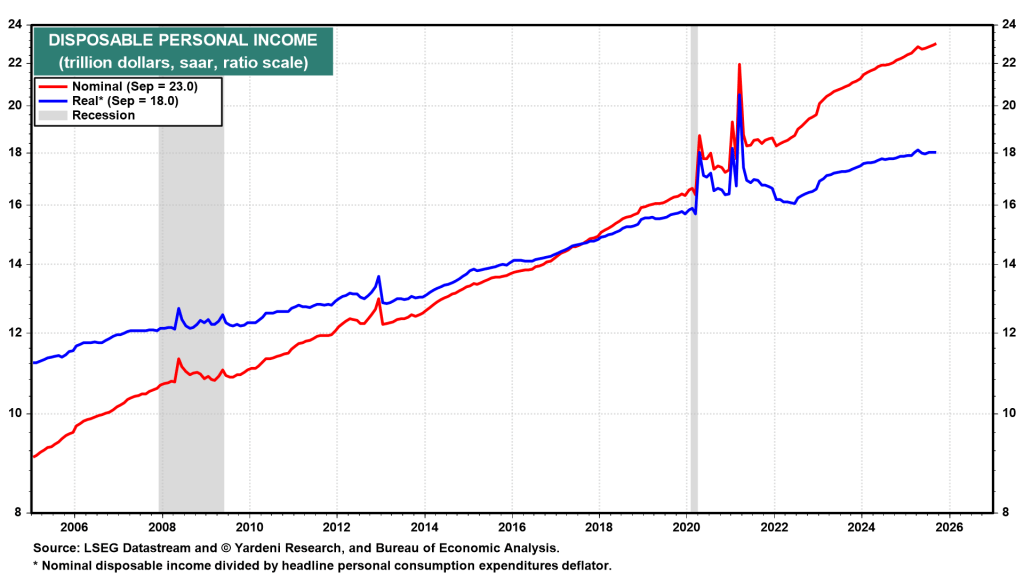
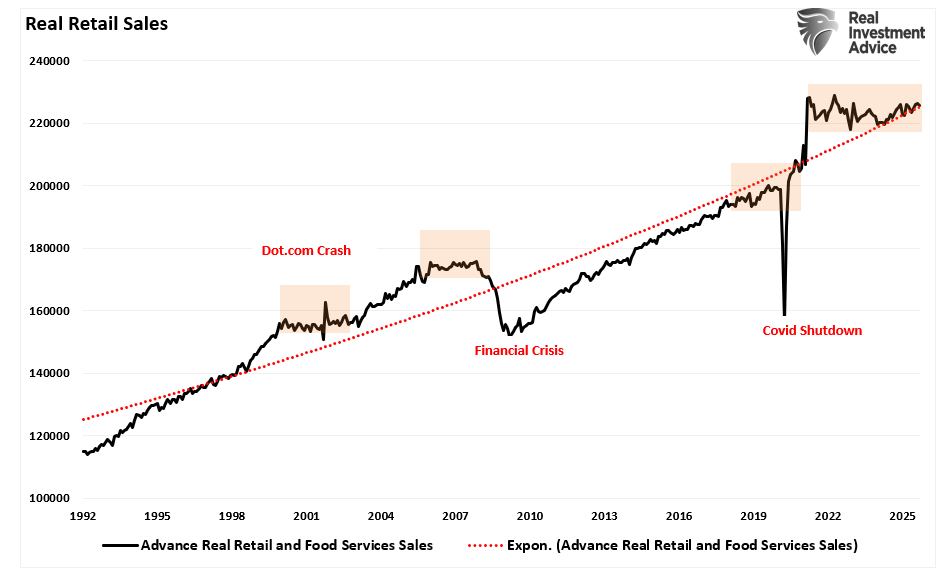
    Importantly, the gap between soft sentiment data and hard economic figures is not unprecedented. Analysts have often observed that consumer attitudes tend to lag underlying economic performance, and sentiment could improve if expansion persists. In the near term, surveys typically capture prevailing fears and uncertainty, which can weigh on confidence even when actual spending remains relatively solid. Although nominal figures indicate that consumer spending is holding up, much of that resilience reflects paying higher prices for the same—or even fewer—goods, rather than an increase in real consumption, which helps explain the sustained weakness in sentiment readings.

    Importantly, if consumer sentiment influences spending—and consumption accounts for roughly 68% of the economy—then that spending ultimately represents demand for businesses of all sizes. In a genuinely strong growth environment, we would expect improving demand to be mirrored by rising confidence across households. Yet, as the composite index illustrates, sentiment levels remain subdued. The historical relationship between confidence measures and the future trajectory of economic activity underscores why this divergence warrants attention.

    Soft sentiment readings do not necessarily signal an imminent downturn. However, they do reflect a guarded mindset among both consumers and business owners. That caution can translate into more restrained spending across key components of GDP. If confidence remains depressed, a moderation in economic activity would be a reasonable outcome.

    Why the Divergence Matters and What It May Signal Ahead

    The gap between solid economic data, rising equity markets, and subdued consumer confidence carries meaningful implications. On the surface, macro indicators point to continued expansion, reinforcing higher stock prices and optimistic earnings forecasts. Yet beneath that strength, households and many business owners report lingering insecurity and pessimism about the future.

    This disconnect prompts several key questions:

    • Can growth remain durable if confidence stays depressed?
    • Will corporate earnings hold up if consumers begin to retrench?
    • Could persistent pessimism eventually shape real-world behavior, leading to slower spending and softer growth?

    History offers cautionary precedents where negative sentiment foreshadowed downturns—not because the hard data was inaccurate, but because sentiment ultimately influenced economic decisions.

    The divergence also highlights distributional dynamics. Aggregate growth figures often mask disparities in income and wealth. Higher-income households account for roughly half of total consumption, while lower-income groups may not fully share in the benefits of expansion. That imbalance helps explain weaker sentiment readings. It also leaves markets vulnerable to any shock that prompts affluent consumers to scale back spending—particularly in an environment where the gap between economic “haves” and “have-nots” remains wide.

    Investment Implications

    For investors, this mixed backdrop argues for disciplined risk management. Markets may continue advancing on elevated earnings expectations, but those expectations can shift quickly as economic conditions evolve.

    • Scrutinize valuations. Rising indices do not preclude overpricing. Favor firms with strong balance sheets, reliable cash flows, and pricing power.
    • Diversify thoughtfully. Sector performance can diverge sharply. Defensive areas such as utilities, consumer staples, and healthcare often prove more resilient during sentiment-driven slowdowns.
    • Track leading indicators. Watch employment trends, consumer credit conditions, and forward-looking economic indices. Weak confidence can precede softer activity.
    • Maintain liquidity. Holding cash provides flexibility amid volatility created by divergence.
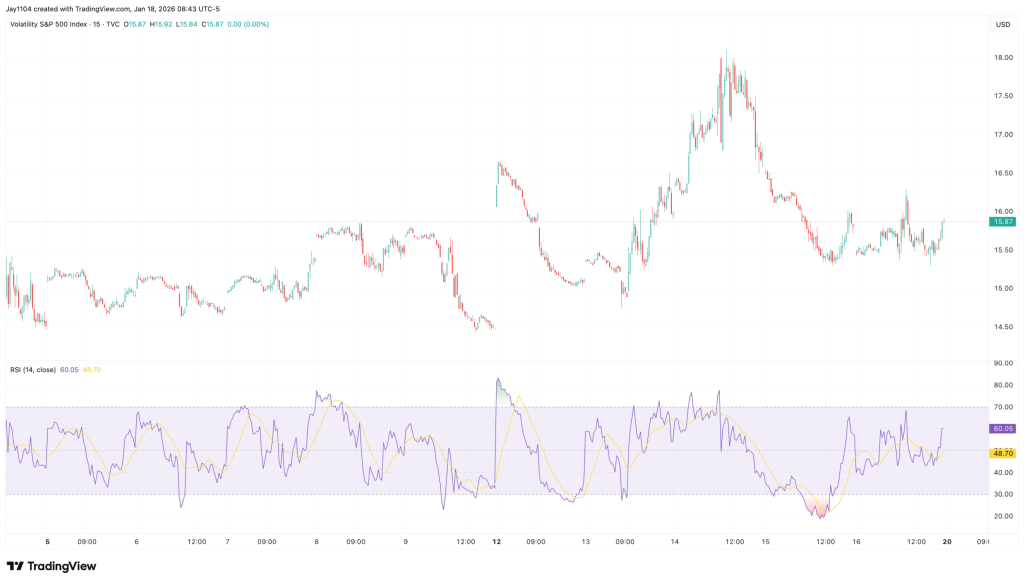
    • Consider hedging strategies. Exposure to bonds or volatility-linked instruments may help cushion downside risks.
    • Emphasize quality. Companies with durable competitive advantages are typically better positioned to navigate uncertainty.

    The split between hard data, market performance, and consumer mood represents a meaningful economic signal. While there are persuasive arguments that markets can continue climbing and that pullbacks should be bought, prudence requires acknowledging alternative outcomes.

    To borrow a well-known observation from Bob Farrell:

    Historically, when “all experts agree,” discipline and preparation for the unexpected have often proven wise.

    Sources: Lance Roberts

  • The Inflation Indicator Economists May Be Overlooking

    Inflation measurement sits at the core of modern macroeconomics. Interest-rate policy, asset valuations, fiscal planning, and central-bank credibility all hinge on how price pressures evolve. Yet the benchmark most policymakers rely on — the Consumer Price Index (CPI) — is a monthly government report designed for a far less digitized and fast-moving economy.

    Increasingly, market participants are supplementing that traditional gauge with real-time alternatives. Among them, Truflation has emerged as the most widely cited live inflation index. Built from millions of observed prices and updated continuously, it offers a near real-time snapshot of price dynamics. In early 2026, its signal diverges meaningfully from official CPI data.

    Methodology and Structural Differences

    Truflation was launched in December 2021 amid frustration over the lag in official inflation reporting. While CPI is released monthly and relies heavily on surveys, sampling, and statistical smoothing, Truflation applies a bottom-up, digitally native methodology.

    The index aggregates data from more than 30 million items across 30+ licensed providers — including online retailers, housing platforms, and consumer-data firms. Prices update daily and are secured through decentralized oracle infrastructure on the Chainlink network, increasing transparency and reducing the risk of retrospective revisions.

    Like CPI, Truflation tracks twelve broad consumption categories. However, its category weights are recalibrated annually using observed spending patterns rather than fixed survey-based assumptions. This allows the index to adjust more quickly to shifts in consumer behavior and pricing trends.

    Historically, that responsiveness has mattered. Empirical comparisons suggest Truflation has often led CPI turning points by roughly 40 to 75 days, flagging inflection points in inflation momentum well before they appear in official releases.

    Institutional Validation

    Skepticism toward alternative measures is natural. Still, Truflation has begun clearing some of the credibility hurdles required for broader institutional adoption.

    Throughout 2024 and 2025, its short-term forecasting accuracy was notable. In many instances, its readings anticipated CPI outcomes within approximately ±0.1 percentage points. That degree of precision has encouraged growing usage among macro hedge funds and systematic trading strategies.

    Institutional validation advanced further in early 2026 when Truflation was integrated into the Bloomberg L.P. terminal ecosystem — a quiet but meaningful step that elevated it from a crypto-native experiment into a recognized macro data input.

    Transparency also strengthens its appeal. Daily updates, publicly documented methodology, and auditability offer advantages in markets that reprice continuously, where a 30-day lag can materially affect positioning.

    The 2026 Divergence

    By mid-February 2026, the spread between Truflation and official CPI readings had widened to one of the largest gaps since the index was created:

    • Official CPI (January 2026): 2.4% year-over-year
    • Truflation (Feb 1–18, 2026): ~0.7%
    • Core CPI: ~2.5%
    • Truflation core proxy: ~1.3%

    Such a divergence presents a challenge: either real-time data are signaling a rapid disinflationary shift not yet captured by government statistics, or the high-frequency approach is temporarily underestimating sticky components embedded in CPI.

    If historical lead times hold, markets may need to reassess the inflation trajectory sooner rather than later.

    The widening gap between the two measures points to fundamentally different interpretations of current inflation momentum. The central source of divergence is housing.

    Truflation incorporates real-time asking rents pulled from active market platforms, capturing the recent cooling in rental prices as it happens. By contrast, official CPI relies heavily on “Owner’s Equivalent Rent,” a survey-based estimate that typically lags actual rental-market conditions by six to twelve months.

    In effect, the two gauges are measuring different time horizons. Truflation reflects present housing dynamics, while CPI still embeds rental trends from prior quarters.

    The macro implications are significant. If the real-time signal is more accurate, the U.S. economy could be moving closer to disinflation — or even deflationary — conditions, historically associated with rising recession risk. Meanwhile, official data continue to portray a controlled soft landing, with inflation appearing comfortably near target.

    Explaining the Reluctance

    Despite its growing track record, many economists remain hesitant to incorporate Truflation into formal macro frameworks. The resistance tends to rest on three main arguments.

    1. Institutional inertia.
    CPI has decades of embedded usage. Forecasting models, policy rules, asset-allocation frameworks, and academic research are all synchronized to its monthly release cycle. Integrating a daily inflation measure would require reworking not only projections, but established institutional workflows.

    2. Volatility bias.
    Because Truflation updates continuously, it can display sharp short-term swings. A rapid daily decline may be dismissed as noise, even when it reflects genuine pricing shifts. By comparison, CPI’s smoothed profile feels more stable — even if that stability comes at the expense of timeliness.

    3. Composition differences.
    Truflation assigns slightly less weight to housing than CPI. Critics argue this could understate inflation during periods of accelerating rents. Yet the reverse also holds true: when rental markets cool quickly, CPI may overstate underlying price pressure — which appears to be the present dynamic.

    Ultimately, the hesitation is less about data availability and more about comfort. A measure that moves faster and smooths less inevitably challenges established interpretive habits.

    Conclusion: Why the Signal Matters

    If Truflation’s current reading is directionally correct, monetary-policy expectations could be misaligned with underlying inflation trends. The Federal Reserve may have greater scope to ease than prevailing consensus assumes, even as headline data suggest economic resilience.

    This does not mean Truflation should replace CPI as the official benchmark. But when divergences persist and widen, dismissing the alternative becomes increasingly difficult.

    More broadly, the debate underscores a structural issue: inflation cannot be treated solely as a once-a-month statistic in an economy where prices adjust continuously. Measurement tools must evolve alongside market speed.

    Truflation’s importance does not rest on perfection. Its value lies in timeliness, transparency, and the growing challenge of ignoring what it is signaling.

    Sources: Charles-Henry Monchau

  • U.S.–Iran talks approach as Palo Alto Networks gets set to release earnings, drawing market attention.

    Most Asian currencies slipped on Friday as investors weighed a mixed interest rate outlook across the region. The Australian dollar was on track for a solid monthly gain, while the Japanese yen remained under pressure.

    The Chinese yuan declined after Beijing lowered a key reserve requirement to make dollar purchases cheaper domestically, though the currency continued to hover near three-year highs.

    Meanwhile, the dollar index and dollar index futures edged down about 0.1% in Asian trading. Despite the dip, the greenback was up 0.7% for February, supported by safe-haven demand and lingering uncertainty over the direction of interest rates.

    Japanese yen subdued after weak Tokyo CPI, February decline in focus

    The Japanese yen saw the USD/JPY pair slip 0.2% on Friday and was on track to gain 0.7% for February.

    Pressure on the yen intensified as uncertainty grew over the timing of the Bank of Japan’s next interest rate hike. Those doubts deepened following softer-than-expected consumer price index data from Tokyo for February.

    The reading—often viewed as a leading indicator for nationwide inflation—showed core CPI falling below the BOJ’s 2% annual target for the first time in nearly four years, potentially complicating the central bank’s plans for further rate increases.

    The yen had weakened earlier in February amid concerns about the fiscal implications of Prime Minister Sanae Takaichi’s proposed stimulus measures and tax cuts. However, she appeared to gain momentum for advancing her fiscal agenda after her ruling coalition secured a supermajority in Japan’s lower house of parliament.

    Chinese Yuan slips after PBOC lowers FX risk reserve ratio

    The Chinese yuan’s USD/CNY pair rose 0.2% on Friday after the People’s Bank of China removed a key foreign exchange risk reserve requirement for certain forward contracts—a step that makes dollar purchases cheaper domestically.

    The move follows a strong rally in the yuan against the dollar in recent months, partly fueled by exporters offloading the greenback amid a robust trade surplus with the United States.

    However, rapid appreciation of the yuan can weigh on Chinese exporters by shrinking returns on overseas sales. Friday’s decision suggests the central bank may be aiming to curb further strength in the currency.

    The yuan had approached a three-year high on Thursday before pulling back.

    Australian dollar set for February gains on hawkish RBA outlook

    The Australian dollar’s AUD/USD pair climbed 0.25% on Friday, ranking among Asia’s top performers for the month.

    The Aussie was on track to advance 2.3% in February, largely supported by a more hawkish stance from the Reserve Bank of Australia. The central bank raised interest rates by 25 basis points earlier in the month and signaled it would tighten further if inflation fails to ease.

    Stronger-than-expected January CPI data released this week reinforced expectations that the RBA could deliver additional rate hikes.

    Elsewhere in the region, most Asian currencies edged lower on Friday. The South Korean won’s USD/KRW pair ticked up slightly but remained down 1.3% for February.

    The Indian rupee’s USD/INR pair steadied after climbing back above the 91-per-dollar mark, though it was still 0.8% weaker this month, despite gaining support from a U.S.–India trade agreement.

    Meanwhile, the Singapore dollar’s USD/SGD pair was little changed on the day and down 0.7% for February.

    Sources: Ambar Warrick

  • US Dollar, S&P 500 and Yields: Could March Trigger Heightened Market Volatility?

    Key Takeaways

    • The benchmark 10-year Treasury yield is testing critical support, with downside pressure beginning to build.
    • Equities and bond yields are sliding in tandem — an unusual combination that may reflect deteriorating macro-risk conditions.
    • A strengthening US dollar alongside declining yields could point to a broader defensive rotation across markets.

    Last week, attention was drawn to the danger zone in the CBOE Volatility Index. Historically, when Wall Street’s “fear gauge” climbs into the mid-20s, equity markets have tended to experience heightened turbulence.

    Now, focus shifts to the benchmark 10-year US Treasury yield. Recently, declining yields have supported the S&P 500 — particularly small- and mid-cap shares — since the so-called Liberation Day and the development of the expansive One Big Beautiful Bill Act (OBBBA). Additional fiscal stimulus or tax relief may still be forthcoming, as suggested by Donald Trump during Tuesday night’s State of the Union address.

    Importantly, the surge in yields last April and May was not confined to the United States. Global bond markets reached multi-decade highs, pulling US Treasuries higher in tandem. Despite narratives around “selling America,” the primary US bond bear market unfolded between August 2020 and October 2023, when the 10-year yield climbed sharply from 0.504% to 4.997%. The past two and a half years have largely represented a consolidation phase rather than a fresh structural breakout.

    The key question now: is that consolidation nearing resolution — and if so, in which direction?

    10-Year Treasury Yield: A historic tightening pattern after the major bond bear market. Chart courtesy of StockCharts.com.

    Treasuries Under the Spotlight

    The chart below suggests that the 10-year Treasury yield could be slipping beneath a critical support level. A brief upside breakout in January quickly reversed as sellers stepped in, and now the benchmark rate is hovering near the 3% mark. It’s worth reminding traders that diagonal trendlines can be unreliable, while horizontal support and resistance levels tend to carry more weight. Additionally, log-scale charts are generally better suited for evaluating wide swings in price or yield.

    With those caveats noted, what is the chart signaling? Trading below both the 50-day and 200-day moving averages, the primary trend favors Treasury price bulls (and lower yields). Meanwhile, the RSI has eased back toward the 30 level after failing to reach 70 during the fourth-quarter rate advance. The green upward-sloping support line is now pivotal — a decisive break beneath it, along with a drop below the late-2025 low of 3.947%, could push the 10-year yield down into the low 3% range.

    10-Year Treasury Yield: Multi-Year Consolidation With Key Support at Risk (Log Scale). Chart courtesy of StockCharts.com.

    In isolation, increasing exposure to Treasuries would be logical if yields break down and bond prices attract strong demand. But stepping back with an intermarket perspective, the bigger question becomes: what would that move signal for the broader financial markets?

    A Potential Shift in the Stock–Bond Dynamic?

    For stocks, a move toward 3–4% intermediate-term rates would likely coincide with softer economic conditions — perhaps a weak jobs report, sharply cooling CPI or PCE inflation, a downturn in sentiment indicators such as the ISM Manufacturing survey, or another disappointing Retail Sales release.

    That said, with the fourth-quarter earnings season mostly wrapped up — including NVIDIA’s (NASDAQ: NVDA) results released Wednesday — it would probably take truly bleak off-season earnings updates or a wave of negative preannouncements to significantly rattle equities.

    Another potential driver of a renewed bond bull market could be the ever-intensifying AI theme. In a “sell first, ask questions later” climate, fresh cautionary analyses or existential-impact discussions around artificial intelligence could further unsettle investors and sustain demand for safe-haven assets.

    When Trading Ranges Start to Break Down

    Regardless of the underlying catalyst, it’s evident that stocks and bonds are no longer moving in sync the way they did last spring and summer. The S&P 500 — like the 10-year Treasury yield — has been edging lower in recent weeks. We’re now nearly a month past the SPDR S&P 500 ETF Trust (SPY) intraday record of $697.84. Although much attention has focused on the tight trading range since late November, one could argue that a rounded-top formation is beginning to take shape.

    A glance at the RSI momentum oscillator reinforces this view. Momentum has been trending lower since July. Much like a ball tossed into the air slows before changing direction, RSI often decelerates ahead of a price reversal. The unfolding narrative could be this: bond yields break down first — and equities eventually follow.

    SPY: Emerging Rounded-Top Pattern, RSI Deteriorating, 200-Day Moving Average Around $650. Chart courtesy of StockCharts.com.

    Don’t Overlook the Dollar

    Largely flying under the radar is the US Dollar Index (USD). The greenback carved out a low near 95.55 around the same time U.S. large-cap equities peaked. Since then, the 98 level has surfaced as a potential breakout zone.

    A setup featuring falling Treasury yields, declining stocks, and a strengthening dollar would reflect a classic risk-off macro environment. Based on a measured-move projection, the USD could target the 100 area — just shy of the zone where the dollar encountered resistance from May through November 2025.

    US Dollar Index: Short-Term Ascending Triangle Pattern Points Toward 100. Chart courtesy of StockCharts.com.

    The Bottom Line

    Is this a doomsday forecast? Not at all. Market corrections are a normal part of the cycle. On average, the S&P 500 experiences an intra-year drawdown of about 14.2%, yet it has still finished higher in 35 of the past 46 years.

    Rather than sounding alarms, this is simply a cross-asset check-in as we head into a month that has historically delivered heightened volatility. I tend to think of March as October’s little brother — price swings can become exaggerated. And with the CBOE Volatility Index still hovering around 20, disciplined risk management deserves to remain front and center.

    Sources: Mike Zac

  • The dollar edges higher on upbeat economic data; the euro holds steady while the yuan weakens.

    The U.S. dollar recovered on Tuesday after the prior session’s slide, supported by upbeat economic data, while investors stayed cautious amid fresh volatility tied to President Donald Trump’s tariff policies.

    At 15:24 ET (20:24 GMT), the Dollar Index—measuring the greenback against six major currencies—rose 0.2% to 97.86, after falling as much as 0.5% a day earlier.

    Strong data underpin dollar

    Encouraging economic releases lent the dollar some backing. ADP reported a gain of 12.8K in private payrolls last week, exceeding the previous reading. In addition, the Conference Board’s consumer confidence index for February surprised to the upside at 91.2.

    According to José Torres, senior economist at Interactive Brokers, the stronger-than-expected figures nudged both the dollar and yields modestly higher, with a bear-flattening move led by shorter-dated maturities that are more sensitive to monetary policy.

    He noted that firmer labor data are pushing rates up, as improving employment conditions weaken the case made by dovish Federal Reserve members for interest rate cuts based on softening job trends.

    Trade tensions cloud outlook

    Despite the rebound, uncertainty surrounds the U.S. currency as Trump’s revised tariff plans take shape following a Supreme Court ruling that his use of a 1977 emergency law to impose tariffs overstepped his authority.

    In response, Trump said he would lift a temporary import tariff from 10% to 15% on goods from all countries. The move has cast doubt on the reliability of trade agreements reached prior to the ruling. Reflecting this uncertainty, the European Parliament delayed a vote on the European Union’s trade pact with the United States due to the new import tax.

    Trade concerns have resurfaced at a time when questions are also emerging over the durability of heavy investment in artificial intelligence and the resilience of the U.S. economy after last week’s weak growth data.

    Euro steady; Yen under pressure

    In Europe, EUR/USD slipped 0.1% to 1.1779, with the euro largely steady after ECB President Christine Lagarde reiterated in Washington that the European Central Bank’s rate policy remains in a “good place,” while emphasizing the need for flexibility.

    GBP/USD edged up 0.1% to 1.3501 ahead of parliamentary testimony from four Bank of England rate-setters, which may shape expectations before the March policy meeting.

    In Asia, USD/JPY jumped 1% to 155.76 as expectations for near-term tightening by the Bank of Japan softened. The yen was also pressured by a Nikkei report suggesting U.S. authorities led recent rate-check efforts aimed at supporting Japan’s currency.

    USD/CNY fell 0.4% to 6.8830 after the People’s Bank of China kept its one-year and five-year loan prime rates unchanged, signaling Beijing’s preference for calibrated support while balancing growth and financial stability. Chinese markets reopened Tuesday following the Lunar New Year holiday.

    Elsewhere, AUD/USD rose 0.1% to 0.7060, while NZD/USD advanced 0.2% to 0.5967.

    Sources: Anuron Mitra

  • No Way Out, Major Shock, Deeper Cuts as Trade Deficit Reaches $901.5 Billion

    Thursday’s headline from the United States Department of Commerce showed the U.S. trade deficit widening sharply to $70.3 billion in December and reaching $901.5 billion for full-year 2025. December imports jumped 3.6% to $357.6 billion, while exports fell 1.7% to $287.3 billion. Economists had projected a $55.8 billion gap, making the release a significant downside surprise that prompted many to cut fourth-quarter GDP forecasts. Following the data, the Federal Reserve Bank of Atlanta lowered its Q4 GDP estimate to 3% from 3.6%.

    The Commerce Department’s preliminary report showed the economy expanded at just a 1.4% annualized pace in Q4, well below the 2.8% consensus estimate. Federal government spending dropped 16.6% during the quarter — largely due to the shutdown — subtracting roughly one percentage point from growth. The wider trade deficit further weighed on output. For all of 2025, GDP rose 2.2%. Treasury yields drifted lower after the report, increasing expectations that the Federal Reserve may move toward another rate cut.

    One potential obstacle to near-term easing is inflation. The Personal Consumption Expenditures (PCE) index rose 0.4% in December and 2.9% year-over-year. Core PCE, excluding food and energy, also climbed 0.4% on the month and 3% annually. On a positive note, consumer spending advanced 0.4% in December, offering some support for future growth momentum.

    In financial markets, private credit came under scrutiny after Blue Owl Capital permanently restricted redemptions from one of its retail vehicles, Blue Owl Capital Corp II. The move triggered declines in alternative asset managers including Ares Management, Apollo Global Management, KKR, Blackstone, and TPG. Adding to concerns, BlackRock recently marked down portions of its private credit portfolio. Former PIMCO CEO Mohamed El-Erian publicly questioned whether this could signal a broader stress point for the sector.

    In a separate development, The Wall Street Journal reported that President Donald Trump ordered the release of government files related to UFOs and unidentified aerial phenomena following heightened public interest. The directive reportedly came after comments by former President Barack Obama referencing extraterrestrial topics. Christopher Mellon, who previously helped publicize the “Tic Tac” military footage, suggested the move could have far-reaching implications.

    Taken together, the combination of a widening trade deficit, softer GDP growth, persistent inflation, and emerging private credit strains presents a complex macro backdrop — one that leaves markets balancing expectations of further rate cuts against lingering structural risks.

    Sources: Louis Navellier

  • Trump’s Tariff Strategy Is Starting to Fray — And Markets Are Taking Notice

    When President Donald Trump returned to the White House in January 2025, he reaffirmed tariffs as the core instrument of his economic strategy — a blend of leverage, protectionism, and industrial revival. That strategy is now facing meaningful strain.

    The recent ruling by the Supreme Court of the United States that Trump exceeded his authority in imposing sweeping global tariffs without congressional approval represents more than a procedural setback. It challenges the legal scaffolding underpinning a trade agenda that has shaped U.S. economic and foreign policy over the past year.

    Markets have taken note — but without panic.

    The contrast is notable. A defining pillar of presidential economic policy has been curtailed, yet equity markets remain resilient. Volatility has surfaced intermittently, but capital has not fled risk assets. Understanding this requires separating political drama from financial mechanics.

    In theory, tariffs were meant to rebalance trade and accelerate reshoring. In practice, they largely operated as a cost-transfer mechanism. Importers absorbed part of the burden; consumers absorbed another portion through higher goods prices. Manufacturers dependent on global inputs faced margin compression. Retailers recalibrated pricing strategies. Supply chains, already strained in prior years, became more complex.

    Economic data reflect this friction. Growth momentum has slowed from last year’s pace. Manufacturing surveys show uneven demand. Trade-sensitive capital expenditure has cooled. Meanwhile, inflation remains sticky — particularly in services — and goods categories exposed to import costs have seen renewed firmness. The anticipated mix of rapid expansion and stable prices has not materialized.

    Markets, however, trade forward expectations — earnings trajectories and liquidity conditions — rather than political symbolism.

    Large-cap U.S. equities continue to attract global capital, particularly in AI and advanced technology. Investment in semiconductors, cloud infrastructure, and computing capacity remains strong despite macro uncertainty. Earnings concentration in these sectors offsets weakness in more cyclical areas.

    Investors see deceleration, not collapse. Corporate balance sheets remain broadly healthy. Employment is moderating but not deteriorating sharply. Financial conditions are tighter than in prior cycles, yet not restrictive enough to signal systemic stress.

    Against this backdrop, a potential scaling back of tariffs introduces nuance rather than shock.

    If trade barriers are diluted or subject to firmer congressional oversight, input costs could ease over time. That may gradually relieve goods-based inflation pressures. Supply chain planning could improve. Corporate forecasting may gain clarity — and clarity reduces risk premiums.

    Bond markets reflect this balance. Treasury yields have fluctuated as investors weigh persistent inflation against moderating growth. Should tariff-driven price pressures fade, longer-term yields may stabilize. However, fiscal deficits and wage resilience continue to exert upward pressure. The tension remains unresolved.

    Currency markets face competing forces. Reduced trade escalation could temper safe-haven demand for the dollar. Yet relative U.S. growth and yield differentials still offer structural support. Conviction remains limited.

    Emerging markets are unlikely to move uniformly. Economies closely tied to U.S. demand may feel slower export momentum if domestic growth softens. Commodity exporters could benefit if inflation expectations anchor raw material prices at elevated levels. Capital allocation is becoming more selective.

    None of this implies smooth conditions ahead.

    Political backlash to the court’s decision could generate renewed volatility. Legislative countermeasures remain possible. Trade partners will recalibrate strategy in response to shifting U.S. authority.

    Markets tend to resist escalation but adapt to adjustment.

    Trump’s tariff strategy was presented as transformative. The measurable economic payoff has been less decisive. Growth has moderated, inflation has persisted, and structural trade imbalances remain largely intact.

    Investors are pragmatic. A policy losing legal footing does not automatically trigger liquidation. If the outcome is reduced uncertainty and steadier price dynamics, equities can continue advancing even as political narratives fragment.

    Cautious optimism defines the current tone.

    Risk appetite remains conditional. A renewed acceleration in inflation would alter expectations quickly. A material deterioration in employment would challenge confidence. Fiscal expansion without corresponding growth would intensify long-term sustainability concerns.Markets are not celebrating policy unraveling — they are recalibrating probabilities.

    The assessment is sober: an economy that is softer but not broken; inflation that is persistent but not runaway; profitability concentrated but durable in structurally advantaged sectors.Trade authority may now face clearer constitutional limits. Structural investment in innovation continues.

    Capital ultimately flows toward earnings visibility and long-duration growth themes. Tariffs have dominated headlines. Technology and AI dominate capital expenditure.

    Investors are adjusting exposure and preparing for volatility — but not retreating.The tariff agenda is under pressure. Financial markets, for now, are looking past it.

    Sources: Nigel Green

  • The Dollar dips following the Supreme Court’s tariff decision, yet remains on track for its best weekly performance since November.

    The U.S. dollar edged lower on Friday as investors digested the impact of the Supreme Court’s decision to invalidate President Donald Trump’s broad tariff measures. Despite the pullback, the greenback remained on track for its strongest weekly advance since November, supported by a more hawkish tone from the Federal Reserve and ongoing geopolitical tensions between the U.S. and Iran.

    As of 17:31 ET (22:31 GMT), the Dollar Index slipped 0.2% to 97.72, though it was still poised to post a weekly gain of around 1%, its best showing in nearly three months.

    The Supreme Court ruled 6–3 that Trump lacked authority under the International Emergency Economic Powers Act (IEEPA) to implement sweeping reciprocal tariffs. The president criticized the decision as “deeply disappointing” and indicated that tariffs would remain in effect through alternative legal channels, alongside a new 10% global levy.

    According to Jeff Buchbinder of LPL Financial, removing the tariff overhang eliminates a drag on economic growth that had been expected to lift costs and pressure corporate margins. With that risk easing, growth may stabilize and inflation expectations embedded in bond markets could cool more quickly, potentially prompting a modest reassessment of Fed rate-cut expectations and weighing slightly on the dollar.

    Even so, the dollar had attracted demand earlier in the week, underpinned by resilient U.S. economic data, hawkish Fed meeting minutes, and heightened Middle East tensions.

    Friday’s data, however, delivered mixed signals. Core PCE — the Fed’s preferred inflation measure — rose 0.4% month-over-month and 3.0% year-over-year in December 2025, marking the highest annual reading since November 2023 and remaining well above the 2% target. Meanwhile, preliminary fourth-quarter GDP growth came in at 1.4%, falling short of the 2.8% consensus forecast.

    In Europe, EUR/USD ticked up 0.1% to 1.1781, though the euro was still headed for a 0.7% weekly decline amid uncertainty surrounding ECB President Christine Lagarde’s tenure and softer German producer price data. Analysts at ING noted that while sentiment indicators such as the ZEW survey disappointed, the eurozone composite PMI is expected to stay above the 50 threshold, limiting downside pressure on the euro.

    GBP/USD rose 0.1% to 1.3474, but sterling hovered near a one-month low and was set for a weekly loss of about 1.3%. Strong January retail sales — up 1.8% month-over-month and 4.5% year-over-year — failed to provide sustained support. ING analysts said markets are pricing in a Bank of England rate cut in March, with another possible move in June, while political risks continue to weigh on the pound.

    In Asia, USD/JPY held steady at 155.06 after data showed Japan’s inflation slowed to 1.5% in January, slipping below the Bank of Japan’s target for the first time in nearly four years. Core inflation excluding fresh food and fuel also moderated, reinforcing uncertainty over the timing of the next rate hike. Separate data showed Japanese factory activity expanded at its fastest pace in over four years in February.

    USD/CNY was unchanged at 6.9087, with Chinese markets closed. Meanwhile, AUD/USD climbed 0.5% to 0.70892, although the Australian dollar trimmed some gains after unemployment held at 4.1% in January, signaling a still-tight but gradually cooling labor market.

    Sources: Anuron Mitra

  • Forex Today: PMI Data from Key Economies and US GDP Figures Set to Boost Market Volatility

    Here’s what you need to know for Friday, February 20:

    The US Dollar Index (DXY) maintains its upward momentum, hovering near 98.00 after reaching a near one-month high on Thursday. The economic agenda for Friday features preliminary February Purchasing Managers’ Index (PMI) data from Germany, the Eurozone, the UK and the US. The spotlight, however, will be on the first estimate of fourth-quarter Gross Domestic Product (GDP) growth and the December Personal Consumption Expenditures (PCE) Price Index, both to be released by the US Bureau of Economic Analysis.

    The US Dollar outperformed major peers on Thursday amid a risk-off market tone fueled by rising tensions between the US and Iran. According to BBC, US President Donald Trump warned that Iran must strike a deal or face serious consequences. Iran, in communication with UN Secretary-General Antonio Guterres, stated it does not seek conflict but would not tolerate military aggression. Iranian officials also reportedly cautioned that any US military move over the nuclear issue would be met with a decisive response. Early Friday, US stock index futures were modestly higher.

    The US economy is expected to have expanded at an annualized pace of 3% in Q4, following a 4.4% increase in the prior quarter. Meanwhile, the core PCE Price Index — the Federal Reserve’s preferred inflation gauge — is forecast to rise 2.9% year-over-year in December, up slightly from 2.8% in November.

    EUR/USD, which closed lower on Thursday, remains under pressure early Friday, trading near 1.1750. PMI figures from Germany and the Eurozone are anticipated to continue signaling expansion in private-sector activity for February.

    GBP/USD extended its decline for a fourth straight session on Thursday and trades below 1.3450, marking its weakest level since late January. Data from the UK’s Office for National Statistics showed that Retail Sales climbed 1.8% month-over-month in January, significantly beating the 0.2% consensus estimate.

    USD/JPY continues its weekly advance and holds comfortably above 155.00 in early Friday trading. Japan’s Prime Minister Sanae Takaichi stated that necessary expenditures would largely be financed through the initial budget, adding that efforts would be made to gradually reduce the debt-to-GDP ratio and restore fiscal discipline. Japan’s National Consumer Price Index rose 1.5% in January, down from 2.1% in December.

    Gold benefited from safe-haven demand on Thursday but struggled to build momentum amid broad USD strength. XAU/USD edges higher during the European session on Friday, trading above $5,000.

    In Australia, flash data from S&P Global showed the Composite PMI easing to 52 in February from 55.7 in January. AUD/USD largely brushed off the release and was last seen slightly lower on the day near 0.7050.

    Sources: Eren Sengezer

  • Rate uncertainty, Iran tensions drag on Asia stocks; South Korea bucks the trend.

    Most Asian equities declined on Friday as mounting uncertainty over the U.S. interest-rate outlook and escalating tensions surrounding Iran dampened appetite for risk assets.

    South Korea stood out as a bright spot, with the KOSPI surging to fresh record highs on sustained optimism in domestic markets following a recent tech-led rally.

    Regional bourses tracked overnight losses on Wall Street, where a wave of risk-off sentiment pressured stocks. S&P 500 Futures edged up 0.16% by 22:37 ET (03:37 GMT), as investors awaited key inflation and growth data due later in the session. Chinese markets remained shut for the Lunar New Year holiday.

    Japan slides despite mixed data; Hong Kong retreats after break

    In Japan, the Nikkei 225 and TOPIX were the region’s weakest performers, falling 1.4% and 1.2%, respectively.

    Shares came under pressure following mixed economic releases. Data showed Japan’s headline consumer price index slowed to its lowest level in nearly four years in January, while core inflation also eased but remained above the Bank of Japan’s 2% annual target.

    Meanwhile, purchasing managers’ index figures indicated factory activity expanded to a four-year high in February, supported by firm overseas demand.

    Hong Kong’s Hang Seng Index fell 0.6% as trading resumed after a three-day holiday, with local technology stocks mirroring earlier global declines.

    Among the laggards were Alibaba Group and Baidu Inc, which tumbled between 4% and 6% after being briefly named on a U.S. government list of firms allegedly linked to the Chinese military. BYD Co, also cited in the list, slipped 1.6%.

    Elsewhere, markets were subdued. Australia’s S&P/ASX 200 dipped 0.2%, Singapore’s Straits Times Index edged up 0.1%, and India’s Nifty 50 was little changed, with local tech shares remaining cautious despite reports of new artificial intelligence ventures.

    Risk sentiment remained fragile after U.S. President Donald Trump gave Iran a 10–15 day deadline to reach a nuclear agreement or face potential U.S. action, with multiple reports suggesting further strikes were under consideration.

    South Korea outperforms as KOSPI hits record

    South Korea’s KOSPI bucked the regional trend, climbing more than 1.6% to a record 5,768.61 points and marking its second straight session at an all-time high.

    While Thursday’s gains were driven by technology stocks, Friday’s advance was led by strong performances in brokerage, defense, and insurance names.

    Local media reported a surge in buying by retail investors, even as foreign investors continued to pare holdings.

    Separately, South Korea’s top court on Thursday sentenced former President Yoon Suk-Yeol to life imprisonment over charges linked to an attempted insurrection in late 2024.

    Sources: Ambar Warrick

  • Disinflation Signals Potential for Earlier and Larger Fed Rate Cuts

    Inflation came in cooler than anticipated in January, though markets still largely expect the Federal Reserve to hold its benchmark rate steady until June. However, the bond market appears ready to test that timeline, increasingly factoring in the possibility of a rate cut arriving sooner.

    According to government data released Friday, the Consumer Price Index (CPI) rose 2.4% year over year in January, down from 2.7% in December and marking the lowest reading in eight months. Core CPI—which excludes volatile food and energy prices and is considered a clearer gauge of underlying inflation—also eased to 2.5% annually, its slowest pace since 2021.

    While the slowdown in headline inflation is a welcome development, a deeper dive into the data suggests it may be premature to relax concerns about where prices are headed next. Persistent increases in tariff-sensitive goods remain one pressure point. Food prices are another, climbing 2.9% year over year—elevated by historical standards.

    Energy costs rose even more sharply, and both homeowners’ and renters’ insurance premiums continued to increase. Moreover, inflation is still running above the Federal Reserve’s 2% target, reinforcing the likelihood that policymakers will proceed carefully.

    Although it’s too soon to claim inflation has been fully tamed, the broader trend of moderating price growth strengthens the argument that the worst may be behind us. The Capital Spectator’s ensemble forecast has long projected continued disinflation in core CPI, a view that has so far aligned reasonably well with actual data. The model still anticipates further easing, with core CPI’s 12-month rate expected to edge down to around 2.4% in the upcoming February report.

    Fed funds futures continue to indicate that the first rate cut won’t arrive until the June meeting. In contrast, the Treasury market appears to be probing the possibility of an earlier move. The policy-sensitive 2-year Treasury yield has fallen to about 3.45%—near its lowest level since 2022—and now sits below the Federal Reserve’s current target range of 3.50% to 3.75%, signaling that bond investors may be anticipating a faster shift in policy.

    In short, Treasury market sentiment is tilting toward the idea that a rate cut could come sooner than previously anticipated. Other market-based indicators are reinforcing that view by assigning higher odds to continued disinflation.

    The average of two Treasury-derived inflation gauges now projects five-year inflation in the low 2% range—the mildest reading in a month and not far from the Federal Reserve’s 2% objective. The surge in inflation expectations seen in January has since unwound, signaling that investors have grown less worried about upside inflation risks in recent weeks.

    Markets are not infallible, but it would likely require a meaningful upside surprise in the economic data—pointing to renewed inflationary pressure—to overturn the prevailing disinflation narrative. For now, investors show little appetite for betting on a reflationary turn.

    Sources: James Picerno

  • USD/JPY holds near the 155.00 level as dollar strength keeps bulls in control.

    USD/JPY is consolidating Wednesday’s strong advance, hovering near the 155.00 mark early Thursday. The bullish bias remains intact as concerns over Japan’s fiscal outlook and a generally positive market sentiment continue to weigh on the safe-haven Japanese Yen.

    At the same time, the latest FOMC Minutes revealed divisions among Fed officials regarding the need and timing of additional rate cuts amid lingering inflation risks. This uncertainty lends support to the US Dollar, providing an added tailwind for the pair.

    USD/JPY Technical Overview

    The US Dollar (USD) is trading with a mild bullish bias against the Japanese Yen (JPY) this week, hovering near the top of the 153.00 range. However, the pair remains confined within its weekly boundaries, as resistance around 154.00 continues to cap upside attempts ahead of the release of the minutes from the US Federal Reserve’s latest meeting.

    Fundamental Overview

    The Federal Reserve kept its benchmark rate unchanged at 3.5%–3.75% and signaled that policy is likely to remain steady in the near term. The meeting minutes are expected to underscore divisions within the committee—differences that are drawing added attention after last week’s softer U.S. inflation data and disappointing jobs report.

    On Tuesday, Chicago Fed President Aistan Goolsbee pointed to those internal splits, noting that if inflation continues to ease, the central bank could lower rates multiple times this year.

    In Japan, weak fourth-quarter GDP data released Monday have renewed worries about the country’s economic prospects, reinforcing Prime Minister Sanae Takaichi’s push for substantial fiscal stimulus and tax cuts.

    Meanwhile, the International Monetary Fund cautioned that reducing the consumption tax could strain public finances and urged the Bank of Japan to tighten monetary policy further to keep inflation in check. As a result, the yen’s recent bullish momentum has faded somewhat, offering relief to the previously pressured U.S. dollar.

  • Pound Sterling hovers near a four-week low against the US dollar, slipping below 1.3500 as expectations grow for a Bank of England rate cut.

    GBP/USD is struggling to stage a meaningful rebound after dropping to a four-week low in Thursday’s Asian session, with the pair hovering just below the 1.3500 psychological level and appearing vulnerable to further losses. It is currently consolidating declines recorded over the past three days within a tight range near weekly lows.

    The British pound remains under pressure amid growing expectations that the Bank of England will deliver a rate cut at its March meeting. Those bets were reinforced by weaker UK employment data and a slowdown in consumer inflation to its lowest level in nearly a year. Combined with a firm US dollar, this keeps the near-term bias tilted to the downside for GBP/USD.

    Meanwhile, minutes from the Federal Reserve’s January meeting revealed divisions among policymakers regarding the timing and need for additional rate cuts, given persistent inflation concerns. While some officials signaled that easing could be appropriate if inflation continues to cool, others warned that premature cuts might jeopardize the Fed’s 2% target. The relatively less dovish tone has helped underpin the US dollar.

    Geopolitical tensions also remain in focus, with reports suggesting the US military could be ready to strike Iran as soon as this weekend. Such risks have supported safe-haven demand for the greenback, allowing it to hold onto recent gains and reinforcing the case for an extension of the pair’s weekly downtrend. Any attempted recovery in GBP/USD may therefore attract fresh selling interest.

    Traders now turn to Thursday’s US data releases, including weekly initial jobless claims, the Philadelphia Fed Manufacturing Index, and pending home sales. Speeches from key FOMC members are also due later in the North American session, though attention will ultimately center on Friday’s US Personal Consumption Expenditures (PCE) Price Index for clearer policy direction.

    Sources: Haresh Menghani

  • CPI Breakdown: 5 Rate-Sensitive Stocks to Watch

    The inflation print investors had been bracing for came in cooler than expected.

    Friday’s January CPI showed headline inflation at 2.4%—below the 2.5% consensus forecast and the lowest annual reading since May 2025. Core CPI, which excludes food and energy, eased to 2.5%, marking its softest level since April 2021. On a monthly basis, prices rose just 0.2%, the smallest increase since July.

    Markets reacted swiftly. Homebuilder stocks rallied sharply, small caps climbed 1.2%, and the 10-year Treasury yield slid to its lowest point since early December.

    My takeaway: the market may have just received the confirmation it was waiting for. And the most compelling opportunities from here likely aren’t the mega-cap tech leaders that have dominated performance, but rather rate-sensitive sectors that were punished under the “higher for longer” narrative and are now repricing for a potentially different 2026 backdrop.

    What the CPI Report Really Signals

    Shelter—by far the largest CPI component and the category that has stubbornly kept headline inflation elevated—rose only 0.2% in January, bringing the annual rate down to 3%. That’s a notable slowdown and perhaps the clearest indication yet that the housing inflation lag is beginning to unwind.

    Energy prices declined 1.5%, with gasoline tumbling 3.2% during the month. Food inflation held at 2.9% year over year—still somewhat elevated, but not alarming. Importantly, core goods prices were flat, helping to counter concerns that renewed tariffs would reignite goods inflation.

    “Headline CPI inflation was a touch softer than expected in January, delivering a welcome surprise to the downside at the beginning of the year,” said Bernard Yaros, lead economist at Oxford Economics. He added that tariff-related price pressures “are largely behind us.”

    Lindsay Rosner of Goldman Sachs Asset Management was even more direct: “Trust the groundhog. The Fed’s path to normalization cuts appears clearer now.”

    The timing is critical. A stronger-than-expected January jobs report—130,000 payrolls versus forecasts of 55,000—had pushed expectations for rate cuts further out, likely into the summer. This softer CPI reading shifts that outlook. Economists surveyed by Bloomberg now anticipate as much as 100 basis points of easing this year, with the first cut potentially arriving in June—or even March if disinflation continues.

    Why Rate-Sensitive Stocks Stand Out

    One key dynamic investors often overlook is that by the time the Federal Reserve actually begins cutting rates, much of the upside in rate-sensitive sectors has already played out. Markets tend to price in policy shifts well in advance.

    Friday’s CPI data appeared to give institutional investors the confidence to begin reallocating toward sectors poised to benefit from lower yields. The equal-weight version of the S&P 500 and the Russell 2000 both climbed 1.2%, notably outperforming the traditional cap-weighted S&P 500, which was little changed.

    That divergence is often viewed as a textbook signal of sector rotation—away from mega-cap dominance and toward more rate-sensitive, economically cyclical areas of the market.

    Capital is rotating down the market-cap ladder and into economically sensitive groups. Three segments stand out most clearly: homebuilders, REITs, and small caps.

    How to Position

    D.R. Horton (DHI)

    Closing Friday at $167.78, DHI is arguably the purest expression of the housing-affordability theme. The largest U.S. homebuilder by volume posted solid fiscal Q1 results in January, with revenue of $6.89 billion (ahead of $6.59 billion estimates) and EPS of $2.03 (vs. $1.93 expected).

    At roughly 15.3x trailing earnings, the stock trades at a notable discount to the broader market. Beyond the rate backdrop, there’s also a policy angle: the Trump administration’s reported “Trump Homes” initiative has involved direct engagement with builders around affordability measures—potentially creating a dual tailwind of lower mortgage rates and regulatory support.

    The median analyst price target is $170, with UBS as high as $195—suggesting upside potential of roughly 16%.

    Lennar (LEN)

    Trading at $122.28, Lennar offers a slightly different profile as the second-largest U.S. builder. Its “land-light” model—optioning land instead of holding it outright—reduces balance-sheet risk and positions it well for a rate-cutting cycle.

    The stock has rebounded about 40% from its April 2025 lows but remains below its 2024 peak. With fiscal Q1 earnings due in late March, improving mortgage application trends could serve as a near-term catalyst if rates continue to ease.

    SPDR S&P Homebuilders ETF (XHB)

    At $121.36, XHB is up nearly 18% year-to-date and recently marked a fresh 52-week high of $123.13. As an equal-weighted ETF, it offers diversified exposure across the housing ecosystem—not just large builders, but also building products manufacturers, home improvement retailers, and construction suppliers.

    For investors who prefer sector exposure over single-stock risk, XHB provides a balanced approach.

    Vanguard Real Estate ETF (VNQ)

    Trading near $94.59—close to its 52-week high—VNQ provides broad exposure to the REIT space, one of the most rate-sensitive areas of the market. The ETF holds over 150 REITs across healthcare, industrial, data center, and retail subsectors.

    Its largest holdings include Welltower, Prologis, and American Tower.

    With an average analyst target near $100.81, implied upside sits around 8%, in addition to a dividend yield of roughly 3.6%. After significant underperformance during the rate-hiking cycle, REITs are positioned to benefit mechanically as yields decline.

    iShares Russell 2000 ETF (IWM)

    At approximately $263, IWM tracks small-cap equities—arguably the most interest-rate-sensitive segment of the equity market. Smaller firms tend to carry more floating-rate debt and are disproportionately affected by elevated borrowing costs. That dynamic can reverse sharply when policy eases.

    IWM surged 1.6% on Friday’s CPI release alone. With its 52-week high of $271.60 within reach, sustained rate declines could drive a prolonged catch-up rally in small caps.

    The Big Picture

    If inflation continues to moderate and rate-cut expectations firm, the leadership baton may continue shifting away from mega-cap growth and toward housing, real estate, and smaller domestically oriented companies. Markets typically front-run the policy cycle—and this rotation suggests that repositioning may already be underway.

    The Bear Case (and Why It May Be Overstated)

    There are valid reasons for caution. Fox Business pointed out that January’s CPI could carry a downward bias tied to last fall’s government shutdown. During that period, the Bureau of Labor Statistics missed portions of October data collection and relied on a “carry-forward” methodology that may influence inflation readings into spring 2026. In short, the 2.4% headline figure could be somewhat understated.

    There’s also the Federal Reserve itself. Policymakers are not signaling urgency. Oxford Economics continues to project cuts in June and December rather than March. Meanwhile, although the labor market is cooling—annual benchmark revisions show 2025 job growth was the weakest since 2003 outside recessionary periods—it is far from collapsing. Jerome Powell has consistently emphasized the need for a sustained disinflation trend, not a single favorable report.

    The Counterargument

    Even if the Fed waits until June, markets won’t. Yields have already declined meaningfully. Mortgage rates are edging lower. And sectors that trade on rate expectations—rather than the actual fed funds rate—are beginning to reprice now. By the time the first official cut arrives, much of the move in rate-sensitive equities could already be behind us.

    What to Watch

    Three near-term catalysts will likely shape the next phase:

    1. Fed Minutes (Feb. 18): The release of the latest policy meeting minutes could shift expectations quickly. Any dovish commentary on inflation progress or labor-market softness may pull forward rate-cut pricing.
    2. Walmart Q4 Earnings (Feb. 19): As the largest U.S. retailer—now with a market cap above $1 trillion and up 13% year-to-date—Walmart’s guidance will offer real-time insight into consumer spending trends. If easing inflation is translating into stronger purchasing power, that reinforces the soft-landing narrative.
    3. PCE Price Index (Later This Month): The Fed’s preferred inflation gauge will be pivotal. Confirmation of CPI’s cooling trend would likely solidify expectations for a June cut and intensify debate around a possible March move—potentially fueling the next leg higher in rate-sensitive stocks.

    Bottom Line

    The inflation backdrop has shifted in a way that favors investors. The opportunity isn’t complex—but it does require stepping away from the mega-cap tech trade that has dominated for the past two years and leaning into sectors positioned to benefit most from falling yields.

    Sources: Jaachi Mbachu

  • FX Markets Quiet Ahead of This Week’s Important Data and Events

    Here’s what you need to know for Monday, February 16:

    Major currency pairs begin the week trading within established ranges, as investors remain cautious ahead of several key events and important macroeconomic releases scheduled for later in the week. In Europe, December Industrial Production figures are due on Monday. Meanwhile, US stock and bond markets are closed for the Presidents Day holiday.

    The US Dollar Index ended last week on a softer note, as below-forecast inflation data prevented the greenback from gaining momentum before the weekend. According to the US Bureau of Labor Statistics, annual Consumer Price Index (CPI) inflation slowed to 2.4% in January from 2.7% in December, undershooting expectations of 2.5%. Early Monday, the USD Index is moving sideways around the 97.00 mark during European trading hours.

    Early Monday, CBS News reported—citing two sources—that US President Donald Trump told Israeli Prime Minister Benjamin Netanyahu he would back Israeli strikes targeting Iran’s ballistic missile program. So far, markets have shown little reaction, with West Texas Intermediate crude trading largely flat near $62.80 per barrel.

    EUR/USD remains in consolidation mode, hovering just above 1.1850 after ending last week slightly higher. European Central Bank policymaker Joachim Nagel is expected to speak later in the day.

    In Asia, Japan’s data showed that fourth-quarter Gross Domestic Product (GDP) expanded at an annualized rate of 0.2%, rebounding from a 2.6% contraction in the prior quarter but missing the 1.6% growth forecast. After dropping nearly 3% last week, USD/JPY is recovering modestly, up 0.4% on the day to trade near 153.30.

    AUD/USD trades in a tight range below 0.7100 in European hours. The Reserve Bank of Australia will release minutes from its February meeting early Tuesday, when it raised the policy rate by 25 basis points to 3.85%.

    Gold surged on Friday and closed the week higher, though XAU/USD is struggling to maintain upward momentum and is trading below the $5,000 level on Monday morning in Europe.

    The UK’s Office for National Statistics is set to publish employment data on Tuesday. GBP/USD remains subdued, edging slightly below 1.3650.

    Finally, Statistics Canada will release January CPI data on Tuesday. USD/CAD trades steadily around 1.3600 in European hours after posting modest losses last week.

    Sources: Eren Sengezer

  • Weekly outlook: US Dollar steadies near 96.80 before PCE data and Fed remarks.

    The US Dollar (USD) posted notable weekly losses, briefly rebounding after stronger-than-expected US jobs data showed 130K new positions added in January and the Unemployment Rate dipping to 4.3% from 4.4%. However, softer January CPI figures pressured the currency.

    The US Dollar Index (DXY) slipped to around 96.80 from 97.15 highs as weak inflation data boosted expectations of a Federal Reserve rate cut later this year. Attention now turns to Friday’s release of the December Personal Consumption Expenditures (PCE) report, the Fed’s preferred inflation measure.

    EUR/USD hovers around 1.1880, erasing earlier losses after Eurozone flash Q4 GDP came in at 1.4% YoY, above the 1.3% forecast. Focus next week includes the Eurogroup Meeting and December Industrial Production on Monday, followed by the EcoFin Meeting and February Eurozone and German ZEW Surveys on Tuesday.

    AUD/USD trades near 0.7080, close to a three-year peak, supported by the hawkish stance of the Reserve Bank of Australia. Upcoming data include NAB Business Confidence and the Wage Price Index on Wednesday, then Australian jobs figures and the February flash S&P Global Composite PMI on Thursday.

    USD/CAD sits near 1.3600, recovering nearly half of its weekly losses after US inflation data. Markets will watch Canada’s December Retail Sales on Friday.

    USD/JPY trades around 152.80 following a sharp sell-off triggered by the election victory of Sanae Takaichi, which raised fiscal policy concerns. Japan’s National CPI is due on Thursday.

    GBP/USD holds near 1.3650, with UK Producer Price Index and Retail Price Index data due Wednesday, and Retail Sales scheduled for Friday.

    Gold trades around $5,038, rebounding from Thursday’s drop but still below January’s record high of $5,598, as easing geopolitical tensions push investors toward riskier assets.

    Looking ahead to the economic outlook: Key voices take center stage.

    Saturday, February 14

    • Christine Lagarde (ECB President)

    Sunday, February 15

    • Christine Lagarde (ECB President)

    Monday, February 16

    • Michelle Bowman (Fed)
    • Joachim Nagel (ECB)

    Tuesday, February 17

    • José Luis Escrivá (ECB)
    • Michael Barr (Fed)
    • Mary Daly (Fed)

    Wednesday, February 18

    • Piero Cipollone (ECB)
    • Isabel Schnabel (ECB)
    • Michelle Bowman (Fed)

    Thursday, February 19

    • Piero Cipollone (ECB)
    • Luis de Guindos (ECB)
    • Raphael Bostic (Fed)
    • Michelle Bowman (Fed)
    • Neel Kashkari (Fed)
    • Christian Hawkesby (rbnz official)

    Friday, February 20

    • Christine Lagarde (ECB President)
    • Raphael Bostic (Fed)

    Central bank meetings and upcoming economic data releases are set to guide the next moves in monetary policy.

    Sunday, February 15

    • Japan flash Q4 GDP

    Tuesday, February 17

    • Reserve Bank of Australia (RBA) Meeting Minutes
    • Germany January Harmonized Index of Consumer Prices (HICP)
    • UK January Claimant Count Change
    • UK December Employment Change
    • UK December ILO Unemployment Rate
    • Canada January CPI

    Wednesday, February 18

    • Reserve Bank of New Zealand (RBNZ) Interest Rate Decision
    • UK January CPI
    • Federal Open Market Committee (FOMC) Minutes

    Thursday, February 19

    • Australia January Employment Change
    • Australia Unemployment Rate

    Friday, February 20

    • UK January Retail Sales
    • Germany February flash HCOB Composite PMIs
    • Eurozone PMIs
    • UK flash February S&P Global PMIs
    • US December Core Personal Consumption Expenditures (PCE)
    • US February S&P Global PMIs

    Sources: Agustin Wazne

  • Why the January 2026 CPI Paints a Distorted Picture: How the Government Shutdown Skewed the Data

    A few months ago, a government shutdown led to a missed CPI release because the Bureau of Labor Statistics (BLS) lacked sufficient data to calculate the October 2025 figure. The bigger issue, however, was methodological: when compiling the November index, the BLS was effectively required to assume that prices in several major categories—especially rents—were unchanged in October. This created an artificial drop in year-over-year inflation.

    While some of that distortion has already begun to reverse, a more significant rebound is expected in a few months when the Owners’ Equivalent Rent (OER) survey rotation triggers a sharp offsetting increase—precisely six months after the initial dip. Until that adjustment plays out, inflation data will remain hard to interpret, and the annual comparisons will understate true price pressures. So claims that the latest report shows the smallest yearly increase in core inflation since 2021, suggesting the Federal Reserve is near its target, are misleading.

    In reality, core year-over-year inflation is roughly 0.25%–0.3% higher than reported. Markets for CPI fixings already anticipate headline inflation rising to about 2.82% in four months—not because of energy prices, but due to this statistical catch-up.

    January is typically a challenging month for inflation data anyway, as businesses often offer discounts in December before implementing annual price hikes in January. Because these adjustments are irregular, they are difficult to seasonally adjust, making January surprises common. This time, consensus forecasts called for a 0.27% month-over-month rise in headline CPI and 0.31% in core, with some estimates—such as from Barclays—as high as 0.39% for core. Much of the speculation centered on whether remaining tariff-related price increases would be passed through at the start of the year. Ultimately, they were not. The actual figures came in at +0.17% for headline and +0.30% for core.

    The weaker headline reading was largely due to gasoline pricing dynamics. Although gas prices increased over the course of January, the monthly average was still lower than December’s average, because prices had fallen sharply in December. Since the BLS calculates CPI based on average monthly prices rather than end-of-month levels, this produced a softer headline figure.

    Core inflation, meanwhile, appeared close to target at first glance: the 2.5% year-over-year rate is the lowest since March 2021. Yet the 0.30% monthly increase was the third-highest in the past year and translates to an annualized pace of 3.6%. That hardly signals a smooth return to 2% inflation—raising questions about whether it is truly “mission accomplished” for the Fed.

    Core inflation was also somewhat flattered by a sharp 1.84% month-over-month decline in used car prices. In reality, used car prices did rise in January, but by less than the typical seasonal pattern, which translated into a sizable seasonally adjusted drop and created a noticeable drag on the core figure. (That said, it’s important not to dismiss components simply because they don’t align with the broader narrative.) Overall, core goods inflation slowed to 1.1% year over year from 1.4%, while core services edged down to 2.9% from 3.0%.

    Although core goods inflation declined more than expected due to the sharp move in used cars, some moderation isn’t surprising. The real issue isn’t whether core goods will reaccelerate to 3–4%, but whether it remains in positive territory or slips back into the persistent deflation that characterized the sector for many years. That distinction matters, even if core goods make up only about 20% of the CPI basket. Until recently, the narrative centered on tariffs; going forward, it may shift toward onshoring. The decades-long trend of goods deflation—driven by offshoring production to low-wage countries—may not reassert itself if manufacturing activity continues to migrate back. That’s the broader theme to monitor, though it’s not the main takeaway from January 2026’s data.

    On autos specifically, new car prices posted a modest increase. It’s worth considering how changes in sales composition might evolve now that electric vehicles are no longer being actively promoted by the executive branch. Traditional gasoline-powered cars tend to be cheaper upfront, so if buyers shift back toward them—absent tax incentives for EVs—the average transaction price could decline. However, it’s unclear how significantly overall sales patterns will change, or how production strategies will adjust now that automakers may feel less pressure to meet EV quotas. It’s also uncertain how granular the Bureau of Labor Statistics survey is in accounting for shifts in fleet composition. If there is any measurable impact on CPI, it would likely be slightly negative—and probably modest in size.

    As for rents, Owners’ Equivalent Rent (OER) rose 0.22% month over month, down from 0.31% previously, while Rent of Primary Residence increased 0.25%, slightly below last month’s 0.27%. The month-to-month trend in OER shows a clear deceleration—though notably, it omits the artificial zero recorded in October due to the earlier data disruption.

    While the slowdown is evident, my model suggests the pace should now be stabilizing around this level rather than continuing to decline sharply. In other words, rents are cooling, but likely nearing a plateau. That isn’t the defining story of January 2026—but it may well become one of the central inflation themes for the rest of 2026.

    Medicinal drug prices slipped 0.15% month over month. Some observers had anticipated a much larger decline, partly due to efforts by the Trump Administration to push manufacturers to align U.S. drug prices more closely with those abroad. So far, however, no clear downward trend is evident. A potentially more consequential development is the Trump RX initiative, aimed at increasing pricing transparency and reducing the role of intermediaries in the highly opaque pharmaceutical distribution chain—long dominated by three major wholesalers and three large pharmacy benefit managers.

    If successful, it could meaningfully reduce out-of-pocket drug costs for consumers. That said, when medications are paid for by insurers rather than directly by households, the impact does not show up straightforwardly in the CPI, appearing only indirectly—an accounting nuance that complicates interpretation. In short, consumer drug prices may decline, but the timing and visibility of that effect in CPI data remain uncertain.

    The most encouraging element of the report was the continued slowdown in core services excluding rents—often referred to as “supercore” inflation—which eased further even as airfares jumped 6.5% on the month.

    Gotcha. The apparent improvement in “supercore” inflation is another illusion created by the missing October data, which flatters the year-over-year comparison. On a month-over-month basis, core services ex-rents actually surged 0.59% (seasonally adjusted)—the largest increase in a year.

    Even so, the broader trend may still be one of gradual cooling, particularly as median wage growth continues to decelerate. Admittedly, that data is also somewhat noisy at the moment. Still, the gap between median wage growth and median inflation remains around 1%, suggesting real income growth is positive, even if inflation progress is bumpier than headline figures imply.

    There are tentative signs that wage growth’s downward drift may be stabilizing. If so, that would naturally limit how quickly supercore inflation can cool. At the same time, brewing cost pressures in insurance markets are likely to surface over the next six months. Still, none of that defines January 2026.

    The real story this month is that inflation data remain clouded by the government-shutdown gap. The missing October observations continue to flatter year-over-year comparisons, overstating the degree of progress. That statistical quirk makes it easier for the Administration to claim victory, even though underlying inflation does not appear to be cleanly converging back to target.

    Assuming the Federal Reserve recognizes these distortions, the policy outlook seems relatively straightforward. Core inflation—abstracting from the shutdown gap—appears to be running near 3.5%, labor market data have surprised to the upside, and the current Fed leadership has shown little inclination to accommodate political pressure. Under those conditions, there is scant reason to expect a near-term adjustment in overnight rates; if anything, the argument for tightening may be stronger than for easing.

    To be fair, rents continue to decelerate even after adjusting for the October distortion, though my model suggests that slowdown is unlikely to persist much further. Even if it does, a return to outright housing deflation seems improbable. Moderation in supercore inflation is encouraging, but probably insufficient to deliver the degree of cooling the Fed would require. Core goods inflation also looks to have peaked; the open question is whether it settles into low positive territory or slips back into deflation.

    Taken together, my modeling suggests that median inflation around 3.5% (excluding the shutdown effect) may represent something close to a new equilibrium. It’s not unreasonable to see constructive signals in the recent data, but neither do they justify expectations of imminent easing. If disinflation trends persist and leadership dynamics shift—potentially with someone like Kevin Warsh assuming the chair—the door to rate cuts later in the year could open.

    But that is not January 2026’s story.

    Sources: Michael Ashton

  • Asian currencies edged lower as the U.S. dollar held firm ahead of the upcoming nonfarm payrolls report.

    Most Asian currencies edged lower on Friday, while the U.S. dollar held steady as investors assessed the interest rate outlook ahead of closely watched U.S. inflation data due later in the session. Despite the day’s softness, many regional currencies were still on track for weekly gains, whereas the dollar continued to reflect broader weekly losses amid uncertainty surrounding U.S. monetary policy.

    Japanese yen outperforms on intervention speculation

    The Japanese yen emerged as one of the strongest Asian performers this week, supported by rising speculation of potential government intervention in currency markets, which helped investors look beyond concerns about Japan’s fiscal position. The USD/JPY pair ticked up 0.2% on Friday but remained down roughly 2.6% for the week—its strongest weekly showing since November 2024.

    The yen’s rally followed a series of hawkish remarks from Japanese officials signaling readiness to intervene, easing worries over elevated fiscal spending under Prime Minister Sanae Takaichi.

    Elsewhere, the Australian dollar also posted solid gains, with AUD/USD climbing 1% for the week to a three-year high after hawkish commentary from the Reserve Bank of Australia.

    The South Korean won strengthened as well, with USD/KRW down 1.4% on the week, aided by renewed foreign inflows into domestic equities, particularly chipmakers tied to artificial intelligence themes.

    China’s yuan saw USD/CNY edge up slightly on Friday but remain 0.4% lower for the week, supported by a series of firm daily midpoint settings from the People’s Bank of China. The currency hovered near a nearly three-year peak reached earlier in the week.

    Meanwhile, the Indian rupee was little changed for the week, and the Singapore dollar gained 0.6% against the greenback.

    Dollar steady before CPI, but weekly loss likely

    The dollar index and its futures posted modest gains during Asian hours Friday, with attention fixed on January’s consumer price index report. Although expectations point to a slight cooling in both headline and core inflation, traders remained cautious about potential upside surprises, especially as January CPI has exceeded forecasts in each of the past four years.

    The greenback drew some support earlier in the week from stronger-than-expected nonfarm payrolls data, yet it was still down about 0.7% on a weekly basis. Ongoing uncertainty over U.S. monetary policy—particularly following Kevin Warsh’s nomination as the next Federal Reserve Chair—continued to weigh on the currency.

    Sources: Ambar Warrick

  • Gold steadied below $5,000/oz as rate uncertainty lingered, with CPI data in focus.

    Gold held steady in early Asian trading on Friday after slipping below key technical levels amid growing uncertainty about the outlook for U.S. interest rates, with investors now awaiting upcoming inflation data for clearer direction.

    Silver also stabilized after shedding roughly 10% in the previous session, though metals remained vulnerable following a sharp selloff earlier in the month.

    Persistent doubts about the timing of future U.S. rate cuts continued to pressure precious metals, particularly after January data signaled resilience in the labor market. The U.S. dollar rebounded from weekly lows following Wednesday’s stronger-than-expected nonfarm payrolls report.

    Spot gold edged down 0.1% to $4,915.40 an ounce by 18:31 ET (23:31 GMT), while April gold futures slipped 0.1% to $4,937.60 per ounce. In the prior session, spot prices had dropped more than 3%.

    Spot silver was little changed at $75.060 per ounce, while platinum recovered to trade back above $2,000 per ounce after steep losses a day earlier.

    Thursday’s decline effectively wiped out most of this week’s gains for gold and other precious metals, putting the yellow metal on track for a third consecutive weekly loss.

    Markets have struggled to find direction since a late-January flash crash, with interest rate uncertainty remaining a central headwind. Gold’s retreat from recent record highs was initially sparked by U.S. President Donald Trump’s nomination of Kevin Warsh as the next Federal Reserve Chair, a choice seen as less dovish.

    The robust January jobs report reinforced expectations of fewer rate cuts ahead, while sharp price volatility has also weakened metals’ appeal as safe-haven assets.

    Attention now turns to the January U.S. consumer price index data due later Friday, which could offer further insight into the trajectory of the world’s largest economy. Inflation and labor market conditions remain the Federal Reserve’s primary factors in setting monetary policy.

    Sources: Ambar Warrick

  • GBP/USD Elliott Wave: The Cables Are Crossing Signals

    Executive Summary

    GBP/USD is hovering around the critical 1.3508 level, where competing Elliott Wave counts are in play. The bullish scenario remains intact above 1.3508, while a sustained move below this level would strengthen the bearish case. A significant directional move is expected once one count clearly takes control.

    On January 14, when GBP/USD was trading at 1.3428, we projected a modest pullback followed by a rally to kick off wave (iii). Price action has largely followed that script, although the drop from January 27 to February 6 was deeper than expected. This larger-than-anticipated decline opens the door to a possible revision in our wave interpretation.

    GBP/USD Elliott Wave Analysis

    We have been accurately tracking the broader GBP/USD structure, anticipating further upside. However, the sharper decline between January 27 and February 6 raises concerns that an alternative pattern may be unfolding. While no Elliott Wave rules have been violated, the structure now warrants closer scrutiny.

    Bullish Scenario

    The primary bullish view assumes wave (ii) завершed at 1.3339, near the upper boundary of our projected 1.3125–1.3333 reversal zone. Under this interpretation, wave ‘i’ of (iii) advanced to 1.3869 on January 27, and the subsequent decline into February 6 represents wave ‘ii’ of (iii).

    The complication lies in the size of this wave ‘ii’ pullback. At 360 pips, it is considerably larger than its higher-degree counterpart wave (ii), which measured only 147 pips. While this does not breach any Elliott Wave rules, it is unusual for a lower-degree correction to significantly exceed the size of its higher-degree equivalent.

    Typically, subwaves within an extended wave maintain proportions comparable to higher-degree waves. With this second wave nearly double the size, we must stay alert for an alternative count if GBP/USD continues to weaken.

    For the bullish case to remain valid, Cable needs to rebound swiftly and push above 1.39. A retest of the February 6 low at 1.3508 would serve as an early warning that the bullish interpretation may be losing credibility.

    Bearish Alternative Scenario

    Should GBP/USD break decisively below 1.3508, the bearish alternative would gain traction.

    Under this view, wave ‘2’ did not finish at the November low and remains in progress. The January 27 peak would represent wave ((b)) of 2, and the decline since then marks the early stages of wave ((c)) of 2. If this scenario unfolds, the pair could revisit the November support level near 1.3010.

    Bottom Line

    GBP/USD stands at a pivotal juncture, with both bullish and bearish Elliott Wave scenarios in contention. While the primary outlook favors a strong upward move, a continued slide toward 1.35 would shift focus toward the bearish alternative.

    Sources: Zorrays Junaid

  • Gold and silver prices edged lower after robust payroll data reduced expectations for interest rate cuts.

    Gold and silver prices declined during Asian trading on Thursday after stronger-than-expected U.S. payrolls data dampened expectations for deeper Federal Reserve rate cuts, though losses were cushioned by ongoing safe-haven demand.

    Precious metals largely held onto this week’s gains, supported by continued dollar weakness and elevated tensions between the U.S. and Iran, which kept demand for safe assets intact.

    Spot gold dropped 0.7% to $5,051.26 per ounce, while April gold futures slipped 0.5% to $5,072.04/oz as of 01:36 ET (06:36 GMT). Spot silver fell 1.3% to $83.2505/oz, and platinum declined 1.6% to $2,107.30/oz.

    Gold pressured as dollar rebounds on solid payrolls data

    Gold came under pressure after January’s U.S. nonfarm payrolls report, released Wednesday, exceeded expectations. The stronger labor market reading reduced bets that slowing employment would prompt additional rate cuts from the Fed.

    According to CME FedWatch, markets are now assigning a 94.1% probability that the Fed will keep rates unchanged in March, and a 78% chance of no change in April.

    The upbeat data also triggered a rebound in the U.S. dollar overnight, weighing on metal prices. However, the dollar stabilized in Asian trade and remains slightly lower for the week, partly due to strength in the Japanese yen.

    OCBC analysts noted that a sustained dollar recovery would require further evidence of resilience in the U.S. economy — a scenario that could still offer some support to gold.

    “Structural headwinds — including uncertainty around Fed leadership succession and broader U.S. policy risks — suggest the dollar will need additional upside data surprises to maintain any rebound,” OCBC analysts said.

    Even so, precious metals remained volatile after sharp swings over the past week amid heightened uncertainty surrounding U.S. monetary policy.

    U.S. inflation data and Iran tensions in focus

    Investors are awaiting further signals on the U.S. economy, particularly January consumer price index data due Friday. Inflation and labor market conditions remain the Fed’s primary considerations for rate decisions. Weekly jobless claims figures are also scheduled for release later Thursday.

    Safe-haven demand continued to lend support to metals amid ongoing U.S.–Iran tensions. Although both sides reported some progress in nuclear talks over the weekend, Washington was reportedly preparing to send a second aircraft carrier to the Middle East.

    President Donald Trump also urged Tehran to accept a deal with Washington and met Israeli President Benjamin Netanyahu on Wednesday, underscoring persistent geopolitical risks.

    Sources: Ambar Warrick

  • Yield Curve Control and the Conclusion of the Treasury Inversion

    It has become increasingly clear that Treasury Secretary Scott Bessent favored Kevin Warsh for the role. Warsh has advocated for tighter coordination between the Federal Reserve and the Treasury Department, particularly in managing the yield curve and conducting open market operations. The Treasury yield curve is currently at its steepest level in four years, suggesting that Bessent has been effective in resolving the inversion that occurred under his predecessor, Janet Yellen. If Warsh is confirmed as the next Fed Chair, Bessent’s influence is likely to grow further—an important factor if the Fed aims to reduce interest rates.

    According to the Financial Times, some economists question Warsh’s belief that artificial intelligence will have a deflationary effect. Warsh argues that AI will spark “the most productivity-enhancing wave of our lifetimes—past, present and future,” boosting output and allowing the Fed to lower key rates without fueling inflation. Such remarks are expected to draw significant attention during his Senate confirmation hearing.

    On Tuesday, the Commerce Department reported that retail sales were flat in December. However, November’s figures were revised upward to a 0.6% increase, up from the previously reported 0.3%. Economists had anticipated a 0.4% rise in December, making the latest data disappointing. Because of the federal government shutdown, the report was released a month late, and the substantial upward revision to November’s data has somewhat diminished the report’s impact. Following the release, Treasury yields fell, increasing the likelihood of another Fed rate cut.

    Meanwhile, after a month-long pursuit, the U.S. Navy seized its eighth Venezuelan crude oil tanker in the Indian Ocean. The vessel, Aquila II, had attempted to bypass the U.S. blockade. The Navy’s intensified crackdown on so-called “shadow tankers” is expected to worry countries like Iran and Russia, which have also relied on similar methods to transport oil despite sanctions.

    In diplomatic developments, U.S. and Iranian officials met in Oman to discuss dismantling Iran’s nuclear program. Washington is pressing Tehran to halt uranium enrichment, limit its ballistic missile program, and end support for regional proxy groups. Iran, however, has stated it is only willing to negotiate over its nuclear activities. If talks collapse, the U.S. could carry out another military strike, which explains its significant naval buildup in the region. Notably, Iran seized two oil tankers before the negotiations but later described the discussions as “positive.”

    Sources: Louis Navellier

  • The U.S. dollar is coming under pressure as interest rate differentials start to narrow, limiting further upside.

    The U.S. dollar is in focus this week as investors await key economic data, including Non-Farm Payrolls and inflation figures that were postponed last week due to delays in passing a government spending bill. Recent data, such as the ADP report released on February 4, point to a cooling labor market. Attention will also turn to inflation readings due on Friday.

    While high-frequency and analytical indicators suggest inflation is no longer accelerating and is gradually easing, it remains sticky—particularly in the services sector—keeping core inflation above the Federal Reserve’s 2% target.

    CME FedWatch data indicate that markets continue to expect a gradual easing cycle from the Fed. The probability of a March rate cut remains low, at around 20–23%, with investors instead anticipating potential cuts later in the year as clearer signals emerge from inflation and labor market trends. Longer-term pricing implies a base case of 50–75 basis points of cumulative rate cuts by 2026. These expectations appear to be limiting further upside for the U.S. dollar.

    In the euro area, inflation has already fallen to around or below target. ECB President Christine Lagarde said last week that inflation is in a good place, even though readings may fluctuate in the coming months due to unpredictable geopolitical risks, stressing that policy will not react to every data point.

    Euro-area money markets are therefore pricing in a much firmer policy stance. Current market pricing implies roughly a 90% chance of no rate change at the March 2026 Governing Council meeting, with very limited easing expected over the year—around 0–10 basis points and, in some scenarios, no cuts at all. With inflation already subdued and a stronger euro adding further disinflationary pressure, euro-area rates are seen as relatively stable.

    By contrast, U.S. front-end rates are expected to decline more quickly, by around 50–75 basis points. This narrowing of short-term rate differentials in favor of the euro provides mechanical support for further upside in EUR/USD.

    Last week, the Bank of England kept its policy rate unchanged at 3.75%, but the decision was narrowly split 5–4, with an unexpected four members voting for an immediate 25 basis point cut. Forward guidance indicated that rates are “likely to be reduced further.” The BoE expects inflation to ease toward 2% from April, and both markets and economists are leaning toward a rate cut in the spring, around March or April.

    Compared with the BoE, the ECB is seen as maintaining a steadier policy stance. As a result, the BoE’s signal that cuts are more likely later on does not, by itself, justify further downside in EUR/GBP unless the ECB were to shift unexpectedly toward a more dovish hold. Upcoming UK data through March and April—particularly wage growth, services CPI, and the April CPI release—will be crucial in determining whether the probability of an April rate cut rises, which would likely weigh on the pound.

    In conclusion, interest rate differentials are narrowing, but unevenly. The Fed’s eventual easing bias caps sustained strength in the U.S. dollar, the ECB’s comparatively stable stance supports the euro, and the Bank of England’s closer proximity to further rate cuts creates relative downside risk for sterling.

    Sources: Dennis Mwenga

  • Week Ahead: Jobs and CPI Data May Reset March Fed Expectations

    As a polar vortex brings arctic conditions across the U.S., the economic calendar is set to heat up. The week ahead features two of the most consequential data releases for shaping Federal Reserve policy expectations: the January employment report and the Consumer Price Index (CPI).

    Owing to recent government shutdowns, the January employment report (Wednesday) and CPI release (Friday) will be published unusually close together. The labor report is particularly significant, as January data typically incorporates annual revisions to employment figures, raising the possibility of notable downward adjustments for the year through March 2025.

    A key reference point will be the Federal Reserve’s own assessment of potential overstatement in jobs growth. In December, Fed Chair Jerome Powell noted that internal research suggested official figures may have overstated monthly job gains by as much as 60,000 since April. Given that reported job growth averaged just under 40,000 per month over that span, the scope of upcoming revisions could have meaningful implications for the FOMC’s March policy decision.

    The week also features remarks from several Fed officials, including Governors Christopher Waller (Monday), Stephen Miran (Monday and Thursday), and Michelle Bowman (Wednesday). Among voting Fed presidents this year, Cleveland Fed President Beth Hammack and Dallas Fed President Lorie Logan are both scheduled to speak on Tuesday.

    Markets will also be watching price action on Wall Street following last week’s record close for the Dow Jones Industrial Average above 50,000. The ongoing AI-led shakeout among major technology stocks bears close scrutiny, as does the renewed “old economy” rotation bringing previously sidelined sectors—such as oil and gas, chemicals, transportation, and regional banks—back into focus. Adding to the cross-currents is gold’s continued rally, occurring alongside a sharp pullback in bitcoin.

    The following data releases carry the greatest potential to move markets and shape the Federal Reserve’s assessment of whether further rate cuts are warranted:

    Employment

    We expect nonfarm payrolls to rise by 60,000 in January, following a 50,000 increase in December (see chart). Markets will be closely focused on the size and direction of revisions to prior data. A meaningful downside surprise could increase pressure on Chair Powell to consider a rate cut later this month, even though we do not believe monetary policy can directly address the underlying weaknesses in the labor market.

    CPI 

    Markets are seeking further confirmation that inflation continued to ease in January. December’s 2.6% year-over-year reading matched a four-year low in core CPI inflation (see chart). The Cleveland Fed’s Inflation Nowcasting model currently projects a 0.22% month-over-month increase in core inflation, translating to a 2.45% annual rate. Additional insight on inflation pressures will come from the Q4 2025 Employment Cost Index and December import and export prices, both due Tuesday, as well as the New York Fed’s January inflation expectations survey on Monday.

    Retail sales

    Despite ongoing concerns about the cost of living and a fragile labor market, household spending continues to show resilience. Retail sales in December, due Tuesday, are expected to post another solid gain following November’s 0.6% month-over-month increase. Looking ahead, larger annual tax refunds should help sustain consumer spending momentum. Reflecting this strength, forward earnings for the S&P 500 Retail Composite climbed to a record high during the week of February 6 (see chart).

    Jobless claims

    Initial jobless claims due Thursday will draw heightened scrutiny as investors look to determine whether last week’s jump to 231,000 was driven by severe winter storms rather than a broader acceleration in layoffs. The balance of evidence points to a weather-related distortion, which would likely reassure the Fed that the labor market remains on relatively stable footing.

    Sources: Ed Yardeni

  • Yen rebounds from two-week low on intervention chatter, but fiscal worries limit upside

    The Japanese yen slid to a fresh two-week low as Sanae Takaichi’s landslide victory reignited concerns over Japan’s fiscal outlook. However, warnings of possible currency intervention sparked some intraday short covering in the yen, aided by broader U.S. dollar weakness.

    Still, downside momentum in the yen was partly limited after data showed a decline in Japan’s real wages, which reduced expectations for an immediate interest rate hike by the Bank of Japan and helped cap further moves in the currency.

    The Japanese yen began the new week on a softer footing after Prime Minister Sanae Takaichi’s landslide victory in Sunday’s election raised expectations of additional fiscal stimulus. That initial weakness proved short-lived, however, as Finance Minister Satsuki Katayama reiterated warnings over excessive currency moves and confirmed close coordination with the United States to counter disorderly FX fluctuations. Combined with continued U.S. dollar selling, the comments prompted an intraday reversal of nearly 150 pips in USD/JPY from the Asian session peak near 157.65.

    Meanwhile, data released earlier showed Japan’s real wages fell in December for a 12th straight month, with nominal pay growth slightly lagging cooling consumer inflation. This reinforces expectations that the Bank of Japan will proceed cautiously after lifting interest rates to a three-decade high in December. In addition, a more upbeat risk environment, supported by signs of easing tensions in the Middle East, limited further safe-haven demand for the yen, allowing USD/JPY to find support and stall its pullback around the 156.20 area.

    Yen bulls stay cautious as fiscal concerns and delayed BoJ hike bets offset intervention talk

    Japan’s ruling Liberal Democratic Party, led by Prime Minister Sanae Takaichi, secured a decisive victory in Sunday’s election, comfortably surpassing the 233-seat threshold needed for a lower-house majority. The result clears the path for proposed tax cuts and increased defense spending, bringing renewed attention to Japan’s already stretched public finances.

    Finance Minister Satsuki Katayama said on Monday that she stands ready to communicate with markets if necessary to help stabilize the yen. She reiterated that Japan remains in close coordination with U.S. Treasury Secretary Scott Bessent and emphasized Tokyo’s right to intervene if currency moves stray from economic fundamentals.

    Meanwhile, data from the labor ministry showed nominal wages rose 2.4% year-on-year in December 2025, accelerating from a revised 1.7% gain previously but still missing market expectations. Adjusted for inflation, real wages fell 0.1% from a year earlier, extending their decline to a 12th consecutive month.

    The figures have dampened expectations for an imminent Bank of Japan rate hike, as policymakers have stressed that further tightening hinges on sustained and broad-based wage growth. Together with a generally positive global equity backdrop, this has limited the yen’s rebound from a more than two-week low.

    Risk sentiment was further supported by indirect U.S.–Iran talks on Tehran’s nuclear program, which concluded on Friday with agreement to keep diplomatic channels open. The development eased fears of a military escalation in the Middle East and encouraged demand for risk assets at the start of the week, despite new U.S. sanctions on Iran.

    The U.S. dollar weakened for a second straight session amid growing bets that the Federal Reserve could cut interest rates twice more in 2026. This contrasts with expectations that the BoJ will continue its gradual policy normalization, helping to cap gains in USD/JPY and urging caution among bullish traders.

    Attention now turns to key U.S. data later this week, including the closely watched nonfarm payrolls report due Wednesday and consumer inflation figures on Friday, both of which are likely to shape dollar direction and drive fresh moves in USD/JPY.

    USD/JPY holds steady below 100-hour SMA as technical signals remain mixed

    The USD/JPY pair is showing modest resilience around the 100-hour Simple Moving Average (SMA), with its intraday pullback stalling near the 156.20 area, which now stands out as a key pivot for short-term traders. Momentum indicators, however, paint a mixed picture. The Moving Average Convergence Divergence (MACD) has formed a bearish crossover near the zero line, signaling rising downside pressure, while the Relative Strength Index (RSI) is hovering around 46, below the neutral 50 level, pointing to subdued momentum.

    At the same time, USD/JPY remains above the 100-hour SMA, currently located around the 156.55–156.50 zone, which preserves a mildly constructive near-term bias and provides dynamic support. A move by the MACD back into positive territory alongside an RSI break above 50 would strengthen the bullish case and open the door to further gains. On the other hand, a clear break and close below the 100-hour SMA would undermine the setup and increase the risk of a deeper corrective move.

    Sources: Haresh Menghani

  • Asian FX was subdued, with the yen supported by intervention warnings after Takaichi’s win

    Most Asian currencies traded in narrow ranges on Monday, while the yen edged higher after Japan’s finance ministry stepped up intervention warnings. However, the yen remained under pressure from concerns over heavy fiscal spending, which are expected to persist following Prime Minister Sanae Takaichi’s landslide election win. Elsewhere, Asian currencies stayed subdued after recent dollar strength, with markets now focused on key economic data due from the U.S. and China.

    Yen buoyed by intervention warnings following Takaichi’s victory

    The USD/JPY slipped 0.2% to 156.87 on Monday after earlier dropping as much as 0.5%, with the yen finding modest support from renewed intervention warnings by Japanese officials. While the currency remained broadly weak against the dollar, comments from Finance Minister Satsuki Katayama about close coordination with U.S. Treasury officials lent temporary relief.

    However, the yen continues to face pressure following Prime Minister Sanae Takaichi’s decisive election victory, which gives her coalition a supermajority in the lower house and a clearer path to expansionary fiscal plans. Concerns over stretched government spending have weighed heavily on the yen and previously triggered a sharp sell-off in Japanese government bonds. Analysts at OCBC noted that while a looser fiscal stance could further pressure the yen, the risk of official pushback is likely to rise as USD/JPY nears the 160 level.

    Dollar rebound eases as Asian FX trades quietly

    The dollar eased slightly in Asian trade, extending its pullback from last week’s near-98 highs, as traders stayed cautious ahead of key U.S. data, including nonfarm payrolls on Wednesday and CPI inflation on Friday. The releases are expected to shape expectations for U.S. interest rates under potential Fed leadership changes.

    Asian currencies were mostly rangebound. The Chinese yuan edged up, with USD/CNY down 0.1% and hovering near mid-2023 lows, supported by firm PBOC fixings ahead of Friday’s CPI data and the Lunar New Year. The Australian dollar rose 0.2% above $0.70 on bets of further RBA rate hikes after a hawkish move last week.

    Elsewhere, the Singapore dollar was flat, the Korean won weakened slightly, and the Indian rupee stayed above 90 per dollar following the RBI’s steady policy stance and upgraded forecasts.

    Sources: Ambar Warrick

  • US Treasury yields reverse course as investors rush to safety

    Early on, some questionable US labor market data set the tone, but the real catalyst was the shift to a risk-off mood. Day two is often decisive. We also cover updates from the ECB and BoE—no policy changes, but plenty of developments.

    A growing sense of decay fuels demand for Treasuries

    Markets reacted sharply to weaker US labor data on Thursday—arguably an overreaction. Challenger job cuts came in elevated, and headlines noting the highest January reading since 2009 quickly raised alarm. However, a higher figure was recorded as recently as October 2025, and the series itself is notoriously volatile.

    A move lower in yields was the appropriate response, but the magnitude was reinforced by subsequent JOLTS data, which showed job openings falling more than expected. Openings remain sizeable at around 6.5 million, though down from 7.2 million. Initial jobless claims also edged higher, but the increase was modest and levels remain low in a broader historical context.

    Broader market dynamics added fuel to the move. A pronounced risk-off backdrop—particularly concerns surrounding private credit—typically channels demand into Treasuries. Technical factors also played a role, with key thresholds giving way: the 10-year yield broke below 4.2%, while the 2-year slipped under 3.45%. While not extreme relative to recent months, the move was nevertheless notable. Hard to fight the move, particularly if the risk-off reassessment proves durable.

    ECB meeting takes a back seat to global risk sentiment

    A dovish tilt from the Bank of England, softer US labor signals, and persistent equity-market jitters have had a greater influence on markets than the ECB, with the 2s10s Bund curve modestly reflattening in a bullish move—still comfortably within recent ranges. The VIX remains elevated, indicating ongoing caution around potential equity volatility. While there has been no broad-based equity sell-off, investors are becoming more discerning about the sustainability of AI-driven business models.

    ECB President Lagarde appeared to downplay the role of the exchange rate in the policy outlook, though our economists see it as a lingering vulnerability in the ECB’s “good place” narrative. In the near term, tail risks remain skewed toward further easing, even as the threshold for a rate cut stays high. Markets are currently pricing roughly a 25% chance of a cut later this year, which we view as reasonable. This pricing keeps the front end of the euro curve well anchored, implying that any further deterioration in global risk sentiment—stemming from outside the euro area—would likely continue to flatten the curve. That said, a concurrent strengthening of the euro would complicate the curve dynamics.

    A dovish BoE fails to outweigh mounting political risks

    Markets reacted far more strongly to the Bank of England meeting than to the ECB, with a March rate cut rapidly becoming the base-case scenario. The BoE’s relatively sparse inter-meeting communication means that policy surprises tend to generate outsized moves, and this meeting delivered just that. The 2-year swap rate dropped around 7bp as the outcome proved more dovish than markets had anticipated. We are broadly aligned with the revised pricing and see considerable scope for easing as inflation continues to soften. Governor Bailey appeared to endorse this view, later remarking that current market pricing for a March cut was “not a bad place to be.”

    Attention now shifts to the long end of the curve, where political risks may continue to exert upward pressure on 30-year gilt yields. Unlike the front end, the 30-year yield actually rose by roughly 3bp on Thursday despite the BoE’s dovish pivot. Political uncertainty—particularly around Starmer’s position as prime minister—adds to doubts over the future fiscal trajectory. Ahead of November’s budget, we had estimated the 10-year gilt risk premium at around 25bp, underscoring investor sensitivity to the UK’s fiscal outlook. Against this backdrop, we see limited scope for 10-year GBP rates to move meaningfully lower in the near term.

    Friday: Key Events and Market Outlook

    Softer US labor indicators weighed on risk sentiment on Thursday. While Friday does not bring the official jobs report, attention will turn to the preliminary University of Michigan consumer sentiment index. Consensus expectations point to a weaker reading, but any sharper-than-anticipated deterioration would likely amplify existing market unease. Consumer credit data, also due on Friday, will be another point of focus.

    In the euro area, the ECB will publish its Survey of Professional Forecasters. Following the ECB meeting, markets will also listen closely to remarks from ECB officials, with Kocher and Cipollone scheduled to speak. Elsewhere, BoE Chief Economist Huw Pill is also on the agenda.

    On the supply side, government issuance is limited, with the only primary market activity being a €0.5bn Belgian ORI auction.

    Sources: Padhraic Garvey

  • BoE and ECB Decisions Drive GBP/USD and EUR/USD Outlooks

    BoE’s Dovish Stance Pressures the Pound

    The Bank of England held its policy rate at 3.75%, but the decision revealed a notably divided committee, with four of the nine members voting in favor of another cut. This close split has reinforced expectations for a rate reduction as soon as March, particularly as inflation continues to ease and wage growth shows signs of cooling.

    The BoE now estimates that wage growth consistent with its 2% inflation target is roughly 3.25%, only slightly below current private-sector pay growth of about 3.6%. With inflation projected to fall toward 1.8% by April, the central bank appears increasingly comfortable with the prospect of further policy easing.

    Governor Andrew Bailey remains a pivotal swing vote, and if upcoming data confirms a softer labor market and moderating pay growth, he is widely expected to back a rate cut at the next meeting. Markets are already pricing in additional easing through the summer months.

    GBP/USD Technical Perspective

    GBP/USD has been trending lower, reflecting expectations of Bank of England rate cuts and a broadly dovish policy outlook.

    On the four-hour chart, the pair continues to trade within a well-defined descending channel, currently hovering around 1.3536. This structure indicates that sellers remain in control for the time being.

    That said, a notable support zone sits near 1.34, aligning with a previous accumulation area. A break lower within the channel could see price gravitate toward that level.

    Conversely, a move above the upper boundary of the channel would signal a shift in momentum and could open the door to a rebound toward the 1.37–1.38 area in the near term.

    Summary:

    • Trend: Bearish, within a descending channel
    • Support: 1.34
    • Resistance: 1.37–1.38
    • Key Catalyst: March Bank of England policy meeting

    ECB Remains Comfortably on Hold

    The European Central Bank left interest rates unchanged, signaling confidence that the eurozone economy remains in a solid position. Inflation is tracking close to the 2% target, growth is stable, and there is little immediate need to either tighten or ease policy.

    That said, past experience suggests the ECB is willing to resume rate cuts after extended pauses if conditions evolve. A meaningful appreciation in the euro or a dip in inflation below target could prompt policymakers to consider a modest “insurance cut” later in the year to guard against undershooting inflation.

    For now, however, the ECB appears comfortable remaining on hold, a stance that has translated into relatively calm market conditions.

    EUR/USD Technical Perspective

    EUR/USD continues to consolidate in a narrow range between 1.1780 and 1.1840, reflecting the ECB’s steady policy stance and a broader lack of directional conviction. Volatility remains subdued, underscoring ongoing market indecision.

    A renewed move lower could develop if expectations build around further ECB easing, or if euro strength becomes a concern for policymakers. Until a clear catalyst emerges, price action is likely to remain range-bound, with consolidation dominating near-term trading.

    Summary:

    • Trend: Sideways / range-bound
    • Range: 1.1780–1.1840
    • Downside risk: A decisive break below 1.1780 would expose a move toward 1.1700
    • Catalyst: Shift in ECB tone or renewed concerns over excessive euro strength

    In short:

    • The BoE’s dovish stance is pressuring the pound, leaving GBP/USD biased lower.
    • The ECB’s steady, wait-and-see approach is keeping the euro supported, though excessive euro strength could revive rate-cut speculation.
    • With both central banks leaning dovish, the next meaningful FX moves are likely to be driven by shifts in rate expectations, not policy surprises.

    Sources: Zorrays Junaid

  • Yen edges higher from two-week low against dollar but upside remains limited

    Japanese yen bears trimmed positions ahead of Japan’s snap election on Sunday, allowing the currency to recover modestly. Growing speculation of an imminent Bank of Japan rate hike, combined with a broader risk-off mood, has also supported the safe-haven yen. Meanwhile, the U.S. dollar paused its recent rebound from a four-year low, adding further downside pressure on USD/JPY.

    The Japanese yen attracted modest buying during Asian trading on Friday, appearing to snap a five-day losing streak against the U.S. dollar after touching a two-week low in the previous session. Traders remain alert to the possibility of coordinated Japan–U.S. intervention to curb further yen weakness, while a shift in global risk sentiment and elevated market volatility have boosted demand for the currency’s safe-haven appeal. Expectations for a more hawkish Bank of Japan have also provided underlying support to the yen.

    Data released earlier showed Japan’s household spending fell sharply in December, highlighting the impact of higher prices on consumer activity and reinforcing expectations that the BoJ could move toward a rate hike sooner rather than later. That said, concerns about Japan’s fiscal position and ongoing political uncertainty may limit aggressive bullish positioning in the yen. In addition, the U.S. dollar’s recent recovery from a four-year low could help cap further declines in USD/JPY as markets look ahead to Japan’s snap lower house election on February 8.

    Yen finds support from hawkish BoJ outlook and improving risk sentiment

    Data released earlier on Friday showed that Japan’s Household Spending fell 2.6% YoY in December 2025, reversing a 2.9% increase in the previous month. The sharp contraction highlights the drag from elevated living costs on consumption and reinforces the Bank of Japan’s resolve to tackle inflation, strengthening the case for an earlier interest rate hike.

    This view is supported by the Summary of Opinions from the BoJ’s January meeting, which revealed that policymakers discussed rising price pressures stemming from a weak Japanese Yen and agreed that further rate hikes would be appropriate over time. These factors helped the JPY attract modest buying during the Asian session.

    The Yen also benefited from a risk-off impulse, as Asian equities extended losses for a second straight day following a deepening selloff in global tech stocks. Meanwhile, the US Dollar paused its recent advance to a two-week high, prompting traders to trim USD/JPY long positions ahead of Japan’s snap lower house election on Sunday, February 8.

    Japan’s Prime Minister Sanae Takaichi’s Liberal Democratic Party (LDP) is widely expected to secure a decisive victory, which would strengthen her control over parliament and provide greater scope to pursue aggressive pro-stimulus policies. However, markets remain concerned that expansionary fiscal plans could further strain Japan’s already fragile public finances, limiting the Yen’s upside.

    From the US, data released Thursday showed that Initial Jobless Claims rose to 231K for the week ending January 31, up from 209K and above expectations of 212K, adding to weak private-sector employment data released earlier in the week. Further evidence of labor market softening came from the JOLTS report, which showed job openings falling to 6.542 million in December from a downwardly revised 6.928 million previously.

    The softer labor backdrop has reinforced expectations for additional Federal Reserve easing, with markets currently pricing in two more rate cuts in 2026. This has capped the US Dollar’s rebound from a four-year low and contributed to USD/JPY pulling back modestly from the two-week high above the 157.00 level touched on Thursday.

    Traders now await the preliminary Michigan Consumer Sentiment Index and inflation expectations, along with remarks from key FOMC members, for fresh directional cues later in the North American session. However, market reactions are likely to remain subdued ahead of Japan’s closely watched political event.

    USD/JPY buyers remain in control after breaking above the 200-period SMA resistance on the H4 chart.

    The overnight move above the 156.50 barrier, which aligns with the 200-period SMA on the 4-hour chart, marked an important catalyst for USD/JPY bulls. The gently rising SMA reflects a stable underlying uptrend, and prices remaining above it preserve a bullish tone. However, the MACD has dipped below its Signal line around the zero level, with the histogram turning negative and widening, pointing to a loss of upside momentum. Meanwhile, the RSI has retreated to 63 from overbought territory, highlighting a more tempered momentum backdrop.

    As long as USD/JPY holds above the rising 200-period SMA, upside risks remain favored. A sustained break below this level would shift the focus toward a corrective pullback. From a momentum perspective, continued expansion of the negative MACD histogram would strengthen downside risks, while a swift move back above zero would negate the bearish crossover. The RSI staying above 50 continues to support the bullish case, whereas a slide toward that level would signal weakening buying interest.

    Sources: Haresh Menghani

  • Dollar ticks higher as euro, pound dip after central banks stand pat

    The U.S. dollar inched higher on Thursday, clawing back some strength amid ongoing volatility in equity markets, while attention turned to the euro and sterling following key central bank rate decisions. By 13:43 ET (18:43 GMT), the Dollar Index—which measures the greenback against a basket of six major currencies—was up 0.2% at 97.77, hovering near a two-week high and extending its rebound from levels close to four-year lows.

    Stock market volatility lends support to the dollar

    Heightened volatility across global equity markets—driven largely by concerns over stretched artificial intelligence spending—has prompted traders to rotate back into the U.S. dollar as a safe haven.

    Analysts at ING noted that a more challenging equity backdrop typically triggers a move away from risk and pro-cyclical currencies toward the dollar, a dynamic they said has likely provided the greenback with some support this week. They added that while it remains unclear whether the current correction in U.S. technology stocks has further to run, a fully invested buy side appears increasingly vulnerable to negative surprises.

    The dollar also found support late last week following the nomination of Kevin Warsh as the next Federal Reserve chair, with markets viewing him as less dovish than previously anticipated. Meanwhile, private payrolls data pointed to a cooling U.S. labor market, although the recent brief government shutdown has delayed the release of key employment figures scheduled for Friday.

    Even so, several weak labor market signals emerged on Thursday. January job cuts rose to their highest level for that month since 2009, initial jobless claims exceeded expectations, and December job openings data fell short of forecasts.

    Euro and pound move into focus

    In Europe, the euro edged lower, with EUR/USD down 0.1% at 1.1799 after the European Central Bank left interest rates unchanged, in line with expectations. The ECB’s Governing Council said inflation is likely to stabilize around its 2% target over the medium term, while noting that the eurozone economy remains resilient despite a challenging global backdrop. Data released earlier in the week showed euro area CPI inflation eased to 1.7% year-on-year in January, from 1.9% in December.

    Commenting on the decision, Mark Wall, chief European economist at Deutsche Bank, said the ECB was striking a necessary balance between downside risks and underlying strengths, adding that holding rates steady appeared appropriate given external vulnerabilities alongside domestic resilience, partly supported by increased defence and infrastructure spending in Germany.

    Sterling also weakened, with GBP/USD falling 0.9% to 1.3544 after the Bank of England kept its benchmark rate unchanged. The Monetary Policy Committee said it expects inflation to return to its 2% target by the spring. Sanjay Raja, chief UK economist at Deutsche Bank, noted that while a rate cut was closer than anticipated, the meeting was more about positioning within the MPC, as rising economic trade-offs continue to fuel uncertainty over how restrictive current policy remains.

    Yen in focus ahead of weekend elections

    In Asian trading, USD/JPY edged 0.1% higher to 156.84, as the Japanese yen remained under pressure ahead of this weekend’s lower house elections. Prime Minister Sanae Takaichi’s party is widely expected to secure a larger majority, raising expectations of increased fiscal spending from Tokyo. Ongoing concerns about Japan’s stretched public finances have weighed heavily on the yen in recent weeks, with losses compounded by Takaichi’s remarks downplaying currency weakness.

    Elsewhere, USD/CNY dipped slightly to 6.9378, with the Chinese yuan hovering near its strongest level in almost three years. The currency has been supported by a series of firm midpoint fixings from the People’s Bank of China, keeping the pair comfortably below the psychologically important 7.00 level.

    The Australian dollar weakened, with AUD/USD sliding 0.4% to 0.6960, slipping back below 0.70 after two sessions of solid gains following a hawkish Reserve Bank of Australia meeting on Tuesday. The RBA raised interest rates by 25 basis points and upgraded its growth and inflation forecasts for the year.

    Sources: Anuron Mitra

  • Silver Remains Bearish in the Near Term After Rally Fizzles

    Silver sold off sharply after Kevin Warsh’s nomination to the Fed caught investors off guard who had been anticipating a more dovish pivot. The metal remains under pressure from margin increases, elevated physical delivery requirements, and aggressive short positioning by Chinese traders. While long-term fundamentals remain constructive, prices are still range-bound as the market waits for clearer macro and technical signals.

    The steep decline in silver toward the end of last week can reasonably be characterized as a crash, triggered primarily by the announcement of Kevin Warsh’s nomination to lead the Federal Reserve.

    Prior to the news, markets had been positioned for a notably dovish appointment, an expectation shaped by President Donald Trump’s repeated calls for a weaker U.S. dollar and faster interest-rate cuts. Warsh’s nomination caught investors off guard, forcing a rapid reassessment of monetary policy expectations.

    Even so, uncertainty remains around how the incoming Fed chair would ultimately steer the central bank.

    At the same time, broader commodity markets have struggled to regain traction. Despite several rebound attempts, prices have failed to establish sustained upside momentum, leaving commodities—silver included—likely confined to a period of sideways consolidation for now.

    Investors Demand Physical Deliveries

    Beyond monetary policy concerns, silver prices are facing additional pressure following the CME Group’s decision to raise margin requirements for gold and silver. The higher margins have forced some leveraged investors to unwind long positions, intensifying selling pressure.

    At the same time, a growing number of futures contracts are moving toward physical delivery rather than being rolled forward. Given the current supply tightness, this dynamic is, for now, benefiting sellers more than buyers.

    Activity out of China has also drawn attention. Zhongcai Futures reportedly established a sizable short position in silver—estimated at roughly $1.5 billion—and appears to have profited significantly from the recent decline.

    With the Lunar New Year holiday ending and the Shanghai Stock Exchange reopening, market participants will be closely monitoring how Asian demand evolves.

    Overall, the recent move appears to be a corrective pullback after metals prices advanced too rapidly over a short period. While the near-term retracement has weighed on sentiment, it does little to alter the longer-term outlook. From a fundamental perspective, the case for higher prices remains intact, supported by constrained supply and steadily rising industrial demand.

    Investors will also be watching Kevin Warsh closely, as any public remarks could provide clearer insight into his economic views and expectations for the interest-rate path in the months ahead.

    Technical View on Silver

    Early in the week, demand showed signs of returning as investors stepped in to buy the dip. However, the rebound proved short-lived, with a fresh wave of selling reversing the recovery. For now, prices are consolidating within a range of roughly $74 to $92 per ounce.

    By the end of the week, prices are likely to stay confined within this range, provided U.S. labor market data does not deliver any major surprises. From a technical standpoint, the market appears to be in wait-and-see mode, looking for a decisive breakout to determine the next directional move. Meanwhile, the U.S. Dollar Index has once again held key support near the 96 level, which also represents its lows for the year.

    If buyers are able to extend the rebound, the next major hurdle sits near the 100 resistance level. A decisive break above that area could pave the way for a move toward 103.

    On the downside, a drop below 96 on the U.S. Dollar Index would be a clear signal that the broader downtrend remains intact and is likely to persist.

    Sources: Damian Nowiszewski

  • AUD/USD slips below 0.7000 following mixed Australian trade data

    AUD/USD is trading lower below the key 0.7000 psychological level during Thursday’s Asian session, pressured by mixed Australian trade data. The pair is also weighed down by a firm U.S. dollar, which is hovering near a two-week high. With limited domestic catalysts, traders are now turning their attention to the upcoming U.S. JOLTS job openings data for fresh direction.

    AUD/USD Technical Outlook

    Should bullish momentum intensify, AUD/USD is likely to encounter its next resistance at the 2026 peak of 0.7093 (Jan 29), followed by the 2023 high at 0.7157 (Feb 2).

    On the downside, a break below the February low at 0.6908 (Feb 2) may trigger a deeper pullback toward the interim 55-day SMA at 0.6693, ahead of the 2026 trough at 0.6663 (Jan 9). Additional downside support is seen at the 100-day SMA at 0.6628, with stronger support at the 200-day SMA at 0.6563 and the November low at 0.6421 (Nov 21).

    Momentum indicators remain constructive and point to further upside potential, although the pair’s overbought readings suggest the risk of a near-term correction. The RSI hovers near 72, while the ADX around 50 continues to signal a strong underlying trend.

    Bottom line

    AUD/USD continues to be heavily influenced by global risk appetite and developments in China’s economy. A sustained move above the 0.7000 handle would reinforce a more credible bullish outlook.

    For the time being, a weaker U.S. dollar, stable—though not particularly strong—domestic data, a still-hawkish tilt from the RBA, and modest backing from China leave the balance of risks skewed toward further upside rather than a pronounced pullback.

    Fundamental Analysis

    AUD/USD remains entrenched in its broader uptrend despite renewed selling pressure emerging on Wednesday. Any near-term pullbacks are expected to attract buying interest, as the Reserve Bank of Australia continues to project a clearly hawkish stance following its latest rate decision.

    The Australian Dollar is struggling to extend Tuesday’s advance, easing back and once again testing the psychologically significant 0.7000 mark.

    The retreat comes as the U.S. Dollar regains some traction, with markets having largely absorbed the RBA’s hawkish hike and refocusing attention on U.S. economic and monetary policy developments.

    Australia: Growth Is Cooling, Not Collapsing

    Recent Australian data have been underwhelming rather than alarming, reinforcing a well-established narrative. Economic activity is slowing, but in a controlled manner, with momentum easing rather than breaking down—supporting the soft-landing view.

    January PMI surveys align with this assessment, as both Manufacturing and Services strengthened and remained firmly in expansion territory, at 52.3 and 56.3 respectively. Retail sales continue to show resilience, and although the trade surplus narrowed to A$2.936 billion in November, it remains solidly positive.

    Growth is moderating only gradually, following a 0.4% quarter-on-quarter rise in GDP in Q3. On an annual basis, output expanded by 2.1%, matching the RBA’s projections.

    The labour market remains a standout performer. Employment jumped by 65.2K in December, while the unemployment rate unexpectedly edged down to 4.1% from 4.3%.

    Inflation, however, continues to be the key challenge. December CPI surprised to the upside, with headline inflation accelerating to 3.8% year-on-year from 3.4%. The trimmed mean rose to 3.3%, in line with market expectations but slightly above the RBA’s 3.2% forecast. On a quarterly basis, trimmed mean inflation increased to 3.4% in the year to Q4, marking the highest level since Q3 2024.

    China: A Backdrop of Support, Not a Catalyst

    China continues to offer a generally supportive backdrop for the Australian dollar, though without the momentum needed to drive a sustained upswing.

    Economic growth ran at an annualised 4.5% in the October–December quarter, with quarter-on-quarter expansion at 1.2%. Retail sales rose 0.9% year-on-year in December—respectable, but not particularly compelling.

    More recent indicators point to a renewed loss of momentum. Both the NBS Manufacturing PMI and the Non-Manufacturing PMI slipped back into contraction territory in January, at 49.3 and 49.4 respectively.

    By contrast, the Caixin surveys painted a slightly brighter picture, with the Manufacturing PMI edging up to 50.3 to remain in expansion, while the Services PMI increased to 52.3.

    Trade stood out as a relative bright spot, as the surplus widened sharply to $114.1 billion in December, supported by nearly 7% growth in exports and a solid 5.7% rise in imports.

    Inflation signals remain mixed. Consumer prices were unchanged at 0.8% year-on-year in December, while producer prices stayed firmly negative at -1.9%, underscoring that deflationary pressures have yet to fully fade.

    For now, the People’s Bank of China is maintaining a cautious stance. Loan Prime Rates were left unchanged in January at 3.00% for the one-year and 3.50% for the five-year, reinforcing expectations that policy support will remain gradual rather than aggressive.

    RBA: Leaning Hawkish, In No Hurry to Ease

    The RBA raised the cash rate to 3.85% in a decisively hawkish move that largely met expectations. Upward revisions to both growth and inflation forecasts signal firmer economic momentum and increasingly broad-based price pressures. Core inflation is now projected to remain above the 2–3% target band for much of the forecast horizon, reinforcing the case for a restrictive policy stance.

    The central message is that inflation is becoming more demand-driven. The RBA cited stronger-than-expected private demand as a key justification for tighter policy, even as productivity growth remains subdued. While Governor Bullock described the move as an “adjustment” rather than the beginning of a renewed hiking cycle, the signal was clear: policymakers are uneasy with the upward drift in inflation.

    For markets, this implies interest rates are likely to stay higher for longer, limiting the scope for near-term easing. From an FX perspective, this provides marginal support for the Australian dollar—particularly against low-yielding peers—even as the RBA’s emphasis on full employment tempers the likelihood of an aggressive tightening phase.

    In the wake of the decision, markets are now pricing in nearly 40 basis points of additional tightening by year-end.

    Positioning: Shifting Sentiment Toward the AUD

    The latest positioning data suggest the worst of the bearish sentiment toward the Australian dollar may have passed. CFTC figures show that non-commercial traders have returned to a net long stance for the first time since early December 2024, although the position remains modest at just over 7.1K contracts in the week ending January 27.

    Open interest has also climbed to its highest level in several weeks, exceeding 252K contracts, indicating that traders are beginning to re-engage with the market. That said, the move appears tentative rather than a strong conviction call on a sustained appreciation in the AUD, at least for now.

    Key Drivers Ahead

    Near term: Market attention is shifting back toward the United States. Incoming economic data, tariff-related developments, and ongoing geopolitical headlines are likely to drive movements in the U.S. dollar. For the Australian dollar, the key swing factors remain domestic labour market and inflation data, and how these shape expectations for the RBA’s next policy decision.

    Risks: The AUD remains highly sensitive to global risk sentiment. A sharp deterioration in risk appetite, renewed concerns over China’s outlook, or an unexpected resurgence in the U.S. dollar could quickly unwind recent gains.

    Sources: Fxstreet

  • Australian dollar steady after China services PMI release

    • The Australian dollar strengthened after the Composite PMI surged to 55.7 in January, marking the fastest pace of expansion in nearly four years.
    • The Aussie also benefited as markets priced in an 80% probability of an interest rate hike in May, along with around 40 basis points of additional policy tightening.
    • Meanwhile, the U.S. dollar remained subdued for a second straight session.

    The Australian dollar strengthened against the U.S. dollar on Wednesday, extending gains of more than 1% from the previous session. The AUD/USD pair held firm after China’s Services Purchasing Managers’ Index (PMI) rose to 52.3 in January from 52.0 in December, beating market expectations of 51.8. As China is Australia’s largest trading partner, improvements in Chinese economic activity tend to support the Aussie.

    The AUD also drew support from upbeat domestic PMI data. Seasonally adjusted figures from S&P Global showed Australia’s Composite PMI climbed to 55.7 in January from 51.0 in December, marking the strongest expansion in 45 months. The Services PMI jumped to 56.3 from 51.1, its highest reading since February 2022, exceeding the flash estimate of 56.0 and remaining well above the 50.0 threshold. This extended the run of expansion in services activity to two years.

    The Reserve Bank of Australia raised its Official Cash Rate by 25 basis points to 3.85% on Tuesday, pointing to stronger-than-expected economic growth and persistently elevated inflation. As the tightening cycle gathers momentum, markets have increased the odds of another rate hike in May to around 80% and are now pricing in roughly 40 basis points of additional tightening through the rest of the year.

    Speaking at the post-meeting press conference, RBA Governor Michele Bullock said inflationary pressures remain uncomfortably high, warning that a return to the target range will take longer than previously expected and is no longer acceptable. She emphasized that the board will remain data-dependent and avoid providing forward guidance.

    U.S. dollar little changed after recent losses

    The U.S. Dollar Index (DXY), which tracks the greenback against six major currencies, remained subdued for a second straight session, trading near 97.40 at the time of writing.

    Data released on Monday showed an unexpected rebound in U.S. manufacturing activity, underscoring economic resilience. The ISM Manufacturing PMI rose to 52.6 in January from 47.9 in December, comfortably beating expectations of 48.5.

    Markets have also been assessing President Donald Trump’s nomination of Kevin Warsh as the next Federal Reserve chair, a move widely interpreted as signaling a more disciplined and cautious approach to monetary easing. The dollar found some support earlier as risk sentiment improved after the U.S. Senate reached an agreement to advance a government funding package, averting a shutdown, according to Politico.

    Producer-side inflation in the U.S. remained firm, reinforcing the Fed’s policy stance. Headline PPI held steady at 3.0% year-over-year in December, unchanged from November and above expectations for a slowdown to 2.7%. Core PPI, which excludes food and energy, accelerated to 3.3% from 3.0%, defying forecasts for a decline to 2.9% and highlighting persistent upstream price pressures.

    Fed officials struck a cautious tone. St. Louis Fed President Alberto Musalem said additional rate cuts are not warranted at this stage, describing the current 3.50%–3.75% policy rate range as broadly neutral. Atlanta Fed President Raphael Bostic echoed this view, urging patience and arguing that policy should remain modestly restrictive.

    In Australia, inflation data showed mixed signals. The RBA’s trimmed mean inflation rose 0.2% month-over-month and 3.3% year-over-year, while the monthly CPI jumped 1.0% in December, exceeding forecasts of 0.7%. Export prices climbed 3.2% quarter-on-quarter in Q4 2025—the first increase in three quarters and the strongest gain in a year—while import prices rose 0.9%, beating expectations for a decline.

    China’s RatingDog Manufacturing PMI edged up to 50.3 in January from 50.1 in December, in line with expectations and marking the fastest pace of factory expansion since October.

    Additional Australian indicators pointed to easing inflation momentum and improving labor demand. The TD-MI Inflation Gauge rose 3.6% year-over-year in January, while monthly inflation increased just 0.2%, the weakest pace since August. Meanwhile, ANZ Job Advertisements surged 4.4% month-over-month in December, posting the strongest increase since February 2022 and signaling renewed momentum in hiring toward year-end.

    Australian dollar rebounds toward three-year highs near 0.7100

    The AUD/USD pair was trading near 0.7030 on Wednesday. Analysis of the daily chart shows the pair remains within an ascending channel, pointing to a sustained bullish bias. The 14-day Relative Strength Index (RSI) stands at 73.30, signaling strong upward momentum, though conditions appear increasingly stretched.

    AUD/USD recently rebounded toward 0.7094, its highest level since February 2023, reached on January 29. A decisive break above this resistance could open the way for a move toward the upper boundary of the ascending channel around 0.7210. On the downside, initial support is seen at the nine-day Exponential Moving Average (EMA) near 0.6964, which coincides with the channel’s lower boundary. A deeper pullback could bring the 50-day EMA at 0.6759 into focus.

    AUD/USD: Daily Chart

    Sources: Akhtar Faruqui

  • Dollar seeks footing in re-basing move

    The U.S. dollar has extended its modest recovery as gold and silver have sold off sharply, and conditions now appear stable enough for incoming data to drive FX markets this week. The U.S. economic calendar is set to culminate in solid payrolls and unemployment figures, potentially leaving room for further upside in the dollar.

    Elsewhere, the European Central Bank may avoid focusing heavily on the euro in its messaging, while the Reserve Bank of Australia could deliver a rate hike as soon as tonight.

    USD: Some Health Restored

    The dollar is showing renewed strength. The de-basement trade that appeared to drive last week’s sharp decline in the USD has begun to unwind following Kevin Warsh’s nomination by President Donald Trump as the next Federal Reserve chair. The steep correction in previously overbought precious metals has likely provided additional support for the dollar, although we have consistently argued that the earlier USD selloff had become overly disconnected from underlying macro fundamentals.

    With the dollar now partially recovered, we expect price action to realign more closely with incoming data and short-term rate dynamics this week. The U.S. economic calendar is busy, featuring ISM surveys (with manufacturing due today), JOLTS and ADP reports ahead of Friday’s payrolls release. Our expectation is for around 80,000 jobs added and an unchanged unemployment rate of 4.4%, which could help underpin further stabilization or recovery in the dollar.

    In the meantime, we are watching closely for signs of dip-buying interest in EUR/USD. We see the key support zone around 1.1880–1.1900, and the recent break below this area suggests some renewed confidence in the dollar. A renewed rally in the euro without clear data or event-driven justification would imply that damage to the dollar may be more persistent. For now, however, we maintain a short-term bullish outlook for the USD.

    EUR: Concerns over euro strength may be overstated

    This week’s key question is how concerned the European Central Bank truly is about the euro’s recent appreciation. With EUR/USD no longer hovering near the much-feared 1.20 level, the likelihood of an explicit reaction from ECB officials has diminished—any comments were always more likely to emerge after the meeting or in the minutes rather than in the main policy statement.

    At Thursday’s meeting, there may be little to prompt a change in President Christine Lagarde’s long-standing reluctance to comment on exchange rate levels. At the same time, markets do not appear to be pricing in significant risk of verbal pushback against euro strength, suggesting that the threshold for a negative euro response is relatively low.

    Eurozone core inflation data due on Wednesday are expected to ease slightly to 2.2%. Our economists see a marginally higher print of 2.3%, but either outcome is unlikely to have much impact on the currency. For now, EUR/USD should continue to be driven largely by dollar sentiment, and if confidence in the USD continues to recover as expected, we see the pair moving toward our short-term fair value estimate of 1.1770 in the near term.

    AUD: RBA rate hike hangs in the balance

    The Australian dollar has been among the hardest hit by the abrupt unwinding of long positions in gold and silver. More broadly, AUD/USD appeared to be pricing in an excessive amount of optimism in January, particularly given unchanged interest rate differentials. Unlike EUR/USD—where rate expectations have shifted little on the euro side—AUD/USD has seen notable moves at the front end of the curve on both sides.

    Markets are now pricing in around 19 basis points of tightening from the Reserve Bank of Australia at tonight’s meeting, and we align with consensus in expecting a 25 bp rate hike to 3.85%. That said, the decision looks finely balanced. While the upside surprise in December CPI, coupled with a strong housing market, supports a hike, the RBA is unlikely to signal the start of a new tightening cycle. With markets already pricing at least one additional hike by year-end, any indication that this move is “one and done” would limit the support a hike could provide to the Australian dollar.

    In our view, the impact of RBA tightening on AUD/USD is more likely to become apparent beyond the near term, once the overwhelming volatility in the U.S. dollar subsides. Consistent with our USD outlook, and given that market pricing is already skewed toward a hawkish outcome, we expect AUD/USD to trade lower in the coming weeks before eventually settling into a more sustainable recovery path beyond the 0.70 level.

    Sources: Francesco Pesole

  • Weekly FX Outlook: EUR/USD, Crude Oil, Bitcoin, Silver & Gold

    Fundamental Analysis & Market Sentiment

    Last week’s best trade ideas were as follows:

    • Long EUR/USD after a daily close above 1.1866, resulting in a 0.24% loss.
    • Long Silver, which ended with a loss of 18.62%.
    • Long Gold after a daily close above $5,000, producing a 2.26% loss.

    Taken together, these positions generated a total loss of 21.12%, or 7.04% per asset. While this was a sizable drawdown, the broader performance of my weekly forecasts over recent weeks remains positive, as earlier gains were exceptionally strong and more than offset this setback.

    Key market data from last week:

    • U.S. Federal Reserve policy meeting: No surprises, with interest rates left unchanged.
    • U.S. Producer Price Index (PPI): The standout data release of the week. Inflation came in far hotter than expected, with headline PPI rising 0.5% month-on-month and core PPI increasing 0.7%, versus forecasts of just 0.2% for both. This reinforced a more hawkish Fed outlook, lifted the U.S. dollar, and accelerated the sharp reversal in Silver (and Gold). As a result, expectations for a second U.S. rate cut in 2026 were pushed back to October.
    • Bank of Canada policy meeting: No change to interest rates, as anticipated.
    • Australian CPI: Inflation exceeded expectations, with an annual rate of 3.8% versus 3.5% forecast, strengthening the case for possible RBA rate hikes and supporting the Australian dollar early in the week.
    • Canadian GDP: Slightly weaker than expected, showing zero month-on-month growth.
    • U.S. unemployment claims: In line with forecasts.

    While PPI and Australian inflation influenced market moves, two broader developments likely had an even greater impact:

    • Federal Reserve leadership: President Trump announced his nominee for the next Fed Chair, Kevin Warsh. Although regarded as a hawk, Warsh is now thought to favor lower interest rates. The nomination contributed to the collapse of the Silver rally and provided additional support to the U.S. dollar.
    • Geopolitical tensions: The U.S. continued its military buildup near Iran, raising the risk of a wider regional conflict. Polymarket currently assigns a high probability to a U.S. strike on Iran in March, despite President Trump still referencing the possibility of a diplomatic agreement. These tensions appear to be supporting crude oil prices, with WTI crude reaching a new four-month high last week.

    Meanwhile, the S&P 500 briefly pushed to a fresh record above 7,000. Although the index remains resilient, upside momentum is limited. In my view, a clearer resolution to U.S.–Iran tensions is needed before a more decisive directional move can develop.

    The Week Ahead: 2nd – 6th February

    The most significant data releases for the coming week, ranked by expected market impact, include:

    • U.S. Average Hourly Earnings and Non-Farm Payrolls
    • Preliminary University of Michigan Inflation Expectations
    • European Central Bank main refinancing rate decision and monetary policy statement
    • Bank of England official bank rate decision, voting breakdown, and monetary policy report
    • Reserve Bank of Australia cash rate decision, rate statement, and monetary policy statement
    • U.S. JOLTS job openings
    • Preliminary University of Michigan consumer sentiment
    • U.S. ISM services PMI
    • U.S. ISM manufacturing PMI
    • U.S. unemployment rate
    • New Zealand unemployment rate
    • Canadian unemployment rate
    • U.S. weekly unemployment claims

    This will be a particularly busy and potentially market-moving week, with three major central banks delivering policy decisions. Please note that Friday is a public holiday in New Zealand, which may reduce liquidity in related markets.

    Monthly Forecast February 2025

    For the month of January 2026, I forecasted that the USD/JPY currency pair would rise in value. Unfortunately, this was a losing trade.

    For the month of February, I forecast that the EUR/USD currency pair will rise in value.

    Weekly Forecast 2nd February 2026

    Last week, three currency crosses experienced unusually high volatility, prompting the following weekly trade forecasts:

    • Short NZD/JPY, which resulted in a 0.57% loss.
    • Short AUD/JPY, ending with a 0.32% loss.
    • Short NZD/CAD, producing a 0.39% loss.

    Overall, the Swiss franc and the New Zealand dollar emerged as the strongest major currencies of the week, while the U.S. dollar was the weakest. Market conditions were relatively subdued, with directional volatility dropping sharply—only 11% of major currency pairs and crosses moved by more than 1% over the week.

    Technical Analysis

    Key Support/Resistance Levels for Popular Pairs

    US Dollar Index

    Last week, the U.S. Dollar Index formed a notably large bullish pin bar, rejecting a fresh four-year low. On its own, this price action is bullish. However, the broader technical structure remains bearish, with the index still trading below its levels from 13 and 26 weeks ago. As a result, the technical outlook for the U.S. dollar is mixed.

    The nomination of Kevin Warsh as Federal Reserve Chair provided some support to the dollar during the week. Nevertheless, the forward outlook remains uncertain, and I believe the most attractive trading opportunities in the near term are likely to be independent of U.S. dollar direction.

    EUR/USD

    The EUR/USD pair recently staged a strong long-term bullish breakout as the U.S. dollar accelerated lower and printed a new 3.5-year low. However, the move quickly failed, with price retreating sharply and finding minimal follow-through support.

    This price action suggests the breakout may have been a temporary spike, although the potential for a sustained bullish trend should not be dismissed, as EUR/USD has historically shown a tendency to trend cleanly once momentum is established.

    That said, the appointment of a new Fed Chair and the renewed strength in the U.S. dollar late in the week—driven by hotter inflation data—argue for a more cautious stance.

    Accordingly, I would only consider a long position following a daily (New York close) above 1.2039.

    WTI Crude Oil

    WTI crude oil has surged strongly in recent sessions as the risk of a regional conflict centered on Iran has intensified. Prediction markets are currently assigning a high probability to a U.S. strike on Iran in March, a scenario that could significantly disrupt global crude supply. Against this backdrop, prices pushed to a new four-month high by the end of last week, with a daily close above $66.25 marking a potential six-month high.

    However, two important cautions should be noted:

    • While a daily close above $66.25 would typically attract trend-following buying, the current moving average structure does not confirm a bullish setup. Even in the event of military conflict, the move could prove to be a short-lived spike, especially if a rapid U.S. victory follows, potentially resulting in a failed breakout.
    • Unlike recent Democratic administrations, the Trump administration is likely to take aggressive steps to suppress crude oil prices, which could cap or reverse upside momentum.

    Bitcoin

    BTC/USD has finally completed a decisive bearish breakdown below the long-term support zone just above $81,000. Price is now firmly established beneath this level and has pushed to a new nine-month low, a development that is technically significant and clearly bearish.

    While equities and precious metals have rallied strongly in recent months, Bitcoin peaked at a record high several months ago and has since trended steadily lower. This divergence highlights a broader downturn across the crypto sector, with Bitcoin now showing clear signs of structural weakness.

    Despite early expectations that Bitcoin would fundamentally reshape global finance, real-world adoption remains limited outside parts of Africa. Practical usability is still constrained, and its underlying value proposition remains uncertain.

    Although I generally avoid short-selling, Bitcoin appears entrenched in a long-term bearish trend. I would not consider buying at current levels. Short positions may be worth considering, but only with strict risk management, as shorting is best suited to experienced traders.

    XAG/USD

    Silver experienced an exceptionally volatile week, surging more than 15% to hit a new all-time high and the long-discussed $120 options target, before suffering a dramatic reversal. The sell-off unfolded sharply on Thursday and Friday—particularly Friday—when prices plunged 28% in a single session.

    I had previously cautioned that the move was highly vulnerable to a sharp correction, and that while a long position was justified, it should be taken with a reduced position size.

    The sheer magnitude of the collapse, even with some bullish undertones and modest resilience in the bounce from the weekly lows, strongly suggests that another record high is unlikely in the near term. This extraordinary rally appears to be finished, and the most probable next phase is a period of erratic consolidation, marked by large swings and gradually diminishing volatility.

    XAU/USD

    Much of the analysis above regarding Silver also applies to Gold. That said, gold’s volatility was noticeably lower, and its price action showed greater resilience at the lows.

    While gold is also likely to enter a period of sideways consolidation, the underlying structure suggests it may recover to the upside more quickly than silver.

    Bottom Line

    My preferred trade for the coming week is:

    • Long EUR/USD, contingent on a daily (New York) close above 1.2039.

    Sources: Adam Lemon

  • USD/JPY holds above 155.00 as BoJ reiterates gradual tightening stance

    USD/JPY traded steadily after the Bank of Japan signaled that the risk of falling behind the curve has not increased meaningfully. Japanese Prime Minister Sanae Takaichi noted that a weaker Yen supports exports and helps offset the impact of US tariffs on the auto sector. Meanwhile, the US Dollar gained support following Kevin Warsh’s nomination as Federal Reserve Chair.

    USD/JPY is holding steady after three consecutive days of gains, trading near 155.20 during Asian hours on Monday. Upside momentum may be capped as the Japanese Yen remains relatively calm following the Bank of Japan’s January Summary of Opinions.

    The BoJ’s Summary of Opinions indicated that the risk of falling behind the policy curve has not increased materially, though members emphasized that timely policy action is becoming more important. With real interest rates still deeply negative, policymakers agreed that additional rate hikes would be appropriate if the outlook for growth and inflation remains intact, while continuing to favor a gradual tightening path. Over the weekend, Japanese Prime Minister Sanae Takaichi said a weaker Yen could benefit export-driven industries and help shield the auto sector from the impact of US tariffs.

    The pair may still find support as the US Dollar strengthens following President Donald Trump’s nomination of Kevin Warsh as the next Federal Reserve Chair. Markets view Warsh’s appointment as signaling a more disciplined and cautious approach to monetary easing.

    US producer inflation data also underpinned the Dollar, reinforcing the Federal Reserve’s restrictive policy stance. Headline PPI remained unchanged at 3.0% year over year in December, above expectations for a slowdown to 2.7%, while core PPI accelerated to 3.3% from 3.0%, defying forecasts for a decline to 2.9% and highlighting persistent upstream price pressures.

    Echoing this view, St. Louis Fed President Alberto Musalem said further rate cuts are not justified at this stage, describing the current 3.50%–3.75% policy rate range as broadly neutral. Atlanta Fed President Raphael Bostic also urged patience, arguing that monetary policy should remain modestly restrictive.

    Sources: Fxstreet

  • Silver price outlook: XAG/USD finds near-term support above $70 ahead of US NFP week

    Silver prices are struggling to regain momentum after a sharp selloff on Friday. The metal came under heavy pressure as a stronger US Dollar—boosted by Kevin Warsh’s nomination as the next Federal Reserve Chair—combined with profit-taking to trigger a steep decline.

    Market participants are now turning their attention to the upcoming US Nonfarm Payrolls report for fresh clues on the Federal Reserve’s monetary policy outlook.

    Silver (XAG/USD) is trading cautiously around $80 during the Asian session at the start of the week, holding slightly above Friday’s fresh four-week low of $73.33. The white metal is attempting to stabilize after last week’s sharp selloff, during which it shed more than 30% from its record high of $121.66. The decline was driven by a stronger US Dollar, profit-taking following a strong rally, and expectations of a more hawkish Federal Reserve policy outlook.

    From a technical perspective, the firmer US Dollar continues to undermine Silver’s risk-reward profile. At the time of writing, the US Dollar Index, which measures the Greenback against six major currencies, remains near its weekly high at around 97.33.

    The US Dollar drew strong support on Friday after the White House nominated former Federal Reserve Governor Kevin Warsh to succeed Jerome Powell as Fed Chair. Analysts see Warsh’s nomination as preserving the central bank’s independence, countering earlier concerns sparked by President Donald Trump’s repeated comments that the next Chair would deliver additional rate cuts.

    Warsh is known for favoring a strong US Dollar during his previous tenure at the Fed, suggesting monetary conditions could remain relatively tight going forward.

    Looking ahead, investor focus will turn to the US Nonfarm Payrolls report for January, which is expected to play a key role in shaping expectations for the Federal Reserve’s future policy path.

    Silver technical analysis

    On the daily chart, XAG/USD is trading around $81.38, holding above the rising 50-day Exponential Moving Average near $79.50 and preserving the medium-term uptrend. The upward slope of the moving average continues to underpin the broader bullish bias. Meanwhile, the Relative Strength Index sits near 44, in neutral territory, reflecting a cooling in momentum after a previously overbought phase.

    As long as prices remain supported above the 50-day EMA, pullbacks are likely to attract initial buying interest around that dynamic level. However, the RSI’s position below 50 limits near-term upside, with a recovery above the midline needed to strengthen bullish momentum. If momentum stabilizes, buyers may look to extend the rebound, while a failure to regain traction could keep price action range-bound or tilt risks to the downside.

    Sources: Fxstreet

  • Australian dollar slips even as China’s RatingDog PMI shows improvement

    The Australian Dollar softened even as China’s RatingDog Manufacturing PMI edged up to 50.3 in January from 50.1. Meanwhile, Australia’s TD-MI Inflation climbed 3.6% year over year, though the monthly increase eased to 0.2%, its slowest pace since August. The US Dollar could gain further support after Donald Trump nominated Kevin Warsh as Fed Chair, a move seen as signaling a more cautious stance on monetary easing.

    The Australian Dollar weakened against the US Dollar on Monday, extending losses after falling more than 1% in the prior session. The AUD/USD pair stayed under pressure despite China’s RatingDog Manufacturing PMI ticking up to 50.3 in January from 50.1 in December, in line with market expectations. While the reading signaled a modest expansion in factory activity, it marked the strongest growth since October.

    Meanwhile, Australia’s TD-MI Inflation Gauge rose to 3.6% year over year in January from 3.5% previously. On a monthly basis, inflation increased by 0.2%, easing sharply from December’s two-year high of 1% and registering its slowest pace since August.

    ANZ Job Advertisements surged 4.4% month over month in December 2025, rebounding from a revised 0.8% decline and marking the first increase since July. The rise was also the strongest monthly gain since February 2022, pointing to renewed hiring momentum toward the end of the year.

    The data come ahead of the Reserve Bank of Australia’s policy meeting on Tuesday, following the central bank’s decision to keep the cash rate unchanged at 3.6% for a third consecutive meeting in December. Policymakers are widely expected to maintain a cautious stance, as underlying inflation remains above target and labor market conditions stay relatively tight, supporting a restrictive and data-dependent policy approach.

    Meanwhile, Australia’s Consumer Price Index increased 3.8% year over year in December, up from 3.4% previously. With headline inflation still exceeding the RBA’s 2–3% target range, recent PMI and employment indicators strengthen the argument for a tighter monetary policy bias.

    US Dollar edges lower ahead of ISM Manufacturing PMI

    The US Dollar Index (DXY), which tracks the Greenback against six major currencies, is edging lower after posting gains of more than 1% in the previous session, trading near 97.10 at the time of writing. Market attention is turning to the release of the US ISM Manufacturing PMI for January later in the day.

    Despite the modest pullback, the US Dollar had recently drawn support following President Donald Trump’s nomination of Kevin Warsh as the next Federal Reserve Chair, a move markets viewed as signaling a more disciplined and cautious approach to monetary easing. The Greenback also benefited from improved risk sentiment after the US Senate reached an agreement to advance a government funding package, averting a potential shutdown, according to Politico.

    US producer-side inflation data further underpinned the Dollar, reinforcing the Federal Reserve’s restrictive policy stance. Headline PPI remained unchanged at 3.0% year over year in December, exceeding expectations for a slowdown to 2.7%. Core PPI, which excludes food and energy, accelerated to 3.3% YoY from 3.0%, defying forecasts for a decline to 2.9% and highlighting persistent upstream price pressures.

    Federal Reserve officials echoed a cautious tone on easing. St. Louis Fed President Alberto Musalem said additional rate cuts are not justified at present, describing the current 3.50%–3.75% policy rate range as broadly neutral. Atlanta Fed President Raphael Bostic also urged patience, arguing that monetary policy should remain modestly restrictive.

    In Australia, inflation and trade data pointed to continued price pressures. The RBA’s Trimmed Mean inflation rose 0.2% month over month and 3.3% year over year, while the monthly CPI jumped 1.0% in December from zero previously, exceeding forecasts of 0.7%. Export prices increased 3.2% quarter over quarter in Q4 2025, rebounding from a 0.9% decline in Q3 and marking the strongest gain in a year, while import prices climbed 0.9%, beating expectations for a fall and reversing a prior decline.

    Following the data, markets now price in more than a 70% probability of a 25-basis-point rate hike by the Reserve Bank of Australia from the current 3.6% cash rate, up from around 60% previously. Rates are fully priced at 3.85% by May and near 4.10% by September.

    Australian Dollar slides toward key confluence support near 0.6900

    The AUD/USD pair is trading near 0.6940 on Monday. Analysis of the daily chart shows the pair continuing to move higher within an ascending channel, pointing to a sustained bullish bias. The 14-day Relative Strength Index has eased from the 70 level to around 67, suggesting a cooling in bullish momentum rather than a trend reversal.

    On the upside, AUD/USD could recover toward 0.7093, its highest level since February 2023, reached on January 29. A sustained break above this level would open the door for a test of the channel’s upper boundary near 0.7190. On the downside, initial support is seen at a confluence zone around the nine-day Exponential Moving Average at 0.6927, which aligns closely with the lower boundary of the ascending channel near 0.6920.

    AUD/USD: Daily Chart

    Sources: Investing

  • Asia FX trades flat as stronger dollar weighs; yen weakens following Takaichi comments

    Most Asian currencies traded in narrow ranges on Monday, while the dollar strengthened as investors assessed U.S. President Donald Trump’s nomination for the next Federal Reserve chair.

    The Japanese yen weakened in volatile trading after remarks from Prime Minister Sanae Takaichi suggested a reduced likelihood of currency market intervention by Japanese authorities.

    Broader moves across Asian currencies were subdued as investors awaited further economic signals this week, including a policy meeting by the Reserve Bank of Australia and the release of key U.S. jobs data.

    Dollar gains after Trump taps Warsh as Fed chair nominee

    The dollar index and its futures each rose around 0.1% in Asian trading, extending last week’s gains after the greenback staged a sharp rebound from a near four-year low.

    The dollar’s advance was driven largely by U.S. President Donald Trump’s nomination of former Federal Reserve governor Kevin Warsh to succeed Jerome Powell as Fed chair.

    Warsh is broadly seen as aligned with Trump’s push for significantly lower interest rates, but is also viewed as a critic of the Fed’s asset-purchase programs—suggesting that longer-term monetary policy under his leadership may prove less dovish than markets initially expected.

    “We expect a Warsh-led Fed to favour a smaller balance sheet, limiting support for large-scale fiscal expansion,” ANZ analysts said in a note.

    The analysts added that Warsh may view labour market weakness as the greater threat to the Fed’s dual mandate of maximum employment and price stability, and would likely back additional rate cuts if confirmed in the months ahead.

    Powell’s term is set to expire in May. The current Fed chair said last week that his successor should remain independent of political pressures.

    Yen weakens after Takaichi remarks

    The Japanese yen underperformed its Asian peers on Monday, with USD/JPY climbing as much as 0.5% to trade above the 155 level.

    The currency weakened after comments from Sanae Takaichi highlighted the benefits of a softer yen during a recent campaign speech—remarks that contrasted with earlier warnings from her administration against sustained currency weakness. Takaichi later appeared to moderate her stance, noting that a weaker yen supports exporters.

    Previously, a series of comments from Japanese officials, including Takaichi, cautioning against excessive yen moves had fueled speculation of possible government intervention. That speculation helped the yen strengthen sharply in January, though it remains near levels that have triggered intervention in the past. Recent media reports have suggested Japan and the United States may be considering coordinated measures to support the currency.

    Elsewhere in Asia, currencies traded in a narrow to softer range amid a lack of near-term catalysts. The Australian dollar slipped about 0.2% against the U.S. dollar, with attention focused on Tuesday’s Reserve Bank of Australia meeting, where a 25-basis-point rate hike is widely expected.

    Expectations of a rate hike by the Reserve Bank of Australia were driven mainly by data pointing to a rebound in Australian inflation during the second half of 2025.

    The South Korean won weakened, with USD/KRW climbing about 0.5%, as heavy outflows from domestic equity markets weighed on the currency amid selloffs in major technology stocks.

    The Chinese yuan was largely unchanged, with USD/CNY flat as markets showed little response to mixed January purchasing managers’ index readings.

    The Singapore dollar edged higher, with USD/SGD slipping 0.1%, while the Taiwan dollar was steady against the greenback.

    The Indian rupee also weakened, with USD/INR rising roughly 0.2% and hovering near record levels, after investors reacted cautiously to the government’s fiscal 2027 budget, which signaled increased spending to bolster the manufacturing sector.

    Sources: Investing

  • Is a Recession Looming in the U.K.? BCA Research Offers Insight

    The U.K. economy is at risk of a “significant recession,” a scenario that could force the Bank of England into a far more aggressive easing cycle, according to BCA Research.

    In a research note, analysts led by Robert Timper said key indicators of U.K. economic growth continue to show weakness, with business sentiment and labor market data sending what they described as recession-like signals.

    They noted that although layoffs remain relatively contained for now, slowing profit growth increases the risk of deeper job cuts ahead.

    “The bottom line is that the U.K. labor market is deteriorating at a concerning pace and, in many respects, already appears recessionary,” the analysts wrote. “If incoming data fails to improve, labor market conditions could tip the U.K. economy into recession.”

    At the same time, wage growth has moderated and price pressures in the services sector have normalized, reinforcing expectations that underlying inflation will ease toward the Bank of England’s 2% target later this year.

    Against this backdrop, the BoE is expected to deliver rate cuts broadly in line with market pricing, totaling around 41 basis points this year. The central bank cut interest rates by 100 basis points in 2025.

    From an investment perspective, BCA Research said U.K. equities remain appealing despite domestic economic softness, supported by the prospect of lower borrowing costs, a weaker pound, and strong overseas revenue exposure. The firm favors U.K. stocks over Eurozone equities over the next three to six months.

    The analysts said U.K. equities remain attractively valued and have yet to show signs of being overbought.

    They added that energy markets could again provide support, noting that a potential collapse of Iran’s ruling regime could trigger what they described as a historic shock to global oil supply.

    Given the heavy weighting of oil and gas companies in major U.K. indexes, they said the broader U.K. market has historically outperformed Eurozone equities during periods of rising oil prices.

    Sources: Investing

  • Will the ECB react to the euro’s recent strength? Analysts asses

    The euro’s recent surge has brought renewed attention to the European Central Bank, though economists argue it is unlikely to prompt any near-term policy action.

    Last week, the single currency climbed to $1.20 against the U.S. dollar for the first time since mid-2021, marking an unusually swift move by historical standards. According to Capital Economics, the euro has strengthened by a similar scale over a 10-day period only a few times in the past decade, while its trade-weighted exchange rate has reached a record high.

    Even so, analysts expect the inflationary impact across the euro zone to remain modest. Capital Economics cited ECB sensitivity analysis showing that if the euro stabilizes at current levels, headline inflation next year would be roughly 0.1 percentage points lower than projected in the ECB’s December forecasts.

    While this slightly increases downside risks to inflation, the brokerage said it falls far short of the threshold that would justify foreign-exchange intervention on price-stability grounds.

    The ECB is likely to address the euro’s strength at its meeting next week, but concrete action appears improbable. Although the central bank has the authority to intervene in currency markets to prevent disorderly moves that could threaten price stability, Capital Economics noted that the euro would need to rise much further before such measures were considered. Even then, intervention through dollar purchases is viewed as highly unlikely.

    Historically, the ECB has stepped into currency markets only twice—once in late 2000 and again in March 2011—both times to support, rather than weaken, the euro. Those interventions were coordinated with other major central banks. Capital Economics added that a coordinated effort to push the euro lower now looks extremely unlikely, particularly given the U.S. administration’s preference for a weaker dollar.

    ECB officials have so far played down the recent appreciation. Vice President Luis de Guindos has previously described levels above $1.20 as “complicated,” while also calling the level itself “perfectly acceptable.” Meanwhile, Austria’s central bank governor has characterized the latest rise as “modest.”

    Capital Economics expects ECB President Christine Lagarde to reiterate that policymakers are closely monitoring exchange-rate developments, but not to actively try to talk the currency down.

    Although intervention is unlikely in the near term, prolonged euro strength could influence policy over time. Capital Economics said ECB analysis suggests that if the euro were to appreciate gradually to between $1.25 and $1.30 over the next three years, headline inflation in 2028 would be about 0.3 percentage points lower.

    Under such conditions, policymakers would be more inclined to respond through stronger verbal guidance and lower interest rates rather than direct currency market intervention.

    For now, economists say the euro’s rise largely reflects U.S. dollar weakness rather than stronger euro zone fundamentals, reducing the need for an immediate response. As a result, the ECB is expected to remain on the sidelines unless the appreciation becomes substantially larger and more persistent, according to Capital Economics.

    Sources: Investing

  • Alamos CEO says gold prices may approach $6,000 by year-end

    Gold prices climbed to a new record above $5,600 an ounce this week, as persistent economic and geopolitical uncertainty continued to push investors toward traditional safe-haven assets.

    The metal is up more than 17% so far this year, building on last year’s strong advance. Gold’s sustained rally has been driven by a combination of heightened global uncertainty, expectations of lower U.S. interest rates, and consistent purchases by central banks as part of a broader move to diversify away from the U.S. dollar.

    Market anxiety has intensified in recent days after President Donald Trump said he intends to impose new tariffs on imports from South Korea, while concerns over a potential partial U.S. government shutdown re-emerged ahead of the January 30 funding deadline.

    Following bullion’s surge to record highs, Investing.com spoke with John McCluskey, chief executive of Canadian miner Alamos Gold (NYSE: AGI), to explore the factors behind the rally and his outlook for gold prices over the rest of the year.

    To what extent is today’s gold price driven by long-term structural demand, as opposed to short-term momentum and fear of missing out (FOMO)?

    McCluskey noted that gold prices are currently strongly underpinned by sustained central bank purchases from at least six countries, including China, Russia, and their trading partners. This long-term structural demand has steadily pushed gold higher over the past decade, with prices hitting a new peak above $5,000 this week.

    That rise has increasingly drawn in retail investors. According to fund managers, gold funds are experiencing record inflows, which is boosting both bullion prices and gold equities. Overall, structural demand remains the primary driver of current prices, but it has now spilled over into momentum-driven buying from retail investors.

    How much does gold’s outlook hinge on additional U.S. interest rate cuts, and what would be the impact if the easing cycle ends earlier than markets anticipate?

    “While U.S. Fed rate cuts may play a role, I don’t think gold’s outlook hinges on further easing, as prices have been—and continue to be—strongly supported by central bank buying. This trend has been in place for around a decade, and I believe there is still plenty of upside, with or without rate cuts,” McCluskey said.

    Would a potential easing of global geopolitical tensions be sufficient to trigger a significant pullback in gold prices?

    “While de-escalation could weigh on gold prices, there are numerous other tailwinds supporting the market, and I don’t see those trends fading anytime soon,” McCluskey told Investing.com.

    “I expect gold prices to continue rising. And it’s not just gold mining CEOs saying this—chief executives at major banks are also pointing to a stronger gold outlook,” he added.

    What is your outlook for gold prices by year-end?

    I believe the fundamental drivers supporting gold remain firmly in place, pointing to a sustained bull market. With retail investors only now beginning to participate, gold could consolidate around the current $5,000 level and potentially move toward analysts’ year-end targets in the $5,400–$6,000 range.

    Despite hitting record highs earlier in the week, precious and industrial metals retreated on Friday, as gold, silver, and copper declined amid profit-taking. The pullback followed a reassessment of expectations for aggressive U.S. interest rate cuts, alongside a stronger dollar.

    Spot gold slid more than 6% to $5,042 by 10:55 ET (15:55 GMT).

    The dollar gained after President Donald Trump announced former Federal Reserve Governor Kevin Warsh as his choice to lead the central bank, boosting the greenback against major currencies.

    Sources: Investing

  • EUR/USD falls as Warsh Fed nomination and strong US PPI fuel Dollar rally

    • EUR/USD drops 0.75% as Kevin Warsh’s Fed nomination lifts US yields and fuels Dollar demand.
    • Hot US producer inflation reinforces expectations for a steady Fed, pushing Treasury yields above 4.25%.
    • Solid German and Eurozone GDP figures fail to counter Dollar strength driven by policy repricing.

    EUR/USD slid 0.75% in the North American session as broad US Dollar strength followed Trump’s mildly hawkish Fed nominee and an inflation report supporting a steady-rate stance. The pair was trading at 1.1882 at the time of writing, down from a session high of 1.1974.

    Euro sinks below 1.19 as hawkish Fed leadership signals and sticky inflation crush rate-cut hopes

    Kevin Warsh has been named by President Trump as the next Chair of the Federal Reserve, confirming rumors that surfaced late Thursday. Financial markets reacted swiftly, sending precious metals sharply lower while the US Dollar climbed nearly 1%, as measured by the US Dollar Index (DXY), which tracks the greenback against six major peers. The DXY is on course to close above the 97.00 mark.

    US Treasury yields also advanced, with the 10-year yield rising toward 4.25%. Meanwhile, US producer-side inflation edged higher, moving further away from the Federal Reserve’s 2% target and reinforcing the case for keeping interest rates unchanged. In addition to the December Producer Price Index (PPI) release, comments from Federal Reserve officials remained in focus.

    Separately, breaking news reported that the US Senate reached an agreement to pass a government funding package later tonight, averting a potential shutdown, according to Politico.

    Rising Treasury yields suggest investors see reduced odds that Warsh would pursue aggressive rate cuts to appease the White House. At the time of writing, the US 10-year Treasury yield was up around 1.5 basis points at 4.247%.

    In Europe, Germany’s economy expanded by 0.4% year-on-year, beating expectations. However, stronger-than-forecast GDP readings for Germany and the Eurozone, along with an uptick in German inflation, failed to offer meaningful support to EUR/USD.

    Looking ahead, the US economic calendar will feature a batch of labor market data, speeches from Fed officials, and January ISM Manufacturing and Services PMIs. In Europe, HCOB flash PMIs for the Eurozone, Germany, and France, alongside the European Central Bank’s monetary policy meeting, could inject volatility into EUR/USD.

    Daily market movers: Dollar comeback sends Euro tumbling

    St. Louis Fed President Alberto Musalem said there is no need for further rate cuts at present, noting that the current 3.50%–3.75% policy range is broadly neutral. He added that easing would only be warranted if the labor market weakens significantly or inflation falls materially.

    Fed Governor Stephen Miran backed Kevin Warsh as a strong candidate for Fed Chair, attributing the recent rise in producer prices largely to housing costs and portfolio management fees. Meanwhile, Fed Governor Christopher Waller said the labor market remains soft despite steady growth, arguing inflation would be closer to 2% without tariffs, which he said are keeping price growth near 3%. Waller added that policy should be closer to neutral, around 3%.

    Atlanta Fed President Raphael Bostic called for patience, stressing that interest rates should remain somewhat restrictive. He warned that the full inflationary impact of tariffs has yet to be felt and expects price pressures to persist.

    US producer inflation data reinforced the cautious tone. The Producer Price Index (PPI) held steady at 3.0% YoY in December, missing expectations for a slowdown to 2.7%. Core PPI accelerated to 3.3% YoY from 3.0%, defying forecasts for a decline and highlighting ongoing upstream price pressures.

    In Europe, EU GDP grew 1.4% YoY in Q4, unchanged from Q3 but above expectations. Germany’s economy expanded 0.4% YoY, beating forecasts and improving from the prior quarter. German inflation, measured by the HICP, edged up to 2.1% in January from 2.0%, remaining within the ECB’s target range.

    Technical outlook: EUR/USD uptrend under threat after break below 1.1850

    The EUR/USD technical outlook suggests the uptrend is under threat after the pair failed to sustain gains above the 2025 high at 1.1918, accelerating the decline below 1.1850. The Relative Strength Index (RSI) has turned mildly bearish, indicating a shift in momentum that could open the door to further downside.

    On the downside, initial support is seen at 1.1800. A decisive break below this level could expose the 20-day simple moving average (SMA) at 1.1743.

    On the upside, immediate resistance stands at 1.1900. A move back above this level would bring 1.1950 into focus, followed by the yearly high at 1.2082.

    EUR/USD Daily Chart

    Sources: Fxstreet

  • Looking ahead to the week ahead: Warsh takes center stage alongside central banks

    The US Federal Reserve experienced an eventful week. On Monday, it contacted New York–based banks to assess their USD/JPY exposure, sparking speculation that Washington could be coordinating with Japan to address the Japanese Yen’s weakness. This development prompted a sharp sell-off in the US Dollar early in the week.

    The Fed’s midweek policy meeting resulted in no change to the federal funds rate, which was kept within the 3.50%–3.75% range, in line with expectations. During his press conference, Chair Jerome Powell avoided questions related to politics, his tenure, and the subpoena. However, he pointed to improving economic momentum and reduced risks to both inflation and the labor market.

    The US Dollar Index (DXY) has since rebounded toward the 96.90 level, recovering most of its weekly losses after President Donald Trump nominated former Fed Governor Kevin Warsh as the next Fed Chair on Friday. The nomination now awaits Senate approval. Looking ahead, the US is set to release several key data points next week, including the ISM Manufacturing PMI for January, MBA mortgage applications, Challenger job cuts, and weekly initial jobless claims.

    EUR/USD is hovering around the 1.1880 area after the US Dollar rebounded and recovered nearly all of its weekly losses. In the coming week, Hamburg Commercial Bank (HCOB) will release Manufacturing, Services, and Composite PMIs for both Germany and the Eurozone. Additional Eurozone data include the ECB Bank Lending Survey and December Producer Price Index (PPI), while Germany will publish December Factory Orders and Industrial Production figures.

    GBP/USD is trading near 1.3600 ahead of the Bank of England’s monetary policy announcement on Thursday. Governor Andrew Bailey’s subsequent press conference is expected to shed further light on the central bank’s outlook for interest rates. UK data releases include the final January S&P Global PMIs and the Halifax House Price Index.

    USD/JPY is holding close to the 154.50 level, paring earlier gains after Tokyo CPI data indicated easing inflation in January. Headline inflation slowed to 1.5% year-over-year from 2% in December, while core measures eased to 2%, undershooting forecasts. The softer inflation profile reduces pressure on the Bank of Japan to tighten policy.

    USD/CAD is trading around 1.3580, with the Canadian Dollar maintaining a slight edge against the greenback despite data showing economic stagnation in November. Monthly GDP was flat following a 0.3% contraction in the prior month and fell short of expectations for modest growth. Upcoming Canadian releases include January S&P Global PMIs and the Ivey PMI.

    Gold is trading near the $4,880 area after surrendering all weekly gains. Prices retreated from a record high of $5,598 as profit-taking emerged and the US Dollar strengthened sharply.

    Looking ahead: Emerging views on the economic outlook

    Scheduled central bank speakers for the week:

    Monday, February 2:
    – Bank of England’s Breeden
    – Federal Reserve’s Bostic

    Tuesday, February 3:
    – Federal Reserve’s Barkin

    Wednesday, February 4:
    – Federal Reserve’s Cook

    Thursday, February 5:
    – Bank of England Governor Andrew Bailey
    – Federal Reserve’s Bostic
    – Bank of Canada Governor Tiff Macklem

    Friday, February 6:
    – European Central Bank’s Cipollone
    – European Central Bank’s Kocher
    – Bank of England’s Pill
    – Federal Reserve’s Jefferson

    Central bank meetings and upcoming data set to influence monetary policy decisions

    Key economic data and policy events for the week:

    Monday, February 2:
    – Germany’s December Retail Sales
    – US ISM Manufacturing PMI

    Tuesday, February 3:
    – Reserve Bank of Australia monetary policy decision
    – US December JOLTS job openings

    Wednesday, February 4:
    – Eurozone January Harmonized Index of Consumer Prices (HICP)
    – US January ADP employment report

    Thursday, February 5:
    – Australia’s December trade balance
    – Eurozone December retail sales
    – Bank of England monetary policy decision
    – European Central Bank monetary policy decision

    Friday, February 6:
    – Canada’s January employment change
    – US January nonfarm payrolls
    – US February Michigan consumer sentiment

    Sources: Fxstreet

  • Forex Today: US Dollar surges, Gold tumbles amid focus on Trump’s Fed Chair choice

    Here is what you need to know on Friday, January 30:

    Markets were driven early Friday by the latest political and geopolitical developments linked to US President Donald Trump, as investors focused on the announcement of his pick for Federal Reserve Chair. Bloomberg reported that the Trump administration is preparing to nominate former Fed Governor Kevin Warsh for the role as early as Friday morning in the US.

    At the same time, the Wall Street Journal noted that President Trump and Senate Democrats have reached an agreement to avoid a government shutdown.

    Together with profit-taking and the Federal Reserve’s recent decision to keep interest rates unchanged, these developments helped revive demand for the US Dollar (USD), pushing it up from four-year lows against its major counterparts.

    Despite the rebound, the US Dollar remains on course for a second consecutive weekly decline, weighed down by concerns over President Trump’s unpredictable foreign policy stance and repeated challenges to the Federal Reserve’s independence.

    On Thursday, Trump threatened to levy a 50% tariff on all aircraft exported from Canada to the United States, accusing Ottawa of unfairly restricting the certification of Gulfstream business jets.

    Reuters also reported that Trump plans to hold talks with Iran, even as the Pentagon readies for potential military action and the US steps up its naval presence in the Middle East.

    In addition, the White House confirmed that Trump signed an executive order authorizing tariffs on countries that supply oil to Cuba.

    Looking ahead, market attention remains firmly on Trump’s nomination of the next Fed Chair, along with the upcoming US Producer Price Index (PPI) release, which could shape the Dollar’s next move.

    Before that, preliminary fourth-quarter 2025 GDP data from Germany and the Eurozone are expected to draw investor interest.

    In G10 currencies, AUD/USD remains under heavy pressure below the 0.7000 mark amid profit-taking ahead of a likely Reserve Bank of Australia (RBA) rate hike next week. USD/JPY hovers near 154.00, with the Japanese Yen staying weak after softer Tokyo CPI data reduced expectations for an early Bank of Japan (BoJ) rate increase.

    EUR/USD pares losses to reclaim the 1.1900 level, though downside risks persist ahead of key German and Eurozone GDP releases. GBP/USD continues to consolidate around 1.3750, weighed down by the ongoing recovery in the US Dollar.

    In commodities, Gold slides nearly 4% to trade around $5,200 in early European hours after briefly testing the $5,100 level during the Asian session. Meanwhile, WTI crude oil extends its retreat from five-month highs near $66.25, trading close to $64 as Trump signals openness to talks with Iran.

    Sources: Fxstreet

  • When will the German and Eurozone Q4 GDP figures be released, and what impact could they have on EUR/USD?

    Overview of German and Eurozone Q4 GDP

    Germany’s Federal Statistics Office will publish preliminary fourth-quarter GDP figures at 09:00 GMT on Friday, followed by Eurostat’s release of flash Eurozone GDP data at 10:00 GMT for the same period.

    Germany’s economy is expected to expand by 0.2% quarter-over-quarter in Q4, rebounding from stagnation in the previous quarter, while annual growth is forecast to remain unchanged at 0.3%. At the Eurozone level, seasonally adjusted GDP is projected to grow by 0.2% QoQ in the fourth quarter, down from 0.3% previously, with year-over-year growth seen moderating to 1.2% from 1.4%.

    How might Germany and the Eurozone’s Q4 GDP data influence the EUR/USD exchange rate?

    The EUR/USD pair may face downside pressure if Germany and Eurozone GDP figures come in line with forecasts. Investors will also closely monitor December unemployment data from both regions, as well as Germany’s Consumer Price Index (CPI for January).

    ECB policymaker Martin Kocher cautioned that additional strength in the Euro could lead the central bank to restart interest-rate cuts. After his remarks, market expectations for a summer rate reduction edged higher, with the implied probability of a July cut increasing to roughly 25% from around 15%. The ECB is set to meet next week and is broadly expected to leave interest rates unchanged.

    Meanwhile, EUR/USD is under strain as the US Dollar gains traction amid speculation that US President Donald Trump may nominate former Federal Reserve Governor Kevin Warsh as the next Fed Chair. Trump indicated late Thursday that he would reveal his decision on Friday morning, with markets leaning toward Warsh, who is perceived as relatively hawkish.

    From a technical perspective, EUR/USD is hovering near 1.1920 at the time of writing. Daily chart analysis continues to point to a bullish bias, with the pair holding within an ascending channel. A move toward the upper channel boundary near 1.2050 is possible, followed by 1.2082, the highest level since June 2021. On the downside, initial support is seen at the nine-day Exponential Moving Average (EMA) around 1.1870, with further support near the lower boundary of the channel at approximately 1.1840.

    Sources: Fxstreet

  • Rising Japanese yields pose growing risks for global bond markets

    This may be the single most important chart in global bond markets right now.

    Japanese investors rank among the world’s largest exporters of capital. Collectively, they hold a substantial share of European sovereign debt and U.S. Treasuries, with ownership running into the trillions of dollars. However, the economics underpinning these investments may soon begin to break down.

    If that happens, Japan could see a meaningful repatriation of capital—away from foreign bond markets and back into domestic fixed-income assets.

    The consequences for both global bond yields and currency markets would be significant. To understand why, it helps to look at the basic math.

    The chart compares the 30-year Japanese government bond yield (blue) with the hedged yield on the 30-year U.S. Treasury (orange), adjusted for USD/JPY currency-hedging costs. The scenario assumes the Bank of Japan gradually lifts policy rates toward 1.75%, while the Federal Reserve cuts rates to around 3% over time.

    Note how the two yields are now converging.

    At current levels, Japanese investors gain little—if any—advantage from purchasing 30-year U.S. Treasuries on a currency-hedged basis versus simply holding long-dated Japanese government bonds at home. The picture becomes even more compelling when considering a longer-standing behavior.

    For years, Japanese investors have also allocated heavily to foreign bonds without hedging currency risk—and for a clear reason.

    The prevailing assumption was that the yen would continue to depreciate, allowing Japanese investors to benefit not only from higher foreign yields but also from favorable FX moves.

    • Earn higher yields in foreign bond markets
    • Gain additional returns from yen depreciation

    With the United States signaling its willingness to prevent further yen weakness, and Japanese bond yields having risen sharply, this long-standing equation no longer holds.

    Should Japanese investors begin to scale back capital outflows to overseas bond markets, the ripple effects across global bond yields and currency markets could be substantial.

    Sources: Alfonso Peccatiello

  • Japanese yen slips as soft Tokyo CPI adds to fiscal and political concerns

    • The Japanese yen edged lower after softer-than-expected Tokyo CPI data dampened expectations for an imminent Bank of Japan rate hike.
    • Persistent fiscal challenges and political uncertainty continued to pressure the currency, although fears of official intervention helped limit losses.
    • Meanwhile, concerns over the Federal Reserve’s independence could restrain any rebound in the U.S. dollar and cap gains in the USD/JPY pair.

    The Japanese yen (JPY) came under renewed selling pressure during Asian trading on Friday after data showed consumer inflation in Tokyo, Japan’s capital, slid sharply to a near four-year low in January. The weaker inflation reading reduces urgency for the Bank of Japan (BoJ) to move toward near-term rate hikes. In addition, concerns over Japan’s fiscal outlook, linked to Prime Minister Sanae Takaichi’s reflationary agenda, along with political uncertainty ahead of the February 8 snap election, continue to weigh on the currency. Coupled with modest U.S. dollar (USD) strength, these factors pushed USD/JPY toward the 154.00 level and the key 100-day Simple Moving Average (SMA) resistance.

    That said, expectations of coordinated intervention by U.S. and Japanese authorities to support the yen may discourage aggressive bearish positioning. At the same time, lingering trade uncertainty stemming from President Donald Trump’s tariff threats and broader geopolitical risks is tempering risk appetite, as reflected in the cautious tone across equity markets, which could help limit downside in the safe-haven JPY. Meanwhile, the USD may struggle to gain sustained traction amid expectations of further Federal Reserve rate cuts and ongoing concerns over the central bank’s independence, potentially capping further upside in USD/JPY.

    Japanese yen comes under pressure from soft Tokyo CPI, fiscal concerns and political uncertainty

    A government report released earlier on Friday showed that Tokyo’s headline Consumer Price Index (CPI) fell to 1.5% in January from 2.0% previously, marking its lowest level since February 2022. Core inflation, which strips out fresh food prices, also softened to 2.0% from 2.3% in December, while a broader measure excluding both food and energy eased to 2.4% from 2.6% the month before.

    The data signals easing demand-driven inflation pressures and diminishes the urgency for further monetary tightening by the Bank of Japan, following its December rate hike that lifted the policy rate to 0.75%, the highest level in three decades.

    Meanwhile, concerns over Japan’s fiscal outlook persist as Prime Minister Sanae Takaichi has anchored her snap election campaign on expanded stimulus measures and pledged to suspend the consumption tax on food, raising questions about fiscal sustainability.

    Adding another layer of complexity, reports of an unusual rate check by the New York Federal Reserve last Friday, following a similar move by Japan’s Ministry of Finance, have fueled speculation about potential coordinated U.S.-Japan intervention to curb yen weakness.

    On the geopolitical front, U.S. President Donald Trump announced plans on Thursday to decertify all Canada-made aircraft and threatened to impose 50% tariffs unless U.S.-built Gulfstream jets receive certification in Canada. The move marks a fresh escalation in U.S.-Canada trade tensions.

    These developments, alongside rising U.S.-Iran frictions and the prolonged Russia-Ukraine conflict, could help limit downside pressure on the safe-haven yen. The United States continues to deploy warships and fighter jets across the Middle East, while Secretary of War Pete Hegseth stated that Washington stands ready to act decisively under President Trump’s directives.

    Russia has also reiterated its invitation for Ukrainian President Volodymyr Zelensky to travel to Moscow for peace talks, although prospects for a deal remain slim amid deep divisions between the two sides.

    Meanwhile, the U.S. dollar received a modest boost amid speculation that Kevin Warsh may be appointed as the next Federal Reserve chair, lending additional support to the USD/JPY pair. President Trump is expected to announce his choice for Fed chair on Friday morning.

    Looking ahead, traders will take further cues from the release of the U.S. Producer Price Index (PPI), which, alongside comments from Federal Reserve officials, is likely to influence dollar demand and provide direction for USD/JPY into the weekend.

    USD/JPY bulls look for a sustained break above the 100-day SMA before adding new positions

    The 100-day Simple Moving Average (SMA) continues to trend higher and is currently located near 153.98, with USD/JPY trading just below this level. This keeps near-term sentiment on the heavy side, despite the broader uptrend suggested by the rising trend filter. A sustained move back above this dynamic resistance would help steady the short-term outlook.

    Momentum indicators show tentative signs of stabilization. The Moving Average Convergence Divergence (MACD) remains in negative territory, although its recent narrowing points to fading downside pressure. Meanwhile, the Relative Strength Index (RSI) stands at 37.81, below the neutral 50 mark but rebounding from oversold levels, indicating that bearish momentum is beginning to ease.

    On the upside, the 38.2% Fibonacci retracement of the 159.13–152.07 decline, located at 154.77, is likely to act as initial resistance. A daily close above this level would enhance the recovery setup and open the door to further gains as momentum improves. Conversely, failure to break above this barrier would keep rebounds limited and reinforce a cautious near-term bias.

    Sources: Fxstreet

  • EUR/USD remains on course toward 1.2000

    EUR/USD extended Monday’s positive momentum, pushing closer to the key 1.2000 level and reaching highs not seen since June 2021. The latest advance reflects continued selling pressure on the U.S. dollar, supported by a constructive risk backdrop and renewed investor focus on potential tariff-related risks stemming from the White House.

    Macro & Fundamental Overview

    EUR/USD’s bullish momentum remains firmly intact, closely mirroring persistent selling pressure on the U.S. dollar, which continues to be weighed down by concerns over trade policy, questions surrounding the Federal Reserve’s independence, and renewed shutdown risks.

    The pair extended its advance for a fourth straight session on Tuesday, edging closer to the pivotal 1.2000 level for the first time since June 2021.

    The latest leg higher reflects a further deterioration in the dollar’s outlook amid revived trade tensions and geopolitical uncertainty, all ahead of the Federal Reserve’s interest rate decision due on Wednesday.

    Meanwhile, sentiment surrounding U.S.–European Union trade relations has improved after President Donald Trump softened his rhetoric last week regarding potential tariffs tied to the Greenland dispute. Markets have interpreted this shift positively, boosting risk appetite and lending support to the euro alongside other risk-sensitive currencies.

    By contrast, the U.S. dollar continues to underperform. The Dollar Index (DXY) remains under heavy pressure, extending its decline toward the 96.00 area — levels last seen in late February 2022.

    The FED: Rates on hold, politics in focus

    The Federal Reserve delivered its widely anticipated December rate cut, but the key signal came from its messaging rather than the policy action itself. A divided vote and Chair Jerome Powell’s measured language suggested that additional easing is far from assured.

    The Fed begins its two-day policy meeting today, with markets largely expecting rates to remain unchanged when the decision is released on Wednesday.

    However, monetary policy may not be the primary focus this time. Market attention has increasingly turned to questions surrounding the Fed’s independence after reports earlier this month of a Justice Department investigation involving Chair Powell.

    Compounding the uncertainty, President Trump has indicated that an announcement on his nominee for the next Fed Chair could be imminent, keeping scrutiny on the central bank well beyond the outcome of this week’s meeting.

    ECB urges patience, not complacency

    The European Central Bank left interest rates unchanged at its December 18 meeting, adopting a more measured and patient tone that has pushed expectations for near-term rate cuts further into the future. Modest upward revisions to growth and inflation projections helped underpin this approach.

    Minutes from the meeting, released last week, showed policymakers saw little immediate need to adjust policy. With inflation hovering near target, the ECB has room to remain patient, while still retaining flexibility should risks materialize.

    Governing Council members emphasized that patience does not equate to complacency. Monetary policy is viewed as appropriately calibrated for now, but not on autopilot. Markets appear to have absorbed this message, currently pricing in just over 4 basis points of easing over the coming year.

    Positioning remains constructive, but confidence has softened

    Speculative positioning remains tilted toward the euro, although bullish conviction appears to be easing.

    CFTC data for the week ended January 20 show non-commercial net long positions declining to a seven-week low of around 111.7K contracts. At the same time, institutional participants also reduced short positions, which now stand near 155.6K contracts.

    Meanwhile, open interest slipped to approximately 881K contracts, breaking a three-week streak of increases and suggesting that market participation may be thinning alongside fading confidence.

    Key Events Ahead

    Near term: The FOMC meeting is set to keep attention firmly on the U.S. dollar, while flash inflation data from Germany and preliminary GDP readings for the euro area will dominate the regional data calendar later in the week.

    Risk: A more hawkish-than-expected outcome from the Fed could quickly tilt momentum back in favor of the dollar. In addition, a clear break below the 200-day simple moving average would increase the risk of a deeper medium-term correction.

    EUR/USD Technical Outlook

    EUR/USD continues to exhibit a firm bullish bias, trading at levels last seen in mid-2021 while gradually shifting focus toward the key 1.2000 psychological handle.

    On the downside, initial support is located at the 2026 low of 1.1576 (January 19), reinforced by the closely watched 200-day simple moving average. A more pronounced correction could open the door to the November 2025 trough at 1.1468, followed by the August base at 1.1391.

    Momentum indicators remain broadly supportive of further gains, although elevated conditions may challenge the immediate upside. The Relative Strength Index is hovering near 75, pointing to overbought territory, while an Average Directional Index reading above 26 confirms the presence of a well-established trend.

    Bottom Line

    For the time being, EUR/USD continues to be influenced primarily by U.S.-centric developments rather than euro area dynamics.

    Absent clearer signals from the Federal Reserve on the extent of potential policy easing, or a more compelling cyclical recovery in the eurozone, any additional upside is likely to unfold in a steady, incremental manner rather than marking the beginning of a decisive breakout.

    Sources: Fxstreet

  • Five key market themes to watch in the coming week

    A crucial Federal Reserve interest rate decision is set to dominate attention this week, especially after news of a criminal investigation into Chair Jerome Powell heightened concerns about the central bank’s independence. At the same time, several major technology firms are scheduled to release quarterly earnings, with investors watching closely for evidence that heavy investments in artificial intelligence are beginning to pay off. Adding to market uncertainty, President Donald Trump has issued a renewed tariff threat against Canada, keeping geopolitical risks firmly in focus.

    Fed decision ahead

    This week’s agenda is expected to be led by the Federal Reserve’s interest rate decision on Wednesday, following a two-day policy meeting focused on setting borrowing costs as the U.S. economy remains broadly resilient. While employment—previously a key driver of rate cuts in 2025—appears stable amid subdued hiring and limited layoffs, inflation has held steady but remains above the Fed’s 2% target. Some analysts caution that economic growth is becoming increasingly “K-shaped,” with stronger performance among higher-income households and corporations, while lower-income earners face rising living costs. Against this backdrop, the Fed is widely expected to leave rates unchanged at 3.5%–3.75%, with CME FedWatch indicating that the next rate cut is unlikely before June.

    Attention shifts to who could replace Powell

    January’s Federal Reserve meeting takes place amid repeated calls from President Trump for swift and aggressive rate cuts to stimulate economic growth, alongside his criticism of officials for resisting such moves. Long-standing concerns over the Fed’s political independence intensified earlier this month after the Justice Department launched a criminal investigation into Chair Jerome Powell. In an unusual public response, Powell condemned the probe, characterizing it as an attempt to pressure monetary policy in line with the White House’s preferences.

    Appointed during Trump’s first term, Powell now has only a few months remaining as Fed chair, and markets are closely watching whether tensions with the administration could influence his decision to remain on the Fed’s rate-setting board after his term ends. Adding to the uncertainty is the question of who will succeed him. Prediction markets currently favor BlackRock executive Rick Rieder as the leading contender, overtaking former Fed Governor Kevin Warsh, while Trump has suggested he has narrowed his choice to a single candidate.

    Major tech earnings in the spotlight

    The earnings calendar this week will be dominated by results from major technology companies, including Meta Platforms, Microsoft, and Apple. Driven partly by excitement over advanced artificial intelligence applications, these firms have led equity markets in recent years. Their push to secure leadership in the AI race has prompted a sharp rise in capital spending, particularly on data centers and the semiconductors required to support AI workloads. While investors have largely been willing to overlook these heavy investments, expectations for meaningful revenue returns are now rising, with analysts describing 2026 as a “prove-it” year for big tech. This wave of earnings may provide the first clues as to whether those expectations are being fulfilled.

    ASML to report

    In Europe, attention will turn to ASML, the world’s leading supplier of chipmaking equipment, which is due to report earnings on Wednesday. The Dutch group’s market capitalization crossed the $500 billion mark earlier this month after key customer TSMC announced larger-than-expected capital spending plans to meet surging demand for AI chips. This milestone has cemented ASML’s position as Europe’s most valuable company, with analysts watching closely to see whether the AI boom can further accelerate its growth. However, ASML has so far issued a cautious outlook for the year ahead, with sales projected at best to remain flat, prompting concerns that the pace of new fab construction may be trailing the rapid expansion in AI-driven demand.

    New tariff threat from Trump rattles markets

    After seemingly backing away from earlier claims that he would impose punitive tariffs on several European countries unless the United States was permitted to buy Greenland, President Trump issued a fresh trade warning over the weekend, saying he would levy a 100% tariff on Canadian imports if Ottawa were to strike a trade agreement with China. In social media posts, Trump cautioned that Prime Minister Mark Carney—who recently visited China for trade discussions and spoke in Davos about the need for smaller economies to push back against coercion by global powers—could put Canada at risk by pursuing closer ties with Beijing.

    Trump warned that China would severely damage Canada’s economy and society, stating that all Canadian goods entering the U.S. would face a 100% duty should such a deal be reached. Carney responded that Canada has no plans to seek a free trade agreement with China, stressing that Ottawa remains committed to its obligations under the USMCA and would consult both the U.S. and Mexico before pursuing any new trade arrangements. Analysts at Vital Knowledge noted that while the likelihood of the tariff threat being enacted appears low, Trump’s repeated and abrupt warnings are gradually weighing on investor sentiment.

    Sources: Investing

  • Gold shrugs off all pullback signals — a sign the next leg higher may be building

    Gold has climbed beyond $5,100, underpinned by a softer US dollar and strong, persistent structural demand. Solid technical momentum and ongoing global policy uncertainty continue to favor hard assets such as gold and silver. While the focus on potential FX intervention raises the risk of near-term profit-taking, the broader rally still shows little sign of losing steam.

    Gold surged to a fresh record of $5,100 an ounce, while silver extended its rally with another 5% jump to around $110. The latest advance has been fueled by persistent US dollar weakness, signs of yen intervention, and broader unease over fiat currencies—long a structural pillar of gold’s appeal. Ongoing global policy uncertainty is also channeling capital into hard assets.

    With such an extensive list of supportive factors, even the most bullish investors may question how long the rally can continue without at least a pause, especially given how stretched valuations have become. The temptation for profit-taking at these levels is clear. Yet prices continue to refuse to roll over, and that resilience is becoming the key narrative. Despite a fading geopolitical risk premium and last week’s tariff U-turn by Trump—which, in theory, should have dampened safe-haven demand—gold barely reacted and instead pushed even higher, underscoring the strength of the current trend.

    US dollar remains under pressure amid easing rate expectations and declining investor confidence.

    At first glance, the explanation seems simple: the US dollar has weakened, giving gold a natural boost. A softer greenback makes gold more affordable for non-US buyers, and that effect is clearly visible. However, this move goes beyond a straightforward FX translation. Gold prices have also been rising in euro and sterling terms, pointing to broader, more structural demand rather than just currency-driven gains.

    That said, dollar weakness is still playing an important role. The greenback has slid amid recent geopolitical fractures, and suspected Japanese intervention in USD/JPY has added further pressure. Markets are increasingly convinced that Japanese authorities stepped in when USD/JPY pushed beyond 159. What really caught investors’ attention were reports that the Federal Reserve was “rate-checking” banks in New York around the London close. The idea that this may have been more than unilateral action by Tokyo—potentially involving coordination with Washington—is significant, as joint Japan–US intervention would send a far stronger signal than Japan acting alone.

    Bullish momentum remains firmly intact, with strong follow-through buying and little sign of exhaustion despite overextended conditions.

    Momentum is clearly carrying much of the move. The uptrend remains firmly intact, with trend-following behavior dominating as traders continue to buy dips rather than sell into strength. As long as that pattern persists, it is difficult to make a convincing case against further near-term gains.

    From a psychological standpoint, the $5,000 threshold has now been decisively cleared. It may have seemed ambitious only a few sessions ago—much like $4,000 did not long before—but strong technical momentum, a weakening US dollar narrative, and rising anxiety in global bond markets have made these once-distant milestones appear increasingly attainable.

    That said, macro fundamentals still deserve attention. Real yields, growth expectations, and inflation dynamics have not vanished, and eventually they will reassert influence. When they do, gold may find it harder to sustain these elevated levels without a renewed or deeper systemic risk backdrop.

    Key Levels to Monitor

    For now, the bias remains to the upside. The next resistance target is near $5,182, corresponding to the 261.8% Fibonacci extension of the major October downswing, with the $5,200 psychological level just above. On the downside, multiple support zones are in focus, starting with $5,000. Other round-number levels such as $4,900 and $4,800 may also provide support, while more significant longer-term support is seen around $4,500–$4,550.

    As long as the dollar stays weak, central banks continue to be net buyers of gold, and governments openly signal a willingness to intervene in FX markets, it is difficult to identify a catalyst that would meaningfully reverse gold’s advance at this stage, aside from bouts of profit-taking.

    Sources: Fawad Razaqzada

  • Japanese yen bulls grow more cautious as fiscal concerns and political uncertainty weigh on sentiment.

    The Japanese yen finds it hard to build on recent strong gains as worries over Japan’s fiscal position persist. However, a relatively hawkish Bank of Japan stance and concerns about potential currency intervention could continue to support the yen. Meanwhile, the US dollar remains near a four-month low on expectations of Fed rate cuts, helping to limit upside in USD/JPY.

    The Japanese yen comes under modest selling pressure during Tuesday’s Asian session, pulling back further from its strongest level against the US dollar since November 2025, reached a day earlier. Sentiment toward the yen remains fragile as investors worry about Japan’s fiscal outlook, driven by Prime Minister Sanae Takaichi’s expansive spending proposals and tax cut plans. A broadly upbeat mood in equity markets, along with domestic political uncertainty ahead of the snap election scheduled for February 8, is also weighing on the safe-haven currency.

    However, downside pressure on the yen may be limited by expectations that Japanese authorities could intervene to prevent excessive weakness, especially given the Bank of Japan’s relatively hawkish stance. Meanwhile, the US dollar stays near a four-month low as markets price in two additional Federal Reserve rate cuts this year. The ongoing “Sell America” theme further dampens demand for the greenback, which should help restrain USD/JPY movements as investors turn their attention to the key two-day FOMC meeting beginning later today.

    Japanese yen bears remain cautious as intervention speculation offsets political uncertainty.

    Japan’s already stretched public finances have come under sharper scrutiny following Prime Minister Sanae Takaichi’s campaign pledge to suspend the sales tax on food items ahead of the snap lower house election on February 8. Concerns over the country’s fiscal outlook have been a major driver behind the recent jump in long-dated Japanese government bond yields, which raises debt servicing costs and, in turn, limits the Japanese yen’s upside.

    Data released earlier on Tuesday showed a slowdown in wholesale inflation, with the Producer Price Index rising 2.4% year-on-year in December, down from 2.7% in November. Additional figures indicated that the Corporate Service Price Index increased 2.6% YoY, slightly lower than the previous reading. Overall, the data offered little to challenge the Bank of Japan’s tightening trajectory and had a limited impact on the yen.

    The BoJ recently raised its economic and inflation forecasts while keeping short-term rates unchanged at the conclusion of its two-day meeting last Friday, signaling its readiness to continue gradually lifting still-low borrowing costs. This stance contrasts sharply with expectations for a more dovish US Federal Reserve, leaving the US dollar under pressure near a four-month low and lending support to the yen amid fears of possible official intervention.

    Reinforcing this view, Prime Minister Takaichi said on Sunday that authorities are prepared to take action against speculative and highly abnormal market moves, following rate checks by Japan’s Ministry of Finance and the New York Fed on Friday. Still, traders appear reluctant to take aggressive positions ahead of the two-day FOMC meeting beginning today, which is expected to be a key driver for the US dollar and the USD/JPY pair in the near term.

    USD/JPY needs to establish a sustained break below the 100-day SMA to strengthen the case for further downside.

    The USD/JPY pair showed signs of resilience below its 100-day Simple Moving Average (SMA) on Monday, although it continues to trade beneath the 154.75–154.80 horizontal support zone. The MACD histogram has moved further into negative territory, with the MACD line below the signal line, reflecting bearish momentum that remains below zero. Meanwhile, the RSI stands near 32, close to oversold territory, suggesting that the downside move may be becoming stretched.

    A daily close below the 100-day SMA at 153.81, which currently provides near-term support, would give bears greater control. In contrast, sustained trading above this level would keep the broader bias supported by the rising SMA. Signs of stabilization would include a flattening MACD histogram and a move back toward the zero line, while an RSI rebound toward 50 would improve the overall tone. On the other hand, a dip below 30 on the RSI would increase the risk of deeper losses.

    Sources: Fxstreet

  • Rate-Cut Expectations Waver as Conflicting Macro Signals Emerge

    Wednesday brings the FOMC meeting and Chair Powell’s press conference, and it wouldn’t be surprising if President Trump chose that moment—ideally around 2:30 p.m. ET—to announce his pick for the next Fed chair. Such timing would dominate headlines, catch financial media off guard, and inject maximum uncertainty into markets.

    That said, the Fed is not expected to cut rates at this meeting, which should keep the event relatively uneventful. In the bigger picture, what the Fed does between now and May may prove less important, particularly if a new chair is appointed and moves quickly toward easing.

    Markets appear to be dialing back expectations for aggressive rate cuts. Current pricing suggests the fed funds rate settles near 3.25% by December, with little additional easing beyond that. To meaningfully shift those expectations, the nominee would likely need to be notably dovish—something markets already anticipate, given the widespread assumption that Trump will select a policy-leaning accommodator.

    As a result, the risk of a breakout in the 2-year Treasury yield appears increasingly credible, with initial resistance near 3.62%. Beyond that, a move back toward the 4% level cannot be ruled out. From a technical perspective, the setup supports this view: the 2-year yield has formed multiple bottoms in recent months, and the RSI has begun to turn higher, signaling building upside momentum.

    The direction of the 2-year yield may ultimately be more closely linked to oil prices. With inflation still hovering near 3% and crude having fallen to around $60 from highs in the $120s, the message is clear: a rebound in oil prices could quickly reignite inflation pressures. That dynamic likely explains why the price action in oil and the 2-year yield charts has begun to look strikingly similar.

    The Bank of Japan once again chose to kick the can down the road, leaving rates unchanged and, in my view, offering little in the way of a clear policy roadmap. The yen’s strength on Friday appeared to be driven solely by reports of a possible “rate check” by the New York Fed on behalf of the U.S. Treasury—widely interpreted as a warning signal that currency intervention could be imminent. Perhaps the strategy is to keep markets stable until after the snap election in February. It’s hard to say, but it should be telling to see how markets react once Japan reopens on Monday.

    The Korean won also strengthened notably against the U.S. dollar on Friday. In recent weeks, there has been growing chatter that the KRW had become excessively weak, so it’s likely the currency took the developments around the yen as a warning signal and moved to reprice accordingly.

    The Korean won likely matters more than many investors realize, given the sizable exposure South Korean investors have built up in U.S. equities. That dynamic is probably one of the reasons the KRW has weakened so significantly in the first place—buying U.S. stocks requires selling won for dollars.

    If the KRW begins to strengthen from here, it could start to put pressure on that trade. For investors who are unhedged on the currency side, a stronger won increases the risk of FX-related losses on their U.S. equity holdings, potentially prompting position adjustments.

    Of course, this week also brings major earnings reports from Microsoft, Apple, Tesla, and Meta. From what I can see, all four stocks are currently sitting in positive gamma with positive delta positioning. Implied volatility typically builds into earnings because of the event risk, which sets up a familiar dynamic: unless a company delivers truly blowout results, the reaction can easily turn into a sell-the-news move. Once earnings are released, implied volatility collapses and hedges are unwound as delta decays, potentially putting pressure on the shares.

    Sources: Michael Kramer

  • Ueda Speech: BoJ Governor addresses the policy outlook following an anticipated interest rate hold

    Bank of Japan (BoJ) Governor Kazuo Ueda is speaking at a press conference, outlining the rationale for keeping the benchmark interest rate unchanged at 0.75% at the January policy meeting.

    Key takeaways from the BoJ press conference

    Japan’s economy is showing a moderate recovery and is expected to continue growing at a steady pace.

    The government’s economic stimulus package has improved the overall outlook.

    Underlying inflation is projected to rise gradually and move closer to the 2% target.

    Board members Takata and Tamura suggested revisions to the outlook report.

    The BoJ will continue to raise interest rates if economic and price projections are realized.

    Lending rates tied to the BoJ’s policy rate are already trending higher.

    Financial conditions remain accommodative despite the December rate hike.

    Foreign exchange movements are influenced by multiple factors.

    The governor refrained from commenting on specific yen levels but emphasized close monitoring of FX developments.

    Government bond yields are increasing at a rapid pace.

    The BoJ stands ready to conduct bond-buying operations flexibly in exceptional circumstances.

    Measures may be taken to support stable yield formation when necessary.

    Currency movements, particularly the yen, may be having a stronger impact on prices.

    Greater attention will be paid to foreign exchange trends going forward.

    The rise in long-term yields is partly influenced by end-of-fiscal-year factors.

    Price developments in April will be an important consideration when assessing the timing of future rate hikes.

    The section below was published at 3:35 GMT on January 23 to cover the Bank of Japan’s monetary policy announcement and the initial market reaction.

    The Bank of Japan (BoJ) board voted to keep the short-term policy rate unchanged at 0.75% at the conclusion of its two-day monetary policy meeting on Friday, a move that was widely expected.

    As a result, borrowing costs remain at their highest level in roughly three decades.

    Key takeaways from the BoJ’s policy statement

    Japan’s economy is expected to continue a moderate recovery.

    Consumer inflation is likely to pick up gradually.

    The virtuous cycle in which wage growth and inflation reinforce each other is expected to be sustained.

    The output gap is projected to improve over time and expand at a moderate pace.

    Medium- to long-term inflation expectations are seen rising gradually.

    No major imbalances are observed in Japan’s financial activity.

    The overall financial system remains stable.

    Firms’ moves to pass higher wages on to selling prices could strengthen more than previously anticipated.

    The recent increase in food prices, including rice, mainly reflects temporary supply-side factors.

    Significant uncertainty surrounds the global economic outlook, particularly due to trade policies that could push up import prices through supply-side channels.

    Trade measures announced so far may weigh on global economic growth.

    Regarding the US economy, close attention is needed on how tariffs could affect employment and income via weaker corporate profits.

    High uncertainty persists around China’s economic outlook, especially the future pace of growth.

    A sharp rise in import prices could further reinforce households’ cautious stance on spending.

    Current trade policies could lead to a shift in the long-term trend of globalisation.

    The Board raised its median real GDP growth forecast for fiscal 2025 to +0.9% from +0.7% in October.

    The fiscal 2026 median growth forecast was revised up to +1.0% from +0.7%.

    The fiscal 2027 median growth forecast was lowered to +0.8% from +1.0%.

    BoJ’s Quarterly Outlook Report: Key Highlights

    The Board kept its median core consumer price index forecast for fiscal 2025 unchanged at +2.7%, the same as in October.

    The median real GDP growth forecast for fiscal 2025 was revised up to +0.9% from +0.7% in October.

    Real interest rates remain at significantly low levels.

    Risks to the economic outlook are assessed as roughly balanced.

    The impact of foreign exchange volatility on prices has become more pronounced than in the past, as firms are more willing to raise prices and wages.

    Core consumer inflation is expected to slow to below 2% during the first half of this year.

    Companies’ efforts to pass higher wages on to selling prices could strengthen more than anticipated.

    Japan’s economy is projected to continue a moderate recovery.

    Market reaction following the BoJ policy announcements

    USD/JPY climbed further toward 158.60 in an immediate reaction to the Bank of Japan’s (BoJ) decision to keep interest rates unchanged, rising 0.11% on the day.

    The section below was published at 23:00 GMT on January 22 as a preview of the Bank of Japan’s interest rate decision.

    • The Bank of Japan is widely expected to leave interest rates unchanged at 0.75% on Friday.
    • The central bank is likely to wait and assess the effects of December’s rate hike before considering further tightening.
    • February’s general elections introduce an additional layer of uncertainty to the BoJ’s monetary policy outlook.

    The Bank of Japan (BoJ) is widely expected to keep its benchmark interest rate unchanged at 0.75% following the conclusion of its two-day monetary policy meeting next Friday.

    The Japanese central bank raised interest rates to their highest level in three decades in December and is now likely to keep policy unchanged on Friday to better evaluate the economic impact of earlier hikes.

    BoJ Governor Kazuo Ueda is expected to reaffirm the bank’s commitment to continued policy normalisation. As a result, investors will closely scrutinise his press conference for clues on the timing and extent of the next phase of the tightening cycle.

    What to anticipate from the Bank of Japan’s interest rate decision?

    The Bank of Japan is broadly expected to leave interest rates unchanged in January while signaling the possibility of further tightening if economic conditions unfold as projected.

    In December, the BoJ raised rates by 25 basis points to 0.75%, and the meeting minutes showed that some policymakers favor additional tightening, noting that real interest rates remain sharply negative once inflation is taken into account.

    Markets, however, have ruled out consecutive rate hikes, especially following Prime Minister Sanae Takaichi’s surprise call for snap elections and her proposal to suspend food and beverage taxes for two years to ease the burden on households amid rising inflation.

    While the implications of these political developments for monetary policy remain uncertain, the BoJ has emphasized a cautious, gradual normalization of policy, aiming to withdraw stimulus without undermining economic growth. As a result, the central bank is likely to wait for greater political clarity and for the effects of past rate increases to become clearer before moving again.

    Meanwhile, the yen has weakened steadily amid speculation surrounding the snap election. This raises the question of whether the currency’s depreciation will push the BoJ to adopt a firmer stance on monetary tightening.

    How might the Bank of Japan’s monetary policy decision influence the USD/JPY exchange rate?

    Markets have fully priced in a Bank of Japan rate pause on Friday, but the central bank will need to clearly signal further monetary tightening to curb the Yen’s ongoing weakness.

    Yen sellers have eased off in recent days, helped by broad US Dollar softness linked to the EU–US trade dispute following President Donald Trump’s threats over Greenland. Even so, USD/JPY is still up roughly 0.7% year to date and remains close to last week’s 18-month peak around 159.50.

    Investors are also concerned that Prime Minister Takaichi could secure stronger parliamentary backing after the elections, allowing her to push ahead with expansionary fiscal policies such as higher spending and tax cuts. This has heightened worries about Japan’s already stretched public finances, driving the Yen lower and pushing long-term government bond yields to record highs amid fears of a potential fiscal crisis.

    Meanwhile, recent remarks from BoJ Governor Ueda have reinforced the bank’s cautious tightening stance, suggesting Japan is transitioning toward a more sustainable inflation environment where wages and prices rise together. For the Yen’s recent, still-fragile rebound to continue, markets will need clearer evidence that interest rate hikes are on the horizon.

    USD/JPY 4-Hour Chart

    From a technical standpoint, FXStreet analyst Guillermo Alcalá views USD/JPY as undergoing a bearish correction, with an important support zone just above 157.40. He notes that while the pair has pulled back from recent highs, Yen buyers would need to push it below the 157.40–157.60 support area to invalidate the short-term bullish structure and open the door to a move toward the early-January lows near 156.20.

    A cautious or non-committal message from the BoJ would likely disappoint markets and weaken the Yen. In that scenario, Alcalá expects USD/JPY to climb to new long-term highs. He points out that technical signals are improving, with the 4-hour RSI rebounding from the 50 level, indicating strengthening bullish momentum. At the time of writing, the pair is challenging resistance around 158.70 (the January 16 high), which stands as the final hurdle before the 18-month peak close to 159.50.

    Sources: Fxstreet

  • UK retail sales rise 0.4% MoM in December, beating -0.1% forecast

    UK retail sales increased by 0.4% month-on-month in December, rebounding from a 0.1% decline in November, according to data released Friday by the Office for National Statistics.

    Markets had expected retail sales to fall by 0.1% during the month. Core retail sales, which exclude auto fuel, rose 0.3% month-on-month in December, reversing a revised 0.4% decline previously reported. The reading exceeded market expectations for a 0.2% fall.

    On an annual basis, UK retail sales increased 2.5% in December, up from a revised 1.8% previously and above the consensus forecast of 1.0%. Annual core retail sales also strengthened, climbing 3.1% compared with a revised 2.6% gain earlier, outperforming expectations of a 1.4% rise.

    Market response to the UK Retail Sales data

    The positive UK Retail Sales report has failed to lift the Pound Sterling, with GBP/USD down 0.06% on the day, trading at 1.3488 at the time of writing.

    The following section was published on January 23 at 5:11 GMT as a preview of the UK Retail Sales report.

    Overview of UK Retail Sales

    The UK calendar features the release of the December Retail Sales figures from the Office for National Statistics (ONS) on Friday at 07:00 GMT.

    Retail Sales are forecast to edge down by 0.1% month-on-month in December, following an identical 0.1% decline in November. On a yearly basis, sales are expected to increase by 1%, slightly higher than the previous 0.6% rise.

    Core Retail Sales, which exclude motor fuel, are also projected to slip by 0.2% MoM, in line with the prior reading, while annual growth is anticipated to improve to 1.4% from 1.2% in November.

    How might UK retail sales influence the GBP/USD exchange rate?

    The GBP/USD pair could show little reaction even if UK Retail Sales for December exceed expectations, as markets largely anticipate the Bank of England to maintain a cautious, gradual easing stance despite stronger price pressures seen in December. Attention is likely to shift instead to the preliminary January S&P Global PMI readings from both the UK and the US, scheduled for release later in the day.

    Sterling may find support if the US Dollar weakens amid rising risk aversion linked to geopolitical tensions. Earlier, US President Donald Trump threatened tariffs on European nations opposing his Greenland initiative, but later eased his stance after reaching a NATO framework agreement that opened the door to a potential deal.

    From a technical perspective, GBP/USD is holding firm after climbing more than 0.5% in the previous session, hovering near the 1.3500 level at the time of writing. The pair could aim for the three-month peak at 1.3562 as the next resistance. On the downside, initial support is seen at the nine-day EMA around 1.3451, followed by the 50-day EMA near 1.3398.

    Sources: Fxstreet

  • Inflation Poses Little Threat to the Stock Market

    Last week, we kicked off a broad review of the key macro forces shaping the stock market, focusing on the health of the economy and earnings expectations. The takeaway was clear: the economy appears to be in solid shape, and consensus forecasts for earnings growth this year are not just positive, but notably strong.

    Admittedly, there has been no shortage of headlines and market volatility since then. It would be reasonable to dive into geopolitical developments, market breadth, or the current state of the AI trade. However, at least for now, none of these factors have altered the market’s primary trend. With that in mind, it makes sense to continue our top-down assessment of the major macro drivers.

    Having already examined the economy and earnings, the remaining areas to address are inflation, Federal Reserve policy and interest rates, and market valuations. Let’s turn to those next.

    What Is Inflation?

    The Federal Reserve defines inflation as a sustained rise in the prices of goods and services over time, reflecting a general increase in the overall price level across the economy. Similarly, Investopedia and standard economics textbooks describe inflation as a gradual erosion of purchasing power, manifested through a broad-based increase in the prices of goods and services over time. The International Monetary Fund frames inflation as the pace at which prices rise over a given period, indicating how much more costly a representative basket of goods and services has become.

    Or, as I was taught in my very first economics class many years ago, inflation can be summed up as “too much money chasing too few goods.”

    In Focus

    There is little doubt that inflation has dominated the attention of the Federal Reserve, policymakers, consumers, and financial markets for several years. Unless one has been completely disconnected from events, it is well known that inflation surged in the aftermath of the COVID crisis, driven by trillions of dollars in government stimulus flowing into household bank accounts and severe disruptions across global supply chains.

    This surge fueled fears that the United States was heading back toward the inflationary turmoil of the 1970s—a period the Fed ultimately subdued, but only at significant cost to the economy. With the Consumer Price Index approaching double-digit territory in early 2022, such concerns were understandable.

    As the pandemic faded and supply chains normalized, inflationary pressures also began to ease. By early 2024, CPI readings had fallen back near pre-pandemic levels, when face coverings were not yet a cultural norm. The key question now is whether the inflation spike has been fully brought under control.

    While corporate pricing strategies and consumer behavior—both central drivers of inflation—are inherently difficult to forecast, it remains possible to analyze the components of the CPI and examine the historical forces that have shaped inflation trends.

    A Framework for Understanding Inflation

    Unsurprisingly, the team at Ned Davis Research Group has already taken this step. In short, there is indeed a model that addresses this—shown below.

    The upper chart shows the Consumer Price Index, which represents the inflation rate, while the lower chart displays NDR’s Inflation Timing Model. Reading the model is fairly intuitive. When the blue line rises above zero, it signals that inflation pressures are likely increasing. Historically, readings above 10 have coincided with periods when inflation was significantly above normal levels.

    The red box highlights the CPI period from late 2020 through early 2022. During that phase, the model effectively flagged the acceleration in inflation and warned that conditions were set to deteriorate. The model also performed well in the opposite direction in the fall of 2022. While widespread concern about inflation persisted, the model correctly indicated that inflation was poised to ease—and it did.

    That downtrend continued until late 2024 or early 2025, when the model briefly suggested inflation was no longer moving in the right direction. However, the signal proved temporary, as the model dropped back below the zero line by the end of 2025. Encouragingly, recent data has validated the model’s current reading, with price pressures generally moderating and the inflation rate falling back below 3%.

    Is 3% Becoming the New Inflation Norm?

    Inflation skeptics are quick to push back against my relatively calm view, pointing out that inflation remains well above the Federal Reserve’s stated 2% target. From that perspective, they argue the Fed is unlikely to turn accommodative anytime soon. While this logic is understandable, it overlooks two important points: first, the Fed operates under a dual mandate, and second, its preferred inflation gauge—core PCE—differs from the inflation measures most often highlighted in the media.

    Crucially, inflation is not the Fed’s sole concern. Maintaining a healthy labor market is equally central to its mission. As a result, the Federal Open Market Committee must carefully balance inflation pressures against broader economic conditions.

    This helps explain why the Fed has been cutting interest rates even as inflation remains above target. The labor market has shown signs of weakening, prompting policymakers to act. Equity bulls have welcomed these moves, mindful of the long-standing adage that it rarely pays to fight the Fed. With rates coming down, investors have largely aligned with the bullish camp.

    That said, it’s important to recognize that the Fed is not engaged in an aggressive stimulus campaign. Chair Jerome Powell and his colleagues are not attempting to jump-start the economy. Instead, they are seeking to bring interest rates back toward a more neutral, “normal” level—one that balances inflation with labor market stability.

    In this context, the prevailing view is that the Fed is willing to tolerate inflation running somewhat above its 2% target while it works to shore up employment conditions. From that standpoint, an inflation rate around 3% may be acceptable—for the time being.

    In Summary

    The encouraging takeaway is that history suggests a modest amount of inflation can actually be beneficial—supporting stock prices, home values, and corporate earnings. From that perspective, inflation does not appear to be a headwind for equities at present. While this may not be a classic “don’t fight the Fed” environment, the central bank is also not acting as an adversary. As a result, my view is that investors can remain on the bullish path—for now.

    Sources: David Moenning

  • AUD gains after employment figures reinforce expectations of tighter RBA policy

    The Australian dollar moved higher after stronger-than-expected employment data reinforced expectations of a tighter policy stance from the Reserve Bank of Australia. Seasonally adjusted employment in Australia increased by 65.2K in December, while the unemployment rate declined to 4.1%. Meanwhile, the U.S. dollar firmed after Bloomberg reported that President Trump would pause tariffs on European countries opposing his push over Greenland.

    The Australian dollar strengthened against the U.S. dollar on Thursday after seasonally adjusted employment data from Australia reinforced expectations of a tighter monetary policy stance by the Reserve Bank of Australia. Data from the Australian Bureau of Statistics showed employment rose by 65.2K in December, reversing a revised loss of 28.7K jobs in November and well above the market forecast of a 30K increase. Meanwhile, the unemployment rate fell to 4.1% from 4.3%, beating expectations of 4.4%.

    Sean Crick, head of labour statistics at the ABS, noted that a rise in employment among people aged 15–24 helped lift overall employment levels and contributed to the drop in the unemployment rate. Meanwhile, the International Monetary Fund has called on the RBA to proceed cautiously, pointing out that inflation has remained above the Bank’s 2%–3% target range for an extended period, despite headline CPI easing faster than expected in November.

    U.S. dollar rises as Trump eases tariff threats against Europe

    The U.S. Dollar Index (DXY), which tracks the greenback against six major currencies, was steady after posting modest gains in the previous session, trading around 98.80 at the time of writing. The dollar found support after Bloomberg reported on Wednesday that President Donald Trump said he would step back from imposing tariffs on goods from European countries opposing his bid to take control of Greenland. Earlier, Trump had insisted there was “no going back” on his ambitions for Greenland and had threatened to impose new 10% tariffs on eight European Union nations.

    Trump also stated that the United States and NATO had “established the framework of a future deal on Greenland,” though he provided no details, leaving the scope and substance of the proposed agreement unclear.

    U.S. labor market data has pushed expectations for further Federal Reserve rate cuts back to June, with Fed officials signaling little urgency to ease policy until there is clearer evidence that inflation is moving sustainably toward the 2% target. Morgan Stanley analysts revised their 2026 outlook, now projecting one rate cut in June and another in September, compared with their earlier expectations for cuts in January and April.

    In Asia, the People’s Bank of China announced on Tuesday that it would keep its Loan Prime Rates unchanged, with the one-year and five-year LPRs remaining at 3.00% and 3.50%, respectively. Developments in China remain important for the Australian dollar, given the close trade relationship between the two economies.

    China’s industrial production grew 5.2% year-on-year in December, accelerating from 4.8% in November, supported by resilient export-led manufacturing. However, retail sales increased just 0.9% year-on-year, falling short of expectations of 1.2% and slowing from November’s 1.3%.

    In Australia, the TD-MI Inflation Gauge rose to 3.5% year-on-year in December from 3.2%, while monthly inflation jumped 1.0%, the fastest pace since December 2023 and a sharp acceleration from 0.3% in the previous two months.

    RBA policymakers acknowledged that inflation has eased significantly from its 2022 peak, but recent data points to renewed upward pressure. Headline CPI slowed to 3.4% year-on-year in November, the lowest level since August, yet remains above the RBA’s 2–3% target range. Trimmed mean CPI edged down to 3.2% from 3.3% in October.

    The RBA assessed that inflation risks have modestly tilted to the upside, while downside risks—particularly from global factors—have eased. Policymakers expect only one additional rate cut this year, with underlying inflation projected to stay above 3% in the near term before easing toward around 2.6% by 2027.

    Australian dollar tests the 0.6800 level near the top of its ascending channel

    AUD/USD was trading near 0.6790 on Thursday. Daily chart signals show the pair continuing to climb within an ascending channel, reflecting a sustained bullish bias. The nine-day exponential moving average remains above the 50-day EMA, with prices holding above both indicators, reinforcing the positive momentum and keeping upside pressure intact. Meanwhile, the 14-day Relative Strength Index stands at 69.93, close to overbought territory, suggesting momentum is becoming stretched.

    The pair is currently challenging immediate resistance at the psychological 0.6800 level, followed by the upper boundary of the ascending channel near 0.6810. A decisive break above the channel could open the door to 0.6942, marking the highest level since February 2023.

    On the downside, initial support is seen at the nine-day EMA around 0.6732. A move below this short-term support would undermine bullish momentum, bringing the lower boundary of the ascending channel near 0.6680 into focus, ahead of the 50-day EMA at 0.6656.

    AUD/USD: Daily Chart

    Sources: Fxstreet

  • UK CPI seen edging higher in December

    The UK’s Office for National Statistics (ONS) is set to release December CPI data on Wednesday. Headline inflation is expected to edge up to 3.3%, while core inflation is projected to remain sticky above 3.0% year-on-year.

    The UK Office for National Statistics (ONS) is scheduled to publish December Consumer Price Index (CPI) data at 07:00 GMT on Wednesday, a release closely watched by financial markets. Economists anticipate a mild pickup in inflationary pressures.

    UK inflation remains a key consideration for the Bank of England (BoE) and is typically a significant driver of Sterling movements. With the Monetary Policy Committee (MPC) due to meet on February 5, markets largely expect policymakers to leave the bank rate unchanged at 3.75%, though this week’s inflation figures are likely to influence the guidance and tone of the decision.

    What might the upcoming UK inflation report reveal?

    Headline UK CPI is projected to tick up to 3.3% year-on-year in December, compared with 3.2% in November. On a monthly basis, inflation is expected to rebound by 0.4%, reversing the 0.2% month-on-month decline seen previously.

    Meanwhile, core inflation—which excludes volatile food and energy prices and is more closely monitored by the Bank of England—is anticipated to remain steady at 3.2% annually. Month-on-month, core CPI is forecast to rise by 0.3% after falling 0.2% in November.

    What impact will the UK CPI data have on GBP/USD?

    In December, the Bank of England’s Monetary Policy Committee narrowly voted 5–4 to reduce the bank rate by 25 basis points to 3.75%, marking its fourth cut in 2025. Although policymakers pointed to easing inflation pressures and initial signs of a softening labour market, they emphasised that any additional policy loosening would proceed cautiously.

    The December Decision Maker Panel (DMP) survey largely reinforced this outlook and failed to alter expectations around the policy path. Persistent wage pressures continue to constrain the potential for significant repricing at the short end of the yield curve.

    One-year-ahead wage growth expectations rose slightly to 3.7% from 3.6%, while actual pay growth over the past year remains in the mid-4% range. Both indicators remain well above levels consistent with a sustained return of inflation to the BoE’s target.

    Overall, the survey does little to shift sentiment and supports the argument against accelerating rate cuts. Markets currently price in just over 42 basis points of easing for the year, with the BoE widely expected to keep rates unchanged at its next meeting.

    From a technical perspective, Pablo Piovano highlights that GBP/USD is facing resistance near its yearly lows around 1.3340, recorded on January 19. A further decline could open the door to the 55-day simple moving average at 1.3309, followed by the December low at 1.3179. Conversely, if buyers regain control, the year-to-date high at 1.3567 may act as the first upside hurdle, with little resistance beyond that until the September 2025 peak at 1.3726.

    Piovano also notes that momentum indicators remain supportive, with the Relative Strength Index rebounding to around 54 and the Average Directional Index near 20, pointing to a reasonably firm underlying trend.

    Sources: Fxstreet

  • Week Ahead: GDP and PCE inflation take center stage before next Fed meeting

    This is shaping up to be a highly unpredictable week for U.S. and global markets, with numerous wildcard risks—largely tied to developments from the White House.

    Investors will be closely watching for any developments related to the Justice Department’s investigation into Federal Reserve Chair Jerome Powell. Attention will also turn to the Supreme Court on Wednesday, when it hears arguments concerning President Trump’s attempt to remove Fed Governor Lisa Cook.

    Trade policy remains a major wildcard, with tariff headlines likely to emerge rapidly after Trump threatened over the weekend to impose a new 10% levy on imports from eight European countries opposing his push on Greenland. The Supreme Court could also rule this week on the legality of Trump’s tariffs. Meanwhile, fresh rhetoric around Iran, renewed intrigue involving Venezuela, or actions targeting other geopolitical flashpoints could further unsettle markets.

    In Japan, the Bank of Japan is widely expected to keep interest rates unchanged on Friday. However, a weakening yen has revived speculation about possible intervention, leaving the future of the massive yen carry trade hanging in the balance. In China, fourth-quarter GDP growth slowed amid the ongoing property downturn, potentially prompting a policy response.

    All of this sets the stage for a busy week in Davos, where global leaders and policymakers are gathering, with President Trump scheduled to address the forum.

    In the United States, a slate of economic data will keep both investors and Federal Reserve officials engaged during the holiday-shortened week. A revision to third-quarter GDP could clarify whether the initially reported 4.3% growth overstated the economy’s strength or accurately reflected underlying momentum.

    Below are the key data releases this week that are most likely to shape the FOMC’s outlook ahead of its January 27–28 policy meeting.

    GDP Update: Growth Momentum in Focus

    Overall data indicate the economy stayed resilient through the final three quarters of 2025. Despite a notable slowdown in employment growth, household demand exceeded expectations, while AI-related capital investment surged. Although a modest upward or downward revision to Q3 real GDP (Thursday) is possible, Q4 real GDP is currently tracking at a strong 5.3% annualized pace (see chart).

    Personal income, consumption, and saving

    Personal income data for October and November (Thu) may reinforce the view that real disposable income growth has stalled. This likely reflects demographic effects, as retiring Baby Boomers exit the labor force and no longer generate wage income. If consumer spending remains resilient, it would suggest households—particularly retirees—are increasingly drawing on retirement savings.

    The personal saving rate (Thu) is likely to continue declining under our framework, particularly if household net worth keeps rising to record levels relative to disposable income (chart).

    PCE inflation

    The Bureau of Economic Analysis will calculate October PCE inflation (Thu) using the average of September and November CPI data. Meanwhile, the Cleveland Fed’s Inflation Nowcasting model projects headline and core PCE inflation at 2.65% y/y and 2.70% in November (chart).

    Unemployment claims

    Initial jobless claims (Thu) have declined in recent weeks, indicating that January’s unemployment rate likely edged lower from December’s 4.4% (chart).

    Sources: Yardeni

  • Asia FX little changed; dollar under pressure from Greenland tariff fears

    Most Asian currencies traded within narrow ranges on Tuesday, while the U.S. dollar weakened as President Donald Trump’s renewed demands over Greenland dampened appetite for U.S. assets.

    Regional markets showed little response to China’s decision to keep a key lending rate unchanged, as expected, while the Japanese yen was steady after Prime Minister Sanae Takaichi called a snap election for early February.

    A U.S. market holiday on Monday limited overnight signals, leaving Asian markets broadly risk-averse after President Trump announced tariffs on Europe over Greenland over the weekend.

    Japanese yen little changed ahead of snap vote and BOJ meeting

    The Japanese yen weakened slightly on Tuesday, with USD/JPY slipping 0.1%, though the pair remained near recent highs amid a lack of strong supportive signals for the currency. Prime Minister Sanae Takaichi said on Monday that she will dissolve Japan’s lower house this week and call a snap election for February 8.

    With Takaichi enjoying solid approval ratings, the early election is expected to strengthen her mandate for additional fiscal stimulus. However, markets questioned the scope for further government spending, as Japanese government bonds extended their selloff, which in turn pressured the yen.

    The election announcement also comes ahead of a Bank of Japan policy meeting on Friday, with investors divided over whether the central bank has sufficient momentum to raise interest rates again.

    The central bank raised interest rates at its final meeting of 2025 and signaled that further hikes would be driven by sustained gains in inflation and wages. However, the BOJ may pause before tightening again until it gains clearer insight into Japan’s spring wage negotiations, scheduled for March–April.

    Dollar under pressure as Trump–Greenland tensions persist

    The dollar index and its futures slipped about 0.1% in Asian trading, as the greenback faced pressure from growing caution toward U.S. assets amid President Trump’s push to acquire Greenland.

    European leaders largely rejected Trump’s tariff threats and reiterated that Greenland should remain part of the Kingdom of Denmark. Trump on Monday renewed his demands for the island and declined to rule out the use of military force.

    The U.S. president is now set to attend the World Economic Forum in Davos, Switzerland, where he may hold discussions with European leaders on the Greenland issue. Asian currencies remained mostly subdued amid broader risk aversion linked to Trump’s Greenland stance.

    The Chinese yuan saw USD/CNY edge slightly lower, showing little response to the People’s Bank of China’s decision to leave its loan prime rate unchanged. The currency, however, stayed near its strongest levels in two and a half years after a series of firm midpoint fixings by the PBOC. Elsewhere, USD/TWD rose 0.3%, while AUD/USD gained 0.3%, with the Australian dollar supported by the softer U.S. dollar.

    The South Korean won weakened slightly, with USD/KRW rising 0.2%, while the Singapore dollar also softened as USD/SGD added 0.1%. The Indian rupee saw USD/INR edge up 0.1% and hover near the 91-per-dollar level, as growing concerns over the health of India’s economy weighed on the currency.

    Sources: Investing

  • Stocks week ahead: rising yields, tighter liquidity and negative gamma in focus

    It’s been a long, cold and snowy weekend in New York—just enough snow to keep most people glued to the couch. For anyone hoping for a brief break from markets, U.S. trading is closed on Monday.

    For committed market watchers, however, Weekend Wall Street and Weekend Tech offer little comfort. Both have been under pressure following the latest developments around Greenland, with Weekend U.S. Tech CFDs down roughly 75 basis points as of 8:30 a.m. ET on Sunday. While this move is not definitive, it suggests futures could open lower when trading resumes Sunday evening at 6:00 p.m. ET.

    Attention also turns to Tuesday, when the Supreme Court may issue another opinion. Given how volatility was priced on Friday, it would not be surprising to see overnight volatility dynamics re-emerge, potentially pushing implied volatility higher into the 10:00 a.m. release window.

    Tuesday also marks a $14 billion Treasury bill settlement, which is expected to tighten liquidity conditions further. As a result, the session could be eventful from the outset. If overnight funding rates begin to climb this week, pressure on usage of the Federal Reserve’s Standing Repo Facility would likely increase, with the key threshold for the overnight rate seen above 3.75%.

    From my perspective, the technical setup in the S&P 500 looks fragile. The index appears likely to be in negative gamma when trading resumes on Tuesday, which could further amplify volatility. The rising wedge pattern remains intact, and a decisive break below the 6,900 support level would raise the risk of a more pronounced pullback.

    Ten-year Treasury yields broke higher on Friday, and much of that move may have been linked to the quarterly refunding questionnaire sent to primary dealers later in the afternoon. The most notable steepening in the yield curve occurred in the belly, which would be consistent with speculation that the Treasury is considering shifting the 7-year note from a monthly new issue to a quarterly issuance with two reopenings.

    This suggests the Treasury could be preparing the market for potential adjustments to issuance size or duration in the near to medium term, though that view remains speculative. Notably, yields rose most sharply in the 5- to 7-year sector, reinforcing this interpretation.

    Had the move instead been driven by expectations around Kevin Hassett no longer being considered for Fed chair, yields would likely have increased more at the front end of the curve.

    Regardless of the catalyst, the key point is that the 10-year yield has broken out in a meaningful way, suggesting that a move higher may now be unfolding. While confirmation on Tuesday will be important, it is clear that market dynamics have shifted.

    Sources: Michael Kramer

  • Australian dollar rises after China GDP tops expectations

    • The Australian dollar advanced after the TD-MI Inflation Gauge rose to 3.5% year-on-year in December.
    • China’s GDP grew 1.2% quarter-on-quarter in the fourth quarter of 2025, accelerating from the previous quarter and exceeding market expectations.
    • Meanwhile, the U.S. dollar struggled as risk aversion intensified amid escalating uncertainty surrounding U.S.–Greenland developments.

    The Australian dollar strengthened against the U.S. dollar on Monday after Australia’s TD-MI Inflation Gauge rose to 3.5% year-on-year in December, up from 3.2% previously. On a monthly basis, inflation jumped 1.0% in December 2025, marking the fastest pace since December 2023 and a sharp acceleration from the 0.3% increases seen in the prior two months.

    AUD/USD also found support from China’s key economic data, with developments in the Chinese economy closely watched given Australia’s strong trade links with China.

    Data from China’s National Bureau of Statistics showed industrial production grew 5.2% year-on-year in December, accelerating from 4.8% in November, supported by resilient export-led manufacturing activity.

    China’s GDP expanded 1.2% quarter-on-quarter in the fourth quarter of 2025, up from 1.1% in Q3 and above the market consensus of 1.0%. On an annual basis, GDP rose 4.5% in Q4, easing from 4.8% in the previous quarter but beating expectations of 4.4%.

    Meanwhile, retail sales rose 0.9% year-on-year in December, falling short of forecasts for a 1.2% increase and November’s 1.3% reading. In contrast, industrial output exceeded expectations, rising 5.2% YoY versus estimates of 5.0% and improving from 4.8% a month earlier.

    U.S. Dollar softens amid escalating uncertainty over the U.S.–Greenland dispute

    The US Dollar Index (DXY), which tracks the Greenback against six major currencies, is under pressure and hovering near 99.20 at the time of writing. US financial markets remain closed on Monday in observance of Martin Luther King Jr. Day, resulting in thinner liquidity.

    The Dollar has come under renewed pressure amid rising risk aversion, fueled by growing uncertainty surrounding the US–Greenland dispute. Over the weekend, US President Donald Trump reiterated plans to impose tariffs on eight European nations that have opposed his proposal for the United States to acquire Greenland.

    According to Bloomberg, Trump said the US would levy a 10% tariff starting February 1 on imports from EU members Denmark, Sweden, France, Germany, the Netherlands, and Finland, as well as Britain and Norway. The tariffs would remain in place until Washington is allowed to proceed with the Greenland acquisition.

    Meanwhile, recent US labor market data have pushed expectations for additional Federal Reserve rate cuts further into the year. Fed officials have indicated limited urgency to ease policy until there is clearer evidence that inflation is sustainably returning to the 2% target.

    Reflecting this shift, Morgan Stanley revised its 2026 outlook, now projecting two rate cuts in June and September, compared with its prior forecast that anticipated cuts in January and April.

    Data from the US Department of Labor showed that Initial Jobless Claims unexpectedly declined to 198K for the week ending January 10, well below market expectations of 215K and down from the prior week’s revised 207K. The figures suggest layoffs remain subdued and the labor market continues to show resilience despite prolonged tight financial conditions.

    Inflation data offered mixed signals. Core CPI, excluding food and energy, rose 0.2% month-over-month in December, below expectations, while annual core inflation held steady at 2.6%, matching a four-year low. Headline CPI increased 0.3% MoM, in line with forecasts, leaving annual inflation unchanged at 2.7%. The data reinforced signs of easing price pressures after earlier readings were distorted by shutdown-related effects.

    In Australia, Reserve Bank of Australia (RBA) policymakers acknowledged that inflation has eased substantially from its 2022 peak, though recent data point to renewed upside risks. Headline CPI slowed to 3.4% YoY in November, the lowest level since August, but remains above the RBA’s 2–3% target range. Trimmed mean CPI edged down to 3.2% from 3.3% in October.

    The RBA noted that inflation risks have modestly shifted to the upside, while downside risks—particularly from global developments—have diminished. Policymakers currently expect only one additional rate cut this year, with underlying inflation projected to stay above 3% in the near term before easing toward 2.6% by 2027. Reflecting these expectations, ASX 30-Day Interbank Cash Rate Futures for February 2026 were trading at 96.35 as of January 16, implying a 22% probability of a rate hike to 3.85% at the next RBA policy meeting.

    The Australian Dollar approaches the 0.6700 level, facing resistance near the nine-day EMA

    The AUD/USD pair trades near 0.6680 on Monday, with daily chart signals showing consolidation around the nine-day Exponential Moving Average (EMA), pointing to a near-term neutral outlook. The 14-day Relative Strength Index (RSI) stands at 52.78, remaining above the neutral level and indicating underlying upside momentum.

    A sustained move below the short-term moving average could bring the 50-day EMA at 0.6642 into focus as initial support. Deeper declines may extend toward 0.6414, the lowest level recorded since June 2025.

    Conversely, a decisive break above the nine-day EMA at 0.6690 would strengthen the bullish case, potentially opening the way for a move toward 0.6766, the highest level since October 2024.

    AUD/USD: Daily Chart

    Sources: Fxstreet

  • Economic Forecast for the United States – January 2026

    Powell’s concluding move

    Jerome Powell’s eight-year leadership at the Federal Reserve is ending amid significant challenges for the U.S. central bank and divided opinions among policymakers about the right approach to monetary policy. So, what might Powell’s last moves as Chair look like in this environment?

    The labor market is still slightly weaker than full employment. Private sector job growth has stalled recently, and although the unemployment rate dropped a bit in December, it remains above what most economists consider the long-term natural rate.

    On the inflation front, recent data are more promising. Core CPI inflation fell to 2.6% year-over-year in December from 3.1% in August. Some temporary shutdown effects may be lowering this figure by about 0.1 percentage points, and the Fed’s preferred inflation gauge, the PCE deflator, likely hasn’t improved as much. However, the overall trend for core inflation entering 2026 is clearly downward.

    Given this, the Federal Open Market Committee (FOMC) likely has room to continue guiding the federal funds rate toward a neutral level in the near term. The forecast remains two quarter-point rate cuts in March and June, with the rate then holding steady at 3.00%-3.25%.

    However, the opportunity for further rate reductions is narrowing. Fiscal stimulus from the recent One Big Beautiful Bill Act is expected to start boosting the economy by spring or summer. Additionally, tariff risks seem to be declining, which could also spur faster growth later in the year. The recent 75 basis points of rate cuts over the past three months will likely provide some support as well.

    If labor market and inflation indicators show signs of overheating in the coming months, Powell and the FOMC might opt to pause policy adjustments and leave things steady for the next Chair. This successor could face skepticism from a committee under pressure from the Trump administration. The expectation of stronger economic growth in spring and summer further supports holding rates steady.

    For now, the current forecast stands, but there is growing risk that rate cuts may be delayed or reduced compared to the baseline prediction.

    Download full US Economy Forecast report

    Sources: Wells Fargo

  • U.K. economy bounced back in November with a 0.3% monthly increase in GDP

    The U.K. economy showed signs of recovery in November following a weak start to the fourth quarter, though economic outlooks remain uncertain.

    Data published Thursday by the Office for National Statistics revealed that the U.K.’s gross domestic product increased by 0.3% in November, rebounding from a 0.1% monthly decline in October. Year-over-year, the U.K. economy grew by 1.4% in November, up from 1.1% growth the month before.

    The manufacturing sector saw strong growth of 2.1% in November, supported by the ongoing reopening of Jaguar Land Rover’s factories as the company continues to recover from last year’s cyberattack.

    However, Michael Brown, senior research strategist at Pepperstone, cautioned that this modest growth rate does little to inspire confidence in the U.K.’s economic outlook. He pointed out that risks remain heavily skewed to the downside, and that recent government policy reversals have eroded up to two-thirds of the fiscal flexibility that Chancellor Rachel Reeves had secured in the November Budget.

    Late last year, Finance Minister Reeves increased taxes to help reduce the deficit and support higher welfare spending, but the tax hikes were less severe than initially expected.

    Reeves recently announced a £4.3 billion fund aimed at easing the impact of upcoming interest rate hikes on the hospitality sector, especially as Covid-era support ends in April and property valuations are updated.

    In December, the Bank of England cut interest rates at its final policy meeting of 2025, with expectations of further cuts this year due to forecasts of a significant slowdown in inflation. Alan Taylor, an external member of the Bank’s monetary policy committee, noted this earlier in the week.

    He added that falling energy prices and measures introduced in the autumn budget to reduce living costs should help bring inflation back to the 2% target by mid-2026.

    “Interest rates are likely to keep declining, provided my economic outlook aligns with the data, as it has over the past year,” Taylor said. British inflation eased to 3.2% in November 2025, falling more than anticipated but still above the Bank of England’s 2% goal.

    Sources: BBC

  • The US Dollar Could Gain Strength Following the Fed’s Turmoil

    Yesterday, the US CPI came in weaker than anticipated, supporting our prediction of a Fed rate cut in March. However, we expect the market to take a few more weeks before fully embracing this outlook. The US dollar could recover more than its recent losses, possibly driven by a hawkish stance following the Powell criminal investigation. In the meantime, we’ll continue to watch the Japanese yen closely today, along with developments in the Greenland discussions.

    USD: We Maintain a Short-Term Optimistic Outlook

    US inflation came in softer than consensus and well below our expected 0.4% month-on-month core reading. Yet, yesterday’s market reaction actually reinforced our short-term positive outlook on the dollar: despite the weak CPI data, Fed rate expectations barely shifted, and the dollar quickly regained strength.

    This may partly be due to market caution in over-interpreting the CPI figures amid ongoing shutdown-related distortions. It also indicates that concerns about the Fed’s independence are diminishing, helped by expectations that the criminal probe into Chair Powell may not advance much further and opposition from some GOP lawmakers. We believe there’s a fair chance the dollar will ultimately come out stronger from this situation, as Powell might adopt a more firmly hawkish stance to assert Fed independence.

    Additionally, the key message from yesterday’s CPI report is the continued softness in goods prices, highlighting how limited the tariff effects on inflation have been. Several tariff-sensitive categories remained weak, including appliances (-4.3% MoM), furniture (-0.4%), new vehicles (0.0%), and video and audio equipment (-0.4%). This clear trend suggests US retailers are still squeezing their margins. Overall, this strengthens our confidence in a Fed rate cut in March, although it may take time for markets to fully accept this outlook.

    Today, focus shifts to November’s PPI, with core PPI expected to rise by 0.2% month-on-month, and retail sales, which are anticipated to remain fairly strong. A busy lineup of Fed speakers—including Paulson, Miran, Kashkari, Bostic, and Williams—will be closely watched for any subtle hawkish signals in support of Powell and the Fed’s independence.

    Additionally, the Supreme Court is expected to issue a ruling on tariffs today, likely unfavorable. If that happens, significant noise from the Trump administration is expected, though markets are unlikely to be caught off guard. Our baseline expectation is for a mildly positive reaction in the dollar.

    EUR: Greenland Discussions Likely to Have Limited Market Impact

    A US delegation, including JD Vance and Marco Rubio, is scheduled to meet today with officials from Denmark and Greenland. So far, US threats related to Greenland have had minimal impact on markets—limited mostly to some movements in EUR/DKK forwards—meaning there’s little risk premium to be unwound even if the talks lead to a cooperative outcome. Nevertheless, any progress could help eliminate a lingering geopolitical “black swan” risk for European currencies.

    There seems to be potential for an agreement, likely based on the US abandoning any claims of “ownership” over Greenland—a stance firmly rejected by both Denmark and Greenland—in exchange for enhanced economic partnerships and a greater US military presence.

    Positive headlines from the talks might ease the EUR/USD’s recent decline slightly, but we still expect the pair to approach 1.1600 in the near term.

    JPY: Approaching the 160 Level for a Key Test

    The USD/JPY rally shows no signs of slowing. Rising speculation about snap elections is bringing back a political risk premium, giving another push to test Japan’s currency tolerance band. Meanwhile, ongoing diplomatic tensions between Japan and China are adding more momentum to the move.

    On Monday, we viewed 160 as a key upside target. While intervention concerns may slow the rally near that level, it increasingly looks like 160 will eventually be tested. Recall that in July 2024, Japan allowed the pair to surpass 160 and only intervened when it neared 162. Pinpointing the exact intervention level is tricky, but since the BoJ hasn’t acted sooner, it’s reasonable to expect they’ll wait until the pair exceeds 160.

    For context, the first intervention on July 11, 2024, led to a 1.8% drop in USD/JPY. Interestingly, back then, CFTC net non-commercial positions on the yen were at -52% of open interest, whereas now they are 3% net-long, despite spot price action suggesting otherwise.

    The crucial question is whether FX interventions alone can sustain a USD/JPY recovery. Historically, they haven’t. In 2024, interventions curtailed short-term gains but the subsequent USD/JPY decline was driven mainly by a sharp 50bp drop in US 2-year swap rates over the next month. That scenario seems unlikely now, and with snap election risks ongoing, markets remain hesitant to price in a BoJ rate hike before summer.

    Sources: ING

  • US Investigation Centers on Powell’s Testimony to Congress

    WASHINGTON — On January 12, former Federal Reserve chairpersons strongly condemned the ongoing U.S. criminal investigation into current Fed Chair Jerome Powell, describing it as an “unprecedented attempt” to undermine the central bank’s independence.

    Two Republican senators also criticized the Trump administration and questioned the Justice Department’s credibility in pursuing charges against Powell, whom President Trump has long aimed to replace amid his push for lower interest rates.

    On January 11, Powell disclosed that the Federal Reserve had received grand jury subpoenas and faced threats of a criminal indictment related to his Senate testimony from June.

    The controversy centers on a $2.5 billion (S$3.2 billion) renovation project for the Federal Reserve’s headquarters. In 2025, President Donald Trump suggested he might dismiss Chair Jerome Powell due to cost overruns related to the historic building’s refurbishment.

    On January 12, former Fed Chairs Ben Bernanke, Alan Greenspan, and Janet Yellen, along with other ex-economic leaders, publicly criticized the Department of Justice’s investigation.

    In a joint statement, they condemned the probe as “an unprecedented attempt to use prosecutorial attacks” aimed at undermining the Fed’s independence.

    The statement added, “This is typical of how monetary policy is conducted in emerging markets with fragile institutions, often resulting in severe inflation and broader economic dysfunction.”

    “Such practices are unacceptable in the United States.”

    In an unusual statement on January 11, Mr. Powell criticized the administration, calling the building renovation and his congressional testimony mere “pretexts.” “The possibility of criminal charges stems from the Federal Reserve’s commitment to set interest rates based on its best judgment of the public’s interest, rather than aligning with the president’s preferences,” Powell stated.

    He pledged to perform his duties “without political fear or favor.”

    Separately, New York Fed President John Williams noted that historically, political interference in monetary policy often results in “unfortunate” consequences such as inflation.

    Stocks Reach New All-Time Highs

    Despite concerns triggered by the investigation, U.S. stock indices closed at record highs.

    Bernard Yaros, lead U.S. economist at Oxford Economics, noted, “The fact that market-based inflation expectations have stayed steady suggests that investors are largely dismissing the probe as having little or no effect on the Fed’s independence.”

    The Federal Reserve operates independently with a dual mandate to maintain price stability and low unemployment. Its primary tool is adjusting the benchmark interest rate, which influences U.S. Treasury yields and borrowing costs.

    President Trump has frequently criticized Powell, labeling him a “numbskull” and “moron” for the Fed’s policy choices and not cutting rates more aggressively.

    On January 12, White House spokeswoman Karoline Leavitt told Fox News that Powell “has proven he’s not very good at his job.” Regarding whether Powell is a criminal, she added, “That’s a question the Department of Justice will have to answer.”

    Republicans Push Back Against Investigation

    The Justice Department’s investigation has faced backlash from across the political spectrum.

    On January 11, Republican Senator Thom Tillis, a member of the Senate Banking Committee, pledged to block the confirmation of any Federal Reserve nominee—including the next Fed chair—until the legal issue is “fully resolved.”

    He stated, “The independence and credibility of the Department of Justice are now at stake.”

    Another Republican senator, Lisa Murkowski of Alaska, backed Thom Tillis’ stance, describing the investigation as “nothing more than an attempt at coercion.”

    Earlier, Senate Majority Leader Chuck Schumer, a leading Democrat, criticized the probe as an assault on the Federal Reserve’s independence.

    David Wessel, a senior fellow at the Brookings Institution, warned of serious risks if the Fed were to come under President Trump’s influence.

    Politicians might be tempted to keep interest rates low to stimulate the economy before elections, while an independent Fed is expected to set policy focused on controlling inflation and maximizing employment.

    Wessel told AFP that if Trump succeeds in swaying the Fed, the U.S. could face higher inflation and reduced willingness from global investors to finance the Treasury.

    Powell was originally nominated as Fed chair by Trump during his first term. His chairmanship ends in May, but he may remain on the Fed board until 2028. In 2025, Trump also attempted to remove Fed Governor Lisa Cook over allegations of mortgage fraud.

    Sources: Bloomberg

  • Silver Price Outlook: XAG/USD Climbs Toward $90 as Geopolitical Tensions Mount

    Silver prices hit a new all-time high approaching $90.00 amid escalating tensions as the U.S. threatens military action in Iran. Meanwhile, leaders of major global central banks have criticized Washington for undermining the Federal Reserve’s independence. Despite this, the U.S. dollar rebounded sharply after these central bank chiefs expressed strong support for Fed Chair Jerome Powell.

    Silver (XAG/USD) continued its winning streak for a fourth consecutive trading day on Wednesday, rallying close to $90.00 during the Asian session. The white metal’s advance is supported by sustained demand for safe-haven assets amid ongoing geopolitical tensions.

    In Iran, widespread civil unrest driven by soaring inflation, a sharp depreciation of the Rial against the US Dollar, and government corruption has led to the deaths of hundreds of protesters calling for political change.

    In response, U.S. President Donald Trump has threatened military action against Tehran if the Iranian government continues to kill protesters.

    Meanwhile, concerns over the Federal Reserve’s independence have intensified following criminal charges against Chairman Jerome Powell related to alleged mismanagement of funds for renovating Washington’s headquarters. Powell dismissed the charges as a “pretext,” attributing them to the Fed’s decision to set interest rates based on public interest rather than presidential preferences. These developments kept safe-haven assets in demand.

    The news initially caused a sharp drop in the U.S. dollar, with experts warning that any threat to the Fed’s autonomy could negatively impact the country’s sovereign credit rating. However, the dollar quickly recovered after top officials from global central banks expressed strong support for Powell amid his dispute with President Trump.

    “We stand in full solidarity with the Fed System and its Chair Jerome H. Powell,” said leaders of the European Central Bank, Bank of England, and nine other major institutions in a joint statement on Tuesday.

    Silver technical analysis

    XAG/USD is trading higher near $90.00 at the time of writing, with strong buying momentum pushing the price further into overbought territory.

    The 14-day Relative Strength Index (RSI) has risen to 74.77 from 72.52, signaling increasing bullish momentum. Although the trend remains upward, the overextended conditions may limit further gains and lead to a period of consolidation.

    A slight pullback in momentum, with the RSI retreating closer to the 70 level, could provide a healthy reset and support a more gradual upward move. However, if the RSI accelerates again toward the previous high near 85.90, the rally may face a sharper correction due to rising momentum fatigue.

    Sources: Bloomberg

  • Asia FX weakens amid caution over Trump tariff threats, Iran tensions, and questions surrounding the Fed’s autonomy

    Most Asian currencies weakened on Tuesday, with the Japanese yen falling to a one-year low, as higher oil prices fueled by unrest in Iran pressured the region. Meanwhile, new political and trade developments in the United States dampened investor sentiment.

    The U.S. Dollar Index, which tracks the greenback against a basket of major currencies, rose 0.1% after a slight decline in the previous session. Dollar Index futures were also up 0.1% as of 03:36 GMT.

    Japan’s currency drops to a one-year low following news of a possible snap election

    The yen was the worst-performing currency, as USD/JPY climbed 0.4% to 158.76, its highest level since January 2025. The currency came under pressure after reports suggested that Prime Minister Sanae Takaichi could call a snap election as early as February. Investors speculated that a potential election win would strengthen her mandate for expansionary fiscal policies, further weighing on the yen.

    Markets focus on Trump’s tariff threat, unrest in Iran, and higher oil prices

    Risk appetite across Asia stayed cautious following U.S. President Donald Trump’s announcement of a 25% tariff on goods from countries “doing business” with Iran, though specifics on timing and coverage remain unclear.

    Meanwhile, oil prices rose further amid deadly anti-government protests in Iran, sparking concerns over potential supply disruptions. The unrest has also led to warnings of possible military intervention from Trump, heightening geopolitical risk premiums.

    MUFG analysts noted that Asian currencies may have been negatively affected by recent rises in oil prices, driven by events in both Venezuela and Iran.

    They added that, aside from China, countries like Turkey, the United Arab Emirates, and to a lesser extent Russia and India, maintain some trade connections with Iran.

    In Asia, the South Korean won (USD/KRW) rose 0.4%, marking its seventh consecutive gain. The Indian rupee (USD/INR) increased slightly by 0.1%, while the Singapore dollar (USD/SGD) remained stable. In China, the onshore yuan (USD/CNY) showed little movement, whereas the offshore yuan (USD/CNH) edged up 0.1%. The Australian dollar (AUD/USD) traded mostly flat.

    Concerns over Fed independence trigger risk-averse sentiment

    The Trump administration has launched a criminal probe into Federal Reserve Chair Jerome Powell regarding his testimony about renovation activities at the central bank’s headquarters, raising concerns about the Fed’s independence.

    In response, Powell issued a statement affirming the Fed’s autonomy and assuring that policy decisions will remain based solely on economic data and the central bank’s mandate. Several former Fed chairs and senior officials have publicly expressed their support for Powell.

    “It’s a wait-and-see situation as markets attempt to gauge the actual impact of these developments,” noted analysts from ING in a recent report.

    Despite a softer U.S. dollar, Asian currencies found it difficult to gain, as investors remained focused on broader U.S. political risks, trade uncertainties, and rising oil prices.

    Focus is also shifting to upcoming U.S. economic reports and any indications from the Federal Reserve, as market participants reevaluate interest rate forecasts amid increased political scrutiny of the central bank.

    Sources: Investing

  • Upcoming Economic Week: Inflation and Retail Sales to Shape Fed Policy Outlook

    If economists were meteorologists, this week’s forecast would predict a data blizzard. However, clarity is expected to improve as markets receive highly anticipated reports on inflation, retail sales, and industrial production ahead of the Federal Reserve’s policy meeting on January 28.

    Few economists expect Fed Chair Jerome Powell and the Federal Open Market Committee (FOMC) to ease monetary policy again later this month—and neither do we. This week’s data could either confirm or challenge that view, starting with the December consumer price index report on Tuesday.

    The Fed drama intensified last week after President Donald Trump instructed Fannie Mae and Freddie Mac to purchase $200 billion in mortgage bonds—an action typically undertaken by the Fed itself. Many saw this move as an attempt to restart quantitative easing. Meanwhile, Fed Governor Stephen Miran told Bloomberg he anticipates 150 basis points of rate cuts this year.

    What’s still missing, however, is significantly lower inflation and a recession that would justify such aggressive easing. This week will also feature speeches from several Fed officials, which could provide insight into the central bank’s thinking. The lineup starts with New York Fed President John Williams on Monday, followed by Governors Miran (Wednesday), Michael Barr (Thursday), Michelle Bowman (Friday), and Vice Chair Philip Jefferson (Friday).

    Here’s a rundown of this week’s key data releases likely to influence the timing and scale of any future Fed rate cuts:

    Inflation

    Since the 43-day government shutdown in October and November, investors have struggled to gauge inflation accurately. The 2.7% year-over-year CPI rise in November, a slight dip from October’s 3.0%, was met with caution, as the shutdown likely disrupted the Bureau of Labor Statistics’ data gathering.

    This increases the importance of the upcoming CPI and PPI reports, which will be key indicators before the FOMC’s January 28 interest rate decision.

    The upcoming CPI report on Tuesday is expected to show a modest easing in inflation, with the Cleveland Fed’s model forecasting a 0.2% monthly increase and 2.6% year-over-year growth. The November PPI report, due Wednesday, is considered less impactful, while import and export price data for November will be released on Thursday.

    Retail sales

    Retail sales (Wednesday) are expected to show a slight increase in November after remaining flat in October (see chart). Overall, we believe consumer spending remains resilient despite rising living costs and soft employment figures. Additional important demand indicators this week include December existing home sales (Wednesday) and mortgage applications for the week ending January 9 (Wednesday).

    Jobless claims

    We anticipate layoffs will stay minimal, which has been the key insight from recent initial unemployment claims data (Thursday) (see chart). While demand for labor may be slowing in certain sectors, the feared AI-driven collapse in the job market has not materialized yet.

    Composite economic indicators & business surveys

    The composite cyclical indicators for December, due Thursday, are expected to show the coincident index holding at a record high, while the (mis)leading index continues its decline. Additionally, given delays in official hard data, the National Federation of Independent Business’ Small Business Optimism Index for December (Tuesday) should provide valuable insights, following its rise to 99 in November. Later in the week, the Federal Reserve banks of New York and Philadelphia will release their January business surveys (Thursday).

    Our preferred coincident indicator is the S&P 500 forward earnings per share, which has accelerated in recent weeks and hit record highs (see chart).

    Sources: Investing

  • Australian Dollar Gains as US Dollar Weakens Amid Fed Probe

    • The Australian Dollar ended its three-day slide on Monday.
    • ANZ reported a 0.5% decline in job advertisements for December, following a revised 1.5% drop in the previous month.
    • Meanwhile, the US Dollar weakened after federal prosecutors launched a criminal investigation into Federal Reserve Chair Jerome Powell.

    The Australian Dollar (AUD) gained ground against the US Dollar (USD) on Monday, reversing a three-day losing streak. The AUD/USD pair rose as the Greenback weakened, partly due to growing concerns about the Federal Reserve.

    Federal prosecutors have launched a criminal investigation into Fed Chair Jerome Powell, focusing on the central bank’s renovation of its Washington headquarters and allegations that Powell may have misled Congress about the project’s details, according to a New York Times report on Sunday.

    ANZ Job Advertisements fell by 0.5% in December, following a revised 1.5% decline in November. Meanwhile, household spending rose 1.0% month-on-month in November 2025, slowing from a revised 1.4% increase in October, reflecting consumer caution amid high interest rates and ongoing inflation.

    Australia’s mixed Consumer Price Index (CPI) report for November has left the Reserve Bank of Australia’s (RBA) policy direction uncertain. However, RBA Deputy Governor Andrew Hauser stated that the inflation data largely met expectations and indicated that interest rate cuts are unlikely in the near term. Attention now turns to the quarterly CPI report due later this month for clearer insight into the RBA’s upcoming policy decisions.

    US Dollar Slides Amid Federal Reserve Uncertainty

    The US Dollar Index (DXY), which tracks the Dollar against six major currencies, is weakening and trading near 98.90 amid expectations of a dovish Federal Reserve. Slower-than-anticipated US job growth in December suggests the Fed may keep interest rates steady at its upcoming January meeting.

    US Nonfarm Payrolls increased by 50,000 in December, below November’s revised 56,000 and the expected 60,000. Meanwhile, the unemployment rate fell to 4.4% from 4.6%, and average hourly earnings rose to 3.8% year-over-year from 3.6%.

    CME Group’s FedWatch tool shows about a 95% chance that the Fed will hold rates steady on January 27–28. Richmond Fed President Tom Barkin welcomed the unemployment drop, describing job growth as modest but steady. He noted hiring remains limited outside healthcare and AI sectors and expressed uncertainty about whether the labor market will see more hiring or layoffs going forward.

    US Treasury Secretary Scott Bessent told CNBC on Thursday that the Federal Reserve should continue cutting interest rates, emphasizing that lower rates are the “only ingredient missing” for stronger economic growth and urging the Fed not to delay.

    The US Department of Labor reported that Initial Jobless Claims rose slightly to 208,000 for the week ending January 3, just below expectations of 210,000 but above the previous week’s revised 200,000. Continuing claims increased to 1.914 million from 1.858 million, signaling a gradual rise in those receiving unemployment benefits.

    The Institute for Supply Management (ISM) revealed that the US Services PMI climbed to 54.4 in December from 52.6 in November, surpassing expectations of 52.3.

    ADP data showed a gain of 41,000 jobs in December, improving from a revised 29,000 job loss in November, though slightly below the expected 47,000. Meanwhile, JOLTS job openings dropped to 7.146 million in November from a revised 7.449 million in October, missing forecasts of 7.6 million.

    China’s Consumer Price Index (CPI) increased by 0.8% year-over-year in December, up from 0.7% in November but slightly below the 0.9% forecast. On a monthly basis, CPI rose 0.2%, reversing November’s 0.1% decline. Meanwhile, China’s Producer Price Index (PPI) fell 1.9% year-over-year in December, improving from a 2.2% drop the previous month and slightly beating expectations of a 2.0% decline.

    Australia’s trade surplus narrowed to 2.936 billion AUD in November, down from a revised 4.353 billion AUD in October. Exports declined 2.9% month-on-month in November, following a revised 2.8% increase the previous month. Imports edged up 0.2% in November, slowing from a revised 2.4% gain in October.

    AUD rebounds, testing upper boundary of rising channel around 0.6700

    On Monday, AUD/USD trades near 0.6700 as the pair attempts a rebound toward an ascending channel, indicating a renewed bullish outlook. The 14-day RSI at 58.33 remains above the neutral midpoint, supporting upward momentum.

    A sustained move back into the channel would reinforce the bullish trend, potentially pushing the pair toward 0.6766—the highest level since October 2024. Further upside could target the channel’s upper resistance near 0.6860.

    Immediate support is found at the nine-day EMA around 0.6700, followed by the 50-day EMA at 0.6631. A break below these levels could open the path to 0.6414, the lowest point since June 2025.

    Sources: Fxstreet

  • Asian currencies remain muted as the dollar falls amid US investigation into Fed Chair Powell

    Asian currencies remained largely steady on Monday, while the U.S. dollar weakened following the announcement of a criminal investigation involving Federal Reserve Chair Jerome Powell, casting uncertainty over the central bank’s independence.

    The U.S. Dollar Index, which tracks the greenback against a basket of major currencies, declined 0.2% from its one-month peak. Meanwhile, U.S. Dollar Index futures were also down 0.2% as of 04:27 GMT.

    Fed Chair Powell faces threat of indictment

    Investor confidence was rattled after Powell revealed that the administration had threatened the Federal Reserve with a potential criminal indictment related to his Senate testimony about cost overruns in the Fed’s headquarters renovation.

    This development weakened trust in U.S. institutions and prompted a cautious mood across global markets, dampening risk appetite in Asia.

    In this environment, most regional currencies showed little movement.

    The Japanese yen’s USD/JPY pair edged up 0.2%, while the Singapore dollar’s USD/SGD remained flat.

    The South Korean won stood out, rising 0.7% on Monday.

    In China, the onshore yuan’s USD/CNY pair was mostly unchanged, whereas the offshore yuan’s USD/CNH dipped slightly by 0.1%.

    The Indian rupee’s USD/INR pair saw minimal change.

    Meanwhile, the Australian dollar’s AUD/USD pair rose modestly by 0.2%.

    US jobs data bolster expectations for Fed rate cuts

    Investor sentiment was also shaped by U.S. economic data released last Friday, which revealed that nonfarm payroll growth in December slowed more than anticipated.

    The weaker-than-expected hiring numbers have heightened expectations that the Federal Reserve may implement interest rate cuts later this year.

    Market pricing now factors in at least one additional Fed rate cut in 2026, with some traders anticipating two reductions.

    Attention is now turning to the U.S. consumer price index for December, due Tuesday, a key economic indicator ahead of the Fed’s upcoming policy meeting later this month.

    Sources: Investing

  • Morning Update: Powell’s Response Shakes Markets

    Ankur Banerjee provides a preview of the day ahead in European and global markets. Investors remain focused on the escalating conflict between U.S. President Donald Trump and Federal Reserve Chair Jerome Powell, who is pushing back against attempts to exert political control over the Fed and its interest rate decisions.

    Meanwhile, growing turmoil in Iran—where over 500 people have reportedly been killed, according to human rights groups—adds to the geopolitical uncertainties shaping market sentiment at the start of 2026, supporting demand for safe-haven assets.

    Markets opened Monday with shocking news that the Trump administration had threatened to indict Powell over his Congressional testimony last summer concerning a Fed building renovation. Powell described this as a “pretext” aimed at increasing political influence over monetary policy.

    “This issue centers on whether the Fed can continue setting interest rates based on data and economic realities, or if monetary policy will instead be shaped by political pressure and intimidation,” Powell stated.

    The initial market reaction saw the dollar weaken and stock futures decline, although the impact on interest rate policy remains unclear. Gold prices surged past $4,600 per ounce as investors sought refuge.

    Despite the unsettling news, market responses were measured, with no signs of panic selling as investors await further clarity on the Fed’s independence and the future path of interest rates.

    WASHINGTON, DC – DECEMBER 13: U.S. Federal Reserve Board Chairman Jerome Powell speaks during a news conference at the headquarters of the Federal Reserve on December 13, 2023 in Washington, DC. The Federal Reserve announced today that interest rates will remain unchanged. (Photo by Win McNamee/Getty Images)

    Markets may now generally anticipate that the Federal Reserve will yield to Trump’s influence and ease interest rates freely once a new Fed chair takes over after Powell’s term ends in May. Futures pricing currently reflects expectations of two rate cuts this year.

    With Japanese markets closed on Monday, no cash trading occurred in Treasuries during Asian hours. Attention will shift to the Treasury market when London trading begins.

    Key events that could impact markets on Monday include: Germany’s November current account balance and the euro zone Sentix investor confidence index for January.

    Sources: Reuters

  • Looking Back at the First 25 Years of the 21st Century

    Reflecting on the start of this century, the first striking observation is our national shortsightedness. After surviving Y2K and the dot-com crash in 2000, our leaders assumed the path ahead would be smooth sailing from year one onward.

    However, reality proved otherwise, beginning with a series of black swan events, notably the attacks on the World Trade Center and Pentagon on September 11. While such events are inherently unpredictable, it’s remarkable that the Congressional Budget Office (CBO) economists confidently forecasted in 2001 a future of continuous budget surpluses, anticipating the complete elimination of national debt by 2011.

    For reasons unknown, the CBO issues 10-year federal spending and revenue projections, despite having no solid factual or practical foundation to accurately forecast beyond a year or two—akin to trying to predict the weather a year in advance.

    The January 2001 CBO report highlights this myopia. Their projections simply extended current trends indefinitely without grounding in reality. Under this unrealistic mandate, the CBO projected a cumulative surplus of $5.6 trillion for 2002–2011.

    In reality, deficits over that decade totaled $6.1 trillion—a swing of $11.7 trillion. It would have been much simpler to just flip a plus sign to a minus. The projections failed to account for the soaring costs of Bush’s “War on Terror” post-9/11, which led to prolonged wars in Afghanistan and Iraq, the bursting of the real estate bubble, and massive TARP bailouts to rescue large banks.

    In short, this is a summary of CBO’s flawed foresight:

    The first takeaway from this bleak forecast is that the CBO economists assumed deficits would increase in a smooth, predictable fashion—almost as if they were drawing a straight line with minor fluctuations, rather than reflecting the unpredictable realities of economic growth.

    A second point is that the 2003 Bush tax cuts were not the main driver of the deficits. In fact, annual deficits dropped significantly—from $413 billion in fiscal year 2004 (which began October 1, 2003) to just $161 billion in fiscal year 2007. This means the deficit shrank by more than half during the four years following the tax cuts and before the 2007 real estate crash.

    While much of this now feels like distant history, the ongoing wars and the Federal Reserve’s drastic response to the 2008 financial crisis—keeping interest rates near zero for eight years, essentially through the entire Obama administration—contributed to massive deficits that have persisted through to today, especially in the five years following the COVID-19 pandemic.

    Since 2001, U.S. federal deficits have averaged about $1 billion annually, but that figure has surged to over $2 trillion per year since 2020, according to the U.S. Treasury.

    Today, the total federal deficit stands at $38 trillion, which amounts to roughly $110,000 owed per American—far from the anticipated surpluses once projected.

    Following a Challenging 2000–2009, Markets Surged in the First Quarter

    What about the markets? After nearly a “lost decade” lasting nine years from March 2000 to March 2009, all major market indexes have experienced remarkable growth—particularly gold relative to the U.S. dollar.

    By March 9, 2009, three of the four major indexes—the S&P 500, NASDAQ, and Russell 2000—had fallen by 50% since the decade began (while the Dow was down 40%), but they bounced back strongly from 2009 through 2025:

    Over the same 25-year period, the Consumer Price Index (CPI) increased by 83%, which means the real market gains were somewhat diminished.

    The U.S. dollar performed even worse, losing about 10% in value overall (and 8% against the euro), while gold and silver surged more than 15 times in value:

    The first-quarter returns were decent, but the strong performance of gold and silver signals that the dollar—and the CBO’s deficit forecasts—cannot be relied on in the long run. In fact, President Trump has set a goal for 2026 to deliberately weaken the dollar against the Chinese yuan to “help” exporters boost overseas sales. Much of the talk about the dominance of the “King Dollar” is just rhetoric. In reality, many politicians aim to devalue their currencies to encourage trade, turning paper money into a “race to the bottom,” while gold quietly holds its value, watching from the sidelines.

    This brings us to the 2025 summary—a major victory for precious metals as the dollar dropped by 10%.

    2025 Brought Massive Gains for Precious Metals

    The year 2025 exemplified the key trends seen over the past 25 years—while the stock market continued to climb, gold and silver surged even faster. Although inflation is easing, gold today serves less as an inflation hedge and more as a safeguard against crises, a hedge against the dollar, and increasingly, a hedge against cryptocurrency volatility.

    In 2025, the U.S. Dollar Index (DXY) dropped by 10%, allowing major global currencies to gain between 5% and 15%. Meanwhile, the poorest-performing investments of 2025 brought good news for consumers through lower food and energy prices:

    So, if 2026 mirrors the gains of 2025, it will surely be a rewarding year for most investors.

    Sources: Investing