The US Dollar Index remains under pressure after retreating from Wednesday’s 11-week peak of 100.57. The Greenback weakened as safe-haven demand eased following a preliminary US-Iran agreement aimed at ending the conflict. However, the Dollar could find support, as half of Federal Open Market Committee (FOMC) members still anticipate at least one interest-rate hike this year.
The US Dollar Index (DXY), which tracks the US Dollar’s performance against a basket of six major currencies, eased from Wednesday’s 11-week high of 100.57 and was trading near 100.30 during Thursday’s Asian session.
The Greenback came under modest pressure as demand for traditional safe-haven assets weakened after reports emerged that the United States and Iran had reached a preliminary agreement aimed at ending the conflict involving Iran and Israel. According to reports, the framework was endorsed by senior officials from both sides earlier in the week before being formally approved by US President Donald Trump and Iranian President Masoud Pezeshkian.
Despite the pullback, the US Dollar may find renewed support as expectations grow that the Federal Reserve could tighten monetary policy further later this year. The Fed’s June Summary of Economic Projections revealed that half of the Federal Open Market Committee (FOMC) members anticipate at least one additional rate increase in 2026. Persistent inflationary pressures and a resilient labor market continue to strengthen the case for higher borrowing costs, even amid economic uncertainty linked to tensions in the Middle East.
At its latest meeting, the FOMC unanimously decided to leave the federal funds rate unchanged at 3.50%–3.75%. Meanwhile, newly appointed Federal Reserve Chair Kevin Warsh emphasized his commitment to restoring price stability, signaling a firm stance against inflation during his first policy meeting at the helm of the central bank.
EUR/USD extends its recovery for a third consecutive session as easing US-Iran tensions weigh on the US Dollar.
The shared currency remains supported by the ECB’s relatively hawkish stance, adding further momentum to the pair.
Still, traders appear cautious ahead of the closely watched FOMC interest rate decision, limiting stronger bullish moves for now.
EUR/USD maintains a positive tone for the third consecutive day, holding comfortably above the 1.1600 level during Wednesday’s Asian session. Still, bullish momentum remains limited as traders prefer to stay cautious ahead of the outcome of the two-day FOMC policy meeting before committing to fresh positions following the pair’s rebound from last week’s two-month low near the 1.1500 psychological area.
Improved risk sentiment driven by optimism surrounding an interim peace agreement between the US and Iran continues to pressure the safe-haven US Dollar, providing support for EUR/USD. Meanwhile, the Euro also benefits from the European Central Bank’s hawkish stance after delivering its first rate hike in three years. The ECB additionally lifted its 2026 inflation forecast to 3%, citing persistent energy-related shocks and widening price pressures across the Eurozone.
Markets are still pricing in around 40 basis points of additional ECB tightening in 2026 despite easing geopolitical tensions in the Middle East. The US and Iran recently agreed to a preliminary peace framework aimed at ending the conflict that escalated earlier this year. The memorandum of understanding includes a 60-day ceasefire, the reopening of the Strait of Hormuz, and future technical negotiations regarding Iran’s nuclear program, though many details of the agreement remain unclear.
At the same time, expectations that the Federal Reserve could still deliver a 25-basis-point rate hike in December continue to limit downside pressure on the US Dollar and cap stronger gains in EUR/USD. Investors are now focused on the Fed’s policy announcement, updated economic projections, and the closely watched dot plot. Market participants will also closely monitor comments from Fed Chair Kevin Warsh during the post-meeting press conference for further insight into the future direction of monetary policy.
The Australian Dollar extends its decline against major currencies following the latest economic data from China. On a yearly basis, China’s Retail Sales fell by 0.6%, while Industrial Production increased by 4.5%. Market participants are now focused on the upcoming Reserve Bank of Australia (RBA) policy decision, with expectations that the Official Cash Rate (OCR) will remain unchanged at 4.35%.
The Australian Dollar (AUD) remains under pressure against its major counterparts during Tuesday’s Asian session, slipping 0.16% to around 0.7060 against the US Dollar (USD). After posting gains for three consecutive sessions, the AUD/USD pair reversed lower, with losses accelerating following weaker-than-expected economic data from China.
As Australia’s largest trading partner, China plays a crucial role in shaping demand for Australian exports, making Chinese economic indicators a key driver of the Australian Dollar.
Data released by China’s National Bureau of Statistics showed Retail Sales fell 0.6% year-over-year in May, missing expectations for a flat reading and reversing April’s 0.2% increase. Fixed Asset Investment also deteriorated, contracting 4.1% compared with forecasts of a 2.0% decline and the previous 1.6% drop.
In contrast, Industrial Production provided a bright spot, rising 4.5% annually, exceeding both market expectations of 4.3% and April’s 4.1% growth.
Attention now turns to the Reserve Bank of Australia (RBA), which is scheduled to announce its monetary policy decision at 04:30 GMT. Markets widely expect the central bank to keep the Official Cash Rate (OCR) unchanged at 4.35%.
Investors are likely to focus less on the rate decision itself and more on the RBA’s policy guidance, particularly as inflation pressures show signs of easing and labor market conditions soften. Australia’s annual Consumer Price Index (CPI) slowed to 4.2% in April, below forecasts of 4.4% and down from 4.6% previously. Meanwhile, the unemployment rate unexpectedly rose to 4.5%, compared with expectations and the prior reading of 4.3%.
These developments could influence the RBA’s assessment of the economic outlook and shape expectations for the future path of monetary policy.
After more than 100 days of conflict, financial markets finally have a clearer framework to price in developments. However, with Iran’s nuclear ambitions still unresolved, the coming two months could be just as pivotal as the period that preceded them.
A US-Iran memorandum of understanding (MOU) has created a pathway toward a formal peace agreement that could be finalized within 60 days.
Brent crude has plunged and the US dollar has softened as investors unwind positions established to hedge against geopolitical tensions.
Gold has continued to advance, reflecting lingering caution over unresolved nuclear-related risks.
EUR/USD bulls are targeting a key resistance area overhead.
Following more than three months of war, an official MOU is now in place and could serve as the foundation for a comprehensive peace accord within the next 60 days. Iran has confirmed the agreement, while a formal signing ceremony is scheduled to take place in Switzerland on Friday.
As expected, the announcement has triggered a sharp reversal of geopolitical risk trades. Even so, markets remain far from pre-conflict conditions, as investors are still concerned about how easily negotiations could break down. Iran’s nuclear program and uranium stockpiles remain major obstacles to a lasting settlement. Those concerns were highlighted just hours before the agreement, when Israel and Hezbollah were still exchanging missile strikes, underscoring the fragility of the situation.
Trump, meanwhile, presented a far more optimistic narrative on Truth Social, proclaiming that “the deal with the Islamic Republic of Iran is now complete.” He said the Strait of Hormuz would reopen and that the US naval blockade would be removed, concluding with the message: “Ships of the world, start your engines. Let the oil flow!”
Brent Crude Approaches Key Support Zone
Following the diplomatic breakthrough, Brent crude — the global oil benchmark — extended its decline to fresh multi-month lows, slipping into the low-$80s for the first time since mid-April, when an earlier agreement to reopen the Strait of Hormuz was announced. Markets appear to be betting that this latest deal could have a more lasting impact.
After breaking below both its 100-day moving average and the 50% Fibonacci retracement of the Iran-war rally late last week, Brent is now closing in on a key technical support zone around $80 per barrel. This level has repeatedly acted as both support and resistance over extended periods and previously triggered significant bullish reversals when tested during the conflict, making it the most important downside level in the near term.
A decisive break below $80 could shift attention to the 200-day moving average near $77, followed by an unfilled price gap between $76 and $73.55. The latter marks Brent’s closing price on February 27, just before the outbreak of the Iran conflict.
On the upside, the first notable resistance level sits at $88.65, representing the 50% retracement of the war-driven advance. Any rebound toward this area would likely coincide with renewed concerns about the durability of the peace process.
Technical indicators continue to favor the bears. Both the RSI (14) and MACD point to strengthening downside momentum, suggesting that short positions remain more attractive than longs while the current trend persists.
DXY Tests Key Support as Selling Pressure Intensifies
The US Dollar Index (DXY) opened the week with a downside gap, slipping below a key support area defined by the May uptrend line and horizontal support at 99.51. This zone is now the immediate battleground for price action. A decisive break beneath it could pave the way for a deeper decline toward the May 29 low of 98.75, with additional support found near the convergence of the 50-day, 100-day, and 200-day moving averages.
If buyers manage to regain control and push the index back above the broken support zone, attention would shift to last week’s high at 100.31, which represents the first significant resistance level overhead.
Momentum indicators are beginning to tilt in favor of the bears, although they have yet to generate a definitive sell signal. The RSI (14) is drifting back toward the neutral 50 mark, indicating fading bullish momentum, while the MACD appears close to a bearish crossover despite remaining in positive territory. For now, the signals serve more as a warning to dollar bulls than a clear invitation for aggressive short positioning.
EUR/USD Rally Encounters Key Resistance
EUR/USD broke above a resistance area formed by the 23.6% Fibonacci retracement of the January–March decline and the May 21 low at 1.1577 at the start of the week, allowing the pair to test the ascending trendline that has guided price action higher since the March lows. However, the pair briefly touched this trendline before retreating, making it the key resistance level to monitor in the near term.
A sustained move above the trendline would expose an even more formidable resistance cluster overhead. This zone includes the 50-day, 100-day, and 200-day moving averages, horizontal resistance around 1.1670, and a descending trendline extending from the January highs. Together, these levels form a significant technical barrier that could prove difficult for euro bulls to overcome, even amid the current supportive backdrop.
On the downside, if the March uptrend continues to cap gains, the former breakout area around 1.1577—marked by the 23.6% Fibonacci retracement and the May 21 low—may now act as initial support. A break below this level would shift focus toward the June lows near 1.1500.
Momentum indicators are currently sending neutral signals. The RSI (14) has broken above its recent downtrend, suggesting selling pressure is easing, while the MACD has just crossed higher from below, although it remains in negative territory. Together, these signals indicate that the downside momentum seen in recent sessions is fading, but they do not yet point to a strong bullish breakout.
Gold: Bullish Momentum Starts to Build
Gold has staged a decisive breakout following the deal announcement, surging above $4,240, a level that had capped gains late last week. With the breakout now confirmed, this area could shift into a support zone should prices experience a near-term pullback.
On the upside, the next key level to monitor is $4,352, the low recorded on March 23, which has acted as resistance on several occasions this month. Beyond that, attention turns to the May 28 low at $4,370 and former support at $4,427. If bullish momentum continues to accelerate, traders will also be watching the 200-day moving average near $4,450, a major technical hurdle visible on the daily timeframe.
Momentum indicators are beginning to support a more constructive outlook. The RSI (14) has climbed back above the neutral 50 mark, signaling improving buying pressure, while the MACD has crossed higher from below and is rapidly approaching positive territory. Together, these developments suggest that bullish momentum is building and could support further gains in the sessions ahead.
The US Dollar Index (DXY) slipped into the lower 99.00 range as improving risk sentiment reduced demand for the safe-haven currency. Market confidence strengthened on Monday following reports of a US-Iran agreement aimed at ending the conflict. From a technical perspective, the DXY has broken below the lower boundary of its ascending channel, signaling increasing downside pressure.
The US Dollar (USD) started the week under pressure as improving market sentiment reduced demand for safe-haven assets following reports of a peace agreement between the United States and Iran. The US Dollar Index (DXY), which tracks the Greenback against a basket of major currencies, continued its pullback from last week’s peak and fell to a new 10-day low near 99.30.
Market participants responded positively to news of a memorandum of understanding between Washington and Tehran aimed at ending the 100-day conflict and restoring access through the Strait of Hormuz. While details of the deal remain limited, investors have reacted with cautious optimism, leading to lower US Treasury yields and a weaker Dollar, while risk-sensitive assets attracted stronger demand.
Technical Analysis: DXY Falls Back Below Channel Resistance
The US Dollar Index (DXY) is hovering near 99.50 at the time of writing, maintaining a bearish short-term outlook after slipping below the lower boundary of its ascending channel. Technical indicators continue to favor the downside, with the 4-hour Relative Strength Index (RSI) falling beneath the 40 mark and the Moving Average Convergence Divergence (MACD) remaining in negative territory, both pointing to fading bullish momentum.
Despite the bearish bias, sellers have so far struggled to push the index below the intraday low of 99.38. A break beneath this level could pave the way for a decline toward the June 4–5 lows around 99.15, followed by the late-May support zone near 98.75.
On the upside, the area around 99.65—where the former channel support intersects with a previous support zone marked by the June 9, 11, and 12 lows—is expected to act as strong resistance. A decisive recovery above this barrier could open the door to the key psychological level at 100.00, with the June 11 high near 100.30 becoming the next target.
The NASDAQ 100 has experienced choppy price action this week as traders continue searching for clearer market direction. Despite the short-term uncertainty, the broader outlook remains bullish. However, ongoing geopolitical developments and headline-driven volatility could create additional risks, making it prudent to remain cautious rather than aggressively increasing exposure at current levels.
While the index continues to trade within a longer-term uptrend, investors may be wary heading into the weekend due to the possibility of unexpected developments in the Middle East that could impact market sentiment. Even so, the overall technical picture remains constructive, and any meaningful pullback is likely to be viewed as a buying opportunity, with traders looking to capitalize on potential rebounds within the prevailing bullish trend.
Gold
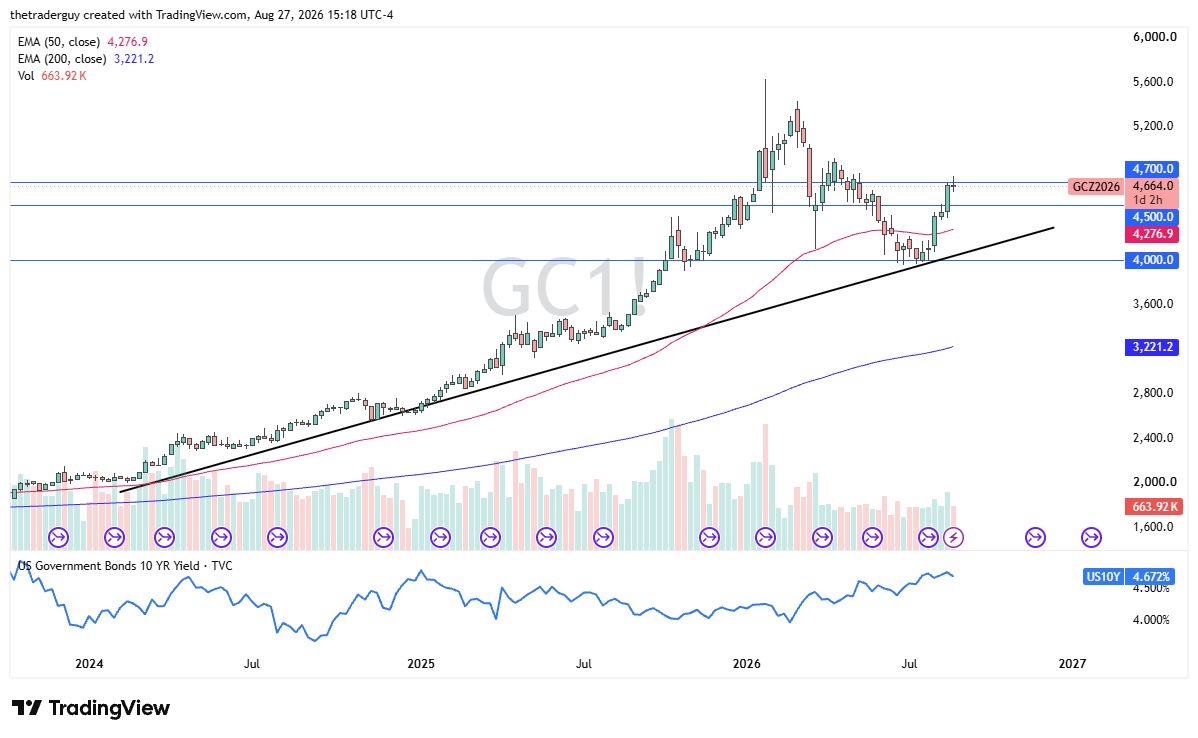
The gold market came under notable selling pressure at the start of the week, declining sharply and briefly testing the key $4,000 support level. This area remains a critical technical zone and is likely to attract close attention from traders in the coming sessions.
Gold prices continue to be heavily influenced by interest rate expectations. Recently, bond yields have edged lower as market participants speculate that the United States and Iran may be moving closer to a diplomatic agreement, reducing some geopolitical uncertainty and affecting demand for safe-haven assets.
From a longer-term perspective, the outlook for gold remains bullish. However, volatility is expected to remain elevated, and traders should be prepared for significant price swings. A sustained break below the $4,000 support level could trigger a deeper correction and lead to a more pronounced sell-off, making this a crucial level to monitor.
Silver
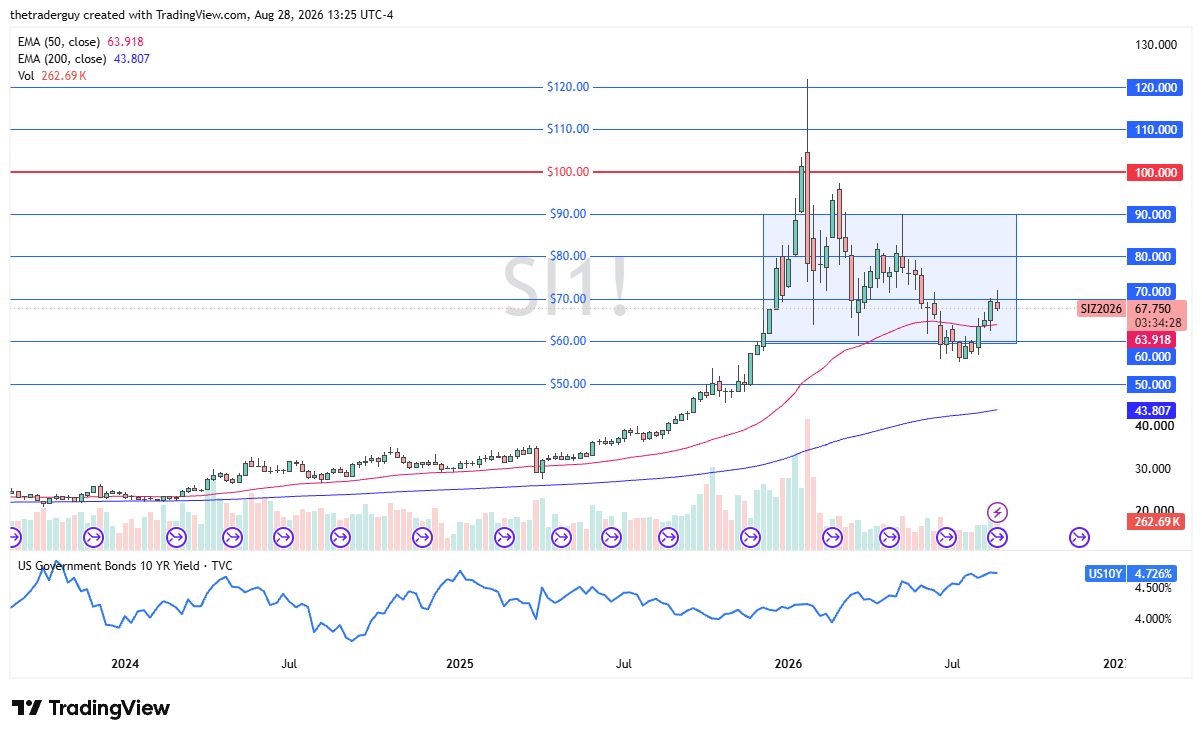
The silver market experienced volatile and uneven trading throughout the week, with price action remaining relatively noisy. Despite the fluctuations, the $60 level appears to be emerging as an important support zone and could serve as a near-term floor for the market.
On the weekly chart, the current candlestick is beginning to resemble a hammer pattern, which is often viewed as a potential bullish signal. It is also worth noting that much of the recent upward momentum was driven by Friday’s gap higher, suggesting that short-covering activity ahead of the weekend may have contributed significantly to the rally.
Looking ahead, a decisive break above the $70 level could signal a continuation of bullish momentum. If that resistance is cleared, silver may have the potential to advance another $10 relatively quickly as buyers regain control of the market.
DAX
Germany’s DAX index declined during the week, testing the important €24,000 support level before rebounding and showing renewed signs of strength. The recovery suggests that buyers remain active at lower levels, helping to stabilize the market after the recent pullback.
At present, the index appears to be trading within a broad consolidation range, with support near €24,000 and resistance around €25,000–€25,250. This upper zone continues to act as a significant barrier, limiting further upside progress in the short term.
The overall outlook remains moderately bullish, but expectations for explosive gains are limited. Instead, the DAX continues to favor a “buy-the-dip” approach, with traders likely viewing pullbacks as opportunities to enter long positions. Before a more substantial upward move can develop, the market may need additional time to build momentum and establish a stronger foundation above current levels.
S&P 500
The S&P 500 posted modest losses during the week, but the 7,300 level continues to provide strong support, a pattern that has been observed on several occasions in recent months. Buyers have consistently stepped in around this area, helping to maintain the broader bullish structure of the market.
On the upside, the 7,500 level remains an important resistance zone. However, a decisive breakout above 7,600 could serve as a catalyst for a stronger bullish move, potentially opening the door to a fresh leg higher in the ongoing uptrend.
The preferred strategy remains buying on pullbacks, although traders should be prepared for increased volatility. Seasonal summer trading conditions, concerns surrounding the bond market, and ongoing geopolitical tensions in the Middle East could contribute to choppy price action in the near term. Nevertheless, the overall outlook remains constructive. The market is still firmly in an uptrend, and while momentum has slowed somewhat, the underlying bullish trend remains intact.
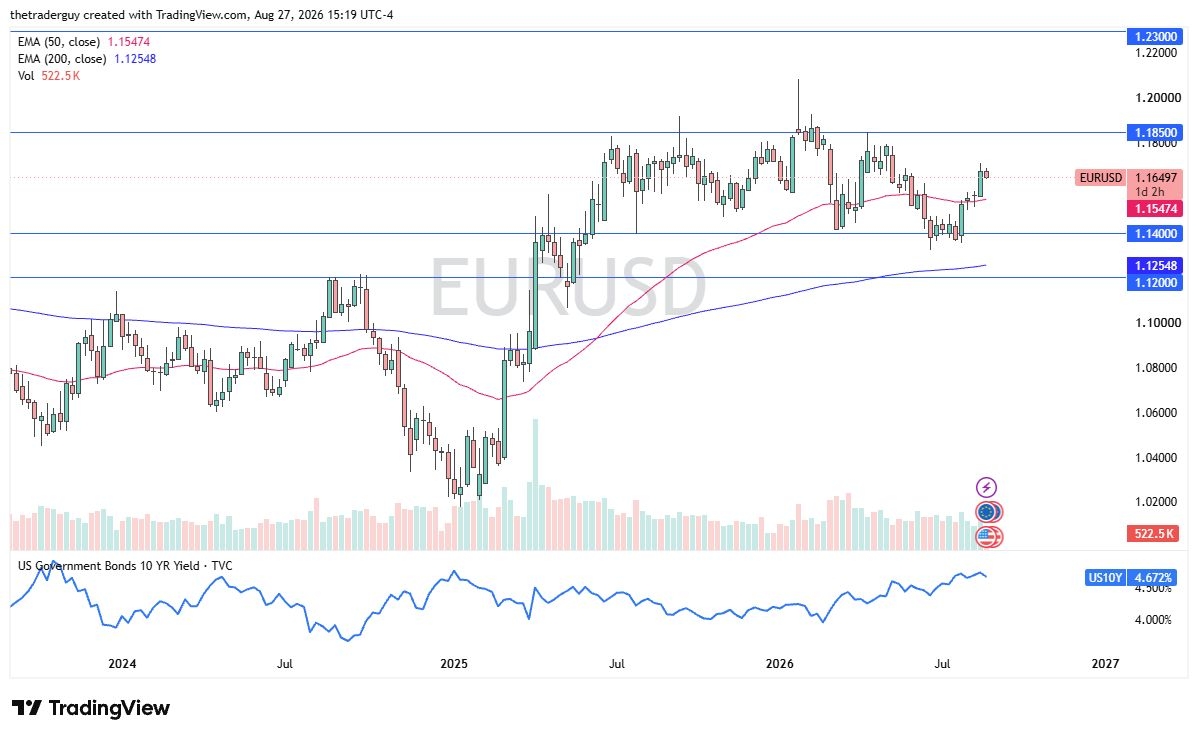
EUR/USD
The euro strengthened against the U.S. dollar during the week, but the broader market structure remains largely range-bound. Despite the recent rally, EUR/USD appears to be trapped within a well-established trading range that has been in place since July 2025, with the 1.16 level serving as a key equilibrium or “fair value” area.
Given the current price dynamics, the pair may continue gravitating toward the middle of this range, with the 1.1600–1.1650 zone likely acting as an important area for traders to reassess market direction. Whether the euro can sustain further gains from there remains uncertain and will depend on broader macroeconomic developments.
One key indicator to monitor is the U.S. 10-year Treasury yield. Rising yields typically support the U.S. dollar by increasing the attractiveness of dollar-denominated assets. As a result, if Treasury yields begin moving higher, EUR/USD could come under renewed selling pressure and potentially reverse some of its recent gains. Overall, the pair continues to trade without a clear long-term directional bias, favoring a range-trading environment for now.
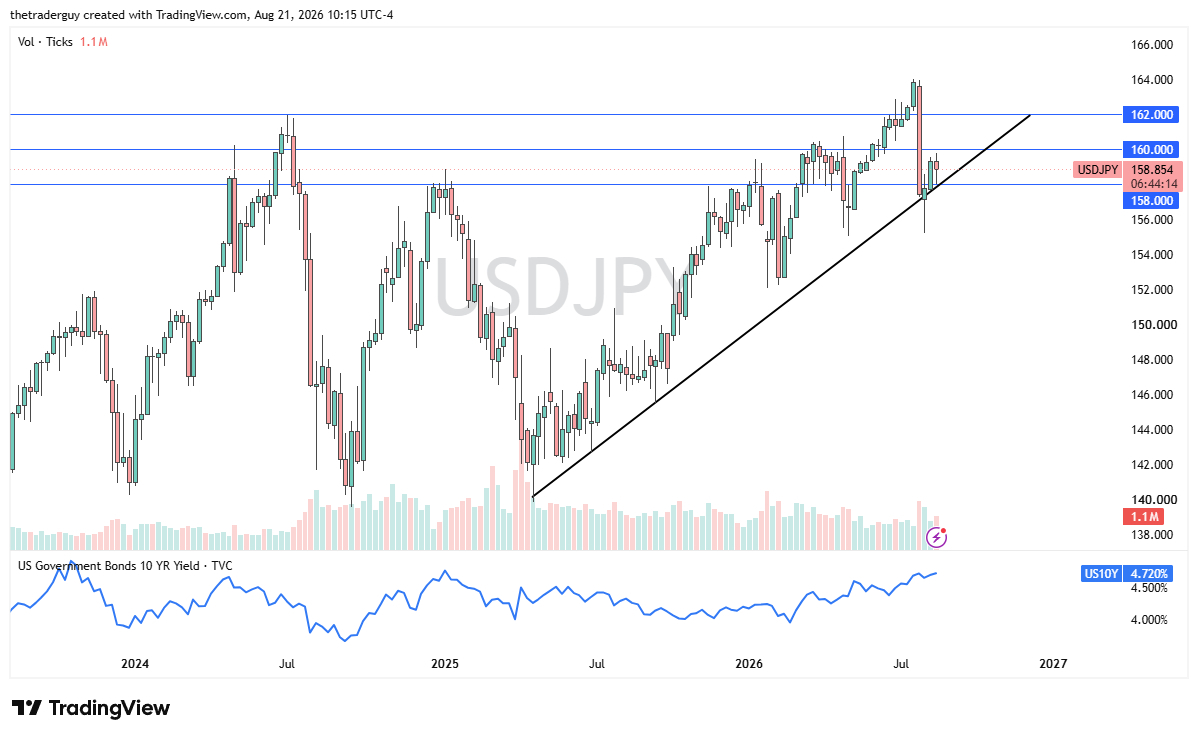
USD/JPY
The U.S. dollar traded largely sideways against the Japanese yen during the week, as the market continued to test a major resistance area near a swing high dating back to 1990. Although USD/JPY briefly moved above this level in 2024, the breakout lacked sustained momentum, leaving traders focused on whether a more decisive move higher can develop.
A key factor influencing sentiment is the possibility of intervention by the Bank of Japan. The central bank’s intervention several weeks ago helped slow the pair’s advance, but its long-term effectiveness remains uncertain. Many market participants believe that intervention alone may not be enough to reverse the broader trend.
From a fundamental perspective, the interest rate differential between the United States and Japan continues to favor the U.S. dollar, supporting a bullish outlook for USD/JPY. As a result, short-term pullbacks are still viewed as potential buying opportunities. Unless there is a significant shift in monetary policy or economic conditions, the pair appears positioned for another attempt at a sustained breakout. Even if intervention temporarily pushes prices lower, such declines could attract buyers looking to re-enter the market at more favorable levels.
USD/MXN
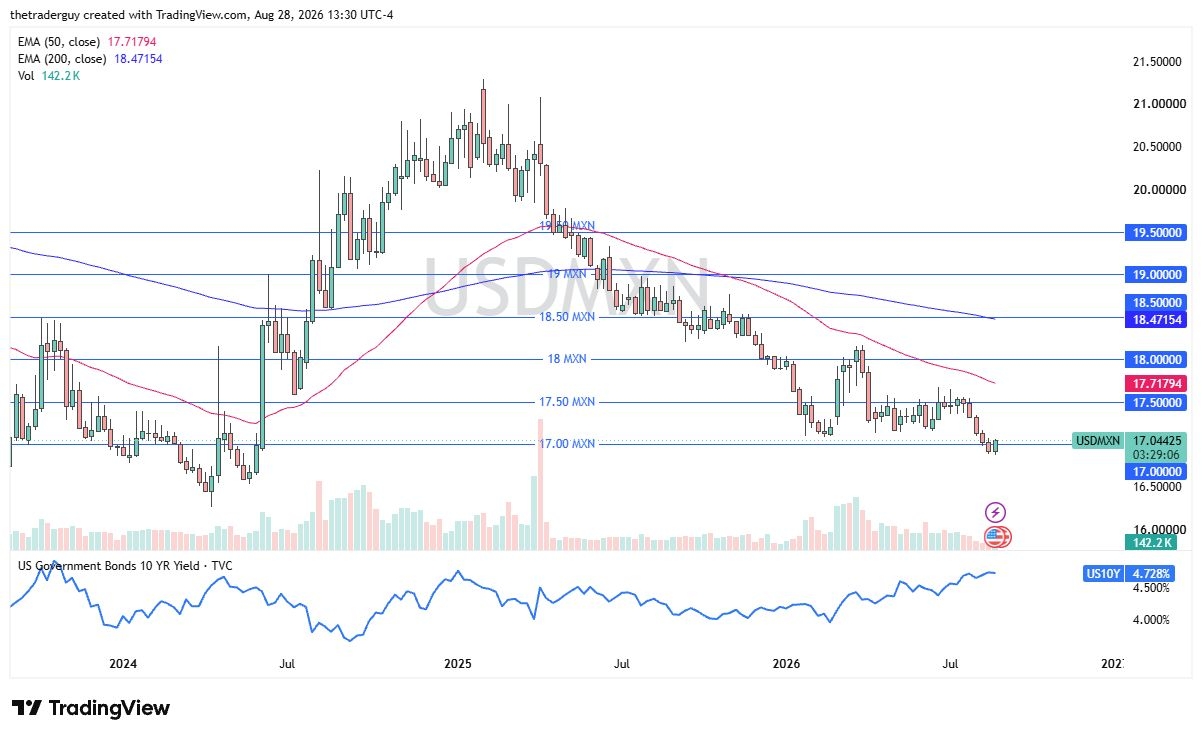
The U.S. dollar weakened against the Mexican peso during the week, a move that aligns with the pair’s recent technical structure. The 17.50 level has continued to act as a significant resistance zone, limiting upside attempts and reinforcing the broader range-bound environment.
On the downside, the 17.00 level remains an important area of support. With resistance clearly defined above and support holding below, USD/MXN appears likely to continue trading sideways in the near term, lacking a strong catalyst for a sustained breakout in either direction.
From a fundamental perspective, the interest rate differential continues to favor Mexico, making the peso relatively attractive compared with the U.S. dollar. As a result, short-term rallies in USD/MXN may continue to attract sellers. However, expectations for large directional moves remain limited. Ongoing uncertainty surrounding global risk sentiment, trade conditions, and supply-chain dynamics suggests that traders may prefer a cautious approach rather than taking aggressive positions in a currency pair that is often more sensitive to shifts in investor appetite for risk.
The US Dollar Index advances to near 99.80 during Friday’s Asian trading hours.
US military forces intercepted Iranian drones targeting vessels near the Strait of Hormuz.
US Producer Price Index inflation rose to its highest annual level since November 2022, while the monthly increase matched April’s pace.
The US Dollar Index (DXY), which tracks the US Dollar (USD) against a basket of six major currencies, trades near 99.80 during Friday’s Asian session. The index gains momentum as rising Middle East tensions and stronger-than-expected US inflation data support demand for the Greenback. Investors now await the preliminary June reading of the Michigan Consumer Sentiment Index, due later on Friday.
According to Fox News, US forces intercepted and destroyed two Iranian one-way attack drones near the Strait of Hormuz after Iran allegedly attempted to target commercial vessels passing through the critical shipping route.
The incident came shortly after US President Donald Trump stated on Thursday that he had called off additional military strikes on Iran, citing progress in negotiations toward a final agreement. Growing geopolitical uncertainty in the Middle East may continue to underpin the US Dollar in the near term.
Meanwhile, data released by the US Bureau of Labor Statistics on Thursday showed that producer inflation accelerated more than expected in May, reaching its highest annual level since November 2022. The Producer Price Index (PPI) rose 6.5% year-over-year, up from 5.7% previously and slightly above market expectations of 6.4%. On a monthly basis, PPI increased 1.1% in May, surpassing forecasts of 0.7%.
Core PPI, which excludes volatile food and energy prices, advanced 4.9% annually, matching April’s reading but falling short of the expected 5.4%. Even so, persistent inflation pressures are likely to keep the Federal Reserve (Fed) cautious about easing monetary policy anytime soon.
According to the CME FedWatch Tool, markets are currently pricing in a 43% probability of a quarter-point interest rate hike in December, compared with roughly 14% a month ago.
GBP/USD ticks up to around 1.3385 during Thursday’s Asian trading session. Rising expectations for additional US interest rate hikes, fueled by stronger-than-expected economic data, continue to support the US Dollar. Meanwhile, officials from the Bank of England (BoE) have indicated that the central bank is in no hurry to tighten monetary policy further.
The GBP/USD pair extends its recovery and climbs toward the 1.3385 area during Thursday’s Asian session. However, gains may remain capped as investors increasingly expect US interest rates to stay elevated for longer. Market participants are also adopting a cautious stance ahead of the release of the US Producer Price Index (PPI) later in the day.
Strong US labor market figures and persistent inflation pressures have reinforced the Federal Reserve’s higher-for-longer policy outlook, providing support for the US Dollar and limiting upside potential for GBP/USD.
According to the CME FedWatch Tool, markets now assign a 43.7% chance of a 25-basis-point rate hike in December, a significant increase from roughly 14% just one month ago.
Attention now turns to the upcoming US PPI report, which could offer fresh clues about the Fed’s policy trajectory under Chairman Kevin Warsh. Several major financial institutions have already pushed back their expectations for rate cuts, with Goldman Sachs forecasting that the Fed will keep rates unchanged through 2026 and not begin easing until 2027.
In the UK, Bank of England policymaker Alan Taylor recently stated that current interest rates are already restrictive enough and that additional tightening is unnecessary, despite inflationary risks linked to the Iran conflict. Meanwhile, BoE Governor Andrew Bailey reiterated last week that the central bank is “in no rush” to raise rates.
Traders are now looking ahead to Friday’s UK monthly GDP figures, which could provide further insight into the outlook for the UK economy and the future path of BoE monetary policy.
USD/CAD ticks lower on Thursday but struggles to extend its decline as traders navigate a mix of conflicting market signals. Stronger crude oil prices continue to support the Canadian Dollar, while a slight pullback in the US Dollar helps limit the pair’s upside. However, ongoing geopolitical uncertainties and contrasting monetary policy outlooks between the Federal Reserve and the Bank of Canada provide underlying support to USD/CAD.
The USD/CAD pair is struggling to build on its rebound from the 1.3900 area, a level that marked this week’s low, and is edging lower during Thursday’s Asian trading session. Despite the pullback, the pair remains close to Tuesday’s year-to-date peak, hovering just below the mid-1.3900s and posting a modest daily loss of less than 0.10% as investors weigh conflicting market drivers.
The Canadian Dollar finds support from rising crude oil prices after Iran announced the closure of the Strait of Hormuz in response to a new wave of US military strikes ordered by President Donald Trump. The geopolitical escalation has helped oil recover from Tuesday’s near two-month low, strengthening the commodity-linked Loonie. A softer US Dollar is also contributing to downside pressure on USD/CAD.
At the same time, escalating tensions between Washington and Tehran continue to underpin demand for the US Dollar as a safe-haven asset. Iran’s joint military command has vowed a “decisive and crushing” response to any US aggression in the region, heightening concerns over a broader conflict. Additionally, the surge in energy prices is reinforcing inflation fears and supporting expectations that the US Federal Reserve could maintain a more hawkish policy stance.
Market participants are now pricing in more than a 70% probability of a Fed rate increase before year-end, according to CME FedWatch data. Those expectations gained momentum after US inflation data showed the Consumer Price Index rising 4.2% year-over-year in May, the highest reading in three years. In contrast, the Bank of Canada remains relatively dovish, with policymakers placing greater emphasis on supporting economic growth despite inflation risks.
The policy divergence between the Fed and the BoC is likely to provide a floor for USD/CAD and may limit the pair’s downside potential. As a result, traders may prefer to wait for stronger selling momentum before concluding that the recent uptrend has ended. Attention now shifts to the upcoming US Producer Price Index release, while developments in the Middle East and movements in oil prices are expected to remain key drivers of market sentiment.
EUR/USD advances toward 1.1550 as investors await the ECB’s upcoming monetary policy decision. Expectations that the central bank could tighten policy further to address persistent inflation pressures are lending support to the euro. Meanwhile, escalating tensions in the Middle East are boosting safe-haven demand for the US Dollar, which may limit the pair’s upside potential.
The EUR/USD pair edges higher toward the 1.1550 level during Thursday’s Asian session as traders position themselves ahead of the European Central Bank’s (ECB) policy decision scheduled for 12:15 GMT.
Market participants widely expect the ECB to raise its Deposit Facility Rate by 25 basis points to 2.25%, aiming to address mounting inflationary pressures fueled by elevated energy costs. Such a move would mark the central bank’s first policy adjustment after eight consecutive meetings without changes.
Recent comments from several ECB policymakers have reinforced expectations of tighter monetary policy, with officials highlighting growing upside risks to inflation stemming from ongoing energy supply disruptions. Investors will closely scrutinize remarks from ECB President Christine Lagarde for clues on whether inflationary pressures could generate broader second-round effects across the Eurozone economy.
Meanwhile, the US Dollar has recovered part of its earlier losses as concerns mount that the fragile ceasefire between Iran and the United States could unravel following renewed military exchanges. Despite the rebound, the US Dollar Index (DXY) remains modestly lower on the day, trading around 99.97 at the time of writing.
Technical Analysis
EUR/USD is trading slightly higher near 1.1550 at the time of writing, but the broader technical outlook remains bearish following a breakdown from a Symmetrical Triangle pattern and the presence of a downward-sloping 20-period Exponential Moving Average (EMA), currently positioned at 1.1603.
Momentum indicators also point to persistent downside risks. The Relative Strength Index (RSI) remains below the 40.00 threshold, signaling renewed selling pressure while still staying comfortably above oversold territory.
On the upside, immediate resistance is seen at the 20-period EMA near 1.1603. Additional barriers emerge at 1.1623, where a previously supportive ascending trend line has turned into resistance, followed by a stronger descending trend-line resistance around 1.1707. On the downside, a break below the June 8 low near 1.1500 could accelerate losses toward the March 16 low at 1.1411.
The DXY is trading in a tight range just below the 100 level after last week’s strong rebound, with today’s May CPI report set to determine whether the recovery can extend further.
Markets expect headline inflation to climb above 4.0% year-over-year for the first time since May 2023, while core CPI is forecast to rise 0.3% month-over-month and 2.9% annually. A result in line with expectations would reinforce expectations of a Federal Reserve rate hike in December, providing continued support for the dollar.
The main downside risk lies in a softer core inflation reading. With shelter accounting for nearly 45% of the core CPI basket and rental inflation showing signs of moderation, a 0.2% monthly increase instead of 0.3% could push DXY back toward the 99.50–99.60 area. However, such a move would likely be viewed as a temporary pullback rather than a broader trend reversal, especially with tomorrow’s PPI release and next week’s FOMC meeting likely to keep demand for the greenback intact.
Outside of inflation data, equity markets remain volatile as investors reposition ahead of Friday’s SpaceX IPO. Meanwhile, Oracle’s earnings report after today’s market close will offer fresh insight into the strength of the AI-driven data centre sector during a sensitive period for technology stocks. Adding to the dollar’s support, investors directed $99 billion into USD money market funds last week—the largest weekly inflow of 2026—highlighting strong institutional demand for safe-haven assets.
Technical Analysis
The DXY has staged a strong rebound from its mid-May low near 97.80, climbing back above the psychologically important 100 level before easing slightly to around 99.85 in early trading. Immediate resistance is located in the 100.40–100.60 zone, which corresponds to the lower boundary of the former April trading range. A decisive break above this area would strengthen the case for a broader bullish reversal.
If CPI data comes in weaker than expected, the index could initially retreat toward the 99.50–99.60 region. A deeper decline would bring the critical support area between 99.00 and 99.20 into focus. While the broader momentum continues to favor further gains, today’s inflation report is likely to determine whether the dollar can extend its recovery or face a temporary setback.
Political friction and weakening economic data are putting downward pressure on the British Pound. Ahead of Friday’s critical April GDP release, markets are weighing the threat of a recession against the likelihood of more Bank of England rate hikes aimed at curbing energy-driven inflation. This cautious sentiment is deepened by a high-stakes leadership challenge within the ruling Labour Party, prompting major financial institutions to downgrade their short-term outlook for Sterling.
Weak Growth and Fiscal Vulnerabilities Threaten to Drag Down the Pound
Macro strategists at Brown Brothers Harriman (BBH) warn that the British Pound is highly vulnerable to a sharp drop against the US Dollar. This risk is driven by a combination of a shrinking UK economy and persistent stagflationary pressures. While the Bank of England (BOE) is expected to step in to control inflation, potential political instability could undermine the nation’s fiscal credibility, accelerating the currency’s decline.
Key Takeaways:
GBP/USD Forecast: The exchange rate is projected to slide to 1.3100, reflecting a stronger US economic outlook compared to the UK’s.
The BOE’s Dilemma: Raising interest rates during a period of low growth and high inflation won’t spark a bullish run for the Pound, though it should help cushion its fall.
Political Risk: Any upcoming leadership shake-ups could damage fiscal trust, worsening the currency’s downward trajectory.
Uncertainty Surrounds the Bank of England’s Next Steps
Economists at Societe Generale suggest that the political buzz surrounding Manchester Mayor Andy Burnham’s bid for the Labour leadership is unlikely to trigger drastic policy shifts in the near term. Meanwhile, the Bank of England’s (BoE) monetary policy outlook remains mixed. While aggressive, hawkish members of the Monetary Policy Committee (MPC) are strongly advocating for an immediate interest rate hike, the broader consensus points toward a more cautious, “wait-and-see” approach.
Key Takeaways:
Rate Decision Outlook: The BoE is expected to keep interest rates unchanged for the June meeting.
MPC Division: Members pushing for a rate hike are anticipated to remain in the minority.
Political Impact: Political noise from the Labour leadership contest is expected to have a limited impact on the broader economic landscape.
Major Banks Forecast a Downward Bias for the British Pound
Major financial institutions expect the British Pound to face a weak outlook. While both institutions anticipate a lack of upward momentum, their specific forecasts differ based on economic drivers:
Brown Brothers Harriman (BBH): Maintains an explicitly bearish stance, predicting the GBP/USD pair will drop to 1.3100. This is driven by the UK’s weak growth narrative underperforming compared to a stronger US economy.
Societe Generale: Foresees a more range-bound, stagnant path. They believe the Pound lacks immediate upward momentum because the Bank of England is expected to hold interest rates steady rather than pursuing aggressive hikes.
US Dollar Index Outlook: Bullish Momentum Supported by Climbing 20-Day EMA
DXY Slips: The US Dollar Index pulled back to near 99.90.
Geopolitical Driver: Optimism grew after President Trump stated that US-Iran negotiations are in their final stages, with a deal possible in two to three days.
Next Catalyst: Market focus is shifting to the upcoming release of May’s US CPI data.
The US Dollar (USD) experienced mild downward pressure during Tuesday’s European trading session, sparked by renewed optimism surrounding a potential agreement between the United States and Iran. At the time of reporting, the US Dollar Index (DXY), which measures the Greenback’s performance against a basket of six major currencies, dipped 0.1% to hover around 99.90.
According to The Guardian, prospects for a US-Iran agreement have improved following remarks from President Donald Trump, who stated that negotiations are in their “final throes” and hinted that the critical Strait of Hormuz could reopen within days if a deal is finalized. This development is bearish for the US Dollar, which had previously rallied on the back of soaring energy prices caused by the strait’s closure. High energy costs had been driving US inflation and fueling hawkish expectations for the Federal Reserve.
Back home, the market is bracing for Wednesday’s release of the May Consumer Price Index (CPI) data. Headline inflation is projected to climb to 4.2% year-on-year, up from April’s 3.8%. Any signs of accelerating inflation will likely bolster expectations for Fed rate hikes, especially after last week’s robust Nonfarm Payrolls (NFP) report already intensified hawkish sentiment over the last two trading sessions.
DXY Technical Analysis
The US Dollar Index (DXY) spot is ticking slightly lower near 99.90. However, the short-term outlook remains bullish as the price holds above its 20-day exponential moving average (EMA) at approximately 99.30. This level sits well above the ascending trend-line support originating from the 95.55 region, which is currently tracking near 98.34.
Furthermore, the 14-day Relative Strength Index (RSI) is hovering in the low 60s, indicating healthy upward momentum without entering overbought territory. This supports a constructive outlook while the index consolidates just beneath the crucial 100 psychological level.
On the downside, immediate support rests at the 20-day EMA (99.30), followed by stronger support at the rising trend line near 98.34. A daily close beneath this lower threshold would damage the bullish setup and invite a deeper correction. Conversely, an upside break above the June 8 high of 100.20 could clear the way for the index to revisit its one-year peak at 100.64.
The Australian Dollar is projected to experience a measured decline, heading toward the 0.7000 mark against the US Dollar.
Daily Forecast (Next 24 Hours)
UOB analysts Quek Ser Leang and Lee Sue Ann expect the Australian Dollar to stabilize and trade within a 0.7015 to 0.7065 range today. While the currency briefly dipped to 0.7016 shortly after yesterday’s market open—approaching the projected 0.7020 support level—a subsequent recovery to 0.7078 has successfully mitigated immediate downward momentum.
Short-Term Outlook (1–3 Weeks)
The broader near-term bias remains tilted to the downside. Following a sharp sell-off last Friday that triggered building downward momentum, the analysts maintain that AUD/USD is on track to weaken toward 0.7000. This bearish outlook stays intact provided the currency does not break above the strong resistance level at 0.7105.
Long-Term Outlook (Multi-Month)
Looking further ahead, the structural risks for the pair point toward a gradual decline, with a major floor and significant technical support expected around 0.7040.
Traders are currently holding the biggest short position on the U.S. dollar in six months. However, when positioning becomes overly one-sided, markets often move in the opposite direction.
The “debasement trade” was built on expectations of Fed rate cuts and easing inflation. But instead, inflation has reaccelerated, with April CPI at 3.8% and PPI at 6%, leaving the Fed on hold potentially through 2027.
While the inflation surge is largely driven by energy prices, underlying service-sector inflation remains persistent, limiting the Fed’s ability to ease policy even if oil prices decline.
A stronger U.S. dollar acts as a channel for global monetary tightening, weighing on assets like gold, silver, and oil, while also creating an asymmetric setup for long-duration Treasury bonds.
The preferred strategy is a barbell approach: holding short-term Treasury bills for stable yield with minimal duration risk, while gradually adding long-duration exposure as 30-year yields move toward the 5% level.
The most crowded short in U.S. markets isn’t in equities or big tech—it’s the U.S. dollar. Earlier this year, speculators extended dollar selling for eight consecutive weeks, while asset managers turned net short on the DXY for the first time in months.
Across macro funds, the positioning is strikingly uniform: expectations for a weaker dollar, stronger gold and commodities, and a broader narrative of currency debasement. In that context, the “strong dollar” trade—effectively betting against this consensus—has become the potential pain trade heading into 2026. When positioning becomes one-sided, the market often moves in the opposite direction.
In macro terms, positioning is one of the clearest signals of vulnerability, revealing where consensus is most exposed. At present, that exposure is heavily skewed to one side.
According to Saxo’s COT analysis for early January, non-commercial positioning in IMM FX futures showed roughly $11.9 billion in net dollar shorts, the largest bearish exposure in about six months. Asset managers had also shifted to a net short DXY stance for the first time since mid-October, aligning with leveraged funds in a broadly bearish dollar view. As Bob Farrell’s Rule #9 notes, when consensus becomes near-unanimous, the market is often closest to a reversal.
The flaw in the dollar-bearish narrative is that it was built on expectations that never materialized. The market assumed the Federal Reserve would begin cutting rates, inflation would continue easing, and foreign currencies such as the euro, yen, and many emerging-market currencies would benefit from an improving global growth outlook.
Instead, inflation has remained stubbornly elevated. April CPI rose 3.8% year-over-year, its highest reading since May 2023, while PPI accelerated to 6%, marking the strongest pace since 2022. Core PPI, which strips out food and energy prices, climbed to 5.2%, underscoring persistent underlying price pressures.
As a result, markets have dramatically reassessed the policy outlook. Expectations for Fed rate cuts throughout 2026 have largely been priced out, while the probability of a rate hike before year-end has rebounded to roughly 35%–39%.
With inflation proving more persistent and monetary easing no longer imminent, the foundation of the widespread short-dollar trade has weakened considerably. The assumptions that justified betting against the dollar are no longer supported by the data.
A fair counterargument to the strong-dollar view is that much of the recent inflation surge can be traced back to energy. The U.S.–Iran conflict that erupted in late February pushed crude oil to its highest levels in four years, making energy the primary driver of both the CPI and PPI increases. Remove food and energy from the equation, and core CPI comes in at 2.8% rather than the headline 3.8%.
From the debasement perspective, the case is straightforward: inflation is being distorted by a temporary oil shock. If crude prices retreat, headline inflation should ease, giving the Federal Reserve room to resume rate cuts and reviving the bearish-dollar thesis.
The challenge with that argument is what lies beneath the surface of the inflation data. April’s PPI report showed that services accounted for roughly 60% of the monthly increase, marking the strongest services inflation since 2022. Meanwhile, core producer prices excluding food, energy, and trade services rose 4.4% year-over-year.
That matters because services inflation is not simply a reflection of higher fuel costs. It points to broader price pressures spreading through the economy, supported by resilient demand and continued economic strength. Unlike an oil-driven spike, these pressures tend to be more persistent and do not disappear as soon as energy prices decline. Even if crude retreats, the underlying inflation trend may prove sticky enough to keep the Fed cautious and delay the policy easing that dollar bears have been counting on.
The bearish-dollar thesis depended on two key developments: easing inflation and Federal Reserve rate cuts. At this point, neither appears to be materializing.
The Hawkish Shift Supporting the Dollar
The confirmation of Kevin Warsh as Fed Chair on May 13 reinforces the possibility of a more hawkish policy environment. The irony is notable. While Warsh was widely expected to support lower rates and has previously acknowledged room for monetary easing, he has spent years criticizing quantitative easing and advocating for a smaller Fed balance sheet. Now he finds himself facing a backdrop of accelerating inflation that limits his flexibility.
Even if Warsh would prefer to deliver the rate cuts many investors anticipated, current economic conditions may not allow it. Following the April CPI release, analysts such as Krishna Guha argued that the inflation data strengthened the case of policymakers who believe the Fed’s next move could be a hike rather than a cut.
The market’s expectations have shifted accordingly. Goldman Sachs has pushed its forecast for the next rate cuts to December 2026 and March 2027, envisioning only two quarter-point reductions over that period. With producer inflation accelerating, oil prices elevated, and labor-market conditions remaining firm, the environment looks far less supportive of a weaker dollar than many investors had expected.
Why the Dollar Trade May Still Be Early
Although the Dollar Index has rebounded from below 97 in late April to around 98.8 by mid-May, the broader move remains modest. The dollar is still lower on the year by roughly 1.5%, meaning the bullish-dollar trade has yet to become crowded.
That is precisely what makes the setup interesting. Investor positioning remains heavily skewed toward dollar weakness, while the fundamental catalysts increasingly point in the opposite direction. If expectations continue to shift toward higher-for-longer rates, the dollar could have significant room to appreciate simply because so few investors are positioned for that outcome.
The 1970s Comparison May Be Misleading
A common argument among dollar bears is that the current environment resembles the inflationary 1970s, implying sustained currency debasement and negative real returns. However, the real-yield backdrop today looks fundamentally different.
Using April’s 3.8% CPI reading, realized real yields remain positive:
2-year Treasury: approximately +0.1%
10-year Treasury: approximately +0.7%
Fed funds rate: approximately +0.7%
Meanwhile, the 10-year Treasury Inflation-Protected Securities (TIPS) market implies a real yield near 1.95%, reflecting investors’ expectations for future inflation rather than current price growth.
Those figures are not especially restrictive, but they are far removed from the 1970s experience, when real yields frequently plunged to around -5%. That distinction matters. Sustained dollar weakness typically requires deeply negative real returns and an aggressively accommodative central bank. Today’s environment features neither condition, suggesting the historical comparison may be overstated and that the case for a stronger dollar remains more compelling than current market positioning implies.
The key takeaway from the 1970s comparison is that while the U.S. fiscal backdrop may share some similarities—rising debt levels and significant foreign ownership of Treasuries—the economic transmission mechanism that drove the dollar’s collapse during that era is largely absent today. The 1970s featured deeply negative real interest rates, a self-reinforcing wage-price spiral, and an economy heavily dependent on oil-intensive industrial production. Without those ingredients, the historical parallel begins to break down.
What a Stronger Dollar Could Mean for Commodities
The implications are significant because many commodity markets remain positioned for the opposite outcome. Gold, silver, and crude oil have all benefited from expectations of a weaker dollar, easier monetary policy, and continued currency debasement. If the dollar strengthens instead, the underlying assumptions supporting those trades become less compelling.
Gold and silver are particularly sensitive to dollar movements. Because they are priced in U.S. dollars, a stronger greenback raises their cost in foreign currencies and can reduce international demand. Silver may face additional pressure because, unlike gold, it relies more heavily on industrial consumption, which tends to soften when financial conditions tighten and economic growth slows.
Oil presents a more complex case. On one hand, crude prices remain supported by supply concerns stemming from the U.S.–Iran conflict. On the other, a stronger dollar and slower global growth would typically weigh on demand and exert downward pressure on prices. As a result, oil is caught between geopolitical risk and macroeconomic headwinds.
According to market commentary from the delta-one desk at Goldman Sachs, a meaningful decline in crude prices could help broaden equity market participation beyond the dominant mega-cap technology names. A stronger dollar could contribute to that outcome, particularly if tensions around the Strait of Hormuz begin to ease.
Why Lower Oil May Not Mean Lower Rates
The most important aspect of the thesis is that falling oil prices do not automatically lead to Federal Reserve easing. Lower crude prices would likely reduce headline inflation, but they would do little to address the persistent services inflation embedded throughout the economy.
If services inflation remains elevated, the Fed may have little incentive to cut rates even as energy prices retreat. In that scenario, the dollar would retain support from relatively high interest rates while commodities lose support from falling inflation expectations.
That dynamic creates a challenging backdrop for the broader commodity-supercycle narrative. Much of the bullish case for gold, silver, and other dollar-denominated assets rests on the assumption of a weakening dollar and easier monetary policy. If those assumptions prove incorrect, the foundation supporting the trade becomes considerably less stable, raising the risk of a significant reversal across commodity markets.
This is where the debate diverges most sharply from the prevailing gold-and-debasement narrative. The common view is that fiat currencies and government bonds are structurally impaired, leaving hard assets as the only viable refuge. But if the dollar strengthens, the chain of effects may point in the opposite direction.
A stronger dollar acts as a powerful transmission mechanism for global financial tightening. It:
Drains liquidity from emerging markets.
Increases the burden of dollar-denominated debt for foreign borrowers.
Tightens global financial conditions.
Slows economic activity outside the United States.
Over time, that slowdown can feed back into the U.S. economy, reducing inflation pressures and lowering inflation expectations. When that happens, long-term Treasury yields tend to fall rather than rise.
This is why the bond market may be more attractive than many investors currently assume. The 30-year Treasury yield closed near 4.98% on May 11, hovering just below the 5% threshold that Michael Hartnett has identified as a level where broader market stress could emerge. If tighter financial conditions begin to weigh on growth, the long end of the Treasury curve could rally as investors seek safety and markets price in slower economic activity.
In that environment, Treasury bonds—after enduring one of their worst multi-year periods in decades—could become one of the biggest beneficiaries of a stronger-dollar regime. The irony is that the same dollar appreciation many investors dismiss as unlikely may be the catalyst that restores bonds’ traditional role as portfolio stabilizers.
Viewed through this lens, the sequence is not:
Dollar weakness → higher inflation → higher bond yields → hard assets win.
Instead, it may be:
Dollar strength → tighter global liquidity → slower growth → lower inflation expectations → lower long-term yields → bonds outperform.
That possibility is largely absent from current consensus positioning. Many investors remain heavily allocated to the debasement trade—long gold, long commodities, short duration, and short dollar. If the dollar continues to strengthen, the assets expected to benefit from inflation could face headwinds, while the most neglected trade may be a recovery in long-duration Treasury bonds.
The broader implication is that the debate may not be about whether inflation exists today, but about which force ultimately dominates: persistent inflation or the growth slowdown that tighter financial conditions can create. If the dollar becomes the vehicle for that tightening, bonds could emerge as the unexpected winner.
How to Position for the Trade
To be fair to the opposing view, the debasement thesis is not without merit. U.S. fiscal deficits remain large, government debt continues to grow, and central banks around the world are accumulating gold at the fastest pace in decades. Meanwhile, bond markets are showing signs of stress elsewhere: Japan’s long-term yields have surged to record highs, and the UK continues to grapple with periodic gilt-market volatility.
The key issue, however, is that these challenges are not unique to the United States. The euro area faces its own fiscal constraints, Japan is dealing with mounting pressure in its government bond market, and the UK remains vulnerable to political and fiscal uncertainty. Currency markets are relative, not absolute. In that comparison, the U.S. dollar still benefits from higher yields, deeper capital markets, and a Federal Reserve that remains reluctant to ease policy while inflation pressures persist.
In other words, the dollar may not be attractive because conditions in the U.S. are ideal—it may be attractive because conditions elsewhere are no better and, in some cases, worse.
A Barbell Strategy for a Stronger-Dollar Scenario
If the stronger-dollar thesis proves correct, a barbell approach offers a logical way to express the view.
One side of the portfolio:
Hold cash and short-duration Treasury bills.
Capture yields above 4%.
Avoid duration risk.
Benefit directly from a higher-for-longer interest-rate environment.
The other side of the portfolio:
Gradually accumulate longer-duration Treasuries as yields approach historically attractive levels.
Long-duration instruments could benefit disproportionately if tighter financial conditions eventually slow growth and drive long-term yields lower.
Vehicles such as long-duration Treasury ETFs become increasingly attractive if the economy weakens while the Fed remains restrictive.
This structure allows investors to earn attractive short-term yields today while maintaining exposure to a potential bond rally if growth deteriorates.
Commodities: More Caution Than Conviction
Under a stronger-dollar scenario, the risk-reward profile for commodities becomes less favorable.
Gold: After a substantial rally over the past year, much of the easy upside may already be reflected in prices.
Silver: Faces both monetary and industrial headwinds if tighter financial conditions weigh on growth.
Oil: Still supported by geopolitical risks, but vulnerable to a combination of stronger-dollar effects and weaker global demand.
Rather than aggressively adding commodity exposure, investors may find it more prudent to reduce overweight positions or maintain only modest allocations as hedges against geopolitical shocks.
The Investment Implication
The central argument is not that a stronger dollar is guaranteed. It is that the market remains heavily positioned for the opposite outcome.
Consensus trades often become vulnerable when the underlying assumptions begin to weaken. If inflation remains sticky, rate cuts continue to be pushed further into the future, and global growth slows under tighter financial conditions, the strongest opportunities may emerge in assets that few investors currently favor:
Long U.S. dollars.
Short-duration Treasuries.
Selective long-duration bond exposure.
Reduced reliance on the commodity-debasement narrative.
The essence of the trade is simple: position for the outcome that the market is least prepared for. If the dollar strengthens while investors remain committed to the weak-dollar consensus, the resulting adjustment could become one of the most consequential macro shifts over the next several quarters.
The US Dollar Index remained largely unchanged near 100.10 during Monday’s Asian trading session. The greenback drew support after Israel reported carrying out strikes on Iran in response to missile attacks, while stronger-than-expected US employment data prompted traders to increase expectations of a Federal Reserve rate hike later this year.
The US Dollar Index (DXY), which tracks the Greenback against a basket of six major currencies, hovered near 100.10 during Monday’s Asian session, holding close to a one-month high. The index remained supported by growing geopolitical tensions in the Middle East and increasing expectations that the Federal Reserve could tighten monetary policy further later this year.
According to reports, Israeli forces launched strikes on military sites in western and central Iran after Iran fired multiple missiles toward northern Israel. Iranian state media also reported explosions in several cities, including Isfahan, Tabriz, and Tehran, although details remained limited.
Meanwhile, US President Donald Trump stated that he would urge Israeli Prime Minister Benjamin Netanyahu to avoid retaliatory action following Iran’s missile attacks, which were launched in response to an earlier strike near Beirut. The heightened geopolitical uncertainty has boosted demand for safe-haven assets, lending additional support to the US Dollar.
The Greenback also benefited from stronger-than-expected US labor market data. The US economy recorded a third consecutive month of solid job growth in May, with Nonfarm Payrolls increasing by 172,000, exceeding market expectations of 85,000. The previous month’s figure was revised up to 179,000. At the same time, the unemployment rate held steady at 4.3%, matching forecasts.
Following the jobs report, investors significantly increased their expectations for further Fed tightening. Market pricing now implies more than a 70% chance of a rate hike in December, up sharply from roughly 45% a week earlier.
Commenting on the data, Capital Economics Chief Markets Economist Jonas Goltermann noted that the latest payroll figures suggest the US labor market continues to strengthen despite elevated energy prices. He added that this backdrop increases the likelihood of Fed policy tightening, with Capital Economics now expecting the Federal Open Market Committee (FOMC) to deliver two 25-basis-point rate hikes before year-end.
The Nasdaq 100 finished the week with a notably bearish candlestick pattern, largely driven by Friday’s sharp sell-off following the latest employment data. Investors reacted to concerns that the strong jobs report could prompt the Federal Reserve to maintain elevated interest rates for an extended period. Higher borrowing costs tend to weigh on growth-oriented sectors, particularly technology stocks. However, the longer-term outlook remains supported by ongoing enthusiasm for the technology sector and the artificial intelligence trend. If these structural growth drivers remain intact, the Nasdaq 100 may eventually recover and resume its upward trajectory.
Some additional downside momentum could emerge in the near term given the market’s weak weekly close. However, the 28,500 level remains an important area to monitor. If the Nasdaq 100 manages to hold above this support zone, it may present an attractive opportunity for buyers to re-enter the market. Conversely, a sustained move below 28,500 could increase selling pressure and pave the way for a decline toward the 26,000 level.
USD/MXN
The US Dollar strengthened against the Mexican Peso over the course of the week, although the 17.50 area continues to act as a significant resistance level. The key question is whether this barrier can remain intact. With the pair likely to challenge this level again as trading resumes, a breakout is certainly possible. Even so, any gains beyond 17.50 may be limited, with the 18.00 level representing a likely upside target. Mexico’s substantially higher interest rates continue to provide strong support for the Peso, making it difficult for USD/MXN to sustain a more pronounced rally.
If the US Dollar begins to gain significant upward momentum against the Mexican Peso, it may be more attractive to take long Dollar positions against other currencies instead. This is because holding a long USD/MXN position can involve substantial swap or carry costs, which may reduce the overall appeal of the trade despite any potential appreciation in the Dollar.
Gold
Gold came under heavy selling pressure, a move that was not entirely unexpected after interest rates surged on Friday. The decline has pushed prices below the lower boundary of the hammer candlestick formed the previous week, signaling a notable deterioration in the technical outlook. This bearish development raises the risk of further downside. The 50-week EMA, currently located around the $4,270 level, represents a key support area. If gold falls below this threshold and selling momentum persists, the metal could experience a much deeper corrective move.
The current weakness in gold is largely tied to expectations that US interest rates will remain elevated for an extended period. Friday’s stronger-than-expected jobs report reinforced this view, leading investors to scale back hopes for near-term monetary easing. However, if bond yields begin to decline—particularly if the US 10-year Treasury yield falls below the 4.50% level—the pressure on gold could ease, potentially allowing the precious metal to stabilize and recover.
Silver
Silver has slipped below the key $70 level, an area that previously served as an important support zone. The metal is now testing its 200-day EMA on the daily chart, making this a critical point for traders to watch. A decisive break below this technical indicator could signal further weakness and increase the likelihood of a decline toward the $65 level, based on signals from the longer-term weekly chart analysis.
At this stage, silver’s outlook remains heavily dependent on a decline in US interest rates. Persistent high yields continue to weigh on the precious metal, limiting its ability to sustain upward momentum. From a technical perspective, the weekly chart shows three consecutive attempts to push higher that were ultimately rejected, a pattern that reflects weakening bullish sentiment. For silver to regain strength and reverse its recent downtrend, support from the bond market—particularly through lower Treasury yields—may be necessary.
USD/CHF
The US Dollar strengthened significantly during the week, surpassing the key 0.79 mark against the Swiss Franc. This move suggests that the pair could continue its upward momentum, potentially advancing toward the 0.81 level.
The interest rate outlook in the United States remained volatile, with yields rising following the latest employment data. This increase further widened the rate gap between the US and Switzerland, enhancing the appeal of the US Dollar. As a result, the pair is likely to maintain its upward trajectory. Any near-term declines could present buying opportunities, provided US Treasury yields remain elevated. However, if the 10-year Treasury yield falls significantly, particularly below 4.50%, the bullish outlook for the Dollar may begin to weaken.
USD/ZAR
The US Dollar advanced against the South African Rand during the week, climbing above the 16.50 level as US interest rates moved higher. While South Africa continues to maintain higher rates than the United States, the widening strength of US yields has narrowed the interest rate advantage. Despite the recent gains, market participants may be watching for signs that the rally is losing momentum, which could encourage renewed selling pressure on the pair.
If bullish momentum continues to build, the pair could extend its advance toward the 50-week EMA, which is currently located around the 16.91 level.
GBP/USD
The British Pound came under heavy pressure against the US Dollar during the week, which was not particularly surprising given the broad-based strength of the Greenback. The key question now is whether the 1.33 level can continue to act as a support zone. If it holds, buyers may attempt to stabilize the market, but a decisive break below this level could signal further downside ahead.
The 1.33 level has been a significant support area for an extended period and is likely to remain a key focus for traders. If the pair can find support and rebound from this zone, the British Pound could regain strength and stage a recovery against the US Dollar. However, maintaining this level will be crucial for preserving the broader bullish outlook.
USD/CAD
The US Dollar posted a strong advance against the Canadian Dollar, rising to test the key 1.3950 level. This price zone has served as an important area of support and resistance on multiple occasions, making it a significant point of interest for traders. With the pair closing near this level, it is reasonable to expect continued volatility and choppy price action as the market attempts to determine its next direction.
If US interest rates continue to move higher, the USD/CAD pair is likely to maintain its upward momentum, potentially targeting the 1.4150 level. Conversely, if Treasury yields begin to decline, the pair could come under pressure and retreat toward the 1.38 level. As a result, the direction of US interest rates is likely to remain a key driver of price action in the near term.
USD/JPY
The US Dollar ended the week by testing the critical ¥160 level against the Japanese Yen. This is a closely watched psychological and technical threshold, and its importance to market participants could lead to heightened volatility as traders assess whether the pair has enough momentum to break higher or if resistance will hold.
This is a level where the Bank of Japan has intervened in the past, making it an area that deserves close attention. If USD/JPY can break decisively above the ¥160.50 level, it could trigger a significant bullish breakout by surpassing a major swing high that has stood since 1990. Such a move would likely reinforce the pair’s long-term upward momentum. In the meantime, any short-term pullbacks are likely to be viewed as buying opportunities by traders looking to participate in the broader uptrend.
EUR/USD
The Euro came under significant pressure this week, largely driven by rising US interest rates and the resulting strength of the US Dollar. With that in mind, it will be important to watch whether the market moves down to test the 1.14 level. While a rebound from that area is certainly possible, patience may be warranted. Rather than buying immediately, it may be wiser to wait for a clear “V-shaped” recovery pattern to emerge on the chart, as this would provide stronger confirmation that bullish momentum is returning.
Given the current market conditions, I am content to remain on the sidelines and observe how trading develops on Monday before making any decisions. The market may provide clearer direction after the initial reaction to recent price movements and interest rate expectations.
The AUD/USD pair weakens to around 0.7120 during the early Asian trading hours on Friday. The Australian Dollar comes under pressure after Iranian officials stated that discussions in Washington had produced “no tangible progress,” dampening market sentiment. Meanwhile, support for the Aussie remains limited despite Reserve Bank of Australia (RBA) Governor Michele Bullock reiterating that policymakers are prepared to take whatever action is necessary to fulfill the central bank’s mandate.
The AUD/USD pair edges lower to around 0.7120 during the early Asian session on Friday as risk sentiment remains fragile amid ongoing tensions in the Middle East. Investors are also turning their attention to the US Nonfarm Payrolls (NFP) report for May, due later in the day.
Market caution intensified after Iran’s Foreign Minister, Abbas Araghchi, stated on Wednesday that there had been “no tangible progress” in efforts to end the conflict in the Middle East. He added that communication channels with Washington remain open but warned that any Israeli strike on Beirut as part of its campaign against Hezbollah could trigger a full-scale escalation involving the United States and Iran.
Traders are likely to keep a close eye on developments surrounding US-Iran negotiations. Persistent uncertainty or renewed geopolitical tensions could increase demand for safe-haven assets, supporting the US Dollar and weighing on the AUD/USD pair in the near term.
Meanwhile, the Australian Dollar found limited support from hawkish remarks by Reserve Bank of Australia (RBA) Governor Michele Bullock on Thursday. Bullock reiterated that the central bank remains firmly committed to bringing inflation back under control after delivering three interest-rate increases this year, which lifted the cash rate to 4.35%. She stressed that inflation remains uncomfortably high and emphasized that policymakers are prepared to take whatever measures are necessary to achieve price stability and full employment.
The US Dollar Index retreats as improving market sentiment follows reports that Israel and Lebanon agreed to renew their ceasefire on Wednesday.
Risk appetite remains tempered, however, after President Trump warned that the ceasefire could be scrapped if Iran-backed forces were responsible for the deaths of US troops.
The Greenback could regain momentum if robust US employment data for May strengthens expectations that the Federal Reserve will keep interest rates elevated or raise them further.
The US Dollar Index (DXY), which tracks the Greenback against a basket of six major currencies, remains under pressure after posting gains for three consecutive sessions, hovering near 99.50 during Thursday’s Asian trading hours.
The US Dollar softened as risk sentiment improved following news that Israel and Lebanon agreed on Wednesday to renew their ceasefire. The deal, reached after US-mediated talks in Washington, is contingent on a “complete cessation” of hostilities by Iran-backed Hezbollah.
Although Israel and Lebanon do not maintain formal diplomatic ties, both sides also agreed to establish several pilot security zones where the Lebanese Armed Forces will exercise exclusive control, preventing the presence of non-state armed groups.
However, the improvement in market sentiment remained limited. According to reports from the Wall Street Journal, US President Donald Trump told advisers he could reconsider the ceasefire arrangement if Tehran were responsible for the deaths of US troops. Trump maintained that the week-long suspension of airstrikes remains in effect despite continued clashes in the region. He also indicated in an interview with the New York Post that a blockade extending through Labor Day remains a possibility, potentially delaying expectations for the reopening of the Strait of Hormuz.
Meanwhile, the Greenback could find renewed support as investors increasingly anticipate that the Federal Reserve may tighten monetary policy further this year. Better-than-expected US labor market indicators, including May’s ADP private employment figures and JOLTS job openings data, reinforced confidence in the resilience of the US economy and strengthened the case for higher interest rates for a longer period.
Market expectations have shifted notably as the ongoing conflict involving Iran continues to disrupt energy markets, lifting oil prices and fueling inflationary pressures. According to the CME FedWatch Tool, traders are now pricing in roughly a 42% probability of a Federal Reserve rate hike by December.
USD/CHF moves lower as the US Dollar comes under pressure amid improving market sentiment following the renewal of the Israel-Lebanon ceasefire on Wednesday. However, the Greenback could find support from robust May employment figures, which have reinforced expectations that the Federal Reserve may keep tightening monetary policy. Meanwhile, Swiss National Bank President Martin Schlegel recently stated that the SNB remains prepared to intervene if tensions in the Middle East drive excessive appreciation of the Swiss Franc.
USD/CHF snapped its three-session advance and traded near 0.7910 during Thursday’s Asian session as the US Dollar weakened amid improving risk sentiment. Market appetite for risk increased after Israel and Lebanon agreed to renew their ceasefire on Wednesday, although the deal remains conditional on a complete halt to hostilities by the Iran-backed Hezbollah group. The agreement followed US-mediated discussions in Washington.
Despite the absence of formal diplomatic ties between the two countries, both sides also agreed to create several pilot security zones where the Lebanese armed forces would assume sole authority, excluding all non-state actors from those areas.
However, losses in USD/CHF may remain limited as the US Dollar could regain support from growing expectations that the Federal Reserve will tighten monetary policy further this year. Strong US labor market indicators, including May’s ADP private employment report and JOLTS job openings data, reinforced confidence in the resilience of the economy and encouraged speculation that interest rates may stay elevated for longer.
At the same time, the ongoing conflict involving Iran has continued to disrupt energy markets, pushing oil prices higher and intensifying inflation concerns. Reflecting this shift in sentiment, the CME FedWatch Tool now indicates roughly a 42% chance of a Fed rate hike in December.
Meanwhile, Martin Schlegel, Chairman of the Swiss National Bank, stated that the Swiss Franc’s real overvaluation is considerably less pronounced than its nominal overvaluation. He also emphasized that the SNB stands ready to increase its foreign-exchange market interventions if heightened Middle East tensions trigger excessive safe-haven demand for the Swiss Franc.
USD/JPY pulls back from a more than one-month peak reached on Thursday, although selling pressure remains limited. The US Dollar faces headwinds following the Israel–Lebanon ceasefire, while concerns over potential Japanese intervention also weigh on the pair. Nevertheless, the broader technical picture remains constructive, suggesting traders should be cautious about anticipating a deeper corrective decline.
The USD/JPY pair edged lower during Thursday’s Asian trading session as speculation grew that Japanese authorities could once again intervene to support the Japanese Yen (JPY). At the same time, the ceasefire between Israel and Lebanon encouraged traders to lock in profits on US Dollar (USD) positions, adding downward pressure to the pair.
Despite the pullback, selling momentum remains limited, with the pair continuing to trade near the key 160.00 level and close to a one-month peak reached earlier in the day. Concerns about the broader economic impact of tensions in the Middle East have discouraged aggressive Yen buying. Meanwhile, lingering uncertainty surrounding US-Iran negotiations and expectations that the US Federal Reserve (Fed) will maintain a hawkish stance continue to underpin the USD, helping to cushion losses in USD/JPY.
From a technical standpoint, the pair maintains a positive near-term outlook within a rising channel pattern. The channel’s lower boundary aligns closely with the 200-period Simple Moving Average (SMA), which provided support on Wednesday. The Relative Strength Index (RSI) remains above its midpoint, signaling mild bullish momentum, while the Moving Average Convergence Divergence (MACD) has flattened slightly below zero.
These indicators suggest the uptrend may be slowing rather than reversing. Consequently, any short-term decline could attract renewed buying interest around the important support zone near 159.45. However, a decisive break below this area could trigger additional technical selling and open the door for a deeper correction. As long as the pair holds above the 159.44 support region, the broader bullish bias remains intact, with a move toward the upper boundary of the channel near 160.14 continuing to be the favored scenario.
USD/CAD edges higher as risk-off sentiment leaves the Canadian Dollar unable to benefit from stronger crude oil prices. WTI crude extends gains after Iran launched unsuccessful ballistic missile attacks on Kuwait and Bahrain, heightening concerns over Middle East supply disruptions. Meanwhile, the US Dollar strengthens as fears surrounding a potential Strait of Hormuz closure fuel inflation worries and reinforce expectations that the Fed could keep interest rates higher for longer.
USD/CAD trades modestly higher around 1.3850 during Wednesday’s Asian session after posting slight losses in the previous session. The commodity-linked Canadian Dollar (CAD) remains subdued despite a continued rise in crude oil prices, as heightened market risk aversion keeps traders cautious and limits demand for risk-sensitive currencies.
West Texas Intermediate (WTI) crude extends its rally for a third straight session, hovering near $92.60 per barrel at the time of writing. Oil prices surged following renewed tensions in the Middle East after Iran launched ballistic missiles toward Kuwait and Bahrain. According to reports, the US Central Command (CENTCOM) intercepted the missile and drone attacks while carrying out self-defense strikes on Iran’s Qeshm Island.
Concerns over a prolonged closure of the Strait of Hormuz have intensified fears of wider energy supply disruptions, potentially fueling global inflation pressures. This environment continues to strengthen expectations that the Federal Reserve (Fed) will keep interest rates elevated for longer, providing additional support to the US Dollar (USD). The higher-for-longer rate outlook is also backed by resilient US economic data, with the May 2026 ISM Manufacturing PMI rising to 54.0 from 52.7 and exceeding market forecasts to mark the strongest expansion in factory activity since May 2022.
Further signs of economic resilience emerged from the labor market, as April JOLTS job openings climbed to a near two-year high of 7.61 million while layoffs declined. With both manufacturing and employment indicators remaining firm, investors are now turning their focus to Friday’s Nonfarm Payrolls report for further insight into the future direction of Fed monetary policy.
US Dollar Index remains steady as uncertainty over a potential US-Iran deal intensifies.
The US Dollar Index stays flat near 99.25 as uncertainty surrounding a potential US-Iran deal continues to rise. Renewed attacks between Washington and Tehran have revived concerns over a possible escalation in the Middle East conflict. Meanwhile, investors are turning their focus to upcoming US economic releases, including the ADP Employment Change, ISM Services PMI, and May’s Nonfarm Payrolls report.
The US Dollar (USD) traded in a subdued manner during Wednesday’s Asian session, despite rising uncertainty over a potential United States-Iran agreement after both sides exchanged attacks.
At the time of writing, the US Dollar Index (DXY), which measures the Greenback against a basket of six major currencies, was little changed around 99.25.
On Tuesday night, the US Central Command (CENTCOM) announced it had intercepted multiple Iranian missile and drone strikes aimed at regional allies such as Kuwait and Bahrain, while also launching defensive operations against targets on Iran’s Qeshm Island.
The developments have reignited concerns over a renewed Middle East conflict, a situation that could drive oil prices higher and provide further support for the US Dollar.
Historically, the Greenback tends to strengthen during periods of geopolitical tension, as rising energy prices fuel inflation pressures and reduce expectations for aggressive Federal Reserve (Fed) rate cuts.
On the economic front, traders are awaiting the release of the US ADP Employment Change report and the ISM Services Purchasing Managers’ Index (PMI) for May during the North American session.
Meanwhile, Tuesday’s US JOLTS Job Openings report for April exceeded forecasts, showing 7.618 million available positions versus market expectations of 6.88 million.
Attention now turns to Friday’s US Nonfarm Payrolls (NFP) report for May, which is expected to be the key catalyst for the US Dollar this week.
New Zealand Dollar strengthens after upbeat China PMI data, ending a two-day decline against the US Dollar.
NZD/USD gains traction on Wednesday, supported by a mix of positive catalysts. Stronger-than-expected China Services PMI data and the Reserve Bank of New Zealand’s hawkish stance underpin the Kiwi, while a softer US Dollar adds further support. However, ongoing geopolitical tensions may help limit broader USD weakness and restrain additional upside for the pair.
The NZD/USD pair moved higher during Wednesday’s Asian session, climbing toward the 0.5935 area after stronger-than-expected China Services PMI data boosted market sentiment. The pair appears to have ended a two-day losing streak, although ongoing geopolitical tensions could limit further upside.
Data released by RatingDog showed China’s Services PMI rising to 54.4 in May from 52.6 previously, beating market expectations of 52.3 and marking the fastest expansion in three months. The upbeat figures supported antipodean currencies, including the New Zealand Dollar.
Additional support for the Kiwi came from the Reserve Bank of New Zealand’s (RBNZ) unexpectedly hawkish stance and softer demand for the US Dollar. The RBNZ signaled a strong likelihood of a 25-basis-point rate hike at its July 8 meeting and projected the Official Cash Rate (OCR) could climb to around 2.85% by year-end, suggesting as many as three further hikes.
By contrast, markets currently see only a little more than a 50% chance of one additional rate increase from the US Federal Reserve (Fed) this year. Combined with uncertainty surrounding US-Iran negotiations, this has weighed on the Greenback and supported NZD/USD.
Meanwhile, geopolitical risks remain elevated. Reports indicated that US forces intercepted Iranian missile and drone attacks targeting regional allies while carrying out defensive strikes on Iran’s Qeshm Island. US Secretary of State Marco Rubio also stated that sanctions relief for Iran would depend on Tehran abandoning enriched uranium activities.
In addition, US President Donald Trump announced an open-ended extension of the ceasefire alongside the continuation of a US blockade until negotiations are resolved. The persistent geopolitical uncertainty could continue supporting the US Dollar and cap gains for NZD/USD.
Investors now await the US ADP private employment report and the ISM Services PMI data later in the North American session for fresh market direction.
EUR/USD edges higher around 1.1635 in early Tuesday Asian trading. However, fresh geopolitical tensions in the Middle East may pressure the euro as a risk-sensitive currency. Meanwhile, ECB’s Schnabel cautioned that such shocks can no longer be overlooked.
EUR/USD posts modest gains near 1.1635 in early Tuesday Asian trading, though upside momentum may remain capped amid rising geopolitical risks. Iran’s announcement to halt indirect talks with the US and fully close the Strait of Hormuz has heightened risk-off sentiment, potentially supporting safe-haven flows into the US dollar.
Meanwhile, preliminary Eurozone HICP data is due later on Tuesday and may provide fresh direction for the pair.
According to CNBC, Iranian negotiators will stop communicating with the US via intermediaries and move to close the Strait of Hormuz in response to alleged ceasefire violations. US President Donald Trump said he urged Israeli Prime Minister Benjamin Netanyahu to avoid a major strike on Beirut, claiming Israeli forces were pulled back. However, Netanyahu disputed this, stating that operations against Hezbollah in southern Lebanon will continue.
Escalating tensions in the Middle East could strengthen the US dollar as a safe-haven asset, weighing on EUR/USD.
On the European side, the euro may find some support from the ECB’s relatively hawkish tone. ECB Executive Board member Isabel Schnabel noted that inflationary pressures linked to the Iran conflict can no longer be ignored, as price increases are broadening beyond energy and inflation expectations risk becoming unanchored.
International investors and governments increased their holdings of U.S. Treasury securities to an all-time high of $9.49 trillion in February 2026, with holdings rising $587 billion year-over-year and nearly $200 billion in a single month.
Central banks continued accumulating gold, adding 244 tonnes during the first quarter of 2026 and extending a buying streak that has lasted 17 months. However, because gold is traded globally in U.S. dollars, this trend still reinforces the dollar’s central role in the financial system.
The United Arab Emirates’ decision to withdraw from OPEC/OPEC+ came shortly after U.S. officials endorsed a potential emergency dollar liquidity arrangement for Abu Dhabi, highlighting the strategic influence of dollar-based financial support.
U.S. sanctions efforts against Iran have successfully frozen $344 million worth of cryptocurrency assets, illustrating how digital financial infrastructure linked to the dollar can strengthen U.S. economic enforcement power.
Overall, evidence from Treasury market demand, rising foreign capital inflows, and expanding digital-dollar adoption suggests that predictions of the dollar’s decline are not supported by current data.
For years, predictions of the US dollar’s decline have dominated headlines, and those claims have only grown louder. Critics argue that BRICS nations are creating a viable alternative to the dollar, China is reducing its holdings of US Treasuries, gold is poised to replace the dollar as the world’s primary reserve asset, and the US government is struggling to attract buyers for its mounting debt—so much so that it is allegedly using dollar swap lines with Gulf nations as an indirect liquidity support mechanism.
While these arguments make for a compelling narrative, the underlying data tells a different story. Despite the persistent warnings from dollar skeptics, there is little evidence to suggest that the dollar’s dominant role in the global financial system is meaningfully eroding.
The dollar’s dominance is far from disappearing. If anything, the developments seen in late April 2026 provided one of the strongest pieces of evidence in years that its position in the global financial system remains firmly intact.
Theory vs. Reality
For years, I’ve argued that the “dollar collapse” narrative mistakenly equates inflation with currency debasement. Those are not the same thing. A currency cannot realistically be considered debased when global demand for it continues to intensify. We’ve explored this rebasement perspective before in our discussions of the dollar’s global funding system and in The Dollar’s Death Is Greatly Exaggerated. The latest figures only strengthen the case that the U.S. dollar remains firmly dominant.
The most recent Treasury International Capital (TIC) report from the U.S. Treasury, released on April 15 and covering February 2026 activity, showed foreign investors purchased $101 billion of long-term U.S. securities in a single month. Total net TIC inflows reached $184.5 billion, while foreign investors also increased their Treasury bill holdings by another $91.6 billion. As a result, foreign ownership of U.S. Treasuries climbed to a record $9.49 trillion in February, rising by $198 billion during the month and by $587 billion over the previous year.
Even that record figure understates the true scale of foreign demand. It excludes Treasury exposure held through U.S.-based hedge funds and the Cayman Islands basis trade. According to Federal Reserve estimates, these channels account for roughly an additional $1.5 trillion of effective foreign demand. When those positions are included, total foreign-linked exposure to U.S. Treasuries approaches $11 trillion, underscoring the continued global appetite for dollar-denominated assets.
Looking beyond the total amount of debt outstanding, the flow data paints the same picture. Indirect bidders—widely viewed as a gauge of foreign demand—have consistently accounted for more than 70% of successful bids in recent Treasury auctions. Meanwhile, bid-to-cover ratios for both 10-year and 30-year Treasury sales have remained above 2.5 through multiple market cycles, signaling robust investor appetite.
If the world were genuinely abandoning the dollar, the evidence would look very different: weaker auction participation, higher yields caused by poorly received offerings, and a rising term premium as investors demanded greater compensation to absorb excess supply. Yet the data points in the opposite direction. Despite the U.S. running approximately $2.5 trillion in deficits over the past year, global investors have continued to absorb the resulting Treasury issuance with little difficulty.
Far from resembling a rush for the exits, these trends suggest exceptionally strong demand. In fact, they point to one of the most powerful and persistent periods of global demand for U.S. government debt ever recorded.
How Central Bank Gold Purchases Strengthen the Dollar’s Position
This is where many dollar-collapse narratives begin to break down. Gold advocates often make a fundamental mistake by treating central bank gold accumulation as proof that the world is abandoning the U.S. dollar. The reality is more nuanced.
There is no dispute that central banks have been aggressively increasing their gold reserves. According to the World Gold Council’s Q1 2026 Gold Demand Trends report, released on April 29, official-sector institutions purchased a net 244 tonnes of gold during the first quarter alone, a 3% increase from the same period a year earlier. That marked the seventeenth consecutive month of net central bank buying, despite gold prices surpassing $5,400 per ounce in January. Physical gold demand reached 474 tonnes during the quarter, making it the second-strongest first quarter on record. Looking ahead, the World Gold Council expects central banks to purchase approximately 850 tonnes of gold throughout 2026, broadly matching 2025 levels and extending a multi-year trend of substantial accumulation.
The trend is both genuine and important. However, interpreting it as evidence of a mass exodus from the dollar is a leap that the data does not support. Central banks are adding gold primarily as a reserve diversifier and geopolitical hedge, not as a replacement for the dollar-based financial system. Gold can store value, but it cannot replicate the liquidity, collateral function, settlement infrastructure, or global financing role provided by U.S. Treasury securities and dollar-denominated markets.
In other words, rising gold reserves and continued dollar dominance are not mutually exclusive. Central banks can accumulate gold while still relying heavily on dollars for trade settlement, reserve management, cross-border financing, and international liquidity. The growth of official gold holdings reflects diversification at the margin—not a practical abandonment of the world’s primary reserve currency.
A key point often overlooked in de-dollarization debates is that gold itself remains deeply embedded within the dollar-based financial architecture. Gold may be a reserve asset, but it is still primarily valued through a dollar lens. The London Bullion Market Association (LBMA) benchmark—the global standard used to value central bank gold holdings—is quoted in U.S. dollars per ounce. Whether it is the People’s Bank of China, the National Bank of Poland, or the Reserve Bank of India increasing its gold reserves, those holdings are ultimately measured, reported, and assessed in dollar terms.
The same principle applies when central banks use gold as a source of liquidity. Whether through swaps, repurchase agreements, or outright sales, transactions are typically priced against dollar benchmarks. Gold and dollars are therefore not competing monetary systems operating independently of one another. Rather, gold functions as a reserve asset within a broader framework that is still largely organized around the U.S. dollar.
This distinction fundamentally changes how central bank gold purchases should be interpreted. If a central bank reallocates 5% of its reserves from U.S. Treasuries into gold, that does not constitute an exit from the dollar system. It is simply a portfolio adjustment within a reserve structure where assets continue to be valued and compared using dollar-based metrics. The same logic applies to gold swaps conducted through the Bank for International Settlements, yuan-denominated contracts traded on the Shanghai Gold Exchange, and even the large gold accumulation programs undertaken by Central Bank of the Russian Federation before sanctions. Regardless of the transaction venue or currency of quotation, reserve managers still evaluate those positions against their dollar-equivalent value.
Viewed through that lens, growing gold reserves do not necessarily undermine dollar dominance. In many respects, they reinforce it by relying on the dollar as the world’s primary unit of account for reserve wealth.
The same surveys frequently cited as evidence of de-dollarization illustrate this nuance. While many central banks expect the dollar’s share of reserves to gradually decline over the coming years, actual reserve data tells a more measured story. According to the IMF’s COFER statistics for the fourth quarter of 2025, the U.S. dollar accounted for roughly 56.8% of allocated global foreign-exchange reserves. Although lower than the levels seen decades ago, that share remained broadly stable, with much of the quarter-to-quarter movement attributable to exchange-rate fluctuations rather than aggressive reserve liquidation.
At the end of 2025, total global foreign-exchange reserves stood above $13 trillion. Within that pool, the dollar remained by far the dominant reserve currency, holding a share that exceeded the combined weight of every major competitor except the euro. The euro represented roughly one-fifth of allocated reserves, while the Japanese yen and British pound each accounted for about 5%. Despite persistent discussion of its rise, the Chinese yuan continued to represent only a small fraction of global reserve holdings.
The broader takeaway is that reserve diversification and de-dollarization are not synonymous. Central banks may seek greater exposure to gold or other currencies, but the available data still points to a global reserve system in which the dollar remains the primary benchmark, funding currency, and store of international liquidity.
Bessent’s Dollar Swap Strategy Expands Dollar Dominance
Recent discussions surrounding potential new dollar swap lines have provided another example of how U.S. policymakers are working to reinforce, rather than merely defend, the dollar’s global position.
Treasury Secretary Scott Bessent has recently floated the idea of extending dollar swap arrangements to key partners in the Persian Gulf and Asia, with the United Arab Emirates frequently mentioned as a leading candidate. Critics have interpreted the proposal as an emergency measure designed to prevent foreign holders from selling U.S. Treasuries amid geopolitical tensions in the Middle East. However, that interpretation overlooks the broader strategic objective.
Bessent’s own comments suggest a different motivation. He has emphasized that swap lines help maintain stability in dollar funding markets and reduce the risk of disorderly asset sales during periods of stress. More importantly, he has argued that expanding swap-line networks can strengthen international dollar usage and create additional dollar funding hubs across strategically important regions.
At its core, this approach is about infrastructure. Dollar swap lines are one of the most powerful tools available for extending the reach of the global dollar system. During the 2008 financial crisis, swap lines were deployed primarily as a defensive measure, providing dollar liquidity to foreign central banks and preventing disruptions in global funding markets. The emerging strategy seeks to use the same mechanism more proactively by deepening the dollar’s presence in regions where competing financial architectures have been gaining attention.
The logic is straightforward. When a central bank receives permanent or highly reliable access to dollar liquidity through a swap arrangement, its domestic financial institutions gain confidence that dollars will remain available during periods of market stress. That assurance strengthens incentives to continue conducting trade, financing, and reserve management activities in dollars rather than investing heavily in alternative systems.
From a network perspective, every new swap line effectively creates another node within the global dollar ecosystem. Countries connected to these facilities become more deeply integrated into dollar funding markets, increasing the currency’s utility and reinforcing its network effects. This dynamic helps explain why existing swap-line arrangements among the United States, the European Central Bank, Japan, United Kingdom, Canada, and Switzerland have remained central pillars of the international monetary system since the global financial crisis.
Viewed through this lens, proposed Gulf and Asian swap lines are less about preventing a collapse in Treasury demand and more about extending the geographical footprint of the dollar system. Rather than signaling weakness, they represent an effort to strengthen the institutional infrastructure that underpins the dollar’s reserve-currency status and global liquidity role.
The broader implication is that dollar dominance is sustained not only by the size of the U.S. economy or the Treasury market, but also by the network of financial relationships that make dollars readily available around the world. Swap lines are one of the clearest examples of how that network continues to expand.
More importantly, this strategy is no longer merely theoretical. Advocates argue that Treasury Secretary Scott Bessent has already demonstrated the model in practice through a swap facility extended to Argentina in 2025. The objective was straightforward: provide dollar liquidity to a strategic partner during a period of political uncertainty, stabilize financial conditions, and reinforce that country’s integration into the global dollar system. The reported repayment of the facility within a relatively short period strengthened the case that such arrangements can function as effective tools of financial diplomacy rather than permanent rescue programs.
Under this framework, swap lines serve as an incentive mechanism. They offer trusted partners access to the world’s deepest pool of liquidity and strengthen their ties to dollar-based funding markets. Proposed arrangements with Gulf states and Asian economies can therefore be viewed as efforts to expand the geographic reach of the dollar network rather than emergency measures aimed at defending Treasury demand.
At the same time, the United States retains a second source of influence: its ability to enforce financial restrictions through sanctions, regulatory oversight, and control of key financial infrastructure. In this interpretation, dollar dominance is supported by both incentives and enforcement. Countries gain significant benefits from participating in the dollar system, but they are also aware of the costs associated with operating outside it.
Recent actions targeting Iranian financial networks illustrate this point. Through sanctions programs administered by the Office of Foreign Assets Control and other agencies, the U.S. government continues to demonstrate its capacity to restrict access to international financial channels and freeze assets connected to sanctioned entities. These measures highlight the extent to which global finance remains intertwined with institutions, payment systems, and compliance frameworks linked to the dollar.
The implications extend beyond traditional banking. Cryptocurrencies and stablecoins are often portrayed as alternatives to the existing monetary order, but many of the largest digital-asset ecosystems remain dependent on regulated exchanges, custodians, issuers, and financial intermediaries. As a result, authorities can frequently exercise influence through compliance requirements and enforcement actions, limiting the extent to which these networks operate entirely outside government oversight.
From this perspective, dollar dominance is reinforced through two complementary forces. The first is attraction: deep capital markets, abundant liquidity, reserve-currency status, swap-line access, and the global demand for U.S. Treasury securities. The second is enforcement: sanctions authority, asset freezes, financial blacklists, and regulatory reach. Together, these mechanisms create powerful incentives for governments, banks, and reserve managers to remain connected to the dollar ecosystem.
This does not mean that countries are abandoning efforts to diversify reserves or reduce specific vulnerabilities. Many continue to increase gold holdings, explore alternative payment arrangements, and spread custodial risk across jurisdictions. However, diversification is not the same as disengagement. For many reserve managers, the calculation remains that participation in the dollar-centered financial system offers benefits and stability that are difficult to replicate elsewhere, even as they seek greater flexibility around the margins.
The UAE’s Exit and the De-Dollarization Debate
Supporters of the dollar-dominance thesis point to recent developments in the Gulf as evidence that financial influence often matters as much as formal reserve statistics. In their view, the reported decision by the United Arab Emirates to distance itself from the traditional OPEC framework came at a strategically significant moment, coinciding with discussions about closer financial cooperation with Washington.
The argument focuses on sequence and incentives. During a period of heightened regional uncertainty and financial stress, U.S. policymakers discussed expanding dollar liquidity support to key partners. At the same time, senior UAE officials engaged with representatives from the U.S. Treasury, the International Monetary Fund, and the Federal Reserve System. Proponents of this interpretation argue that access to dollar liquidity, security cooperation, and deeper integration into U.S.-led financial networks created powerful incentives for closer alignment with the dollar-based system.
From that perspective, swap lines are not simply emergency funding mechanisms. They are strategic tools that deepen economic ties and strengthen the network effects that support the dollar’s global role. The broader claim is that countries offered reliable access to dollar liquidity have fewer incentives to build alternative financial architectures around competing currencies.
As a result, advocates argue that this episode weakens the long-running “petroyuan” narrative. Rather than seeing a major Gulf economy move toward a yuan-centered energy pricing system, they see another example of a strategically important state reinforcing its links to the dollar ecosystem.
Counterargument: Does De-Dollarization Still Matter?
The strongest de-dollarization case remains a serious one. Following the freezing of roughly $300 billion of Russian reserves in 2022, many governments concluded that reserve assets held within Western financial systems carried political and geopolitical risks. This prompted efforts to diversify reserve management practices, expand local-currency trade arrangements, accumulate gold, and explore alternatives to traditional dollar settlement networks.
Examples frequently cited include growing cooperation among BRICS members, increased bilateral trade settlement between China and Russia, and shifts in custodial arrangements for foreign-exchange reserves. These developments are real and reflect an ongoing desire among some countries to reduce exposure to potential sanctions risk.
However, supporters of the dollar-dominance view argue that these changes have largely occurred within the existing financial architecture rather than outside it. Moving Treasury holdings from direct custody in the United States to institutions such as Euroclear changes where assets are held, but not necessarily what assets are held. Likewise, increasing bilateral trade settlement in yuan or other currencies does not automatically create a viable alternative to the broader dollar-based system.
The core challenge for de-dollarization remains scale. A reserve currency must provide deep and liquid capital markets, a large supply of high-quality collateral, broad convertibility, legal protections, and global acceptance. While alternatives have made incremental gains, none have yet matched the combination of liquidity, market depth, and network effects that support the dollar.
As a result, the debate today is less about whether diversification is occurring—it clearly is—and more about whether diversification at the margins is sufficient to fundamentally reshape the global monetary system. Thus far, the evidence suggests gradual evolution rather than a rapid displacement of the dollar’s central role.
The key mistake in many de-dollarization arguments is treating diversification as if it were abandonment. Those are not the same thing. Foreign reserve managers are increasingly diversifying where they hold assets and expanding allocations to gold, but neither trend necessarily implies a departure from the dollar-centered financial system.
In practice, many central banks are pursuing two parallel objectives. First, they are reducing custodial concentration by spreading reserve assets across multiple jurisdictions and institutions. Second, they are increasing gold holdings as a hedge against geopolitical and financial uncertainty. Yet these adjustments leave the dollar largely intact as the world’s primary unit of account, dominant settlement currency, and leading reserve asset. Reserve composition may be evolving at the margins, but the underlying structure of the system remains remarkably stable.
The dollar’s influence is also expanding through channels that traditional reserve statistics often fail to capture. One of the most important developments is the rapid growth of dollar-denominated digital assets across emerging markets. In regions such as Latin America, Africa, and Southeast Asia, stablecoins have become increasingly popular as tools for savings, payments, and access to dollar exposure where local currencies face inflation or volatility.
A notable example is Tether, the issuer of the USDT stablecoin. According to the company’s first-quarter 2026 attestation, it held approximately $141 billion in direct and indirect exposure to U.S. Treasury securities as of March 31, supported by total assets of roughly $191.8 billion against liabilities of $183.5 billion. The company also reported a reserve surplus exceeding $8 billion and more than $1 billion in quarterly profit.
These figures are significant because they illustrate how digital-dollar adoption can generate additional demand for U.S. government debt. Stablecoin issuers typically back their tokens with highly liquid dollar assets, including Treasury bills and other short-term government securities. As stablecoin usage grows internationally, so does the indirect demand for dollar-denominated reserves.
Viewed through this lens, digital finance may be reinforcing rather than weakening the dollar’s global position. Instead of replacing the dollar, many of the most widely used digital assets effectively extend the reach of dollar liquidity into markets that previously had limited access to traditional banking infrastructure.
The broader implication is that the future of dollar dominance may not depend solely on central-bank reserve allocations. Increasingly, it may also be shaped by private-sector demand for digital dollars, cross-border payment networks, and new forms of dollar-based financial infrastructure that continue to expand the currency’s global footprint.
The dollar’s reach is increasingly extending beyond traditional banking and central-bank reserves into the digital economy. Supporters of the dollar-dominance thesis argue that this trend is particularly visible in emerging markets, where dollar-linked stablecoins are becoming a preferred vehicle for savings, payments, and wealth preservation.
Recent growth in USDT circulation illustrates the scale of that demand. As the supply of dollar-pegged stablecoins continues to expand, issuers accumulate larger holdings of U.S. Treasury securities and other dollar-denominated assets to back those tokens. In effect, every new digital dollar created generates additional demand for the underlying dollar-based financial infrastructure.
The trend is especially pronounced across parts of Latin America, Africa, and Southeast Asia, where concerns about local currency volatility have encouraged users to hold digital dollars instead of local cash balances. Some industry reports have described this phenomenon as “digital dollarization”—a process in which individuals gain access to dollar exposure through blockchain networks rather than through traditional bank accounts.
From a monetary perspective, this is an important distinction. Many observers originally viewed cryptocurrencies as potential competitors to the dollar. Yet the fastest-growing segment of the digital asset market has often been dollar-backed stablecoins rather than non-sovereign alternatives. As a result, blockchain adoption in many regions has expanded demand for dollar-linked assets rather than displaced them.
Regulatory developments further reinforce this dynamic. The implementation of stablecoin legislation and enhanced compliance requirements has increasingly tied major issuers to the existing financial system. Requirements that reserves be backed by high-quality liquid assets—primarily short-term U.S. government securities—strengthen the connection between stablecoin growth and Treasury demand.
At the same time, regulatory oversight gives authorities greater visibility and enforcement capability within digital-dollar networks. Compliance obligations imposed on issuers, exchanges, and custodians allow regulators to block, freeze, or restrict assets associated with sanctioned entities when required by law. This means that large portions of the stablecoin ecosystem operate not outside the traditional financial system, but as an extension of it.
Viewed through this lens, digital dollars may represent one of the newest channels through which dollar dominance is being reinforced. Rather than creating a parallel monetary order, stablecoins are increasingly embedding dollar liquidity, Treasury demand, and regulatory reach into global digital payments networks.
The broader takeaway is that the future of dollar dominance may depend not only on central banks and sovereign reserves, but also on millions of individuals and businesses choosing to hold digital representations of dollars. If that trend continues, the dollar’s influence could become even more deeply integrated into everyday economic activity around the world.
What This Means for Investors
If the dollar-dominance thesis is correct, the investment implications extend across bonds, equities, gold, and digital-finance infrastructure.
First, persistent foreign demand for U.S. Treasuries suggests ongoing support for the long end of the yield curve, even amid large federal deficits. Strong international demand can help absorb increased issuance and potentially moderate upward pressure on long-term interest rates. From that perspective, duration exposure may offer more value than many deficit-focused forecasts imply.
Second, central-bank gold accumulation appears to be creating a stronger structural foundation for gold prices than existed in previous cycles. That does not necessarily make gold a substitute for fiat currencies. Rather, it reinforces gold’s role as a portfolio diversifier, inflation hedge, and geopolitical-risk buffer. Investors may benefit from maintaining strategic gold exposure, but the argument is increasingly about diversification rather than preparing for the collapse of the monetary system.
Third, the expansion of digital-dollar infrastructure is creating new investment opportunities across payments, custody, and financial technology. Companies such as CRCL, COIN, V, MA, JPM, and BK operate at the intersection of traditional finance and emerging digital-dollar networks, positioning them to benefit if stablecoin adoption continues to grow globally.
The contrarian takeaway is that many investors who positioned heavily for an imminent dollar collapse may have missed some of the strongest-performing asset classes of the past several years. U.S. equities continued to attract capital, Treasury securities remained central to global reserve portfolios, and the broader dollar-based financial system proved more resilient than many critics anticipated.
This does not mean investors should ignore risks. Fiscal deficits, rising debt-service costs, geopolitical tensions, sanctions-related fragmentation, and potential competition from future central bank digital currencies all deserve close attention. These factors could influence the dollar’s long-term trajectory and should remain part of any serious macroeconomic analysis.
However, the evidence presented by proponents of the dollar-dominance view points to a different conclusion than the popular collapse narrative. Foreign demand for Treasuries remains robust. Central banks continue to buy gold while largely operating within a dollar-priced reserve framework. Swap lines are being used to deepen dollar liquidity networks. Stablecoins and digital-dollar platforms are expanding dollar access across emerging markets.
Taken together, these trends suggest that the dollar is not disappearing from the global financial system. Rather, it is adapting to new technologies, new payment channels, and new geopolitical realities while retaining many of the advantages that have supported its dominance for decades.
For investors, the practical lesson is not necessarily to bet exclusively on the dollar, but to recognize that many of the world’s most important financial markets, reserve assets, payment networks, and digital-finance platforms remain deeply connected to the dollar ecosystem. Understanding that infrastructure may prove more valuable than betting on its imminent collapse.
The British Pound experienced choppy trading throughout the week, with price action characterized by frequent swings in both directions. Despite the volatility, the 1.3550 level continues to act as a significant resistance zone. However, momentum suggests that it may only be a matter of time before the pair makes another attempt to challenge that area.
A decisive break above the 1.3550 resistance level could pave the way for further gains, potentially driving the pair toward the 1.3700 mark. For now, the broader uptrend remains intact, making short-term pullbacks attractive buying opportunities. Ongoing uncertainty surrounding US interest rate expectations is likely to keep volatility elevated, but the recent weakness in the US Dollar toward the end of the week has provided additional support for the British Pound, helping it maintain its bullish momentum against the greenback.
EUR/USD
The Euro has rebounded and is beginning to regain momentum. Overall, the pair appears likely to make another attempt toward the 1.18 level. However, market participants remain focused on the U.S. interest rate outlook, as they assess whether the recent volatility surrounding rate expectations will start to ease.
Silver
Silver remains highly volatile, with price action continuing to fluctuate within a choppy trading environment. While the broader outlook remains uncertain, the market is likely to stay sensitive to shifts in interest rate expectations. In addition, investor sentiment toward risk assets and the overall direction of the US Dollar will continue to play a key role in driving silver prices. As a result, traders should expect ongoing swings and periods of erratic movement in the near term.
Given the current market conditions, buying on short-term pullbacks appears to be a reasonable strategy. However, the outlook does not suggest an imminent breakout or a significant directional move. A decline below the $70 level could trigger a deeper sell-off and put additional pressure on prices, although such a scenario does not seem particularly likely in the near term. For now, the market appears more inclined toward range-bound trading, with continued back-and-forth price action expected.
Gold
Gold prices moved lower at the start of Monday’s trading session but quickly recovered, with bullish momentum driving the market higher throughout the remainder of the week. Strong buying interest continues to emerge around the $4,600 level, a key area that has attracted considerable attention from traders. Given its importance as a support zone, this level is likely to remain a focal point for market participants and could play a significant role in determining gold’s next directional move.
If interest rates continue to decline, gold could gain additional upward momentum and potentially advance toward the $4,800 level. The lower-rate environment would likely enhance the appeal of non-yielding assets such as gold. From a longer-term perspective, the overall outlook remains positive, with the broader trend continuing to favor further gains in the precious metal.
USD/JPY
The US Dollar posted modest gains against the Japanese Yen during the week, although the 160.00 level continues to act as a major resistance barrier. Recent interventions and increased market activity from the Bank of Japan suggest that policymakers remain committed to supporting the yen and preventing excessive currency weakness.
Despite these efforts, the yen continues to face challenges due to Japan’s relatively low interest rate environment, which limits its ability to attract capital flows and strengthen significantly. As a result, the broader outlook still favors the US Dollar, and it may only be a matter of time before USD/JPY makes another attempt to break above the 160.00 level.
A break below the 158.00 yen level would represent a significantly bearish development for USD/JPY. Such a move could signal a shift in market sentiment, potentially triggering additional selling pressure and raising the likelihood of a deeper correction. As a result, the 158.00 area remains a key support level that traders will be watching closely.
USD/CAD
The US Dollar initially strengthened during last week’s trading, but much of those gains were later surrendered against the Canadian Dollar. This price action suggests that traders should remain cautious, as bullish momentum has yet to establish itself convincingly.
At the same time, the 50-week Exponential Moving Average (EMA) continues to act as a notable resistance barrier, limiting upside progress. Until the pair can break decisively above this level, the market may remain vulnerable to further consolidation or renewed selling pressure.
A move below the 1.3750 level could be a significant bearish signal for USD/CAD, potentially opening the door to a much deeper decline. Such a breakdown would likely encourage additional selling pressure and shift the market’s near-term outlook to the downside.
From a broader perspective, however, the pair appears likely to remain trapped in a range-bound environment. As a result, traders should continue to expect considerable volatility and back-and-forth price action, with neither buyers nor sellers maintaining a clear long-term advantage for the time being.
Bitcoin
Bitcoin moved lower during the week but later recovered some of its losses, signaling a degree of market indecision. Price action suggests that traders remain cautious, with neither buyers nor sellers able to establish clear control.
While the market will likely need to make a more decisive directional move in the near future, Bitcoin does not currently appear to have the momentum required for a strong breakout to the upside. Until a clearer catalyst emerges, the cryptocurrency may continue to trade within a period of consolidation and uncertainty.
While the longer-term outlook remains constructive, any meaningful move higher is likely to develop gradually rather than through an immediate breakout. In the near term, a modest rebound appears possible this week as buyers attempt to regain control following recent weakness.
Looking ahead, the market could eventually make another push toward the $77,000 level, although achieving that target may require time and sustained buying interest. For traders and investors alike, patience is likely to be essential, as the path higher may involve periods of consolidation and uneven price action before a stronger trend emerges.
DAX
Germany’s DAX index experienced some selling pressure after rallying earlier in the week, giving back a portion of its gains. Despite the pullback, the 25,000 level appears to be providing an important area of support, helping to stabilize price action.
Overall, market sentiment remains relatively constructive, with many traders viewing declines as potential buying opportunities. As a result, pullbacks are likely to attract interest from investors looking to enter the market at more favorable levels, which could help support the index in the near term.
A break above last week’s high near the 25,425 level could serve as a strong bullish signal for the DAX. Such a move would likely reinforce positive market sentiment and attract additional buying interest from traders and investors who have been waiting for confirmation of further upside momentum.
If that resistance level is successfully cleared, participation in the market could increase significantly, potentially paving the way for a stronger advance and extending the broader upward trend.
The USD/CAD pair hovered sideways around 1.3785 during early Asian trading on Friday. Market participants are keeping a close eye on developments regarding a potential US-Iran ceasefire agreement, while Canada’s upcoming Q1 2026 GDP report is projected to reveal an annualized growth rate of 1.5%.
The US Dollar and Canadian Dollar are essentially stuck in place near 1.3785 this Friday morning as currency traders weigh two massive market drivers: Middle East geopolitics and Canadian economic data.
On the geopolitical front, there is hope for an extended peace deal between the US and Iran. The Guardian reported a potential 60-day extension to keep vital shipping lanes open while bigger issues, like Iran’s nuclear ambitions, are negotiated. US Vice President JD Vance confirmed they are still ironing out a few specific phrases but are moving in the right direction. If this peace deal goes through, oil prices will likely drop. Since Canada exports a ton of oil, any major shift in crude prices heavily impacts the value of the Canadian Dollar.
Meanwhile, Canada’s latest GDP numbers drop later today. After shrinking by 0.6% at the end of 2025, the economy is expected to bounce back with 1.5% growth for the first quarter of 2026. If the data beats expectations, expect the “Loonie” to gain some muscle against the US Dollar.
AUD/USD bulls stay cautious during Friday’s Asian session as mixed fundamental signals keep traders on the sidelines.
Reports of a potential US-Iran peace agreement weigh on the safe-haven US Dollar, providing modest support to the pair.
However, expectations that the Federal Reserve will maintain a hawkish stance help limit USD downside, while fading hopes for additional rate hikes from the Reserve Bank of Australia restrain gains for the Aussie.
The AUD/USD pair struggles to build on Thursday’s solid rebound from below the 0.7100 mark, a one-week low, and trades sideways during Friday’s Asian session. Even so, the pair remains above 0.7150 and is on track to post its first weekly gain in three weeks.
News that the US and Iran have drafted an agreement to prolong the current ceasefire by 60 days has weakened demand for the safe-haven US Dollar (USD), providing some support to the AUD/USD pair. However, investors remain cautious about the prospects of a lasting peace deal due to ongoing disputes surrounding Iran’s nuclear ambitions and the Strait of Hormuz.
At the same time, stronger US inflation data for April — the sharpest rise in three years — reinforced expectations that the US Federal Reserve (Fed) could raise interest rates again before year-end, lending support to the USD. In addition, fading expectations of a June rate hike from the Reserve Bank of Australia (RBA) continue to limit upside momentum for the Aussie.
From a technical standpoint, the pair is still trading within the same range that has held for roughly the past two weeks. The upper boundary of this range aligns with the 100-period Simple Moving Average (SMA) on the 4-hour chart, as well as the 23.6% Fibonacci retracement of the March-to-May rally, suggesting that bullish momentum remains somewhat restrained.
Meanwhile, the Relative Strength Index (RSI) sits around 56, while the Moving Average Convergence Divergence (MACD) remains slightly positive, indicating that bearish pressure is not yet dominant. Still, a decisive move above the key resistance zone around 0.7180–0.7185 would be required to confirm that the recent pullback from the multi-year peak has ended and that further gains are likely.
A sustained breakout above this barrier could pave the way toward the 0.7279 swing high. On the downside, immediate support is seen near the 38.2% Fibonacci retracement level at 0.7109, followed by the 50% retracement around 0.7056. Further declines could expose 0.7003 and 0.6928, ahead of the broader support base near 0.6833.
The US Dollar Index (DXY) strengthens to around 99.00 during Friday’s Asian session as investors monitor ongoing US-Iran negotiations. Vice President JD Vance stated that Washington and Tehran are “very close” to reaching a deal, though key issues remain unresolved.
Meanwhile, the US core PCE inflation rate rose 3.3% year-over-year in April, matching market expectations and reinforcing the Federal Reserve’s cautious policy stance.
The US Dollar Index (DXY), which tracks the US Dollar (USD) against a basket of six major currencies, trades near the 99.00 level during Friday’s Asian session. The Greenback edges higher following reports that the United States and Iran have reached a preliminary agreement to extend their ceasefire, although US President Donald Trump has yet to formally approve the deal.
According to Bloomberg, Washington and Tehran have tentatively agreed to prolong the ceasefire by 60 days while continuing negotiations over Iran’s nuclear program. Optimism surrounding a potential resolution to the three-month conflict could, however, limit demand for the safe-haven US Dollar.
US Vice President JD Vance stated on Friday that several key issues still need to be resolved before a final agreement can be achieved. Speaking to the BBC, Vance said it remains uncertain “when or if” both sides will ultimately reach a formal deal.
On the economic front, data released by the US Bureau of Economic Analysis (BEA) on Thursday showed that the Personal Consumption Expenditures (PCE) Price Index rose 3.8% year-over-year in April, up from the previous 3.5% reading and in line with market forecasts.
Meanwhile, the core PCE Price Index, which excludes food and energy prices, increased 3.3% annually in April versus 3.2% previously, also matching expectations. On a monthly basis, headline PCE and core PCE advanced by 0.4% and 0.2%, respectively. The inflation data reinforced expectations that the Federal Reserve (Fed) may keep interest rates elevated for an extended period.
According to the CME FedWatch Tool, markets are currently pricing in a roughly 36.6% chance that the Fed will deliver a 25-basis-point rate hike before the end of the year.
The US Dollar Index (DXY) rises toward 99.50 as Iran’s strikes on US military bases reignite tensions between Washington and Tehran. The Islamic Revolutionary Guard Corps (IRGC) warned of stronger retaliation if the US launches further attacks. Meanwhile, markets are increasingly pricing in a hawkish Federal Reserve stance, with the probability of at least one Fed rate hike this year climbing above 50%.
The US Dollar (USD) attracts strong buying interest during Thursday’s Asian session after Iran retaliated against recent US strikes near Bandar Abbas airport, according to Tasnim news agency.
At the time of writing, the US Dollar Index (DXY), which measures the Greenback against a basket of six major currencies, is up around 0.25% on the day and trading near the 99.50 level. The renewed escalation in US-Iran tensions has boosted demand for safe-haven assets, supporting the USD.
Iran’s Islamic Revolutionary Guard Corps (IRGC) stated that it had launched attacks on US military bases and warned that any further US aggression would trigger an even “more decisive” military response.
The IRGC had previously pledged retaliation following Wednesday’s so-called “defensive strikes” by the US Central Command, which targeted Iranian boats allegedly involved in deploying naval mines.
The renewed military confrontation between Washington and Tehran has sharply weakened hopes for a lasting peace agreement. Iran’s counterattacks have also fueled a strong rebound in oil prices, raising concerns about higher inflation and prompting traders to increase expectations of a more hawkish Federal Reserve (Fed) stance.
According to the CME FedWatch Tool, markets currently see a 43.1% probability that the Fed will keep interest rates unchanged through the year, while the remaining expectations point toward at least one rate hike. This marks a major shift from earlier market expectations that anticipated two rate cuts before the conflict escalated.
Looking ahead, investors are closely watching the release of the US April Personal Consumption Expenditures (PCE) Price Index data at 12:30 GMT. The Fed’s preferred inflation measure is forecast to rise 3.8% year-over-year, compared with the previous reading of 3.5%.
GBP/USD trades around 1.3446 during Tuesday’s European midday session, declining 0.42% on the day as the pair continues to retreat after failing to hold above the key 1.3500 psychological barrier earlier in the session. Sterling reached a three-week peak at 1.3517 on April 22, supported by broad US Dollar weakness during the short-lived easing of Iran-related tensions, but has since fallen roughly 70 pips toward the 1.3400 region. This area is reinforced by nearby technical support from the 21-day SMA at 1.3444 and the 50-day SMA at 1.3409.
Meanwhile, the 8-day, 21-day, 50-day, and 100-day EMAs are all converging close to current price levels, creating a compressed technical setup that has historically preceded directional moves of around 150–200 pips once a decisive catalyst emerges. Since March 30, GBP/USD has largely remained confined within a broader 335-pip range between the 1.3182 low and the April 22 high at 1.3517, encompassing the full period of volatility linked to the Iran conflict. With the pair now trading near the midpoint of that range, price action continues to reflect the consolidation pattern highlighted in the 30-day baseline outlooks from JPMorgan Chase and Cambridge Currencies.
Today’s Catalyst: Dollar Gains Safe-Haven Support After U.S. Strikes on Iranian Vessels
Tuesday’s decline in GBP/USD below the 1.3500 threshold was primarily driven by renewed geopolitical tensions that boosted demand for the US Dollar as a safe-haven asset. Overnight, US forces launched defensive strikes on Iranian vessels near the Strait of Hormuz, while President Donald Trump reportedly urged negotiators “not to rush into a deal,” undermining the de-escalation optimism that had previously helped Cable climb to a three-week high.
According to FXStreet, GBP/USD extended its retreat during the European session as cautious market sentiment strengthened the greenback following the latest US-Iran developments. The broader dollar rally pushed the US Dollar Index to a one-month high near 99.27, while EUR/USD slipped below 1.1650 and USD/JPY advanced toward 159.32.
The underlying market logic remains straightforward: as geopolitical risk returns, investors rotate back into the US Dollar. Sterling has struggled to counterbalance that flow because the current interest-rate differential between the Bank of England and the Federal Reserve is among the narrowest across major currency pairs, limiting the pound’s relative yield advantage.
Attention now shifts to Wednesday’s Camp David peace talks, which could become the next decisive catalyst for FX markets. A successful framework agreement would likely reduce safe-haven demand for the dollar and potentially drive GBP/USD back toward the 1.3600 area. On the other hand, if negotiations deteriorate or fail altogether, bearish momentum could accelerate, exposing the 1.3400 level and possibly opening the path toward 1.3300.
Cable’s technical setup continues to revolve around several well-defined levels closely watched by market participants. Initial support is seen at 1.3444, where the 21-day SMA currently sits, followed by the 50-day SMA at 1.3409 and the psychologically important 1.3400 handle, which also marks a recent consolidation base.
A decisive move below 1.3400 could expose the pair to deeper losses toward 1.3300, while 1.3182 — the March 30 six-week trough — stands as the next major structural support level.
On the upside, resistance remains concentrated around the 1.3500–1.3517 region, aligning with both the late-April peak and a key psychological barrier. Beyond that, traders are monitoring 1.3600, followed by 1.3700 as the broader upside target, particularly if the Bank of England adopts a more hawkish stance or the US Dollar weakens significantly.
The 21-day SMA near 1.3444 has repeatedly attracted price action throughout May, while the clustering of the 8-, 21-, 50-, and 100-day EMAs around current levels points to an unusually compressed technical structure — a condition that often precedes a stronger directional breakout.
Momentum indicators continue to reflect indecision. RSI remains neutral within the 45–55 range, while MACD hovers near the zero line, reinforcing the classic “coiled spring” technical setup.
BoE Outlook: Rates Held at 3.75% as Bailey Dismisses Immediate Tightening Expectations
The Bank of England kept its Bank Rate unchanged at 3.75% during the March MPC meeting, with policymakers voting unanimously to maintain current settings. The April 30 meeting produced another widely expected hold, in line with the consensus forecast among Reuters-polled economists.
A key takeaway for markets has been Governor Andrew Bailey pushing back against expectations of near-term rate hikes. Despite persistent inflation pressures in the eurozone and elevated US CPI readings, the BoE continues to characterize the UK’s inflation overshoot as largely temporary and energy-related rather than deeply embedded in the domestic economy.
Current market pricing implies around 39 basis points of tightening over the next 12 months — effectively suggesting one modest rate increase spread gradually across the year instead of an aggressive hiking cycle.
The central bank’s cautious stance also reflects concerns about weakening domestic demand. The MPC’s February 2026 projections showed a negative output gap of roughly 1% of GDP for 2026, a signal that economic slack may eventually argue more for easing than additional tightening.
Meanwhile, the BoE’s projected inflation range for Q2 and Q3 remains around 3.0%–3.5%, and March CPI at 3.3% arrived comfortably within that band. That outcome has given Bailey room to justify maintaining a patient, wait-and-see approach.
Markets had viewed the April rate decision as a potential catalyst for a larger move in GBP/USD. A clearly hawkish hold could have lifted Cable toward the 1.37–1.38 region, while a more dovish message risked reversing sterling’s recent gains. Instead, the BoE delivered a balanced and nuanced hold, helping keep GBP/USD anchored near the 1.3500 area rather than sparking a decisive breakout in either direction.
UK Macro Picture: Cooling Headline Inflation Meets Sticky Services Prices and Softening Labor Market
Sterling’s fundamental backdrop remains divided by what increasingly resembles a mild stagflationary environment in the UK economy.
Headline inflation eased notably in April, with CPI slowing to 2.8% year-over-year from 3.3% in March and 3.0% in February. The decline was partly supported by the regulator-controlled energy price cap, which helped limit the pass-through from Iran-related energy market volatility into household costs.
However, underlying inflation pressures remain elevated. Services inflation accelerated to 4.5% in March from 4.3% previously, while wage settlements for 2026 are tracking near 3.6% — both still well above levels the Bank of England would typically view as fully consistent with price stability.
At the same time, cracks are appearing in the labor market. UK unemployment unexpectedly climbed to 5.0% in the three months through March, up from 4.9%, while job vacancies fell 3.9% to around 705,000 — the weakest reading in five years, according to the Office for National Statistics.
This combination of softer headline inflation, persistent services-sector price pressure, weakening employment conditions, and a projected negative output gap has left the BoE stuck in a difficult policy position. Inflation in services remains too elevated to comfortably justify rate cuts, yet slowing growth and labor-market deterioration make aggressive tightening increasingly difficult to defend.
The uncertainty surrounding the broader geopolitical situation — particularly the potential economic consequences of the Iran conflict — has added another layer of caution to the central bank’s outlook.
That policy dilemma helps explain why the BoE has maintained its 3.75% Bank Rate despite conflicting economic signals. As noted by T. Rowe Price, the UK policy rate already sits near the upper end of the Federal Reserve’s range, giving sterling a degree of yield support against the dollar even before any additional BoE tightening is considered.
Fed Outlook: Warsh Transition, Split FOMC, and Rising Odds of Another Rate Hike
The US side of the GBP/USD rate differential is entering a period of added uncertainty as leadership changes at the Federal Reserve reshape market expectations.
Jerome Powell officially concluded his term as Fed Chair on May 15, while Kevin Warsh is expected to preside over the June 16–17 FOMC meeting after his nomination advanced through the Senate Banking Committee.
The April 28–29 FOMC meeting kept rates unchanged at 3.50%–3.75%, but the decision came with an unusually divided 8–4 vote — the highest number of dissents since 1992. The split highlighted growing disagreement within the committee over whether policymakers should respond more aggressively to Iran-related energy inflation risks.
Markets are now pricing roughly a 25% probability of a quarter-point hike by December, according to CME FedWatch estimates, up from around 21.5% earlier in the month. Investors also increasingly expect Warsh to adopt a more hawkish tone, particularly regarding balance-sheet policy and the broader inflation outlook.
US Treasury yields remain elevated, reinforcing underlying dollar support. The 10-year yield is trading around 4.47%–4.59%, the 30-year near 5.02%–5.12%, and the 2-year around 4.08%. Those yield levels continue to favor the dollar versus sterling unless the Bank of England unexpectedly shifts toward a more aggressive tightening stance.
For GBP/USD, the policy asymmetry remains critical. A hawkish surprise from Warsh — especially a June rate increase or stronger tightening guidance — could drag Cable back toward the 1.3300 region. Conversely, if the Fed signals a willingness to prioritize growth risks and eventually cut rates despite elevated inflation, sterling could regain momentum toward the 1.3700 area and beyond.
Rate Parity and the BoE–Fed Dynamic: The Core Driver Behind Cable’s Q3 Outlook
The defining structural feature of GBP/USD right now is the unusually tight rate alignment between the Bank of England and the Federal Reserve.
With the BoE’s Bank Rate at 3.75% and the Fed funds range sitting at 3.50%–3.75%, sterling assets currently offer yields that are marginally above comparable dollar-denominated assets. That 0–25 basis-point differential is historically narrow and reflects how closely the two policy paths have converged since the post-2024 normalization cycle began.
The market implication is straightforward but highly important for Cable:
Any hawkish shift from the BoE — whether through dissenting MPC votes, firmer guidance language, or upgraded inflation forecasts — would likely widen the yield advantage in sterling’s favor and push GBP/USD toward the 1.3600–1.3700 region.
Conversely, a dovish turn from the BoE, especially if rising unemployment and a negative output gap eventually force rate cuts, could push the differential back in favor of the dollar and drag Cable toward 1.3300–1.3200.
The same logic applies on the US side. A more hawkish Kevin Warsh-led Fed would strengthen the dollar by widening rate spreads against sterling, while a dovish pivot would erase much of the dollar’s remaining yield advantage and weaken USD broadly.
That interaction makes GBP/USD arguably the most policy-sensitive G10 currency pair heading into Q3 2026. The June 16–17 FOMC meeting and the next BoE decision later in June are increasingly viewed as the two major binary catalysts likely to define the pair’s medium-term direction.
Meanwhile, the broader dollar backdrop remains constructive but far from decisively bullish.
The U.S. Dollar Index is trading near 99.27, its highest level in roughly five weeks, supported by renewed safe-haven demand linked to Iran tensions and firmer US Treasury yields. Even so, the index remains well below the wartime spike above 100 recorded earlier in April when the conflict initially pushed oil prices toward $116 per barrel.
The broader 2026 dollar story has been one of stabilization after extreme volatility:
DXY fell roughly 11% during the first half of 2025 — its steepest H1 decline since 1973 — amid tariff-related capital outflows.
The index bottomed near 96.5 in September 2025.
Since then, it has largely consolidated within a 96–100 range through most of Q2 2026.
According to Cambridge Currencies, DXY could drift toward 94–98 in Q3 and potentially 90–96 by Q4, a scenario broadly consistent with their year-end GBP/USD projection around 1.37–1.42 if second-half dollar weakness develops.
Yield spreads also continue to shape relative currency flows. The US–Germany 10-year spread remains elevated near 159 basis points, while the equivalent US–UK spread is notably narrower at roughly 60–80 basis points depending on daily moves — another reason sterling has held up comparatively well against the dollar.
Positioning data further complicates the outlook. CFTC figures show speculative USD net longs near the 18th percentile on a 52-week basis, meaning market positioning remains relatively light in dollar exposure. That creates the potential for an asymmetric short squeeze in the dollar if geopolitical tensions ease abruptly or if the Fed unexpectedly turns more hawkish.
The institutional forecast range for GBP/USD remains unusually wide by G10 standards, reflecting the high degree of uncertainty surrounding both central-bank policy and geopolitical developments.
The bearish end of the spectrum is led by Goldman Sachs, which projects Cable near 1.36 by the end of 2026. Goldman’s view is that sterling remains heavily tied to broader EUR/USD dynamics and lacks a strong independent catalyst, especially as slower UK growth and fiscal tightening limit upside potential even in an environment of moderate dollar weakness.
JPMorgan Chase holds a more cautious medium-term stance, expecting GBP/USD around 1.39 in early 2026 before easing back toward 1.36 later in the year. Their framework centers on cyclical US economic slowing and expanding fiscal concerns weighing on the dollar, though they remain wary of UK-specific risks such as potential BoE easing toward 3.25% or lower. As a result, JPMorgan favors tactical sterling longs rather than aggressive structural bullish positions.
Meanwhile, MUFG sees Cable moving toward 1.40 by mid-2026, broadly in line with a gradual unwinding of US dollar strength.
A somewhat more constructive outlook comes from Cambridge Currencies, which forecasts GBP/USD in the 1.37–1.42 range by year-end. That scenario depends heavily on continued de-escalation in the Iran conflict and at least one rate cut from a Federal Reserve led by Kevin Warsh.
The most bullish major-bank projection currently comes from Morgan Stanley, targeting 1.47 by the end of 2026. Their thesis assumes three Fed rate cuts in the first half of the year, driving policy rates toward 3.00% and significantly reducing the dollar’s yield advantage. However, Morgan Stanley has recently softened some of its bullish conviction as the dollar continues to show resilience amid geopolitical uncertainty and elevated Treasury yields.
Outside the major-bank consensus, Long Forecast projects GBP/USD around 1.4750 by the end of 2026, with a longer-term bullish scenario extending toward 1.5500 by late 2028.
On the downside, the principal bearish risk scenario remains a combination of dovish BoE policy and renewed escalation in the Iran conflict. Under that setup, Cable could fall toward 1.32, with stronger long-term structural support expected near 1.30.
Overall, Reuters analyst surveys continue to show the broad consensus clustered between 1.36 and 1.40 for year-end 2026, reinforcing the idea that markets expect gradual sterling appreciation — but not a disorderly collapse in the dollar.
Cross-Asset Snapshot: Tight Yield Spreads, Choppy Oil, and a Resilient Dollar
Tuesday’s cross-asset backdrop around GBP/USD reflected a broader “risk-off-light” market tone, with price action driven primarily by shifting geopolitical headlines and bond-yield volatility.
The U.S. 10-Year Treasury Yield initially fell roughly 7 basis points to around 4.47% following temporary optimism surrounding Iran peace discussions, before rebounding back toward 4.50% after comments from Donald Trump reignited demand for safe-haven positioning. That sharp intraday reversal has made it difficult for FX traders to establish durable positions around the US-UK yield differential.
Meanwhile, UK 10-year gilt yields remain anchored near the 4.5% area, holding close to the highest levels seen since 2008 as markets continue to price persistent inflation risks tied to the Iran conflict and elevated energy prices.
Oil markets also stayed highly volatile. Brent Crude rebounded toward $100.40 after falling as low as $96.20 earlier in the session, while West Texas Intermediate climbed back near $94.19. The sharp swings in crude prices continue to dominate broader macro sentiment across G10 FX markets.
Elsewhere, Gold fell around 1.1% to roughly $4,521.80 per ounce, reinforcing the broader picture of renewed dollar firmness and higher real-yield support. Bitcoin also weakened, slipping toward $76,700 as risk appetite softened.
Taken together, the combination of elevated US yields, a steadier dollar, and unstable energy markets creates a challenging environment for sterling. Compared with the euro, the pound tends to exhibit higher sensitivity to rising US yields, while the UK economy remains more exposed to oil- and gas-driven inflation shocks due to its heavier reliance on imported natural gas.
Positioning Dynamics: Limited Sterling Exposure, Crowded Dollar Shorts
Speculative positioning data continues to reinforce the broader asymmetry embedded in the current GBP/USD setup.
According to recent Commodity Futures Trading Commission data, net long positioning in the US Dollar remains historically light, sitting near the 18th percentile on a 52-week basis. Aggregate USD positioning is still close to heavily shorted territory, with speculative net shorts around 28,450 contracts and long exposure declining by roughly 2,750 contracts week-over-week.
Sterling positioning, by contrast, appears far more balanced. CFTC data shows GBP net shorts at only moderate levels, indicating that traders are neither aggressively bullish nor heavily bearish on the pound at current levels.
That distinction matters because the dollar’s recent strength does not appear to be driven primarily by speculative momentum buying. Instead, the bid has been supported by genuine safe-haven demand and higher US yield differentials — flows that tend to be more durable in the short term, but also highly vulnerable to a sudden geopolitical de-escalation.
For GBP/USD, the implication is asymmetric:
A credible Iran de-escalation agreement or broader geopolitical breakthrough could trigger a rapid unwinding of defensive dollar positioning, allowing Cable to accelerate quickly toward the 1.3600–1.3700 zone.
However, that upside scenario likely requires a clean diplomatic outcome with sustained confidence that regional tensions are easing materially.
On the other hand, if the conflict drags on without resolution, the positioning backdrop suggests a slower, steadier grind lower for sterling rather than a disorderly collapse, as investors continue favoring the dollar’s safe-haven and yield advantages.
Key Risks to the Bullish GBP/USD Outlook
The bullish case for Cable remains highly conditional and vulnerable to several major macro and geopolitical risks.
The first and most immediate threat would be a dovish surprise from the Bank of England. If UK unemployment continues rising above 5.0% and economic activity weakens further, the BoE could eventually be forced to cut rates back toward 3.50%. Such a move would likely erase sterling’s narrow yield advantage over the dollar and push GBP/USD below the critical 1.3400 support area, potentially opening a move toward 1.3300. In that context, Governor Andrew Bailey’s repeated pushback against rate-hike expectations may partly reflect an effort to preserve policy flexibility should growth conditions deteriorate more sharply.
The second major risk centers on renewed escalation in the Iran conflict. A fresh surge in oil prices — particularly if Brent Crude climbs back above $110 per barrel — would likely drive US Treasury yields higher, strengthen the U.S. Dollar Index above the 100 level, and increase safe-haven demand for the dollar. Under that scenario, GBP/USD could slide toward the 1.3200 region.
A third vulnerability comes from UK fiscal policy. Rachel Reeves continues to face a difficult balancing act between fiscal discipline and economic support. Fiscal credibility concerns have periodically triggered sharp sterling selloffs, including the notable volatility episode in July 2025 that markets informally labeled “Pound Plummets on Chancellor’s Tears.” Any disappointing Spring Statement or Budget announcement could easily trigger another 200–300 pip downside adjustment in sterling.
The fourth risk factor is political instability. Upcoming by-elections, combined with uncertainty surrounding a potential autumn Budget, could reintroduce a meaningful political-risk premium into UK assets and weigh further on the pound.
The bearish interpretation has been summarized well by Rabobank, which argues that sterling may struggle to sustain recent gains amid persistent political uncertainty and a weak domestic macro backdrop.
By contrast, the bullish case for GBP/USD requires several conditions to align simultaneously:
sustained Iran de-escalation,
a relatively hawkish BoE hold,
a more dovish Federal Reserve pivot toward cuts,
and stable UK fiscal policy.
In practical terms, sterling likely needs at least three of those four factors to fall into place before a sustained move toward the 1.37–1.40 region becomes realistic.
Final Outlook: GBP/USD’s 1.3400–1.3700 Range Hinges on Camp David and the Warsh-Led Fed
GBP/USD’s move around 1.3446 leaves Cable firmly trapped within the 1.3400–1.3517 range that has dominated price action throughout most of May. The next decisive breakout now depends on three major catalysts expected over the coming month: the Camp David Iran peace talks, the late-June Bank of England meeting, and the June 16–17 Federal Reserve meeting expected to be led by Kevin Warsh.
The bullish scenario begins with a credible diplomatic breakthrough at Camp David. A meaningful Iran framework agreement that stabilizes the Strait of Hormuz and reduces safe-haven demand for the dollar could quickly lift GBP/USD toward 1.3600, with 1.3700 becoming the next major structural upside target.
If the BoE then delivers a hawkish hold — particularly through dissenting votes or firmer inflation guidance — the upside case strengthens further and aligns with Cambridge Currencies’ projected 1.37–1.42 range.
The most aggressive sterling-bullish path would emerge if Warsh subsequently signals a willingness to move toward Fed easing despite elevated inflation pressures. Under that setup, the broader dollar yield advantage would erode materially, making Morgan Stanley’s 1.47 year-end target increasingly plausible.
The bearish scenario requires the opposite chain of events:
failure or breakdown in the Camp David negotiations,
renewed Iran escalation pushing Brent Crude back above $110,
a dovish BoE shift that eliminates sterling’s narrow rate advantage,
or a hawkish Warsh-led Fed that drives the U.S. Dollar Index decisively above 100.
In that environment, GBP/USD would likely retest 1.3400 and potentially extend losses toward 1.3300, bringing the more conservative year-end forecasts from Goldman Sachs and JPMorgan Chase back into focus as the dominant structural baseline.
Technically, the unusually tight clustering of the 8-, 21-, 50-, and 100-day EMAs around current spot levels signals that a larger directional move is approaching. The catalyst calendar creates an asymmetric setup:
Iran de-escalation favors upside acceleration,
while disappointing UK macro data or dovish BoE signals favor downside pressure.
Ultimately, the defining question for GBP/USD through Q3 may simply be which side of 1.3500 the pair is trading on by July. For now, Tuesday’s rejection from 1.3517 back toward 1.3450 suggests that marginal capital flows still lean modestly in favor of the dollar.
The Canadian Dollar lacked clear direction against major currencies as investors monitored fresh updates on US-Iran negotiations. Meanwhile, Canada’s Q1 GDP is forecast to expand at an annualized rate of 1.5%.
The Canadian Dollar (CAD) traded mostly steady against its major counterparts on Wednesday’s Asian session, with the exception of the New Zealand Dollar (NZD), while hovering near 1.3810 against the US Dollar (USD).
The Loonie struggled to find clear direction as investors closely monitored fresh developments surrounding negotiations between the United States (US) and Iran aimed at permanently ending tensions in the Middle East and reopening the Strait of Hormuz.
Talks between Washington and Tehran remained ongoing despite Iran accusing the US of carrying out attacks that US Central Command described as “defensive” actions intended to protect American troops from threats posed by Iranian forces, according to the BBC.
Adding to optimism, an Iranian official stated on Tuesday that the final major obstacle in negotiations involves the release of frozen Iranian assets, with discussions reportedly being mediated by Qatar, according to Iran’s Fars news agency. Although there has been no official confirmation, the comments raised expectations that both sides may be nearing an agreement.
Meanwhile, attention in Canada has shifted toward upcoming monthly and first-quarter Gross Domestic Product (GDP) figures due on Friday. Canada’s monthly GDP is forecast to rise modestly by 0.1%, compared with the previous 0.2% increase. On an annualized basis, the economy is expected to grow 1.5% in Q1 after shrinking 0.6% previously.
USD/CHF edges higher to near 0.7830 during Tuesday’s early European trading hours.
Fresh US strikes have reduced optimism over a potential peace agreement, lending support to the US Dollar.
Despite the rebound, the pair maintains a bearish bias below the 100-day EMA, while the RSI continues to signal negative momentum.
Immediate resistance is seen at 0.7840, with the first support level located at 0.7808.
USD/CHF rebounds toward 0.7830 during Tuesday’s early European session, ending a four-day losing streak. Ongoing uncertainty over US-Iran peace talks is offering modest support to the US Dollar against the Swiss Franc.
According to reports, the US military’s Central Command stated on Monday that American forces conducted strikes in southern Iran in “self-defence.” The military added that it would continue protecting US personnel while exercising restraint amid the current ceasefire.
Investors are now focused on the US April Personal Consumption Expenditures (PCE) Price Index data, scheduled for release later on Thursday. Stronger-than-expected inflation readings could reduce expectations for Federal Reserve rate cuts and provide additional support for the Greenback in the short term.
Technical Analysis
On the daily chart, USD/CHF continues to display a bearish short-term bias, with the pair trading below the 100-day moving average (MA). The price also remains slightly beneath the 20-day Bollinger Band midpoint, highlighting ongoing upside pressure despite a mild rebound from recent lows. Meanwhile, the 14-day Relative Strength Index (RSI) stands at 48, just below the neutral 50 threshold, suggesting bearish momentum has weakened but has yet to turn bullish.
To the upside, the first resistance level is located at the 100-day MA around 0.7840. A sustained daily close above this zone would help ease near-term bearish pressure and could pave the way for a move toward the upper Bollinger Band near 0.7905.
On the downside, immediate support is seen at the May 26 low of 0.7808. Further weakness could expose the lower Bollinger Band around 0.7760. A break below this area would reinforce the broader bearish trend and increase the risk of fresh daily lows.
Kevin Warsh was officially sworn in today as the 17th Chairman of the FOMC, but persuading policymakers to support interest-rate cuts may prove challenging. The US labor market continues to show resilience — and may even be gaining momentum — while inflation remains above the Federal Reserve’s 2% objective.
Against that backdrop, the US Dollar Index could benefit from expectations of higher US interest rates. If the index breaks above near-term resistance around 99.50, it may quickly rally toward the psychologically important 100.00 level.
In relatively subdued trading ahead of the holiday weekend, Warsh formally succeeded Jerome Powell as the Fed’s new leader. As the preferred candidate of Donald Trump, Warsh is likely to face political pressure to lower borrowing costs. However, current economic conditions make a convincing argument for rate cuts difficult. The unemployment rate remains low, and the latest National Federation of Independent Business Small Business Optimism survey indicates the labor market could be strengthening further rather than slowing.
At the same time, inflation — the other pillar of the Federal Reserve’s dual mandate — is clearly moving in the wrong direction. No matter which inflation gauge is used, price growth remains above the Fed’s 2% target. Moreover, the ongoing conflict involving Iran is likely to add further upward pressure on prices in the months ahead, even if the Strait of Hormuz were to reopen immediately.
Against this backdrop, traders have begun pricing in the possibility of at least one interest-rate hike over the next year. According to the CME Group FedWatch tool, markets are currently assigning a 20% probability that the Federal Reserve could deliver two or more 25-basis-point rate increases by the end of next April.
Although Kevin Warsh is expected to be more cautious about raising interest rates than the average FOMC policymaker — largely due to the political circumstances surrounding his appointment — the broader policy outlook has become increasingly hawkish in recent months.
For now, the Federal Reserve is still expected to keep rates within the current 3.50%–3.75% range throughout the summer unless economic conditions shift unexpectedly. However, if inflation and labor-market data continue to remain strong, even the most dovish members of the committee may eventually have little choice but to support tighter monetary policy.
US Dollar Technical Outlook: DXY 4-Hour Chart
Turning our attention to the charts, higher US interest rates would be expected to support the world’s reserve currency, all else equal. The US Dollar Index (DXY) has been lagging the rally in 2-year Treasury yields (a proxy for near-term FOMC interest rate expectations) since the start of the month, hinting at the potential for a “catch-up” trade to the topside as we head toward June.
From a technical perspective, the US Dollar Index has carved out a sideways range between about 99.00 and 99.50 over the past week and a half, with a symmetrical triangle pattern forming within that zone over the course of this week. The rangebound trade has allowed the world’s reserve currency to correct its overbought condition through time, rather than an outright price correction, a bullish development that hints at another leg higher if 99.50 is eclipsed.
In that scenario, a quick rally toward the psychologically-significant 100.00 level would be the higher-probability development to watch, whereas a bearish breakdown below 99.00 would invalidate the bullish setup and point to a deeper retracement toward 98.50 next.
The US Dollar Index (DXY) is trading near the lower end of last week’s range at around 99.00.
Optimism surrounding a potential peace agreement with Iran is reducing demand for the safe-haven Greenback.
However, expectations of further Federal Reserve tightening are helping limit the USD’s downside pressure.
The US Dollar (USD) opened Monday’s session with a bearish gap, slipping from the 99.30 region — the bottom of last week’s trading range — toward 99.00. Although the US Dollar Index (DXY) remains supported above previous highs, improving sentiment over a possible US-Iran peace agreement and the potential reopening of the Strait of Hormuz are weakening demand for the safe-haven Greenback.
Investor confidence improved after US President Donald Trump suggested that a deal with Tehran may be near, encouraging a moderate risk-on mood in markets. However, Trump maintained a cautious stance, saying he had advised negotiators “not to rush into a deal” and warning that the US would continue blocking the Strait of Hormuz until an agreement is finalized.
Earlier in the day, US Secretary of State Marco Rubio stated that a “fairly strong proposal” to reopen Hormuz is currently under discussion, adding that diplomacy would be fully explored before alternative measures are considered.
Market activity is expected to remain subdued on Monday due to the US Memorial Day holiday closure. Investors are now turning their attention to Thursday’s release of the US Personal Consumption Expenditures (PCE) Price Index, a key inflation gauge closely watched by the Federal Reserve.
Recent US economic data has reinforced confidence in the resilience of the American economy. Combined with persistent inflation pressures, this has strengthened expectations that the Federal Reserve may need to keep interest rates elevated for longer. According to the CME FedWatch Tool, markets are now pricing in more than a 50% probability of another Fed rate hike this year, a factor that could continue limiting downside pressure on the US Dollar.
NZD/USD has been highly volatile throughout the week, and that remains the key theme. The pair appears to have support around the 0.58 level, while resistance is likely near 0.5950.
Overall, this market is likely to remain very choppy. However, with interest rates easing slightly toward the end of the week, the New Zealand dollar could gain some momentum and stage a rebound. On the other hand, if the pair falls below the 0.58 level, it may trigger an additional 100-point decline.
AUD/USD
AUD/USD has also seen a great deal of volatility, with the pair currently hovering around the 0.7150 level. This zone previously acted as resistance and should now provide support. If the pair breaks above this week’s candlestick high, it could pave the way for a move toward the 0.7275 level.
However, a break below the candlestick low could open the door for a decline toward the 0.70 level. It’s worth noting that the Australian dollar continues to outperform many other currencies against the US dollar. As a result, buying on pullbacks may still be the preferred strategy, although market conditions are likely to stay highly choppy.
Gold
The Gold market was also highly volatile this week. With U.S. interest rates remaining relatively elevated, it has become challenging for gold to maintain upward momentum. Overall, the market is likely to keep a close eye on the $4,600 level, as a breakout above that area could pave the way for a move toward $4,800.
On the downside, if price falls below the weekly candlestick low, it could trigger a decline toward the $4,300 level. Broadly speaking, gold continues to be heavily influenced by interest rate expectations — when U.S. rates rise, gold tends to weaken.
USD/CAD
The US dollar has been climbing against the Canadian dollar throughout the week, and that trend is likely to continue. A push toward the 1.39 level seems possible, although the move may remain uneven and volatile along the way.
USD/CAD is typically a range-bound market, so periods of choppy price action would not be unusual. Traders should keep an eye on US interest rates, as further increases could provide additional strength for the pair. Meanwhile, Canada’s economy continues to show signs of weakness, which currently supports a stronger US dollar in this environment.
Bitcoin
Bitcoin ended the week slightly lower, but strong support still appears to be in place beneath current levels. The broader recovery trend remains intact, and the market could eventually rebound toward the $84,000 region. Despite recent geopolitical tensions and the outbreak of war, Bitcoin has shown notable resilience, which is a positive sign for bulls.
Price action is expected to remain volatile and noisy, so patience may be necessary. Another important factor is the continued inflow of institutional money into Bitcoin ETFs, as sustained investment demand could help support prices over time.
USD/MXN
The US dollar moved erratically against the Mexican peso throughout the week, hovering near the 17.33 area. Resistance is seen around 17.50, while the 17.00 level continues to provide support.
This pair is likely to remain highly volatile, with interest rate expectations continuing to influence sentiment. Since Mexico still offers significantly higher interest rates than the United States, traders may continue favoring strategies that involve selling USD/MXN rallies, especially when bearish reversal signals appear on shorter timeframes.
EUR/USD
The euro posted modest losses during the week and tested the 50-week EMA, although overall trading conditions remain choppy. Interest rate differentials between Europe and the US continue to dominate market sentiment, while the 1.16 level appears to be acting as a key price magnet.
The pair is drifting closer to the lower boundary of its broader consolidation range, which could open the door for a move toward 1.14. Ongoing concerns surrounding Europe’s energy situation may add downside pressure. On the other hand, if momentum improves, EUR/USD could attempt another rally toward the 1.1750 region.
NASDAQ 100
The Nasdaq 100 continued attracting buyers on pullbacks, reinforcing the market’s strong bullish momentum. Investors increasingly appear focused on the possibility of the index reaching the 30,000 level, especially as enthusiasm surrounding artificial intelligence continues to drive technology stocks higher during earnings season.
For now, buying dips remains the dominant strategy. Rising interest rates could eventually create headwinds for equities, but the Nasdaq 100 has so far shown an ability to overlook many macroeconomic concerns. At the current pace, a move toward 30,000 seems increasingly realistic.
EUR/USD stays under pressure for a second consecutive session, hovering near 1.1610 during Asian trading hours. The pair weakens as the US Dollar holds firm amid growing expectations of a hawkish Federal Reserve stance. Meanwhile, extended energy supply disruptions caused by the ongoing conflict risk fueling US core inflation and consumer price expectations, potentially encouraging the Fed to maintain higher interest rates for longer.
Technical Analysis
On the five-minute chart, EUR/USD is trading at 1.1621, maintaining a slightly bearish intraday tone as it stays just below the daily opening level of 1.1626. This suggests that upside momentum remains limited while the market continues to absorb earlier selling activity. Meanwhile, the Stochastic RSI has rebounded from oversold conditions into the mid-30 range, indicating that bearish pressure is easing somewhat, although there is still no clear sign of a strong bullish reversal.
To the upside, the first resistance level appears near the daily open at 1.1626. A sustained move above this area would be required to improve the short-term outlook. With no significant nearby support levels visible in the provided data, traders may continue viewing minor pullbacks as vulnerable as long as the pair trades below the daily open. Current momentum indicators point more toward a limited corrective recovery rather than the start of a broader trend reversal.
On the daily chart, EUR/USD is trading around 1.1619 and retains a bearish near-term outlook, as price action remains below the 50-day Exponential Moving Average (EMA) at 1.1683 while hovering just above the 200-day EMA at 1.1618. This setup implies that rallies toward the 1.1680 region could continue to attract selling interest. At the same time, the Stochastic RSI has fallen deeply into oversold territory near 11, signaling that downside momentum may be becoming overstretched in the short term.
On the upside, the 50-day EMA around 1.1683 serves as the key resistance level, and continued trading beneath it would keep bearish pressure intact. On the downside, the 200-day EMA at 1.1618 acts as immediate support. A decisive daily close below this level could trigger another leg lower, whereas maintaining support above it may allow for a corrective rebound within the broader bearish structure.
Fundamental Analysis
A stronger outlook for the US economy is reinforcing expectations for tighter monetary policy and providing additional support for the US Dollar.
Federal Reserve officials remain cautious as they assess the future path of short-term interest rates. Although policymakers are currently keeping the federal funds rate unchanged, they are gradually stepping away from expectations of rate cuts and showing greater willingness to consider further rate hikes should inflation remain persistent.
Meanwhile, the administration of US President Donald Trump announced that Trump will officially swear in Kevin Warsh as Chair of the US Federal Reserve on Friday at the White House. Warsh replaces Jerome Powell, whose term expired Friday but who remained in the role temporarily during the transition period.
On the economic front, data from the US Department of Labor showed that Initial Jobless Claims declined by 3,000 to 209,000 in the second week of May, highlighting continued strength in the labor market. However, Continuing Jobless Claims edged higher to 1.782 million for the week ending May 9, compared with 1.776 million in the prior week.
The Euro weakened against the US Dollar after traders responded to an unexpected contraction in the Eurozone economy. Preliminary S&P Global PMI data released Thursday showed that business activity across the Euro Area contracted in May at the fastest pace since late 2023. The downturn was largely attributed to a conflict-driven rise in living costs, which weighed on services demand and pushed input price inflation to its highest level in three years.
Attention now turns to upcoming German economic releases, including the June GfK Consumer Confidence Survey, first-quarter GDP figures, and the IFO Business Climate Survey.
AUD/USD could climb toward the nine-day EMA at 0.7164.
The 14-day RSI, hovering near 48, suggests the recent decline is entering a consolidation phase with no clear dominance from either buyers or sellers.
On the downside, immediate support is seen at the 50-day EMA around 0.7115.
AUD/USD extends its decline after posting modest losses in the previous session, trading near 0.7140 during Friday’s Asian session. Technical analysis on the daily chart shows the pair continuing to trade within a developing descending wedge pattern, pointing to two possible outcomes depending on how price behaves around the formation’s boundaries.
A clear breakout above the wedge’s descending resistance line would indicate renewed bullish momentum and raise the prospect of a trend reversal to the upside. However, as the pattern is still forming, failure to overcome the upper boundary could keep the pair trapped in a period of choppy, downward consolidation until a decisive breakout emerges.
The pair remains supported above the 50-day Exponential Moving Average (EMA) while facing resistance from the nine-day EMA. Combined with the 14-day Relative Strength Index (RSI), which is hovering around the neutral 48 level, the setup reflects a consolidative bias with limited momentum from either buyers or sellers following the recent retreat.
On the upside, AUD/USD could test initial resistance at the nine-day EMA near 0.7164, followed by the upper edge of the descending wedge around 0.7200. A successful breakout above that region may open the door for a move toward 0.7277 — the highest level since June 2022, reached on May 6.
To the downside, immediate support is located at the 50-day EMA around 0.7115, with additional support near the wedge’s lower boundary at 0.7080. A sustained move below this area could intensify bearish pressure and expose the pair to a deeper decline toward the four-month low of 0.6833 recorded on March 30.
The US Dollar Index remained largely steady as investors balanced optimism over US-Iran peace negotiations with rising tensions around the Strait of Hormuz. President Trump stated that talks between Washington and Tehran are entering their final phase, while the latest FOMC Minutes revealed that most Fed officials signaled the possibility of further rate hikes if inflation remains above the 2% target.
The US Dollar Index (DXY), which tracks the Greenback against a basket of six major currencies, traded little changed around 99.10 during Thursday’s Asian session after posting modest losses in the previous session.
The US Dollar remained supported as investors weighed the economic impact of ongoing US-Iran peace negotiations against escalating tensions surrounding the strategically vital Strait of Hormuz shipping route.
According to a Bloomberg report on Wednesday, President Donald Trump said negotiations with Iran are approaching their final stage, while also warning that military action could resume within days if Tehran refuses US demands. Iranian President Masoud Pezeshkian responded by rejecting any notion of surrender, stating on X that attempts to force capitulation through pressure were merely an illusion.
Meanwhile, the minutes from the Federal Open Market Committee’s April meeting revealed a hawkish stance among Federal Reserve officials. Most policymakers indicated that further interest rate hikes could be necessary if inflation remains persistently above the Fed’s 2% target, with concerns growing over inflationary risks linked to the Iran conflict.
GBP/USD remains subdued below the SMAs near 1.3420 as the UK unemployment rate ticks higher.
The near-term outlook stays bearish, with additional selling pressure likely below 1.3200.
GBP/USD remains under pressure below its 50- and 200-day simple moving averages (SMAs) around 1.3420 as traders weigh weak political sentiment and softer UK economic data. Earlier on Tuesday, the UK unemployment rate rose to 5.0%, while April employment showed a decline of 100,000 jobs.
Technically, near-term momentum continues to favor the downside, with the RSI staying below the neutral 50 threshold and the MACD drifting into negative territory.
If resistance at 1.3420 continues to cap gains, the pair could revisit support near 1.3300. A stronger support region may then emerge around 1.3200–1.3235 before the broader outlook turns decisively bearish, opening the door for a deeper slide toward 1.3090.
On the upside, confirmation of Monday’s bullish engulfing candle through a break above 1.3420 could pave the way for a move toward the 20-day SMA and the 1.3520 area. A sustained rise beyond 1.3600 may also allow the pair to print a fresh short-term high near 1.3700, reviving the broader recovery trend.
Overall, GBP/USD remains vulnerable while trading beneath the 50- and 200-day SMAs near 1.3420. Still, a more pronounced bearish outlook would likely require a decisive breakdown below the 1.3200–1.3225 support zone.
UK annual headline inflation is expected to soften in April even as monthly inflation edges higher.
The upcoming UK CPI report could give the BoE additional room to leave interest rates unchanged in June.
Pressure on the Pound Sterling remains to the downside, while an inflation figure above forecasts may add to the currency’s weakness.
The Office for National Statistics is set to release the UK Consumer Price Index (CPI) data for March at 06:00 GMT.
As inflation remains a key focus for central banks, investors will closely examine April’s CPI figures for clues on the next policy move by the Bank of England. Any significant divergence from market expectations could trigger short-term volatility in the British Pound (GBP).
What to expect from the upcoming UK inflation report
UK annual inflation is projected to ease to 3% in April from 3.3% in March, although monthly CPI growth is expected to accelerate slightly to 0.9% from the previous 0.7% reading.
The reduction in Ofgem’s energy price cap ahead of the Iran conflict appears to have helped limit the impact of higher energy costs, while fading Easter-related price effects have also contributed to moderating inflation pressures.
Core CPI, which excludes volatile items such as energy, food, alcohol, and tobacco, is projected to slow to 2.6% YoY in April — the weakest pace since July 2021 — reinforcing expectations for softer overall inflation.
Alongside the CPI report, the Office for National Statistics will also release April’s Producer Price Index (PPI) data. PPI Input inflation is forecast to cool sharply to 1% from 4.4% in March, while PPI Output inflation is expected to edge up slightly to 1% YoY from 0.9%.
If confirmed, easing inflation pressures could reduce the urgency for the Bank of England to raise interest rates, particularly as UK unemployment continues to rise following Tuesday’s labor market data. However, the relief may prove temporary. Ofgem is scheduled to revise the energy price cap in July, likely leading to higher household energy bills and renewed upward pressure on headline inflation. The BoE currently expects inflation to peak around 4% later this year.
Analysts at TD Securities noted that while the latest inflation figures may offer short-term reassurance, the full impact of higher energy costs is expected to emerge in the third quarter, with potential second-round inflation effects later in the year.
How could the UK CPI report impact GBP/USD?
Inflation remains a central factor in BoE policymaking and therefore has a major influence on the British Pound. Still, Sterling has been weighed down in May by mounting political uncertainty following the Labour Party’s poor performance in local elections, creating additional pressure on the currency.
In this context, a softer-than-expected inflation reading could offer some support to the Pound by giving the BoE more flexibility to monitor domestic conditions and assess the economic fallout from tensions in the Middle East before adjusting interest rates. BoE Deputy Governor Sarah Breeden warned on Monday that political uncertainty is affecting the business climate and cautioned policymakers against acting too aggressively on rates.
On the other hand, a stronger-than-expected inflation print could place the BoE in a more difficult position and potentially deepen bearish sentiment toward the Pound.
From a technical standpoint, Guillermo Alcala believes the British Pound remains under pressure following last week’s decline. He noted that although Monday’s bullish engulfing pattern on the daily chart helped reduce some downside momentum, the near-term outlook for GBP remains bearish. According to Alcalá, buyers still require stronger momentum to reclaim the former support zone near 1.3450 and shift attention toward the mid-May highs around 1.3530–1.3540.
On the downside, he highlighted Monday’s low near 1.3305 as an important support level. A decisive break below that area could pave the way for further losses toward the late-March and early-April highs around 1.3175.
USD/CHF moves higher as the US Dollar finds support after President Trump threatened to renew attacks on Iran.
Meanwhile, the US 30-year Treasury yield eased to 5.181% after reaching a near 19-year peak of 5.200% on Wednesday.
In Switzerland, preliminary data showed the economy expanded 0.5% in the first quarter, marking its strongest quarterly growth in a year and pointing to a recovery in economic activity.
USD/CHF continued to climb for a second straight session, trading near 0.7890 during Wednesday’s Asian session as demand for safe-haven assets boosted the US Dollar. Market sentiment remained cautious after a Bloomberg report indicated that President Donald Trump had threatened to restart attacks on Iran within days in an effort to pressure Tehran into ending the conflict with Israel. The warning followed a temporary pause in military action after Iran reportedly presented a new proposal aimed at de-escalation.
Concerns over rising energy prices linked to the conflict have also fueled fears of stronger inflationary pressures in the United States. Higher oil prices reinforced expectations that the Federal Reserve could keep interest rates elevated for a longer period or potentially tighten policy further if inflation remains persistent.
Meanwhile, US Treasury yields stayed near multi-month highs. The 30-year Treasury yield eased slightly to 5.181% after touching a nearly 19-year high of 5.200% earlier on Wednesday. At the same time, the 10-year yield hovered close to a 16-month peak of 4.687%, while the 2-year yield remained near a 15-month high of 4.139%, both levels reached on Tuesday.
In Switzerland, preliminary data showed the economy expanded by 0.5% quarter-over-quarter in the first quarter of 2026, up from 0.2% growth in the previous quarter. The reading marked the country’s strongest quarterly growth in a year and suggested that the Swiss economy continues to recover steadily. Investors are now awaiting Switzerland’s first-quarter Industrial Production data, scheduled for release on Thursday.
EUR/USD edged lower to around 1.1645 during Tuesday’s early Asian trading session as the US Dollar gained support from ongoing geopolitical uncertainty. President Trump said he had postponed a planned strike on Iran following requests from Gulf nations. Meanwhile, European Central Bank officials signaled that another interest rate hike could be needed to contain persistent inflation expectations.
EUR/USD remains under pressure near 1.1645 during Tuesday’s early Asian session as the Euro weakens against the US Dollar amid ongoing geopolitical uncertainty tied to Iran. Investors are also awaiting remarks later in the day from ECB Chief Economist Philip Lane.
US President Donald Trump stated that he had delayed a planned military strike on Iran following appeals from leaders of Qatar, Saudi Arabia, and the United Arab Emirates, noting that “serious negotiations are now taking place,” according to the BBC.
Still, market caution persists after Trump warned that the US could launch a “full, large-scale attack on Iran” at any time if negotiations fail to produce an acceptable agreement. Concerns over an extended Middle East conflict continue to support safe-haven demand for the US Dollar, weighing on the EUR/USD pair in the short term.
Meanwhile, hawkish rhetoric from European Central Bank officials may help limit losses for the Euro. ECB Governing Council member Yannis Stournaras said over the weekend that a moderate rate hike could help contain inflation without significantly harming economic growth.
A Reuters survey also showed that roughly 85% of economists expect the ECB to raise its deposit rate by 25 basis points to 2.25% in June, compared with just over half holding that view before the April policy meeting.
The US Dollar Index remains supported by growing expectations that the US Federal Reserve will maintain a more hawkish policy stance.
Meanwhile, the benchmark 10-year US Treasury yield briefly surged to 4.659% — its highest level since February 2025 — before pulling back to around 4.591%.
Geopolitical tensions also eased temporarily after President Trump postponed a planned military strike on Iran following requests from Gulf states.
The US Dollar Index (DXY), which tracks the US Dollar (USD) against a basket of six major currencies, edged higher during Tuesday’s Asian session, recovering after posting mild losses in the previous trading day and hovering near the 99.10 mark.
The Greenback found support from growing expectations that the US Federal Reserve (Fed) could maintain a more hawkish monetary policy stance. Overnight, the benchmark 10-year US Treasury yield climbed to 4.659% — its highest level since February 2025 — before easing back to around 4.591%. The spike in yields reflected investor concerns that persistently high energy prices may feed into consumer inflation, potentially forcing the Fed to keep interest rates elevated for longer.
Investors are also paying close attention to developments within the US central bank. According to Reuters, DRW Trading market strategist Lou Brien said recent market volatility has been driven by investors assessing how newly appointed Fed Chair Kevin Warsh will respond to inflationary pressures. Brien noted that markets are looking for reassurance that Warsh will uphold the Fed’s traditional policy mandate and remain independent from political influence coming from the White House.
Despite the Dollar’s strength, improving market sentiment limited safe-haven demand for the currency. Sentiment improved after US President Donald Trump announced a delay to a planned military strike on Iran. Reports indicated that Trump suspended the scheduled Tuesday attack after Persian Gulf allies urged Washington to allow more time for diplomatic negotiations. While the US administration stated it remains ready to act militarily if talks fail, officials have not provided a specific deadline for any potential action.
The US Dollar strengthened notably against the Japanese Yen during the week, climbing back above the key ¥158 level. The widening interest rate gap remains a primary factor driving the pair higher, as Japan continues to face limitations in tightening monetary policy too aggressively.
In many ways, this market continues to reward traders who hold US Dollars instead of Japanese Yen, largely due to the attractive yield advantage. The broader sentiment remains bullish, though traders should closely monitor the ¥160 region, as it has previously prompted intervention from Japan’s central bank.
EUR/USD
The Euro fell sharply during the week and now appears likely to move toward the lower end of the broader trading range that has been in place for months. A decline toward the 1.14 level would not be surprising, as that area has served as a major support zone since around March.
In the end, persistent high interest rates in the United States continue to support the bullish outlook for the US Dollar, keeping demand for the currency strong. At the same time, markets increasingly appear to be pricing in the risk of energy-driven inflation shocks across the global economy.
Natural Gas
Natural gas prices moved higher during the week, although the $3 level continues to stand out as a significant resistance zone. Selling into excessive bullish momentum still appears attractive, particularly if prices approach the $3 mark again.
I don’t view this as the beginning of a major or long-term move higher. Instead, it seems more like a short-term “fade the rally” setup, especially since this period of the year typically brings softer natural gas demand.
Crude Oil
The light sweet crude oil market posted strong gains during the week, although price action remains extremely volatile. That instability is likely to persist as traders continue reacting to geopolitical headlines and developments coming out of the Middle East.
Ongoing concerns surrounding energy inflation continue to shape market sentiment, with traders increasingly fearing that further economic pressure could lie ahead before conditions improve. Global markets are also beginning to feel the impact of reduced Middle Eastern oil flows, as previously stored supplies on tankers are gradually being depleted. As a result, crude oil is likely to remain a highly volatile and unpredictable market in the near term.
Bitcoin
Bitcoin declined over the course of the week, but the broader bullish pressure remains intact as the market continues to test higher levels. Notably, Bitcoin showed relative strength while many other assets struggled, marking a shift from its behavior in previous periods when it often moved lower alongside broader market weakness.
Despite elevated interest rates, Bitcoin’s resilience has been difficult to ignore. Under normal circumstances, the market could have experienced a much deeper pullback months ago, yet buyers have consistently stepped in to support prices. Sometimes it is more important to focus on what the market is actually doing rather than what it is theoretically supposed to do, and right now Bitcoin still appears to be attracting buyers.
Gold
Gold prices came under heavy selling pressure during the week, and continued increases in interest rates are likely to remain a major headwind for the market. With prices now trading below the $4,600 level, attention is shifting toward the $4,500 area as the next key support zone.
A break below the $4,500 level could pave the way for a deeper decline toward the 50-week EMA. On the upside, short-term rebounds are likely to face resistance near the $4,800 region, and as long as US 10-year Treasury yields remain elevated, gold may continue to encounter selling pressure.
Silver
Silver endured a very difficult week after initially appearing ready for a major breakout higher. However, the $90 level once again acted as strong resistance, effectively halting the rally. Rising interest rates in the United States have continued to weigh heavily on silver prices, which has historically been a negative factor for the metal over the longer term.
Silver is now forming a very bearish-looking weekly candlestick pattern, which could signal additional downside pressure ahead. A decline back toward the $70 level would not be surprising, as that area has previously served as a major support zone. Overall, silver remains an extremely risky and volatile market at the moment.
USD/MXN
The US Dollar strengthened against the Mexican Peso during the week, although the pair remains stuck within the broader consolidation range that has been in place for some time. The 17.50 level continues to act as a major resistance barrier, while the 17.20 area underneath provides important support.
The pair is likely to remain range-bound for now, as the stronger US Dollar is being offset by the attractive interest rate differential offered by the Mexican Peso. While the Dollar has been gaining against many currencies, the yield advantage in Mexico still encourages traders to sell rallies in USD/MXN. As a result, the market may continue moving sideways until broader macroeconomic uncertainties become clearer.
EUR/USD declines further toward 1.1655 as the US Dollar continues to strengthen amid several supportive factors.
Both the US and China maintain that the Strait of Hormuz should remain open.
The Federal Reserve is expected to keep interest rates unchanged this year.
The EUR/USD pair continues its decline for a fourth consecutive session on Friday, slipping 0.15% to around 1.1653 during Asian trading hours. The pair remains under pressure as the US Dollar (USD) strengthens further after encouraging developments from Thursday’s meeting between United States (US) President Donald Trump and Chinese President Xi Jinping.
At the time of writing, the US Dollar Index (DXY), which measures the Greenback against a basket of six major currencies, is up 0.15% near 99.00, marking its highest level in two weeks.
Remarks from both Trump and Xi suggested improving trade relations between the US and China, while both leaders also emphasized the importance of keeping the Strait of Hormuz open.
The US Dollar is also drawing support from growing expectations that the Federal Reserve (Fed) will keep interest rates unchanged throughout this year.
Meanwhile, in the Eurozone, most economists surveyed by Reuters expect the European Central Bank (ECB) to implement an interest rate hike at its June policy meeting.
Technical Analysis
EUR/USD remains under pressure around 1.1653 during the Asian session, with the pair maintaining a bearish short-term outlook as it trades below the 20-day Exponential Moving Average (EMA) at 1.1710. A confirmed breakdown of the Double Top pattern after falling beneath the April 30 low at 1.1655 signals the potential for further downside extension.
Meanwhile, the Relative Strength Index (RSI) near 44 continues to point lower, suggesting bearish momentum remains active and selling pressure has not yet faded.
To the upside, the first resistance level is seen at the 20-day EMA around 1.1710. A move back above this zone could reduce near-term bearish pressure and support a broader recovery toward 1.1800. On the downside, key support levels are located at the April 8 low of 1.1589 and the April 6 low near 1.1505.
The US Dollar Index strengthened after April Retail Sales rose 0.5% month-over-month, surpassing market expectations. Meanwhile, Stephen Miran’s resignation from the Fed Board has paved the way for Kevin Warsh to take over as Federal Reserve Chair. At the same time, President Trump said US-China relations could become “better than ever,” while Chinese President Xi signaled a willingness to help ease tensions surrounding the Iran conflict.
The US Dollar Index (DXY), which tracks the US Dollar (USD) against a basket of six major currencies, extended its rally for a fifth straight session, trading near 99.10 during Friday’s Asian session.
The Greenback strengthened after the release of solid US Retail Sales data, which showed a 0.5% month-over-month increase in April, highlighting the resilience of US consumer spending despite persistently high borrowing costs.
Support for the US Dollar also came from developments within the Federal Reserve, as Stephen Miran’s resignation from the Board of Governors has opened the door for Kevin Warsh to become the next Fed Chair.
At the same time, rising inflationary pressures tied to escalating Middle East tensions have strengthened expectations that the Fed could keep interest rates elevated for longer or potentially raise them further.
Meanwhile, US President Donald Trump said on Thursday that he hopes relations with China will become “stronger and better than ever before,” adding that President Xi had offered support in helping ease tensions surrounding the Iran conflict. The improving diplomatic tone boosted market risk sentiment, which typically limits demand for the US Dollar’s safe-haven appeal.
AUD/USD eases to near 0.7250 during Thursday’s Asian trading session.
US producer inflation unexpectedly posted its sharpest increase in four years.
Donald Trump is set to meet with Xi Jinping in China for a closely watched high-level discussion.
The AUD/USD pair declines toward 0.7250 during Thursday’s Asian session as stronger-than-expected US inflation figures lend support to the US Dollar against the Australian Dollar. Investors are also keeping a close eye on the summit between US President Donald Trump and Chinese President Xi Jinping in Beijing, along with the upcoming release of US April Retail Sales data later in the day.
US producer inflation recorded its strongest annual increase in four years in April, reinforcing demand for the Greenback. According to data published by the US Bureau of Labor Statistics on Wednesday, the Producer Price Index (PPI) climbed 6.0% year-over-year, up from 4.3% previously. On a monthly basis, PPI advanced 1.4% in April after rising 0.7% in March, significantly exceeding market expectations of 0.5%.
Market participants are now turning their attention to Thursday’s US Retail Sales report. Economists forecast retail sales growth of 0.5% month-over-month in April, following a 1.7% increase in March. Stronger-than-anticipated data could further strengthen the US Dollar and weigh on the AUD/USD pair.
Meanwhile, Bloomberg reported Wednesday that Trump arrived in Beijing for an official state visit, where he is expected to meet Xi Jinping to discuss trade relations and the conflict involving Iran. The trip marks the first state visit to China by a US president in nearly a decade. Any constructive outcomes from the US-China discussions may support the Australian Dollar, given Australia’s close trade ties with China.
The US Dollar Index remained steady as President Trump’s remarks on the Middle East fueled geopolitical uncertainty and market volatility. Hotter-than-expected CPI figures reinforced expectations that the Federal Reserve may keep interest rates elevated for longer to contain persistent inflation pressures. Investors are now turning their attention to upcoming producer inflation data for further clues on how the conflict with Iran is affecting the broader US economy.
The US Dollar Index (DXY), which tracks the Greenback against a basket of six major currencies, held steady near 98.30 during Wednesday’s Asian session after posting gains over the previous two days. The US Dollar continued to draw support from escalating geopolitical tensions in the Middle East following recent remarks by President Donald Trump. Although Trump stated that Iran was “under control,” he warned that the situation would ultimately end either with a new agreement or with complete “decimation.” Meanwhile, Iranian Deputy Foreign Minister Kazem Gharibabadi reiterated that any acceptable peace deal must involve reparations, recognition of Iran’s sovereignty over the Strait of Hormuz, and the full removal of US sanctions.
Additional support for the Greenback came from stronger-than-expected US inflation data, which reinforced hawkish expectations for the Federal Reserve. Investors increasingly believe the Fed will keep interest rates elevated for longer in an effort to contain persistent inflationary pressures. According to data released by the Bureau of Labor Statistics on Tuesday, the US Consumer Price Index (CPI) rose 0.6% month-over-month in April, lifting annual inflation to 3.8%, the highest reading since May 2023. Core CPI, which excludes food and energy prices, also increased, posting a 2.8% annual gain.
With expectations for a Fed rate cut this year largely fading, markets are now pricing in the possibility of a quarter-point rate hike by December. Attention is now turning to upcoming producer inflation figures, which could offer further insight into how the ongoing conflict involving Iran is affecting the broader US economy.
USD/CAD advances as escalating Middle East tensions strengthen the US Dollar’s appeal as a safe-haven currency.
President Trump has expressed growing frustration over the lack of progress in peace negotiations, raising concerns about a possible change in the region’s conflict approach.
Meanwhile, higher oil prices provide support for the Canadian Dollar, though they also create challenges for the Bank of Canada by adding to ongoing inflation pressures.
USD/CAD edges higher after closing nearly unchanged in the previous session, hovering around 1.3690 during Tuesday’s Asian trading hours. The pair is regaining upward momentum as the US Dollar strengthens amid escalating geopolitical tensions.
Investor sentiment has shifted toward safe-haven assets following reports of worsening diplomatic conditions in the Middle East. Markets are increasingly pricing in the risk of renewed large-scale military conflict, a development that typically drives demand for the Greenback against more risk-sensitive currencies.
A CNN report published Monday stated that US President Donald Trump has become increasingly dissatisfied with the lack of progress in negotiations aimed at ending regional hostilities. Sources close to the administration indicated that Washington is now giving more serious consideration to renewed military operations. Adding to market concerns, Iranian Parliament Speaker Mohammad Bagher Ghalibaf said, according to Reuters, that Iran’s armed forces are fully prepared to respond to any future attacks, placing the already fragile ceasefire under additional pressure.
Despite broad USD strength, the Canadian Dollar continues to receive support from rising oil prices. As Canada is the largest crude supplier to the United States, the CAD tends to benefit from gains in energy markets. Concerns that escalating regional tensions could disrupt global supply flows and reduce Middle Eastern exports have pushed crude prices sharply higher, helping cap further upside in USD/CAD.
At the same time, surging energy prices are reviving inflation concerns in Canada. March inflation data already reflected the impact of volatile oil prices, with annual CPI rising to 2.4%, the highest level seen in a year. While elevated crude prices generally strengthen the CAD, they also complicate the Bank of Canada’s policy outlook. Although the BoC recently kept interest rates unchanged and suggested that energy-related inflation may remain temporary, a prolonged geopolitical conflict could eventually force policymakers to reconsider their current stance.
After reaching a peak near 1.36450 on Wednesday, GBP/USD closed the week around 1.36274. The pair has largely mirrored broader FX market movements, tracking shifts in USD-driven sentiment across different trading sessions.
With WTI crude oil volatility easing and market risk appetite improving, the US dollar has remained under mild pressure. This USD weakness has helped support GBP/USD, which continues to hold above levels seen prior to the early-March Iran-related escalation.
From a technical standpoint, the pair is now approaching territory last traded around the 16–17 February period, suggesting a potential retest of earlier resistance zones as broader sentiment and risk conditions evolve.
Dynamic Range in GBP/USD
The opening of trading for GBP/USD on Monday is likely to be shaped by prevailing market sentiment surrounding the Middle East conflict, which remains relatively calm but still fragile. Alongside this, attention may also turn to reactions from the UK local elections held late last week.
In those results, the Labour Party performed poorly, a development that reflects negatively on its current leadership and raises questions about internal stability. Market participants and financial institutions could respond to these political outcomes at the start of the week, potentially adding an additional layer of volatility to GBP/USD price action on Monday.
Although the leadership of the Labour Party may come under renewed scrutiny, it will also be important to observe whether financial institutions interpret the election outcome as validation of their existing expectations about the UK’s political trajectory.
For short-term traders, the key takeaway is that GBP/USD could see heightened volatility at the start of Monday’s session. As London markets open, price action may become more dynamic as participants react to both political developments and broader sentiment shifts.
Higher Marks in GBP/USD and Correlation Outlook
The GBP/USD may continue to trade with an upward bias in the coming sessions if broader market sentiment keeps the US dollar in a relatively weaker phase across the global FX space. Under such conditions, dollar softness would likely continue to support additional buying interest in the pound.
From a technical perspective, traders may look back toward early-February price levels as potential reference points or interim targets. However, the 1.37000 region still appears to be a more distant objective rather than an immediate trading focus.
For intraday participants, restraint remains important. Rather than chasing extended upside moves, it may be more practical to focus on nearer, more realistic price zones that sit within the day’s typical volatility range, helping to avoid exposure to sharp reversals.
There is also a case for caution around the London open, where institutional flows can introduce abrupt price adjustments, particularly as market participants reassess positioning in light of recent UK political developments.
Although the current government remains in place, market sentiment increasingly reflects speculation about potential political change ahead. Still, GBP/USD pricing is likely to remain anchored in medium-term expectations, which continue to incorporate the existing policy direction and mandate of the current administration.
GBP/USD Weekly Outlook
The current conditions shaping GBP/USD continue to create active two-way price dynamics that appeal to short-term traders. The pair offers frequent opportunities for positioning, though volatility remains a defining feature rather than a stabilizing force.
After the initial activity of Monday’s open fades, trading conditions may settle somewhat. However, market participants still need to account for the risk of sudden catalysts, including developments related to Middle East tensions and ongoing domestic political uncertainty in the UK, both of which could quickly shift sentiment.
From a technical standpoint, GBP/USD holding above the 1.36300–1.36400 area in early Monday trade would likely be viewed as constructive. Sustained stability above this zone could encourage larger market participants to maintain or extend bullish positioning in the days ahead.
That said, even institutional flows remain vulnerable to abrupt sentiment shifts. With global FX conditions still influenced by uneven risk appetite and intermittent geopolitical headlines, the market is unlikely to settle into a smooth trend environment just yet.
The US Dollar Index strengthened as rising risk aversion followed the rejection of each other’s latest peace proposals by President Trump and Iran.
President Trump dismissed Iran’s latest peace offer, describing it as “totally unacceptable.”
Meanwhile, US Nonfarm Payrolls increased by 115K in April, surpassing market expectations despite easing from March’s revised 185K gain.
The US Dollar Index (DXY), which tracks the US Dollar (USD) against a basket of six major currencies, remained firm after posting modest losses in the previous session, trading near 98.10 during Monday’s Asian session.
The Greenback continued to strengthen amid heightened risk aversion after US President Donald Trump and Iran rejected each other’s latest peace efforts aimed at easing tensions in the Middle East. According to Bloomberg, Trump dismissed Iran’s recent peace proposal on Sunday, calling it “totally unacceptable.” Meanwhile, Iranian state television cited an Iranian official as saying Tehran’s response focused on ending the conflict across all fronts, especially in Lebanon, while also addressing the security of shipping lanes through the strait, although no specifics were given regarding the reopening of the crucial waterway.
Ongoing tensions in the Middle East, along with the fragile ceasefire between the US and Iran, are likely to sustain safe-haven demand for the US Dollar, which could continue to pressure major currency pairs in the near term.
Data released by the US Bureau of Labor Statistics on Friday showed that Nonfarm Payrolls (NFP) increased by 115K in April, slowing from March’s revised 185K gain but still beating market expectations of 62K. Meanwhile, the Unemployment Rate held steady at 4.3% in April, in line with analyst forecasts.
The gold market initially pulled back during the week but later rebounded and regained strength. The $4,600 level remains a key area to watch closely, as it has repeatedly acted as both support and resistance in the past.
Gold still appears to have solid potential to gradually move higher, although interest rate markets continue to create headwinds. In this environment, gold is likely to remain volatile and range-bound in the short term. Despite that, the longer-term outlook still looks strongly bullish, and I believe the market could eventually reach the $5,000 level. However, that would likely require several supportive factors to align, including a de-escalation of tensions in the Middle East.
USD/CHF
The US dollar initially strengthened against the Swiss franc but has since pulled back quite sharply. The pair is now testing a potential support zone around the 0.7750 level. Among the major currency pairs, this is one where I still favor the US dollar over the longer term. However, falling interest rates and growing concerns that geopolitical conflicts could escalate are boosting demand for safe-haven assets like the Swiss franc.
Ironically, if geopolitical tensions ease and peace returns, interest rates in the United States may decline, but demand for the safe-haven Swiss franc would likely weaken as well. As a result, this pair is expected to remain heavily influenced by headlines and market sentiment. Over the longer term, however, I still believe USD/CHF has room to move higher.
EUR/USD
The euro initially moved lower before rebounding and showing renewed strength. However, the pair continues to face strong resistance around the 1.18 level, extending up to 1.1850. The 1.1850 zone has remained a significant area of selling pressure, keeping the market contained since the summer of last year.
Going forward, we will need to see whether EUR/USD can finally break above this resistance zone, especially since the pair has attempted to do so several times already. Each breakout attempt, however, has been met with heavy selling pressure that quickly pushes the market back down. For now, I suspect the broader trading range will continue to hold.
BTC/USD
Bitcoin moved higher during the week but later surrendered part of its gains. Even though the latest candlestick resembles a shooting star, it is important to note that the previous candle formed a hammer pattern. This combination suggests that Bitcoin could enter a period of sideways consolidation in the near term.
A break above the $84,000 level would be a strong bullish signal and could pave the way for a much larger upward move. In the meantime, I believe short-term pullbacks will likely continue to attract buyers, with many traders viewing dips as potential buying opportunities.
USD/ZAR
If you were searching for volatility, the South African rand certainly delivered during the week. The pair initially attempted to move higher, but later turned lower as the US dollar continued to weaken. That remains the key theme in this market — traders are likely to keep selling into short-term rallies, especially as the interest rate differential continues to favor South Africa and is expected to do so for the foreseeable future.
With that in mind, I believe the market will likely drift back toward the 16.20 level over time, although the move is expected to be gradual rather than aggressive. In the end, this remains more of a carry trade environment, where traders are primarily focused on earning positive swap returns.
NASDAQ 100
The Nasdaq 100 continues to defy gravity and now appears extremely overbought. The index remains locked in a remarkably strong uptrend, but sooner or later, a sizable pullback is likely to occur — one that could catch overly aggressive or greedy traders off guard.
That said, I believe the 28,000 level will be a key area to watch, as many traders are likely to look for signs of support and renewed buying interest if the market pulls back toward that zone.
USD/MXN
The US dollar has remained weak against the Mexican peso for quite some time. The 17.50 level continues to act as a significant resistance barrier, as it has repeatedly attracted strong selling pressure in the past. Overall, the pair still appears to be trapped within a broader trading range, with support near 17.20 and resistance around 17.50.
Ultimately, I believe that if USD/MXN can break above the highs of the last two weekly candlesticks, it could open the door for a move toward the 18.00 level. However, such a rally would likely require a broader risk-off or fear-driven market environment. For now, the overall setup still appears to favor a “sell the rally” approach rather than a sustained bullish trend.
USD/JPY
The US dollar traded in a highly volatile manner against the Japanese yen throughout the week, following last week’s intervention by the Bank of Japan.
That said, the pair is beginning to form a candlestick pattern that suggests stabilization, indicating there is a genuine possibility of another move higher. A breakout above the 160.50 level — or potentially even the 162.00 region — could pave the way for fresh multi-decade highs, with resistance levels stretching back to 1990.
USD/JPY is trading in a subdued manner near 157.00 during Friday’s Asian session, extending its overnight recovery in line with the US Dollar’s rebound. However, gains remain limited as markets stay cautious about the risk of Japanese FX intervention. Investors are also holding back ahead of the US April employment report due later in the day.
USD/JPY Technical Analysis Overview
On the 15-minute chart, USD/JPY is trading around 159.62, staying above the session open at 159.36. This keeps a slight intraday bullish tone intact as price continues to edge higher within a narrow consolidation range. The Stochastic RSI is positioned near the mid-50s, indicating improving upward momentum without entering overbought territory, which suggests buyers still retain short-term control.
Immediate support is located at 159.36, the day’s open. A break below this level could trigger a deeper pullback toward earlier intraday lows. Although no major moving averages are active on this timeframe, the pattern of higher closes continues to favor buying on dips as long as the pair holds above 159.36.
On the daily chart, USD/JPY also trades at 159.62 and maintains a constructive bullish outlook. Price remains firmly above the 50-day EMA at 158.44 and the 200-day EMA at 155.10, preserving the broader uptrend structure. The Stochastic RSI has recovered toward mid-range levels, reflecting renewed upside momentum after a phase of consolidation within the ongoing bullish trend.
Key support is seen at the 50-day EMA around 158.44, where a pullback would still be consistent with the broader uptrend as long as the 200-day EMA at 155.10 holds. A daily close below the 50-day EMA would signal a potential shift toward a deeper correction, while sustained trading above current levels keeps the bullish structure intact and leaves room for another attempt at recent highs.
Fundamental Analysis Overview
Recent comments follow a series of warnings from Japan’s Ministry of Finance. Finance Minister Satsuki Katayama reiterated last week that authorities are prepared to act against excessive speculative movements in the yen. This stance has kept markets alert after recent sharp swings in USD/JPY, which many participants interpret as possible signs of official intervention.
At the same time, the Bank of Japan’s (BoJ) March meeting minutes, released on Thursday, revealed that several policymakers see room for further interest rate hikes if the energy shock from the US-Iran conflict persists and leads to broader inflationary pressures. Some members also suggested that Japan may need to gradually move away from deeply negative real interest rates.
This increasingly hawkish tone from the BoJ has strengthened expectations for a potential rate increase as early as June. However, analysts remain cautious, noting that sustained support for the yen would likely require either lower US Treasury yields or easing oil prices in addition to tighter domestic policy.
Strategists at OCBC, including Sim Moh Siong and Christopher Wong, suggest that recent USD/JPY fluctuations resemble intervention activity, with the perceived intervention threshold now around 158 rather than 160. They also note that further action could drive the pair toward the 150–155 range, though they emphasize that intervention alone may not be sufficient to change the broader trend without a stronger shift in BoJ policy.
In the US, attention is shifting to Friday’s April employment data. Forecasts point to around 60,000 new Nonfarm Payrolls, with unemployment expected to remain steady at 4.3%. Weekly Initial Jobless Claims, due earlier on Thursday, will also be closely monitored for additional labor market signals.
Meanwhile, the US Dollar Index (DXY) remains under pressure, hovering near two-month lows around 97.90. Markets continue to anticipate a more dovish Federal Reserve outlook, which is limiting the dollar’s upside potential against the yen.
GBP/USD rose to 1.3599 on Thursday, with the pound briefly touching its strongest levels since mid-February. Sterling’s advance was supported by ongoing US dollar weakness, as demand for the greenback’s safe-haven status eased amid increasing optimism over a potential US–Iran agreement.
Axios reported that the White House is nearing a framework memorandum with Iran, which could open the door to ending the conflict and beginning nuclear negotiations. Tehran is expected to respond within 48 hours, though a final deal has not yet been reached.
Meanwhile, investors are watching UK local elections closely, with polling indicating potential setbacks for Keir Starmer’s party.
On the monetary policy side, expectations for the Bank of England have been adjusted, with markets now pricing in around 50 basis points of tightening by year-end—roughly two rate hikes—down from earlier expectations of up to three increases.
Market technical review
On the H4 timeframe, GBP/USD is moving within a wide consolidation band above 1.3515, with price action currently stretching toward 1.3650. A pullback toward 1.3344 is still on the table before any further range-bound movement resumes. A decisive break to the upside would expose the 1.3650 area again, while a break lower could accelerate declines toward 1.3344. The MACD also aligns with this outlook, as the signal line remains above the zero line but is turning downward, suggesting weakening bullish momentum.
On the H1 timeframe, GBP/USD is consolidating in a tight range around 1.3615. Price has recently extended lower toward 1.3578 and is now attempting a recovery back to 1.3615 for a potential retest from below. This rebound may be short-lived, with a further decline toward 1.3565 still likely. The Stochastic oscillator supports this bearish short-term bias, with the signal line below 50 and trending down toward 20, indicating rising downside pressure.
Conclusion
The pound continues to find support from improved global risk sentiment and weaker demand for the US dollar as a safe-haven asset. However, ongoing political uncertainty in the UK, along with evolving expectations for Bank of England policy, may cap further gains. In the near term, GBP/USD is expected to remain highly reactive to geopolitical developments and shifts in broader market sentiment.
USD/JPY slips toward 156.85 in Friday’s Asian session, pressured by renewed reports of Japanese FX intervention during the May holidays. Market attention now shifts to the US April employment report, which is expected to be the key macro driver for the session.
USD/JPY weakened to around 156.85 during Friday’s Asian session as the Japanese yen gained strength after reports of another round of FX intervention by Japanese authorities. Traders also turned cautious ahead of the upcoming US April employment data.
According to Reuters, citing a familiar source, Japanese officials reportedly intervened in the FX market during the early May holiday period, following yen-buying operations on April 30. The source noted that “the intervention since the start of May was timed to coincide with the holiday period, when market liquidity was thin.”
Expectations of further intervention may continue to support the yen and weigh on USD/JPY. Japan’s top foreign exchange official Atsushi Mimura also stated on Thursday that authorities stand ready to respond to speculative currency moves across all fronts.
Attention now shifts to the US April jobs report, due later on Friday. Markets expect around 62,000 new jobs, a notable slowdown from March’s 178,000 increase, while the unemployment rate is forecast to remain unchanged at 4.3%.
Nonfarm Payrolls are forecast to increase by 62K in April, while the Unemployment Rate is expected to remain unchanged at 4.3%. The USD could face elevated volatility ahead of the weekend.
The United States Bureau of Labor Statistics is set to release the April Nonfarm Payrolls (NFP) report on Friday at 12:30 GMT, with markets closely watching the data for clues on the Federal Reserve’s interest-rate path later this year.
Economists expect the US economy to add 62K jobs in April, a sharp slowdown from March’s stronger-than-expected 178K gain. The Unemployment Rate is forecast to remain steady at 4.3%, while annual wage growth, measured by Average Hourly Earnings, is seen accelerating to 3.8% from 3.5%.
Analysts at TD Securities expect signs of stabilization in the labor market after several volatile months. They forecast payroll growth of around 80K, driven mainly by hiring in healthcare and leisure & hospitality, while government employment may decline slightly. They also expect monthly wage growth to stay modest at 0.2%.
Additional labor indicators released earlier this week painted a mixed picture. ADP reported that private-sector employment rose by 109K in April, improving from March’s revised 61K increase. Meanwhile, the Employment Index in the Institute for Supply Management Services PMI climbed to 48 from 45.2, signaling that service-sector hiring is still contracting, though at a slower pace.
What impact will the US March Nonfarm Payrolls have on EUR/USD?
EUR/USD is likely to remain highly sensitive to the upcoming US Nonfarm Payrolls (NFP) report, as investors reassess the outlook for the Federal Reserve and the broader direction of the US Dollar.
Despite the Fed’s relatively hawkish April meeting, the USD has struggled to gain traction amid improving global risk sentiment and easing geopolitical tensions in the Middle East. Comments from Fed Chair Jerome Powell reinforced a data-dependent approach, while Austan Goolsbee acknowledged that labor market conditions have softened, even if they remain broadly stable.
Markets currently expect the Fed to keep rates unchanged through the end of 2026, though traders still see some probability of either a rate hike or cut depending on incoming data. A weak NFP reading — particularly below 30K alongside a higher Unemployment Rate — could strengthen expectations for rate cuts later this year. In that scenario, the USD may weaken further, allowing EUR/USD to extend gains.
On the other hand, a stronger-than-expected payrolls figure could reduce expectations for monetary easing and help the USD stabilize. This would likely cap EUR/USD upside, although a sustained dollar rally may remain limited if risk appetite stays strong heading into the weekend.
From a technical perspective, FXStreet analyst Eren Sengezer notes that EUR/USD maintains a bullish near-term bias. The pair continues to trade above its 100-day and 200-day Simple Moving Averages, while the Relative Strength Index trends toward bullish territory.
Key resistance is seen around 1.1800–1.1810, followed by 1.1900–1.1910 and the psychological 1.2000 level. On the downside, major support stands in the 1.1710–1.1680 zone, with further downside targets at 1.1650 and 1.1560 if selling pressure intensifies.
The conclusion of Operation Epic Fury is lifting risk sentiment.
Japan is expected to keep cracking down on speculators.
The US Dollar weakened after the White House announced the end of the two-month “Operation Epic Fury” and highlighted progress in talks with Iran. Markets are interpreting the developments as a sign of easing tensions in the Middle East, triggering a selloff in Brent crude and pushing the dollar index back toward two-month lows amid improving risk sentiment.
The more optimistic backdrop could support further gains in EUR/USD, though much will depend on how quickly oil prices decline. Damage to energy infrastructure across the Persian Gulf is expected to keep Brent and WTI well above the $65–70 range seen before the conflict erupted, maintaining underlying inflationary pressure.
US services PMI data continues to point to the strongest price pressures since 2022, while futures markets are increasingly pricing in the possibility of additional Fed tightening. That complicates any effort by Kevin Warsh to deliver the aggressive policy easing sought by Donald Trump. For now, however, traders remain focused almost entirely on developments in the Middle East.
The prospect of a ceasefire has already lifted EUR/USD toward 1.1760, and the pair could extend gains if de-escalation continues. On the other hand, a collapse in negotiations or renewed friction between the US and Iran would likely trigger a reversal, especially as Washington continues expanding its military presence in the Persian Gulf despite softer rhetoric.
Meanwhile, Wednesday’s sharp drop in USD/JPY has fuelled speculation that Japanese authorities intervened in the currency market again. Tokyo appears determined to discourage speculative dollar buying during periods of USD weakness.
Gold has also surged more than 3% on hopes of easing geopolitical tensions, climbing above $4,700. Lower oil prices reduce the risk of persistent inflation and lessen pressure on central banks to tighten policy further, potentially reviving demand for gold as a debasement hedge.
Huge swings across USD/Asia as Japan’s MOF keeps intervening in USD/JPY, while Axios continues to publish reports pointing to progress on an Iran deal. It’s difficult not to view the headlines with some skepticism, but markets react sharply to every update, making them impossible to ignore. Regardless of how the probabilities around an Iran resolution are assessed, the market response has been so significant that questioning the credibility of the news flow becomes secondary.
My long USD/CHF position has taken a heavy hit as the US Dollar tumbles alongside a sharp decline in oil prices. USO, the oil ETF, is down 11% today after Monday’s attacks on the UAE had traders positioned for a bullish breakout in crude that ultimately never materialized.
There still appears to be plenty of downside room before crude finds meaningful support. I’m using USO as the reference here, though the broader oil futures curve shows a very similar setup. Fresh optimism over a potential end to active conflict in the Middle East has fueled another rally in AI capex-related names, though it hasn’t translated into stronger USD demand as Japan’s MOF remains active and concerns over stagflation-driven rate hikes from the ECB and other central banks continue to ease.
Apparently, the launch of the DRAM ETF was not the top for memory stocks after all.
SanDisk has now turned into a 35-bagger over the past year, soaring from $40 to $1,400 in just 12 months.
USD/JPY
Interesting setup in USD/JPY. My initial strategy — selling into the 157.19–157.94 area in anticipation of MOF-driven upside exhaustion — turned out to be the correct call, but I got thrown off by a competing view that nonfarm payrolls would likely surprise to the upside. In hindsight, that was probably something to focus on Thursday rather than Monday. The chart still shows the former major low zone around 157.30–157.80 acting as resistance, and the repeated interventions suggest the MOF is serious about defending the area.
Here’s the 5-minute chart. It’s hard to say with certainty that every sharp drop was driven by the MOF, but several of them likely were.
I’m staying on the sidelines for now. Going long here makes little sense regardless of one’s NFP outlook, while shorting at the bottom of the range is equally unattractive. At this point, the MOF simply needs to keep hovering above 157.50 while hoping for lower yields and softer oil prices.
With the VIX sitting at 16.4 and oil down 10%, the hawkish Trump mean-reversion trade — long oil and long USD — probably offers positive expected value. The problem is that there’s still no concrete timeline attached to the latest “deal” or MOU narrative, making risk management on long oil positions extremely difficult.
In hindsight, I was too focused on NFP too early, if it even deserved attention at all in this environment. With oil and MOF activity overwhelmingly driving FX flows, concentrating on payrolls four days ahead of the release now feels misplaced.
Extend this analysis
In recent weeks, a 50/50 barbell trade pairing semiconductors and oil has gained traction, with several bank strategists and Substack writers pitching it as a modern alternative to the traditional 60/40 stocks-and-bonds risk parity framework. In hindsight, the trade has delivered exceptional performance and offers some attractive characteristics: it largely sidesteps direct exposure to the U.S. consumer while remaining relatively resilient to stagflation pressures and tightening financial conditions.
That said, assuming the strategy will continue to work simply because it has worked recently feels like a dangerous exercise in extrapolation. Much of the enthusiasm may reflect performance chasing rather than a durable structural edge.
The following charts take a simplified approach by comparing a portfolio of 100*XLE + SOX against the Advance Research Risk Parity Index (RPARTR). I chose this particular risk parity benchmark because its data extends back to 1998, though using more sophisticated methodologies would likely produce a broadly similar picture.
The SOX+XLE barbell began outperforming after Russia’s latest invasion of Ukraine and continued to hold up even as oil prices eased post-Ukraine, largely because ChatGPT accelerated the AI capex boom. Still, after two wars and three years of markets pricing in the LLM theme, it’s difficult to argue that the trade still offers especially attractive risk/reward. Time will tell.
Traditional risk parity, meanwhile, outperformed across nearly every longer-term horizon except the past few years. The chart on the right indexes both strategies to January 1999 = 1, while the second chart highlights the performance gap between the two indexed series.
Worth keeping in mind.
Closing thoughts
EUR/USD is basically trading like oil.
Check who took the mound for the Cardinals on May 3 — Dustin May, wearing No. 3.
USD/GBP has remained under pressure since early April, driven mainly by uncertainty among central banks over how the conflict in Iran could affect inflation and energy prices. On Thursday, April 30, a fresh batch of economic data reinforced the cautious stance adopted by both the Federal Reserve (Fed) and the Bank of England (BoE).
Over the past month, the pair has fallen 2.8%, with ongoing tensions in the Middle East continuing to fuel market volatility.
While recent inflation data from both the United States and the United Kingdom drew attention, markets remained focused on the broader energy risks linked to the closure of the Strait of Hormuz, which has become a key factor behind the cautious outlook.
Energy driving USD/GBP
For currency traders, USD/GBP has increasingly behaved like a proxy for crude oil rather than reacting primarily to interest rate differentials, though energy market disruptions have also directly influenced monetary policy expectations on both sides of the Atlantic.
Over the past week, the pair has maintained a notably strong correlation with Brent crude, ranging between 0.96 and 0.97. In practical terms, this suggests that USD/GBP tends to rise alongside oil prices and fall when crude declines. Since correlations closer to 1 indicate an almost perfect relationship, the current pattern highlights the extent to which oil prices are steering movements in the pair.
Recent volatility in crude — which briefly surged nearly 7% to a four-year high of $126 per barrel — was largely triggered by reports that the US military was preparing to brief President Donald Trump on potential new actions involving Iran.
“We saw oil prices climb on fears over supply disruptions, making energy one of the few sectors to post gains,” Wealthify said in its monthly market summary. “Equity markets declined broadly, with losses across the US, Europe, the UK, and Asia, leaving investors with limited regional shelter.”
“The Federal Reserve kept rates unchanged in March, but rising oil prices and inflation concerns cast uncertainty over future rate cuts, pressuring bond prices lower. In the UK, mounting inflationary pressures alongside a softer labour market strengthened expectations that the Bank of England may keep rates elevated for longer, with the possibility of another hike later this year.”
The connection between energy markets and USD/GBP has therefore become a dominant force shaping sentiment, often overshadowing corporate earnings and other macroeconomic drivers. At the same time, interest rate expectations themselves are increasingly being influenced by the Middle East conflict, with recent central bank guidance offering key clues about the future direction of both the US Dollar and the British Pound.
Rates fuel cautious optimism
Thursday, April 30, 2026, brought a wave of central bank updates with important implications for USD/GBP.
The Bank of England (BoE) began the day by keeping its benchmark interest rate unchanged at 3.75%, while warning that the conflict in Iran could eventually trigger further inflation pressures and potentially require additional rate hikes.
The decision to hold rates passed by an 8–1 vote, though policymakers signaled that future tightening remains possible, including the prospect of more aggressive increases if inflation risks intensify.
Meanwhile, the United States released its March Personal Consumption Expenditures (PCE) Price Index data. Headline inflation came in slightly below expectations at 3.5%, versus forecasts of 3.6% from economists.
Excluding volatile food and energy prices, the Federal Reserve’s preferred core inflation measure rose 3.2%, matching market expectations and once again underscoring the uncertain influence of geopolitical tensions in the Middle East.
Additional US economic data released Thursday showed weekly jobless claims falling to 189,000 — the lowest level in more than 50 years — signaling ongoing resilience in the labor market and strengthening hopes for continued economic recovery.
While strong US labor data would normally support the Dollar against the Pound, expectations that the BoE may raise rates further are emerging as a key bullish factor for Sterling.
Markets now appear to be pricing in a more hawkish outlook for the UK, whereas sentiment in the United States is becoming comparatively more cautious despite elevated inflation linked to the Iran conflict. Although the Federal Reserve also left rates unchanged recently, several major financial institutions — including Capital One Financial, Synchrony Financial, and Marcus by Goldman Sachs — have already reduced yields on high-yield savings accounts.
These developments highlight growing differences in the monetary policy outlook between the two sides of the Atlantic, a divergence that forex traders are likely to monitor closely in the months ahead.
What’s next for USD/GBP?
The prospect of a more hawkish stance from the Bank of England, fueled by rising energy-driven inflation, could place further downward pressure on USD/GBP in the coming weeks. However, the key factor shaping the pair’s direction will remain developments surrounding the conflict in Iran and the continued closure of the Strait of Hormuz.
If the conflict drags on and keeps energy markets under strain, the BoE may be forced to respond with more aggressive rate hikes to contain inflationary pressures. In contrast, the Federal Reserve could continue facing political pressure from the US administration to lower interest rates, even as higher oil prices complicate the inflation outlook.
Against this backdrop of heightened volatility and uncertainty, a prolonged Middle East conflict could potentially drive USD/GBP toward the 0.71 level. At the same time, expectations for future US rate cuts may extend the Dollar’s broader long-term weakness against major global currencies.
The US Dollar Index softens as optimism surrounding a potential US-Iran agreement dampens safe-haven demand. Lower oil prices are also easing inflation worries, reducing expectations that the Fed will maintain a hawkish stance for longer. Meanwhile, Fed official Austan Goolsbee cautioned that inflation has picked up since the conflict began, moving further away from the central bank’s 2% target.
The US Dollar Index (DXY), which tracks the Greenback against six major currencies, is stabilizing around 98.00 during Thursday’s Asian session after declining nearly 0.5% in the previous trading day.
The US Dollar remains under pressure as optimism over a possible US-Iran agreement reduces safe-haven demand. The prospect of easing tensions has driven oil prices sharply lower, helping to ease inflation concerns and diminishing expectations that the Federal Reserve will maintain a hawkish policy stance for an extended period.
Still, Chicago Fed President Austan Goolsbee warned that inflation has failed to continue moderating toward the Fed’s 2% target and has instead accelerated since the conflict started.
According to the BBC, Iran said on Wednesday that a US proposal aimed at ending the conflict is “still being considered,” despite growing speculation that both sides could be approaching a deal. Reports suggest Washington submitted a one-page memorandum of understanding that would gradually reopen the Strait of Hormuz and ease the US blockade on Iranian ports, while discussions on Tehran’s nuclear program would take place later. However, no final agreement has yet been reached.
Meanwhile, Donald Trump told CNBC that Iran would face bombing “at a much higher level” if it refuses to accept a peace deal. In a post on Truth Social, Trump added that the US military operation known as “Operation Epic Fury” would end if Iran “agrees to give what has been agreed to.”
EUR/USD remains flat near 1.1750 as traders stay cautious over Iran’s response to the US peace proposal. Risk appetite continues to improve amid growing optimism surrounding a potential US-Iran agreement, while investors focus on upcoming remarks from ECB President Christine Lagarde and the US April Nonfarm Payrolls report for fresh market direction.
EUR/USD moves within a narrow range near 1.1750 in Thursday’s early European session as investors await Iran’s response to the US peace proposal, which includes restrictions on Tehran’s uranium enrichment activities and the reopening of the Strait of Hormuz.
Market sentiment remains broadly positive after reports suggested the US and Iran are nearing a potential agreement. Although S&P 500 futures trade little changed in Europe, the index rallied nearly 1.5% in the previous session.
Meanwhile, the US Dollar Index (DXY), which measures the Greenback against a basket of six major currencies, stays cautious around the 98.00 level.
Traders are now turning their attention to Friday’s key events, including remarks from ECB President Christine Lagarde and the US April Nonfarm Payrolls report. Both releases are expected to provide fresh signals on the future monetary policy paths of the ECB and the Federal Reserve.
EUR/USD: Technical outlook points to cautious consolidation
EUR/USD continues to consolidate near 1.1750 at the time of writing. The pair has hovered around the 20-period Exponential Moving Average (EMA), currently at 1.1708, for nearly a month, signaling a lack of clear directional momentum.
Meanwhile, the Relative Strength Index (RSI) remains trapped within the 40.00–60.00 range, highlighting ongoing market indecision.
On the downside, immediate support is seen around the 20-day EMA at 1.1708. A daily close below this level could weaken the near-term bullish outlook and trigger a deeper correction towards the April 1 peak at 1.1627. On the upside, a breakout above the May 6 high of 1.1797 may pave the way for a move towards the April 17 high near 1.1850.
Gold draws buyers for a second consecutive session as optimism over a potential US–Iran peace agreement weakens the US dollar. Easing inflation concerns also dampen expectations of aggressive Fed tightening, supporting demand for the metal, while traders await the US ADP report for fresh direction ahead of Friday’s Nonfarm Payrolls release.
Gold (XAU/USD) holds firm near a more-than-one-week high, staying above $4,650 as the European session begins on Wednesday. A broadly weaker US Dollar—pressured by growing optimism over a potential US–Iran peace agreement—has supported the metal’s rebound from Monday’s one-month low around $4,500. At the same time, falling crude oil prices are easing inflation concerns and reducing expectations of a more aggressive Federal Reserve, further boosting demand for the non-yielding asset for a second consecutive day.
On the geopolitical front, US President Donald Trump announced a temporary pause in “Project Freedom,” the military effort to escort commercial vessels through the Strait of Hormuz, to allow room for negotiations with Iran. He noted meaningful progress toward a comprehensive deal, echoing earlier remarks from Defense Secretary Pete Hegseth that the US is not seeking renewed escalation and that the ceasefire with Iran remains intact. Additionally, Secretary of State Marco Rubio confirmed the conclusion of “Operation Epic Fury,” a joint US–Israel campaign launched on February 28.
These developments have strengthened expectations of a peace agreement that could end the US-Israeli conflict involving Iran and reopen the strategically crucial strait, lifting investor sentiment while weighing on the dollar’s appeal. Meanwhile, oil prices have dropped to a one-week low, helping to curb fears of rising inflation and allowing the Fed to maintain a more cautious policy stance. Still, according to CME Group’s FedWatch Tool, markets are pricing in more than a 35% chance of a rate hike by year-end, which may limit further downside in the USD and cap gold’s near-term upside.
Given this backdrop, traders may wait for stronger follow-through buying before confirming that gold has formed a bottom near $4,500 and positioning for additional gains. Attention now turns to the US ADP private employment report later in the North American session, along with remarks from key FOMC officials and ongoing geopolitical updates. The primary focus, however, remains Friday’s closely watched US Nonfarm Payrolls report, which is expected to play a decisive role in shaping the near-term outlook for both the dollar and gold.
Gold H4
Gold bulls remain in control as long as prices hold above the 200-period SMA breakout level on the H4 chart. The metal’s solid rebound from the $4,500 region—near the 50% retracement of the March–April rally—combined with a move above $4,600, supports a bullish outlook. Prices are now approaching the 200-period SMA at $4,651.69, which serves as the next key resistance.
Momentum indicators reinforce the positive bias. The RSI sits around 59, suggesting steady strength without entering overbought territory, while the MACD histogram remains positive and continues to rise, pointing to building bullish momentum as gold tests overhead resistance.
On the downside, immediate support is located at the 38.2% Fibonacci retracement level around $4,588.83. Further declines could find buying interest near the 50% level at $4,495.62, followed by the 61.8% retracement around $4,402.41. A decisive break below this last level would invalidate the bullish setup and shift the near-term outlook back in favor of the bears.
Commerzbank’s Antje Praefcke maintains that geopolitical tensions surrounding the Iran conflict continue to be the dominant force driving EUR/USD, overshadowing upcoming US indicators such as ADP and Nonfarm Payrolls (NFP). She highlights that recent US labor data has been inconsistent and is unlikely to meaningfully influence the dollar. As a result, EUR/USD is expected to remain within its recent range unless there is a clear escalation or easing of tensions in the Middle East, which is currently acting as a cap on major price movements.
Praefcke notes that attention will still turn to incoming US macro data, beginning with JOLTS job openings—which came in somewhat soft—followed by the ADP report and the official payrolls release. While a strong ADP reading might offer the dollar modest support, a weaker NFP figure could exert downward pressure.
However, given the recent volatility and lack of clear direction in employment data, she believes these figures will likely remain inconclusive. April job growth is expected to be moderate, suggesting little chance of a decisive signal emerging. Consequently, unless there are significant surprises, the data is unlikely to drive the USD in any meaningful way.
In her view, the broader narrative remains unchanged: until there are concrete signs of either de-escalation or escalation in the Middle East conflict, other factors—including US economic data—will take a back seat. Only a clear shift in the geopolitical backdrop is likely to push EUR/USD out of its established range.
Gold edges higher with modest gains, but the broader fundamentals suggest caution for bullish traders.
Persistent inflation concerns are reinforcing expectations of more hawkish central bank policies, weighing on the metal.
Meanwhile, rising US-Iran tensions bolster the US dollar’s safe-haven appeal, adding further pressure on gold.
Gold (XAU/USD) picks up some buying interest during Tuesday’s Asian session, partially recovering from the previous day’s drop to around the $4,500 level—its lowest in over a month. However, the rebound lacks a clear fundamental driver and could fade quickly, suggesting traders should remain cautious before expecting any sustained upside. Ongoing US-Iran tensions continue to stoke inflation fears and reinforce expectations of higher interest rates, which, alongside a stronger US Dollar (USD), is likely to cap gains in the non-yielding metal.
The fragile ceasefire between the US and Iran appears close to breaking down after renewed violence in the Persian Gulf on Monday. Both the United Arab Emirates (UAE) and South Korea reported attacks on vessels in the critical shipping lane, while the UAE confirmed a fire at the Fujairah oil port following Iranian missile and drone strikes. US President Donald Trump warned that Iran would face devastating consequences if it targeted American ships escorting vessels through the region under the “Project Freedom” initiative.
These developments heighten the risk of further escalation in the Middle East, pushing crude oil prices higher and reinforcing concerns that rising energy costs could reignite inflation. This, in turn, strengthens expectations that major central banks—including the US Federal Reserve (Fed)—may adopt a more hawkish policy stance. Data from CME Group’s FedWatch Tool now shows the probability of a Fed rate hike by year-end at around 35%, up sharply from below 10% last Friday.
The outlook supports higher US Treasury yields, which continue to underpin the USD. Additionally, tensions around the Strait of Hormuz further enhance the dollar’s appeal as a global reserve currency, adding to the bearish near-term outlook for gold. As a result, any upward moves in the metal are likely to attract selling interest, and traders may prefer to wait for stronger, sustained buying before concluding that gold has formed a bottom.
Gold (XAU/USD) 4-hour timeframe chart
Gold may find it difficult to build on its intraday gains given the prevailing bearish technical structure.
From a chart standpoint, XAU/USD continues to show a short-term negative bias as it remains below the 200-period Simple Moving Average (SMA) at $4,655.02. The metal is also constrained by the 38.2% Fibonacci retracement of the March–April rally, keeping prices trapped beneath a strong resistance zone despite a slight rebound from the $4,500 region, which aligns with the 50% retracement level.
Momentum signals are still weak, with the Relative Strength Index (RSI) staying below the neutral 50 mark at 39.84 and the Moving Average Convergence Divergence (MACD) lingering in negative territory. This suggests the current recovery attempt could lose steam near the 38.2% Fibonacci level at $4,595.23. Any further upside is likely to face resistance around the 200-period SMA at $4,655.02, followed by the 23.6% retracement at $4,711.12.
On the downside, immediate support is seen near the 50% retracement at $4,501.57, ahead of the 61.8% level at $4,407.90. If selling pressure intensifies, deeper support levels come into view at $4,274.55 and $4,104.68.
GBP/USD has come under selling pressure for a third consecutive session as renewed tensions between the US and Iran continue to support demand for the US Dollar.
Higher oil prices are stoking inflation concerns and reducing expectations for Federal Reserve rate cuts, further strengthening the greenback. Meanwhile, the Bank of England’s relatively hawkish stance may provide some support to the pound, helping to cap deeper losses in the pair.
GBP/USD is extending its decline for a third consecutive day on Tuesday, though selling pressure remains limited as the pair holds above the key 1.3500 level during the Asian session. The mixed fundamental landscape suggests traders should be cautious about expecting a deeper pullback from last Friday’s peak around 1.3655–1.3660, the highest level since mid-February.
The US Dollar continues to benefit from safe-haven demand amid rising tensions between the US and Iran around the Strait of Hormuz, alongside reduced expectations for Federal Reserve rate cuts in 2026. This stronger USD is weighing on GBP/USD. However, the Bank of England’s comparatively hawkish stance offers support to the British Pound, helping to cushion further downside.
Recent developments have heightened geopolitical risks, including reports of an explosion on a South Korean-flagged vessel in the strait. Former US President Donald Trump warned of severe retaliation if Iran targets US ships, while Iran reportedly launched missile and drone attacks on the UAE following the US announcement of “Project Freedom” to assist stranded vessels.
These escalating tensions are pushing crude oil prices higher, stoking inflation concerns and reinforcing expectations of tighter monetary policy from major central banks, including the Fed. This dynamic continues to support the USD and pressure GBP/USD, although the BoE’s indication that further rate hikes may be needed if inflation persists should help stabilize the pair.
Looking ahead, traders will monitor Tuesday’s US data releases—including ISM Services PMI, JOLTS job openings, and new home sales—along with comments from FOMC officials for short-term direction. Still, attention is firmly on Friday’s Nonfarm Payrolls report and ongoing geopolitical developments, both of which are likely to drive market volatility.
The US Dollar Index trades steadily near 98.20 during Monday’s early Asian session. Donald Trump stated that the United States will assist vessels in exiting the Strait, while traders turn their focus to the upcoming US April employment report scheduled for release on Friday.
The US Dollar Index (DXY), which tracks the US Dollar against a basket of six major currencies, is hovering around 98.20 during Monday’s Asian session. It remains relatively stable as market participants evaluate ongoing geopolitical tensions in the Middle East.
US President Donald Trump announced that starting Monday, the US will assist neutral vessels stranded in the Persian Gulf by escorting them through the Strait of Hormuz. According to Bloomberg, US Navy ships will remain on standby to deter potential Iranian attacks on commercial shipping in the area.
Meanwhile, an Iranian official cautioned that any US involvement in the Strait would be viewed as a breach of the ceasefire, emphasizing that the Persian Gulf is not a place for political posturing. Traders are keeping a close watch on developments in the region, particularly any continuation of the Hormuz blockade. Escalating tensions could support the US Dollar due to its safe-haven appeal.
Attention will also turn to the upcoming US April employment report, scheduled for release on Friday. Job growth is forecast at 73,000, while the unemployment rate is expected to hold steady at 4.3%. A weaker-than-anticipated report could weigh on the DXY in the short term.
The NASDAQ 100 has delivered another strong week, but the key question now is whether it can sustain further upside momentum. Despite the gains, the market remains highly volatile and choppy, making it difficult to confidently chase prices at these elevated levels.
I believe dips will present buying opportunities that many traders will look to capitalize on, but for now, patience is essential. When a market is this strongly bullish, it can be challenging to navigate effectively.
USD/JPY
The US dollar dropped sharply against the Japanese yen on Thursday amid intervention, but overall, the market likely needs to stabilize before traders feel confident enough to start buying the dollar again.
Ultimately, the Japanese central bank has limited ability to keep the yen stable. Japan’s heavy debt burden makes it extremely difficult to sustain higher interest rates. As a result, I expect the market to reverse course and move back toward previous highs.
EUR/USD
The euro dipped early on, then rebounded, but ultimately surrendered much of its gains by the end of the week, reflecting ongoing choppy and erratic price action.
Given this setup, it appears that the 1.18 level marks the start of a significant resistance zone, likely extending up to around 1.1850. On the downside, the 1.1650 level remains a key area to watch, with a break below potentially opening the door toward 1.15.
BTC/USD
Bitcoin initially declined during the week but later rebounded, showing signs of recovery. As a result, the formation of a weekly hammer isn’t particularly surprising, given the strong resilience the market has consistently demonstrated.
It has climbed for most of the conflict, which is likely the first clear indication that something meaningful is happening beneath the surface. Bitcoin now appears to be targeting the $84,000 level, though reaching it will likely be a tough battle rather than an immediate move.
USD/CAD
The US dollar has traded in a choppy manner against the Canadian dollar this week, remaining within a well-established range. The 1.35 level continues to act as support, while the 1.3750 level serves as resistance above.
Friday saw a modest rebound from the lower end of the range, reinforcing the idea that “buy the dip” behavior may continue—at least until price breaks above the 1.3750 level. If that resistance is cleared, the upside could accelerate significantly, potentially pushing toward 1.40 over time, though such a move is unlikely to happen quickly.
Gold
Gold initially declined during the week, attempted a rebound, but then pulled back again. Overall, the $4,600 level appears to be a key area that traders will continue to watch closely.
This level has repeatedly proven significant in the past, and that’s unlikely to change anytime soon. That said, a break below the week’s low could open the door for a move down toward the $4,200 level.
Crude Oil
Crude oil has been highly volatile again this week, with markets remaining broadly noisy and unpredictable. Prices are largely being driven by the latest headlines from the Middle East, Washington D.C., and Tehran, leaving the market heavily influenced by geopolitical developments.
Given the situation, it’s nearly impossible to analyze or predict the next move in such a chaotic environment. Over the longer term, however, the only clear takeaway is that prices are likely to maintain a higher floor than they have in the past.
GBP/USD
The British pound showed strength for most of the week, though a late pullback has raised doubts about how sustainable the rally may be.
Given enough time, the market will likely make another attempt to reach the 1.37 level, though it may take a while to get there. After all, this has been a significant level over the past several months.
USD/CHF climbs as the US Dollar rebounds following the Fed’s decision to hold rates while signaling a more hawkish outlook. Morgan Stanley now anticipates no rate cuts this year, scrapping its previous expectations for reductions in September and December. Meanwhile, Switzerland’s March KOF Leading Indicator is due for release later in the day.
USD/CHF posts a third straight day of gains, hovering near 0.7920 in Thursday’s Asian session. The pair is supported by a rebound in the US Dollar, which remains firm after the Federal Reserve left interest rates unchanged but adopted a more hawkish tone amid ongoing inflation concerns.
Morgan Stanley has revised its outlook, now expecting no Fed rate cuts this year, reversing earlier projections for two 25-basis-point reductions in September and December. The shift reflects persistent inflation and signs of continued economic strength.
The Federal Open Market Committee (FOMC) voted 8–4 to keep rates within the 3.5%–3.75% range, marking the highest level of dissent since October 1992. Policymakers noted that inflation remains elevated, partly driven by rising global energy prices.
Safe-haven demand has also lent support to the Greenback. US President Donald Trump stated that the naval blockade on Iran will remain in place until a nuclear agreement is reached, rejecting calls to reopen key routes. Iran responded with warnings of retaliation, accusing Washington of using coercive tactics.
Meanwhile, Swiss data showed a slight improvement in sentiment, with the ZEW Survey Expectations rising to -30.3 in April from -35.0 in March. The March KOF Leading Indicator is scheduled for release later in the day.
EUR/USD could linger close to its eight-month low around 1.1411.
The 14-day RSI, sitting near 48, points to fading bullish momentum and a likely consolidation phase.
Near-term resistance is located at the 50-day EMA, around 1.1678.
EUR/USD continues to decline for a third straight session, hovering near 1.1660 in Thursday’s Asian trading. Technical signals from the daily chart point to a possible bearish reversal after the pair broke below its ascending channel.
The pair remains slightly below both the 50-day and nine-day EMAs, indicating that near-term upside is limited despite the recent bounce from lower levels. Meanwhile, the 14-day RSI near 48 suggests weakening bullish momentum and a tendency toward consolidation, reinforcing the idea that gains may be capped while price stays beneath these key moving averages.
On the downside, EUR/USD could revisit the eight-month low around 1.1411, last seen on March 13. Immediate resistance is found at the 50-day EMA near 1.1678, followed by the nine-day EMA around 1.1700. A move back into the ascending channel would restore bullish sentiment and open the door to a retest of the two-month high at 1.1849 (April 17), with further upside toward the channel’s upper boundary near 1.1940. A decisive breakout above this zone could pave the way for a climb toward 1.2082, the highest level since June 2021, recorded on January 27.
GBP/USD could extend gains toward the two-month peak at 1.3599.
The 14-day Relative Strength Index, hovering around 56, suggests bullish momentum while still avoiding overbought territory.
The pair is currently retesting the lower edge of its upward channel near 1.3510.
GBP/USD edges slightly higher after a mild pullback in the previous session, trading near 1.3520 during Asian hours on Wednesday. The daily chart suggests a possible bearish reversal setup as the pair sits close to the lower boundary of its ascending channel.
Despite this, the broader bias remains modestly bullish, with price holding above both the nine-day and 50-day EMAs. Their positioning below the current level points to an underlying supportive structure following the recent rally. Meanwhile, the 14-day RSI near 56 reflects constructive momentum without entering overbought territory, leaving scope for additional upside.
On the upside, GBP/USD could retest the key resistance at 1.3599, the two-month high set on April 17. A break above this level would open the path toward the upper channel boundary near 1.3869, the highest level since September 2021, last seen in late January.
On the downside, immediate support lies around the lower channel boundary at 1.3510, closely aligned with the nine-day EMA at 1.3509. A deeper decline would bring the 50-day EMA at 1.3440 into focus. A decisive break below this support cluster could trigger further losses toward 1.3159, the March 31 low, and subsequently 1.3010, a multi-month low recorded in November 2025.
AUD/USD faces selling pressure after the release of Australia’s consumer inflation data. Ongoing geopolitical uncertainty continues to support demand for the safe-haven US dollar, adding downside pressure on the pair. However, expectations of a hawkish Reserve Bank of Australia stance may help cushion losses for the Australian dollar, as markets now turn their attention to the upcoming FOMC decision.
The AUD/USD pair remains unable to break above the 0.7200 level, edging lower during Wednesday’s Asian session after the release of Australia’s consumer inflation data. Spot prices slipped toward the 0.7170 area in recent trading, although downside momentum appears limited ahead of the key FOMC policy announcement later today.
According to the Australian Bureau of Statistics (ABS), the headline CPI rose 1.4% in Q1, pushing the annual rate up to 4.1%. The Trimmed Mean CPI increased 0.3% over the quarter and 3.5% year-on-year. Despite the inflation figures coming in largely in line with expectations, the Australian dollar saw some selling pressure amid cautious market sentiment driven by ongoing geopolitical tensions.
At the same time, the data has not significantly altered expectations for a more hawkish Reserve Bank of Australia (RBA), with markets now assigning a higher probability of a 25-basis-point rate hike at the May meeting. Combined with relatively subdued US dollar movements, this helps cushion losses in AUD/USD and prevents a deeper decline. Traders, however, remain on the sidelines, awaiting clearer signals from the Federal Reserve’s policy decision.
Markets will closely monitor the FOMC statement for guidance on the Fed’s policy outlook, particularly amid concerns that rising energy prices linked to geopolitical risks could reignite inflation. Meanwhile, continued uncertainty around US-Iran relations and tensions over the Strait of Hormuz may keep demand for the US dollar supported as a safe-haven currency, potentially limiting further gains in AUD/USD and encouraging caution before positioning for a continuation of its month-long uptrend.
The US Dollar Index hovered around 98.65 in early Wednesday Asian trading, showing little change. The Fed is broadly expected to keep rates unchanged at 3.50%–3.75% at its April meeting. Market focus will then turn to Thursday’s US Q1 GDP and PCE inflation data.
The US Dollar Index (DXY), which tracks the value of the US Dollar (USD) against a basket of six major currencies, is trading around 98.65 during Wednesday’s Asian session. The index remains stable as investors await the Federal Reserve’s interest rate decision later in the day.
The Fed is widely anticipated to keep the federal funds rate unchanged at 3.50%–3.75%, a level maintained since January. This meeting may also be Chair Jerome Powell’s last before a potential transition to nominee Kevin Warsh.
Market participants will pay close attention to Powell’s post-meeting press conference for guidance on the Fed’s outlook amid ongoing economic risks. A more hawkish stance on persistent inflation could provide short-term support for the US Dollar against other major currencies.
According to Carol Kong, currency strategist at Commonwealth Bank of Australia, uncertainty remains over Powell’s future role, including whether he will step down as Chair or continue serving as a governor beyond his term.
Looking ahead to Thursday, investors will focus on the preliminary US Q1 GDP data and the Personal Consumption Expenditures (PCE) Price Index. Weaker-than-expected results from these reports could put downward pressure on the DXY.
EUR/USD Price Forecast
EUR/USD remains steady around 1.1700 ahead of upcoming Fed and ECB policy decisions, with both central banks expected to keep rates unchanged. Meanwhile, German HICP is projected to rise at a faster annual rate of 3% in April.
EUR/USD trades sideways around 1.1700 in Wednesday’s Asian session, as markets await key Fed and ECB policy decisions. Both central banks are expected to keep rates unchanged while flagging inflation risks linked to higher energy prices amid ongoing Strait of Hormuz disruptions. Investors will closely watch commentary from Jerome Powell and Christine Lagarde for signals on future policy direction. Ahead of the meetings, attention also turns to German April HICP data, expected to show inflation rising to 3% YoY from 2.7%.
EUR/USD technical outlook
EUR/USD is trading flat around 1.1700, showing a sideways bias as it continues to hover near the 20-day EMA at 1.1698, while still holding above the 38.2% Fibonacci retracement level at 1.1666.
The RSI has moved back into the 40–60 neutral zone after failing to sustain levels above 60, signaling fading upside momentum, although the broader bullish bias is still in place.
On the upside, immediate resistance is seen at the 50% Fibonacci level near 1.1745, followed by 1.1825 (61.8% retracement), then 1.1938 and the recent cycle high around 1.2082. On the downside, initial support lies at 1.1666; a break below this level could open the way toward 1.1567 (23.6% retracement) and further down to the key structural support near 1.1408.
GBP/USD edges lower to around 1.3525 during early Asian trading on Tuesday. The Fed is broadly expected to hold interest rates steady at 3.50%–3.75% at its April meeting on Wednesday, while the BoE is also anticipated to keep rates unchanged on Thursday.
GBP/USD remains under pressure, trading near 1.3525 in early Asian dealings on Tuesday as the Pound Sterling weakens against the US Dollar. Market participants are staying cautious ahead of key policy decisions from the Federal Reserve and the Bank of England later this week.
The Fed is expected to leave its benchmark rate unchanged at 3.50%–3.75%, a level maintained since January. Analysts at Deutsche Bank point to a shift in expectations toward a more hawkish Fed stance, largely driven by persistent inflation linked to rising oil prices.
Attention will turn to Fed Chair Jerome Powell’s post-meeting press conference, where any hawkish signals could boost the US Dollar and weigh further on the pair.
Meanwhile, the Bank of England is also widely anticipated to keep rates steady on Thursday. Investors will look for clues on whether the central bank is leaning toward future tightening. Economists highlight that the UK economy remains particularly exposed to higher energy costs due to its reliance on natural gas.
According to Edward Allenby, senior UK economist at Oxford Economics, the base-case scenario is for rates to remain unchanged for the rest of the year, with policymakers likely to gain clearer insight into the impact of the energy shock by the end of July.