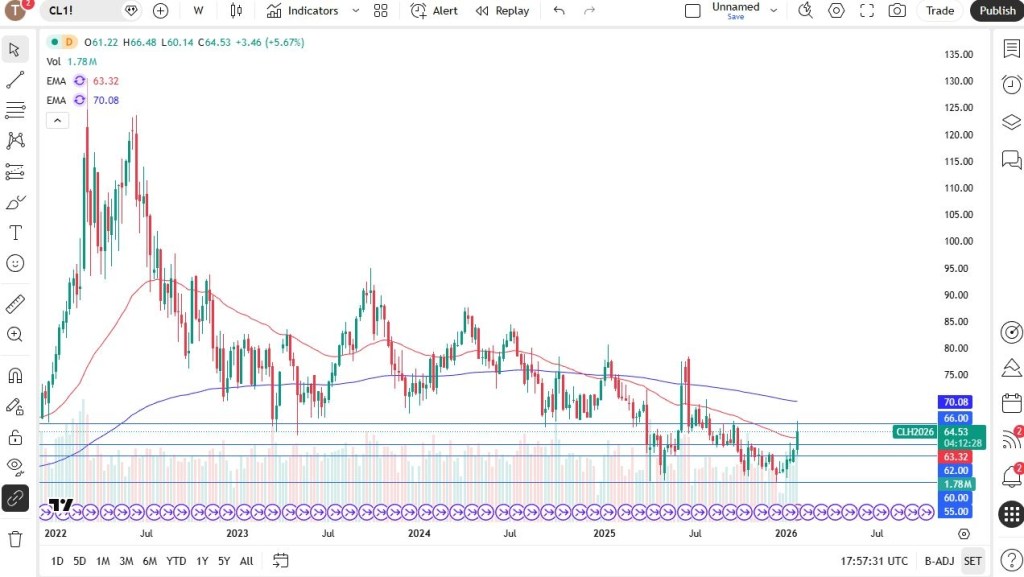
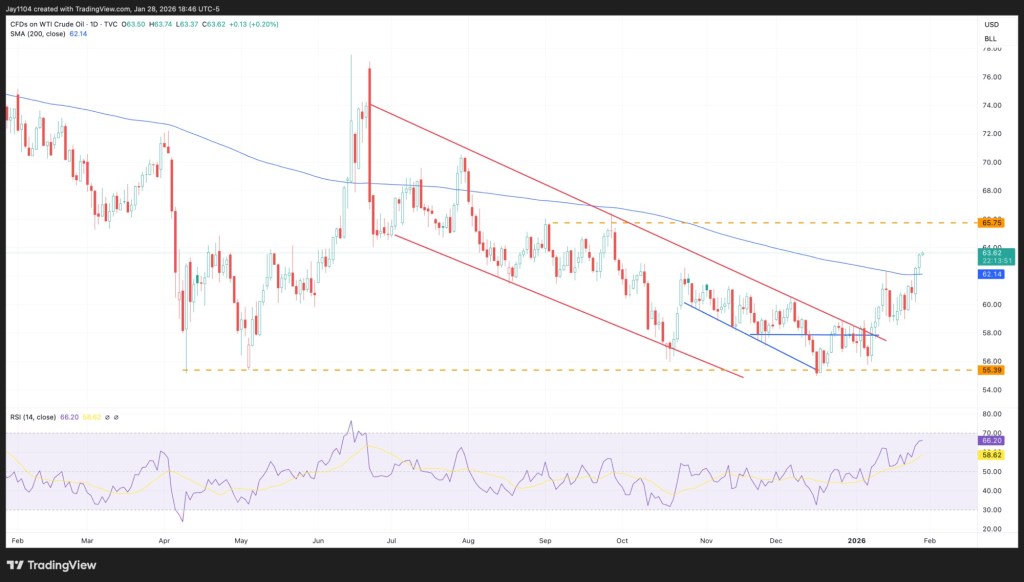
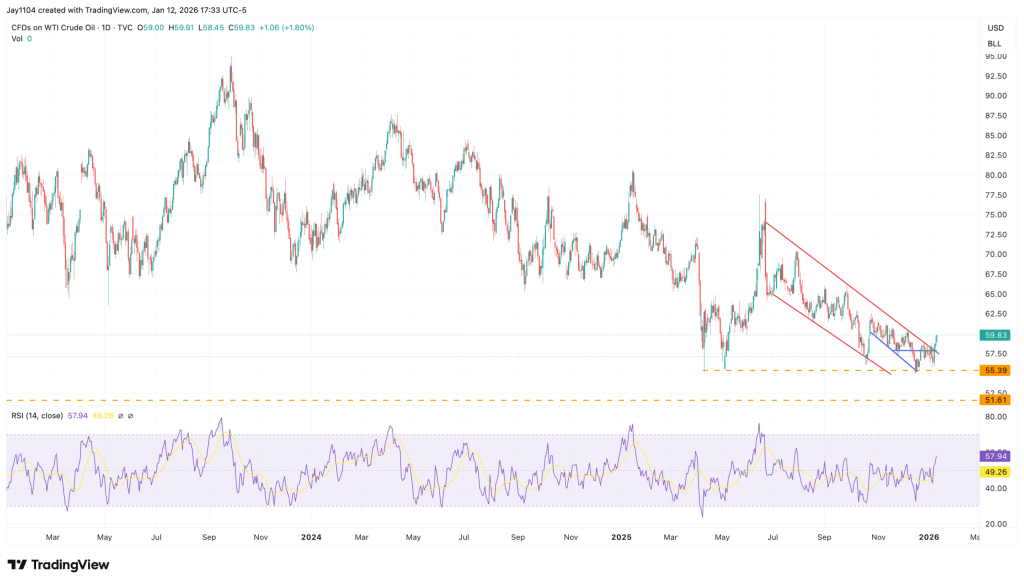
The $66 level in WTI crude oil has proven to be a notable resistance zone, and prices are now retreating from that area. There is considerable uncertainty in the market over whether potential strikes against Iran could occur over the weekend, adding a layer of geopolitical risk.
Even so, underlying supply-and-demand dynamics remain a significant constraint on price action. As a result, large, sustained moves appear unlikely, and the prevailing strategy may continue to favor selling into rallies rather than chasing upside momentum.
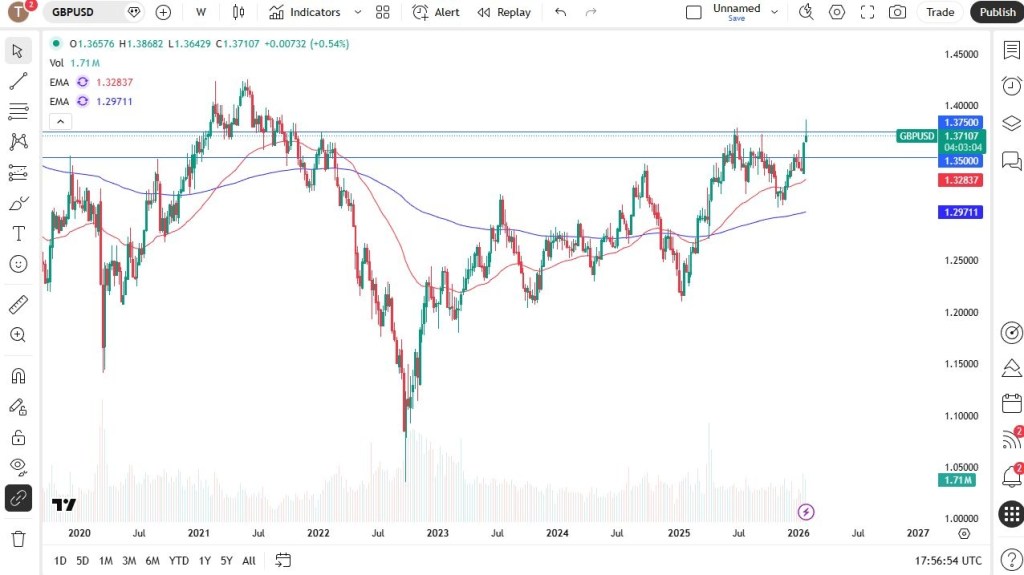
British Pound
The British pound pushed above the 1.3750 level, but buying momentum now appears to be fading as selling pressure shows signs of exhaustion. Notably, the weekly candlestick resembles a shooting star, a pattern that often signals difficulty in sustaining further gains.
From here, a pullback could see GBP/USD slide toward the 1.35 area, a major round number with strong psychological significance. Part of this shift in sentiment may be tied to Kevin Warsh’s nomination as the next Federal Reserve Chair, as his comparatively hawkish stance has strengthened expectations for tighter U.S. monetary policy, weighing on the pound.
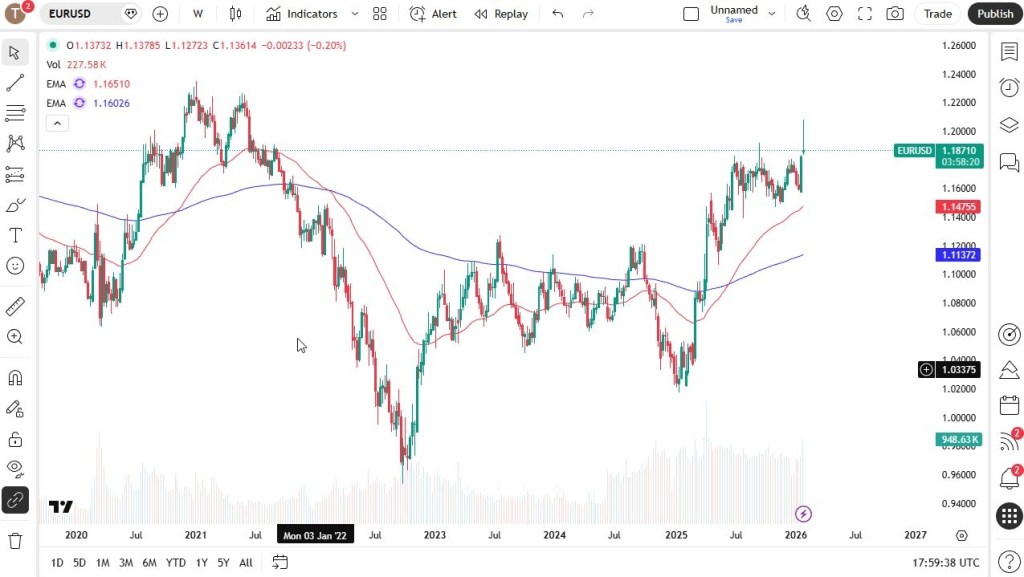
EUR/USD
The euro staged a strong rally earlier in the week but then reversed sharply after the initial upside move. This price action suggests the market may be entering a period of consolidation, raising the possibility that the recent breakout was a false move.
Much will depend on how traders respond to the nomination of the new Federal Reserve Chair. For now, the euro appears to be losing momentum. On the downside, the 1.16 level could come into play. However, if buyers step back in quickly over the coming week, the pair could regain strength and push higher, potentially revisiting the 1.20 area, with a further extension toward 1.23 if bullish momentum builds.
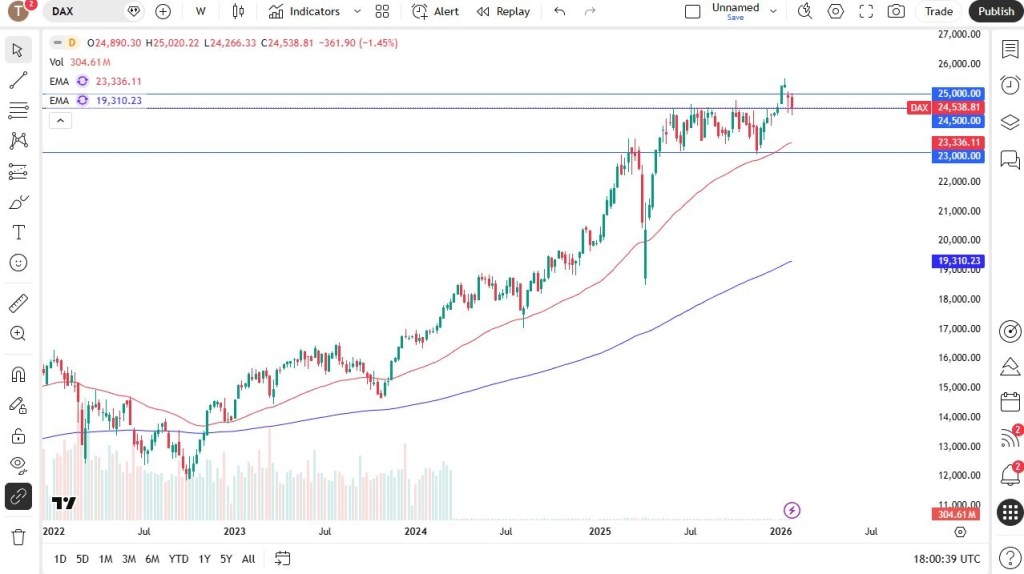
DAX
The German DAX has spent most of the week in negative territory but continues to hold above the 24,500 level, an area that has become important support after previously acting as resistance. This ability to stabilize at a former breakout zone suggests underlying buying interest remains intact.
Overall, the index appears to be in the process of bottoming and potentially turning higher, with scope for a renewed push to the upside. Looking further ahead, the outlook remains constructive. Ongoing fiscal support and heavy government spending in Germany should provide a tailwind for equities, leading to expectations that the DAX could be among the stronger-performing indices this year. As a result, the broader bias remains bullish.
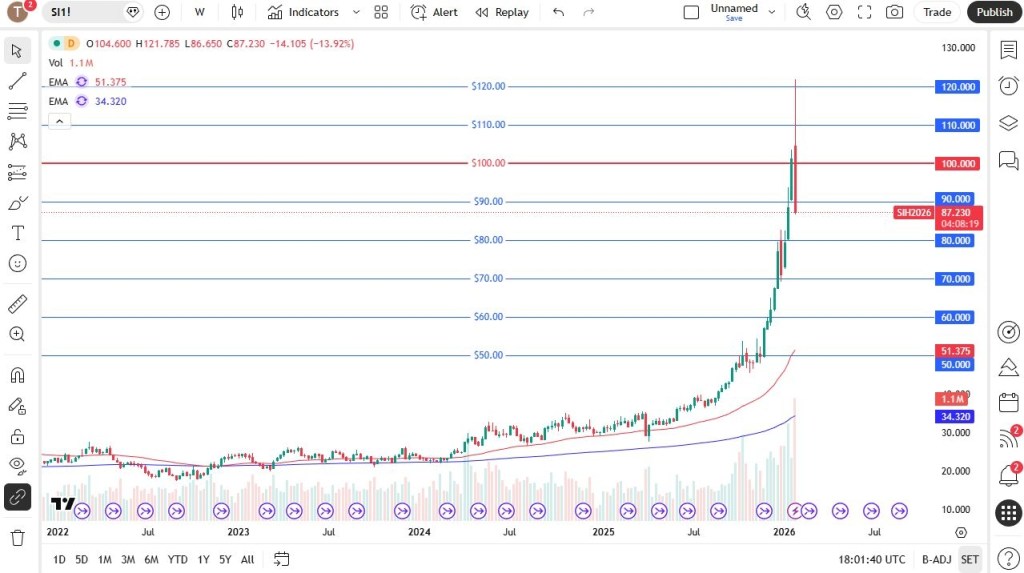
Silver
Silver has become the focal point of market discussion after an extraordinary week of price action. After surging to around $122, the metal suffered a dramatic reversal, ending Friday in what can only be described as a sharp selloff.
In a single session, silver plunged below the $90 level, and momentum now suggests a potential move toward $80. After such an extreme rally, a correction was inevitable, and the market now appears to be experiencing that long-overdue pullback.
The selloff was likely exacerbated by the nomination of a more hawkish-than-expected Federal Reserve Chair, adding pressure to precious metals. Even in normal conditions, silver is known for its volatility, and the current environment has only amplified those swings. For now, price action has become exceptionally unstable, making silver largely untradeable for many participants.
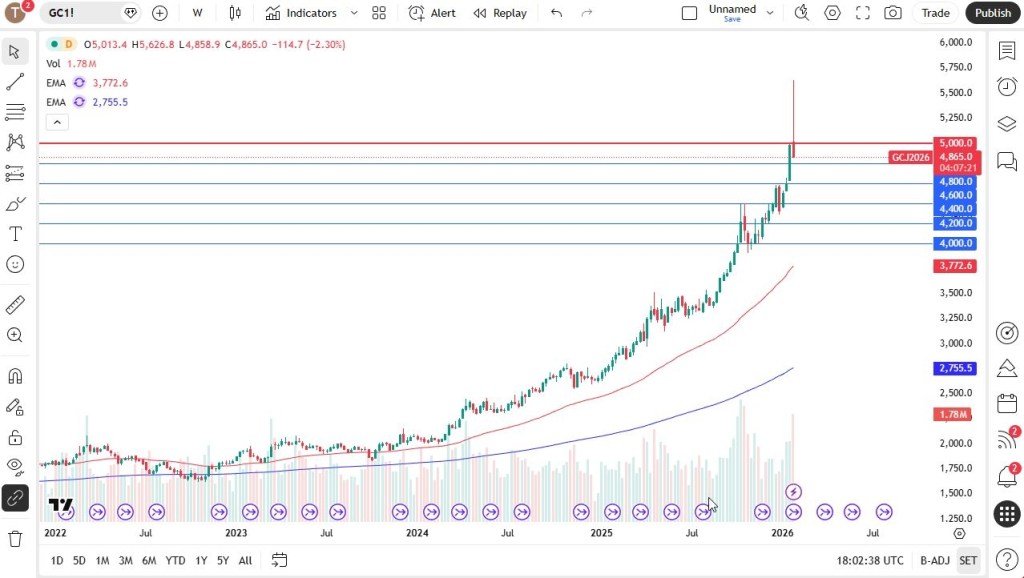
Gold
Gold has been hit hard as well, but unlike silver, it benefits from strong central bank support, which should help it recover more quickly. Silver had moved so far beyond its fundamental norms that it began to resemble the kind of speculative excess often seen in smaller cryptocurrencies.
Gold, by contrast, continues to attract substantial institutional and central bank demand. That said, it is possible the market has already set a peak, although it may be too soon to say so definitively. Given the way trading unfolded on Friday, it is difficult to ignore the risk of continued downside follow-through.
Still, considering that gold was trading near $1,700 just two years ago, some form of correction was inevitable. When markets become stretched and overheated, this kind of reset is ultimately unavoidable.
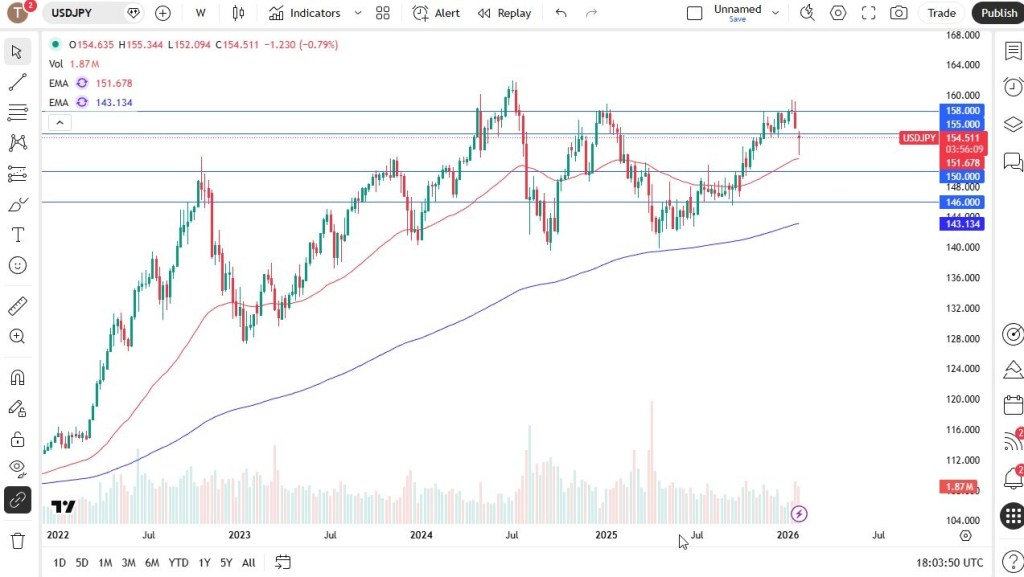
USD/JPY
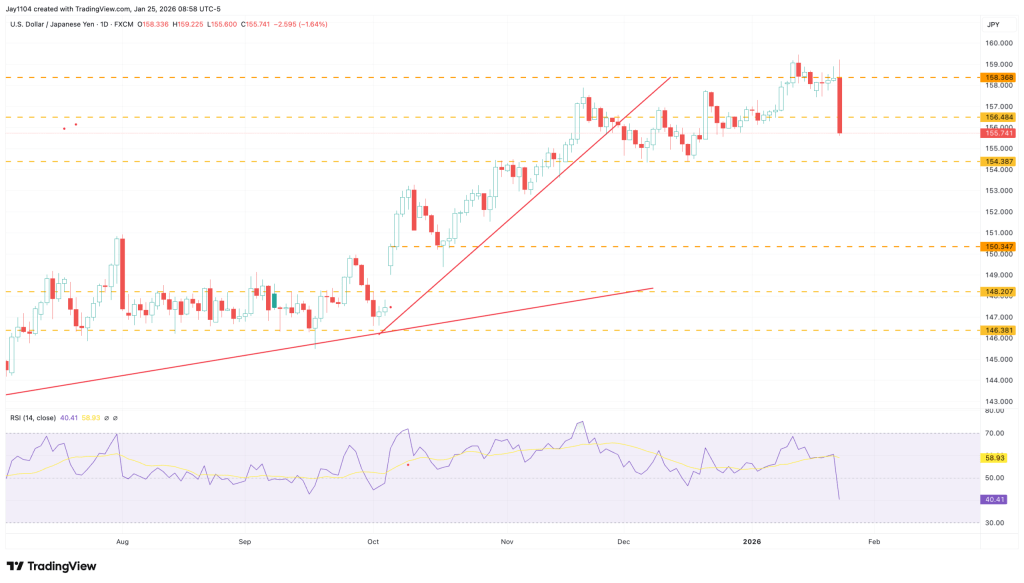
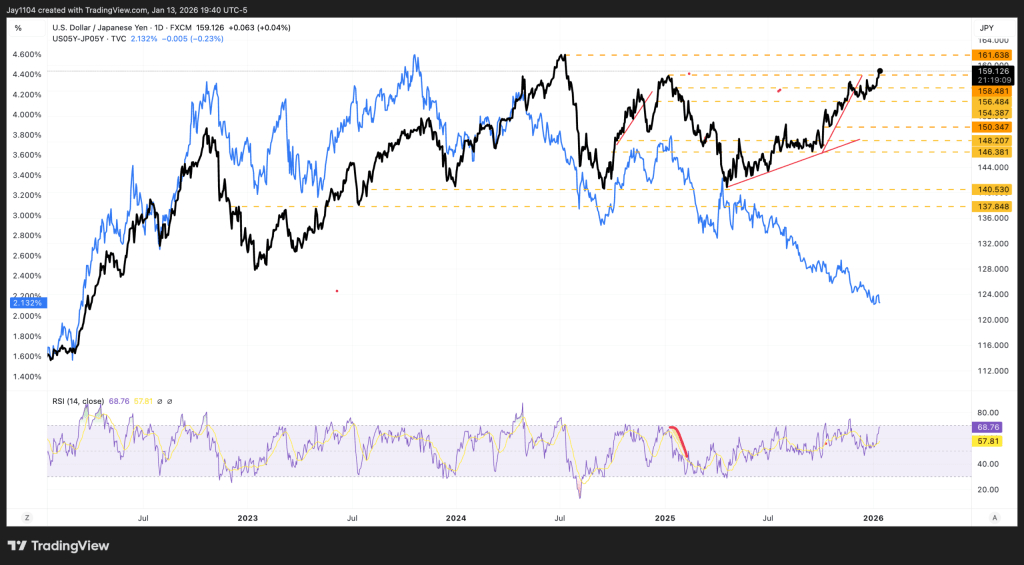
The U.S. dollar initially sank sharply against the Japanese yen over the week, but that move has since reversed decisively. The rebound suggests markets may be reassessing what now appears to have been an overly aggressive bet against the dollar.
Given the significant interest rate differential between the two currencies, this type of recovery is broadly in line with how the pair might be expected to trade. Technically, USD/JPY found support at the 50-week EMA, and if prices can reclaim the 155 level, the next upside target could be a move toward 158 yen.
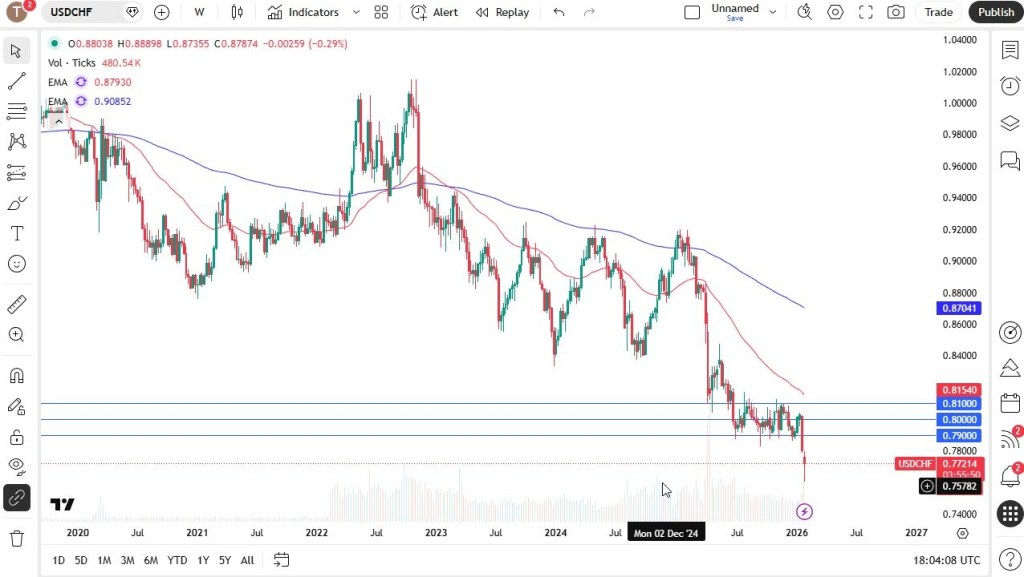
USD/CHF
The U.S. dollar declined sharply against the Swiss franc, briefly testing the 0.76 level. While that price point may not be especially significant on its own, it does raise the possibility of Swiss National Bank intervention if franc strength becomes excessive—a risk that remains in the background.
Technically, the pair appears to be forming a hammer pattern following the breakdown, and more importantly, the U.S. dollar has begun to strengthen more broadly across global markets. Taken together, these factors suggest USD/CHF could be setting up for a rebound in the near term.
What’s going on? On Monday, Needham upgraded AppLovin Corp (NASDAQ: APP) to Buy and set a $700 price target.
TL;DR: Needham turns bullish, lifting its 2026 ecommerce revenue forecast to $1.45B.
The full picture: Needham raised its rating after a deeper dive into AppLovin’s ecommerce business, strengthening its conviction in accelerating revenue growth by 2026—particularly as the stock has pulled back from last month’s highs. The firm views the recent weakness as a market mispricing, arguing that opportunistic advertisers are stepping in despite typical seasonal softness.
Needham increased its 2026 ecommerce revenue estimate to $1.45B from $1.05B, citing upcoming self-service launches that should expand the advertiser base and drive higher spending. This, in their view, could overpower usual Q1 seasonality and deliver sequential growth.
Even with the higher forecast, Needham sees further upside in a bull-case scenario—especially if AppLovin’s ecommerce trajectory begins to resemble TikTok’s rapid monetization curve, reinforcing the idea that in markets, replication can be a powerful catalyst for outsized returns.
American Axle
What’s going on? On Tuesday, BWS Financial launched coverage of American Axle & Manufacturing with a Buy rating and set a $17 price target.
TL;DR: AXL is merging with Dowlais, and the shares appear undervalued.
The bigger picture: American Axle & Manufacturing Holdings Inc. (AXL), which plans to rebrand as Dauch Corp. (NYSE: AXL), is nearing completion of its merger with Dowlais Group plc (DWLAF). According to BWS Financial, the deal will significantly diversify the business—expanding its automaker customer base, strengthening its global footprint, and broadening its product offerings. The combined company is expected to become a major force among auto suppliers, able to capitalize on greater scale, geographic reach, and meaningful operating efficiencies.
These advantages are projected to drive a sharp increase in free cash flow starting in 2027.
At the same time, AXL is adjusting its pricing and bidding approach to improve gross margins. While this strategy may weigh on revenue in 2025, it should support stronger cash generation. The analyst believes this near-term revenue softness has pushed the stock into deeply discounted territory.
Despite trading at valuation levels often associated with distressed companies, AXL remains profitable and continues to generate free cash flow. For investors searching for overlooked value opportunities, BWS Financial sees a compelling disconnect between fundamentals and the current share price.
Applied Materials
What happened? On Wednesday, Mizuho raised its rating on Applied Materials (NASDAQ: AMAT) to Outperform and lifted its price target to $370.
TL;DR: Mizuho expects stronger wafer fab equipment (WFE) growth and rising global capex to power further upside for AMAT.
The full story: Mizuho upgraded AMAT from Neutral with a $275 target to Outperform at $370, citing a much more favorable industry backdrop. As the world’s second-largest supplier of wafer fab equipment, Applied Materials is seen as a prime beneficiary of a powerful upswing in semiconductor capital spending across the U.S., Taiwan, and Japan.
The bank points to sharply improving WFE forecasts, with 2026 estimates now projected to jump 13% year over year, followed by another 12% increase in 2027—a dramatic acceleration compared with earlier expectations and a meaningful boost to AMAT’s earnings potential.
Core growth drivers include foundry and logic, which account for about 65% of revenue, supported by TSMC’s substantially higher capital spending plans for 2026–2028 versus 2023–2025, alongside a more constructive outlook for Intel’s tool purchases in 2026. On the memory side, DRAM—roughly 30% of revenue—stands to benefit from strong demand for high-bandwidth memory.
Concerns around China have also eased, as about 70% of AMAT’s revenue now comes from outside China, where growth is accelerating. With global WFE momentum building and major customers like TSMC and Intel increasing investment, Mizuho believes the setup strongly favors AMAT and justifies the Outperform call.
First Solar
What happened? On Thursday, BMO Capital Markets cut its rating on First Solar (NASDAQ: FSLR) to Market Perform and set a $263 price target.
TL;DR: BMO turns cautious on FSLR, citing competitive risks from Tesla and concerns that rising capacity could pressure module pricing.
The full story: BMO downgraded First Solar amid growing uncertainty around Tesla’s expanding solar ambitions. The firm questions how much of Tesla’s excess module capacity—given its proven ability to scale clean-energy platforms such as energy storage systems and inverters—could spill into the broader market rather than being used internally.
With U.S. utility-scale solar demand running at roughly 45–50 GW per year, First Solar’s 14.1 GW of capacity, alongside T1 Energy’s 2.1 GW (with potential expansion to 5.3 GW), could face intensified competition if Tesla moves toward its stated 100 GW capacity goal. Such a scenario could weigh on long-term module pricing or leave a persistent overhang on FSLR shares.
BMO notes that the bullish case for First Solar depends heavily on elevated U.S. module average selling prices (ASPs). However, after the stock’s 56% gain over the past 12 months, valuation now implies module pricing of about $0.29 per watt, even as backlog pricing sits closer to $0.30–$0.33 per watt. Earlier analysis suggested prices could climb into the high-$0.30s or low-$0.40s if Section 232 tariffs on polysilicon imports tightened supply—each $0.01 per watt increase potentially adding $23 per share in value.
That upside, however, may be tempered by a recent presidential order on semiconductors that includes exemptions for data centers, an area where Tesla could focus its solar deployments, potentially easing pressure from polysilicon-related restrictions.
Taken together—rising industry capacity, uncertain pricing durability, and Tesla’s looming presence—BMO sees limited justification for sustained pricing optimism and adopts a more neutral stance on First Solar.
Broadcom Inc.
What happened? On Friday, Wolfe Research upgraded Broadcom (NASDAQ: AVGO) to Outperform and raised its price target to around $370–$400.
TL;DR: Stronger expectations for TPU-driven AI growth led Wolfe to lift its outlook for Broadcom.
The full story: Wolfe Research upgraded Broadcom to Outperform, citing accelerating demand tied to the AI buildout—particularly from Google’s Tensor Processing Units (TPUs). Channel checks suggest TPU deployments could reach 7 million units by 2028, and Alphabet’s decision to offer TPUs to external customers is seen as creating a credible alternative to Nvidia’s ecosystem. Wolfe views Broadcom as the primary beneficiary of this shift.
As a result, the firm raised its long-term forecasts, projecting CY27 revenue of $154.5 billion and EPS of $16, implying a valuation of roughly 21x earnings. Additional upside could come from AI accelerator (XPU) programs at companies like Meta and OpenAI that are not yet fully reflected in estimates.
Wolfe also revised its AI ASIC revenue outlook higher, estimating $44 billion in CY26 based on 3.3 million TPU shipments, rising sharply to $78.4 billion in CY27 on 5.1 million units. TPUs are expected to account for the bulk of this growth, with other AI projects contributing smaller portions. Networking revenue is forecast to jump 75% to $15.1 billion in CY26, followed by 55% growth in CY27, while non-AI semiconductor and software segments are expected to remain relatively stable.
From a valuation standpoint, Wolfe argues the stock remains attractive. Its base case of $16 EPS in CY27 suggests room for multiple expansion, while a bullish scenario—with AI revenue doubling again—could push earnings toward $18 per share. Wolfe’s upper-end target reflects a valuation below Broadcom’s three-year average multiple of around 25x since the AI cycle began, reinforcing its positive stance on the stock.
The United Steelworkers (USW) said late Saturday that it had agreed to extend negotiations with Marathon Petroleum, temporarily avoiding a strike involving roughly 30,000 workers at U.S. refineries and chemical plants.
Under the rolling 24-hour extension, the existing labor contract—originally set to expire at 12:01 a.m. ET on Sunday—will remain in force unless either the union issues a 24-hour strike notice or Marathon provides a 24-hour lockout notice.
Since talks began just over a week ago, the union has turned down at least five proposals from Marathon. The most recent offer, made Saturday, included a 14% wage increase over a four-year contract for refinery and chemical plant employees.
Marathon is serving as the lead negotiator for 26 U.S. refining and chemical companies, including Exxon Mobil, Chevron, and Valero Energy. The USW represents workers at facilities that together account for about two-thirds of U.S. crude oil refining capacity.
Earlier Saturday, Marathon spokesperson Jamal Kheiry said the company continued to meet with USW representatives and remained committed to bargaining in good faith toward a mutually acceptable agreement.
Meanwhile, Mike Smith, chairman of the Steelworkers’ National Oil Bargaining Program, said union members were pushing for fairness and justice, emphasizing that their industry-wide unity demonstrated readiness to fight for a fair contract.
People familiar with the negotiations said key sticking points include cost-of-living adjustments for the roughly 30,000 union-represented oil workers, healthcare expenses, and rules governing the use of artificial intelligence at refinery and chemical plants.
The United Steelworkers is also seeking stronger safety standards, though sources said this demand appears unacceptable to Marathon.
“Marathon believes workers in this industry are already overpaid,” one source said, speaking on condition of anonymity because they were not authorized to comment publicly. “There’s very little movement on economic issues, and aside from AI, they aren’t seriously engaging with the rest of our proposals. Even on AI, the approach hasn’t been constructive.”
In past contract negotiations, the USW has repeatedly agreed to roll over contracts for several days beyond their expiration through 24-hour extensions.
The current talks are focused on a national pattern agreement that establishes wages for hourly union workers, healthcare costs, and nationwide standards on safety and other matters.
Refinery operators typically earn around $50 an hour after completing their probationary period.
The national framework is paired with site-specific agreements to form individual contracts at each facility.
On Friday, Marathon and workers reached agreement on local issues at the company’s largest facility, the Galveston Bay Refinery, which has a capacity of 631,000 barrels per day.
During and in the aftermath of 9/11, Nassim Taleb—a Lebanese-born former options trader and quantitative analyst—published Fooled by Randomness. He later refined and formalized the idea in his 2007 book The Black Swan, drawing on the metaphor of the rare black swan, an anomaly among typically white birds.
Taleb defined a Black Swan as an event that meets three criteria: first, it is an extreme outlier, often without historical precedent; second, it carries an immediate and profound impact; and third, it becomes explainable only in hindsight, after the event has occurred.
Forty years ago tomorrow, on the morning of Tuesday, January 28, 1986, tens of millions of Americans watched live as the Space Shuttle Challenger lifted off—only to explode 73 seconds into flight, killing all seven crew members, including the widely admired teacher-astronaut Christa McAuliffe.
The tragedy met all of Nassim Taleb’s criteria for a Black Swan event. First, it was unprecedented, marking the first fatal in-flight disaster involving a US spacecraft. Second, its impact was immediate: President Ronald Reagan postponed his State of the Union address scheduled for that evening. Third, the cause was only fully understood after the fact, when physicist Richard Feynman explained during televised hearings that the disaster resulted from O-ring failure in unusually cold conditions.
One response that did not occur—then or in most Black Swan events—was a meaningful stock market selloff. Markets were largely indifferent. The S&P 500 rose on the day of the explosion and continued higher, gaining 2.6% for the week and 16.8% over the remainder of 1986. The Dow Jones Industrial Average also advanced, rising 1.2% on the day, 2.7% for the week, and 22.6% for the year.
Another Black Swan touched Great Britain exactly fifty years earlier, when global stock markets closed on January 28, 1936, to mark the funeral of King George V. He was succeeded by Edward VIII, whose relationship with an American divorcée triggered a constitutional crisis that lasted much of the year. The turmoil ended with Edward’s abdication in favor of his younger brother, who became King George VI and later passed the crown to his daughter, Elizabeth II—the longest-reigning and arguably most popular British monarch—suggesting the succession ultimately resolved smoothly.
Despite the political uncertainty, 1936 proved to be a strong year for markets during an otherwise bleak Depression-era decade, with the Dow Jones Industrial Average rising 25%.
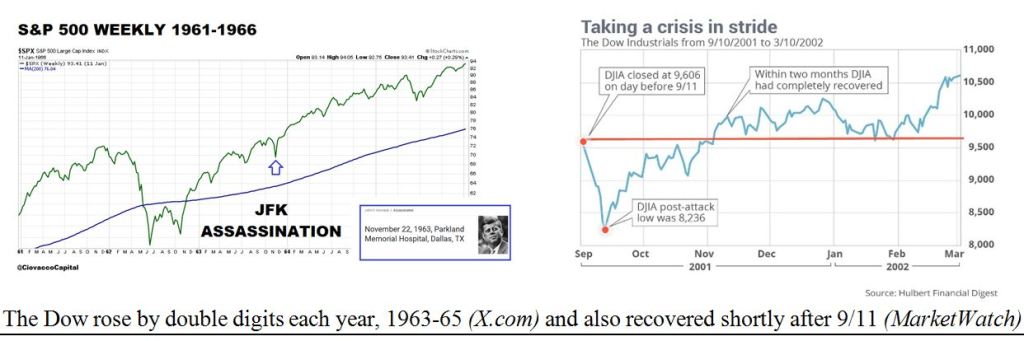
Across the past century, several other major Black Swan events have reshaped history, including the outbreak of World War I following the assassination in Sarajevo on June 28, 1914; Japan’s attack on Pearl Harbor on December 7, 1941; the assassination of President John F. Kennedy on November 22, 1963; and the September 11, 2001 attacks.
History also shows a striking pattern in which US presidents elected in seven consecutive election years, spaced 20 years apart, died in office: William Henry Harrison (1840), Abraham Lincoln (1860), James Garfield (1880), William McKinley (1900), Warren Harding (1920), Franklin Roosevelt (1940), and John F. Kennedy (1960). One might argue that this grim sequence made the outcome seem almost “predictable.” The streak ended two decades later, when Ronald Reagan survived an assassination attempt in March 1981, with John Hinckley’s bullet narrowly missing his heart.
Following the survival of Reagan—and Pope John Paul II six weeks later—three major Black Swan events marked the late 1980s. The first was the 1986 Challenger explosion, followed by the 1987 Black Monday market crash, which shocked investors far more than the general public. The decade closed with the fall of the Berlin Wall in 1989, a swan-like event, even though many had anticipated the eventual collapse of Gorbachev’s Soviet Union.
The stock market shrugs off most Black Swan events
The stock market posted an unexpected rally in the week and year following President Kennedy’s assassination and rebounded swiftly after the September 11, 2001 attacks. These Black Swan events appeared to have little lasting effect on Wall Street, as traders largely focused on other—primarily financial—developments and trends.
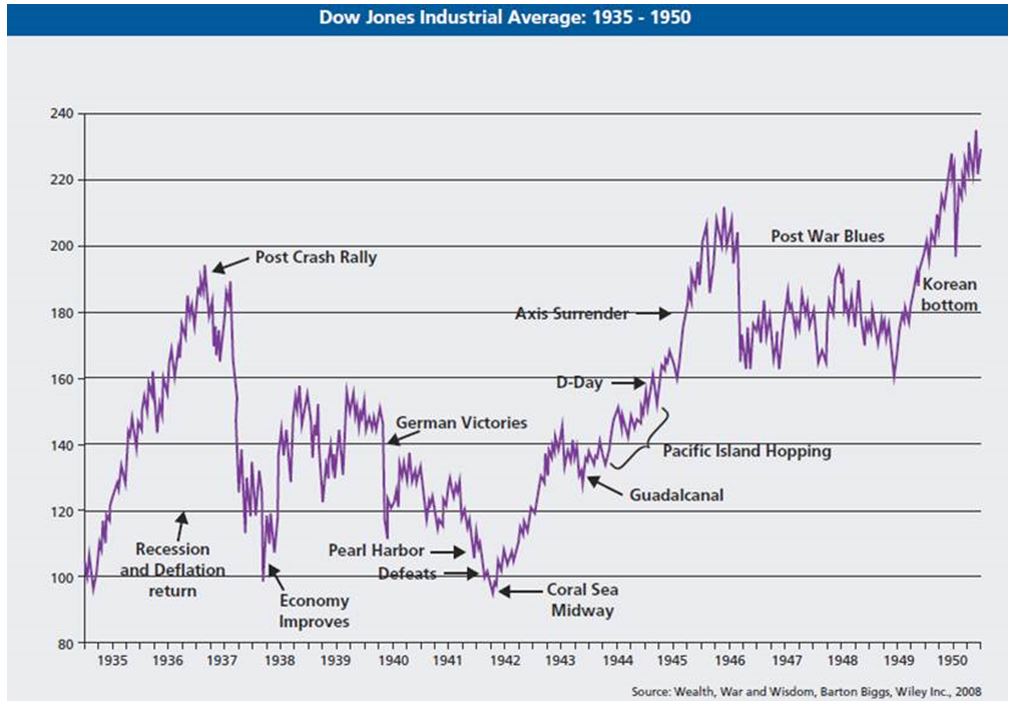
Markets also tended to rise during many 20th-century wars, most of which began with surprise attacks. The abrupt onset of World Wars I and II, the unexpected outbreak of the Korean War, and the August 1964 Gulf of Tonkin escalation of the Vietnam War all triggered initial sell-offs that were followed by strong market recoveries.
The accompanying diagram illustrates the market’s detailed reaction after the attack on Pearl Harbor in late 1941 and following the North Korean invasion in June 1950. These two episodes were separated by a period of post-war, largely “Swan-less,” malaise in the late 1940s.
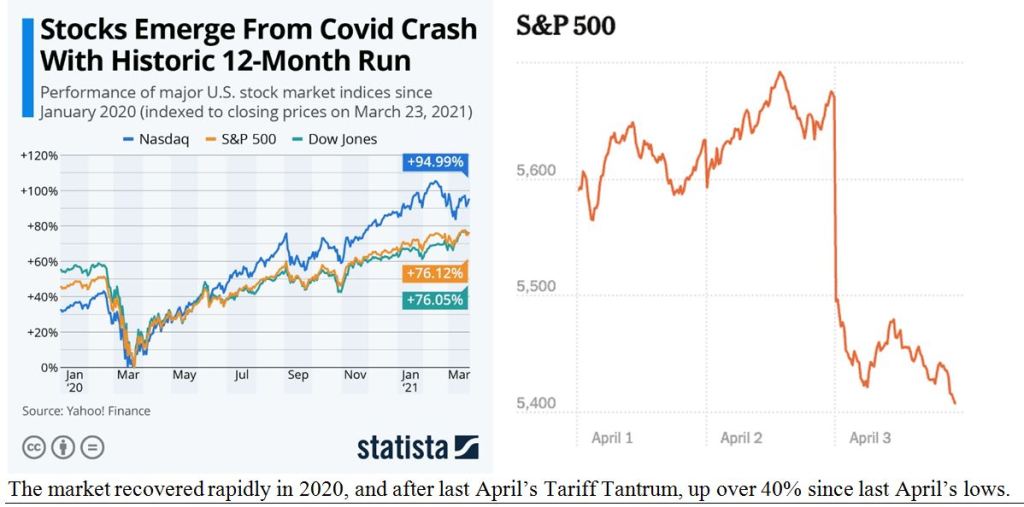
In the two most recent Black Swan episodes, markets followed a familiar pattern. First, the abrupt escalation of the COVID-19 crisis in March 2020 triggered a stunning 35% market collapse in just 35 days, which was then followed by one of the strongest recoveries on record later that year. Second, markets sold off sharply after President Trump and Interior Secretary Lutnick unveiled sweeping high-tariff measures on “Liberation Day” in April 2025, yet the S&P 500 has since rebounded and is now up roughly 40% from those lows.
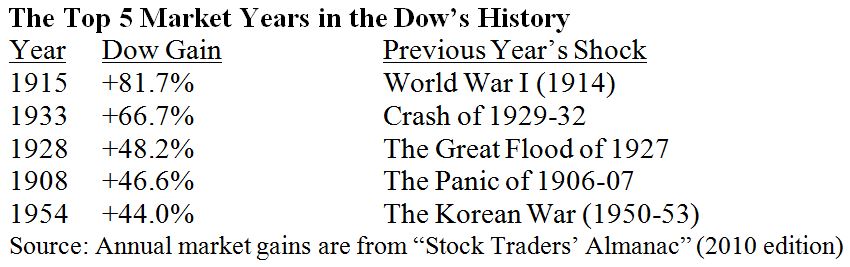
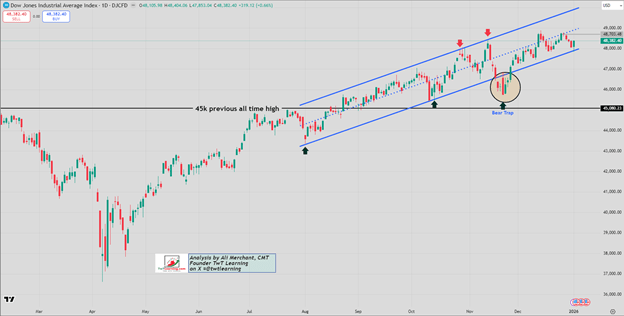
Most of the Dow’s top five annual gains over its 130-year history followed major Black Swan events.
By definition, the next Black Swan event is unknowable, but the market’s response may not be. With or without a short-term correction, prices are likely to be higher a year later.
Major stock indexes slipped slightly as markets weighed President Trump’s pick of Kevin Warsh to replace Fed Chair Jerome Powell in May.
Verizon jumped on robust subscriber additions and optimistic guidance for 2026, while American Express declined even after topping revenue expectations.
Silver tumbled more than 17% in a sharp reversal from record levels, sparking broad profit-taking across precious metals.
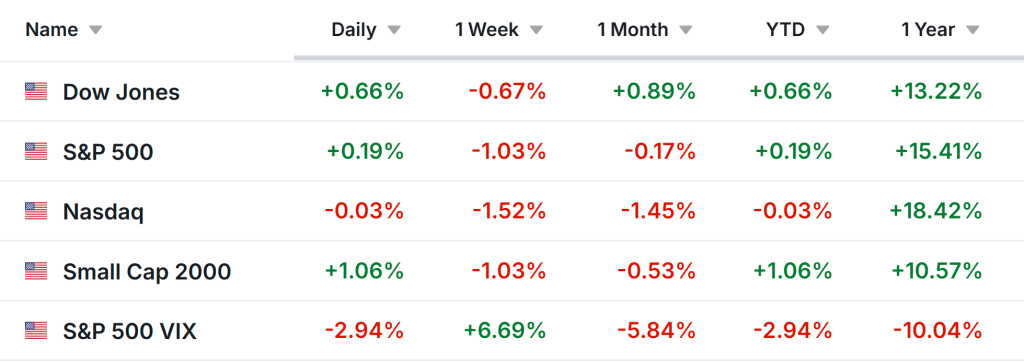
Even with Friday’s retreat, the three main benchmarks still delivered solid gains for January, rounding off a strong opening to 2026.
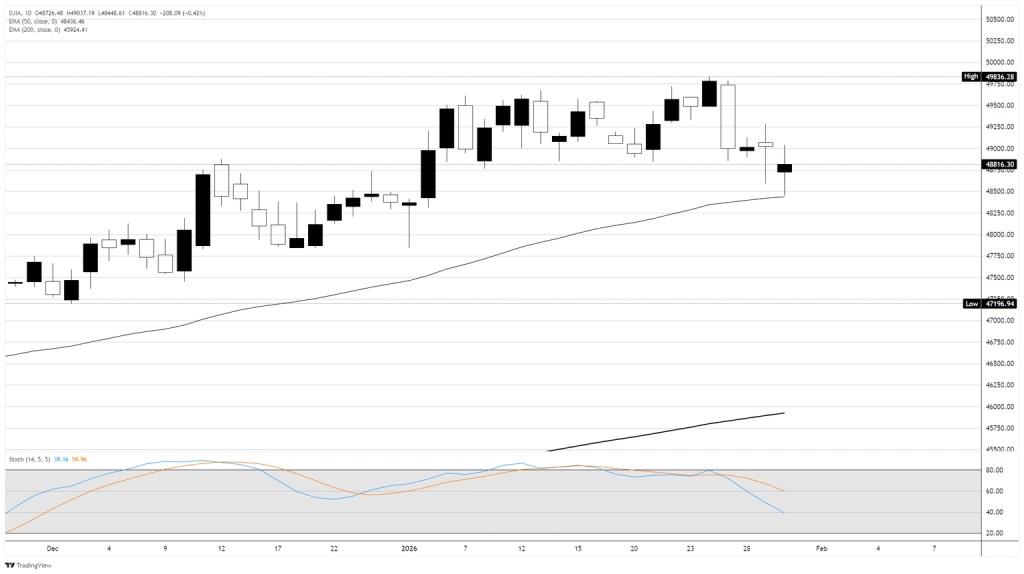
The Dow Jones Industrial Average fell about 200 points on Friday, down 0.2%, as investors assessed President Donald Trump’s nomination of former Fed Governor Kevin Warsh to replace Jerome Powell as Federal Reserve Chair when his term ends in May. The S&P 500 also slipped 0.2%, while the Nasdaq Composite declined 0.3%.
Even so, January ended on a strong note overall, with all three major indexes posting solid monthly gains: the Dow climbed 2.1%, the S&P 500 rose 1.8%, and the Nasdaq advanced 1.9%.
Warsh nomination puts an end to months of Fed leadership speculation
President Trump announced on Friday morning that Kevin Warsh would be his choice to lead the Federal Reserve, bringing an end to months of uncertainty over who would succeed Jerome Powell. Warsh, 55, served on the Fed’s Board of Governors from 2006 to 2011 and played a prominent advisory role during the 2008 financial crisis.
Investors generally see Warsh as a relatively hawkish nominee who would favor lower interest rates, though likely with more restraint than some other contenders. His nomination now heads to what could be a difficult Senate confirmation process, as Republican Senator Thom Tillis has warned he will block Fed nominees until a Justice Department investigation into Powell is concluded.
Verizon jumps after posting record subscriber additions
Verizon Communications Inc. (VZ) stood out among Dow stocks, jumping 6.6% after reporting its strongest quarterly subscriber growth since 2019. The telecom operator added 616,000 postpaid wireless phone customers in the fourth quarter, well above forecasts of about 417,000.
The surge was driven by new CEO Dan Schulman’s aggressive promotions, including offers such as four phone lines for $100 a month, which proved popular with holiday shoppers. Investors were further encouraged by Verizon’s 2026 outlook, as the company projected adjusted earnings of $4.90 to $4.95 per share, comfortably exceeding consensus estimates of $4.76.
Financial shares pull back amid mixed earnings results
American Express Company (AXP) slid 3.1% after posting fourth-quarter results that broadly met expectations but failed to excite investors. The payments firm reported earnings of $3.53 per share on revenue of $18.98 billion, marking a 10.5% year-over-year increase. However, sentiment was dampened by higher credit loss provisions and rising costs, despite management lifting its 2026 outlook above consensus and announcing a 16% dividend hike.
Elsewhere in the sector, Visa Inc. (V) fell 2.3% even after beating both revenue and earnings forecasts, while International Business Machines (IBM) declined 1.6%, giving back part of its roughly 5% rally following earnings the previous day.
Big oil companies top forecasts as production hits record levels
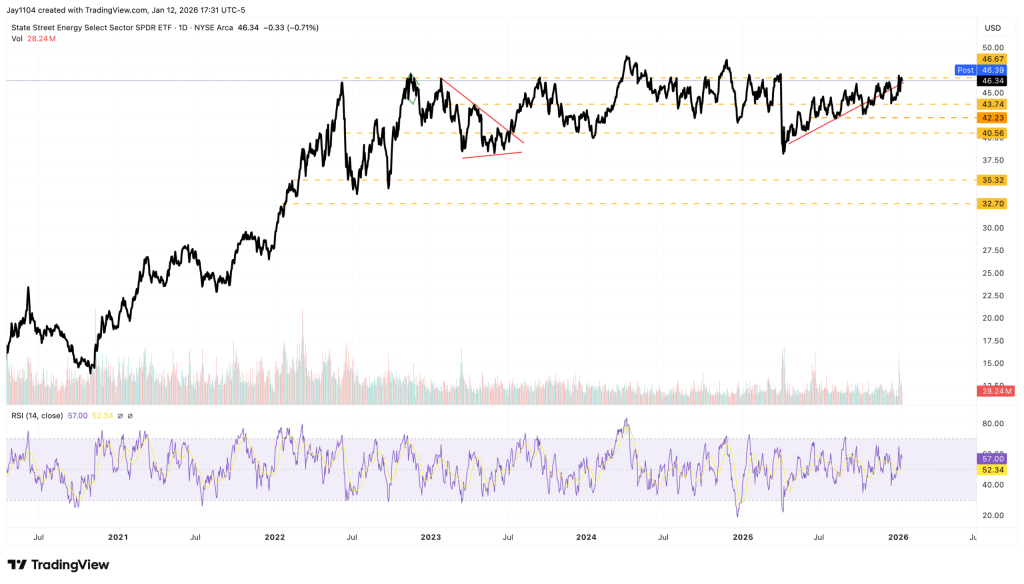
Chevron Corporation (CVX) edged up 0.5% after delivering quarterly earnings that topped expectations, despite weaker oil prices weighing on the broader energy sector. The company highlighted record output from the Permian Basin and its offshore Guyana assets.
ExxonMobil Corporation (XOM) also surpassed profit estimates but slipped 0.8% as both oil majors faced pressure from a global supply surplus that has driven crude prices lower. Management at both companies stressed strong cost discipline and resilience, noting they can remain profitable even with oil at $35 a barrel, although full-year profits have fallen from prior peaks.
Apple slips even after posting a blockbuster iPhone quarter
Apple Inc. (AAPL) slipped 1.2% on Friday even after delivering fiscal first-quarter results that far exceeded expectations. The company reported revenue of $143.8 billion, a 16% year-over-year increase, fueled by a 23% surge in iPhone sales to $85.27 billion. CEO Tim Cook described demand for the iPhone 17 lineup as “simply staggering,” with Apple setting record revenues across all geographic regions. The company’s installed base climbed to more than 2.5 billion devices, up from 2.35 billion a year earlier.
Despite the standout performance, some investors chose to lock in profits after Apple’s recent rally. Broader weakness in the technology sector also weighed on the stock, following a sharp 10% drop in Microsoft shares a day earlier after the company issued disappointing cloud guidance.
Silver tumbles sharply in a dramatic pullback from record highs
Silver prices plunged as much as 21% on Friday, pulling back sharply from record highs in what analysts described as the metal’s steepest one-day decline in 14 years. After surging to an all-time peak of $122 an ounce on Thursday, heavy profit-taking sparked a broad selloff across precious metals.
Even with the abrupt correction, silver was still poised to finish the month up more than 30%, underpinned by heightened geopolitical risks, a weaker dollar, and tight physical supply. Trading volumes in the iShares Silver Trust (SLV) spiked as retail investors who had chased the rally rushed to exit positions. Gold also eased, retreating from recent record levels above $5,500 an ounce.
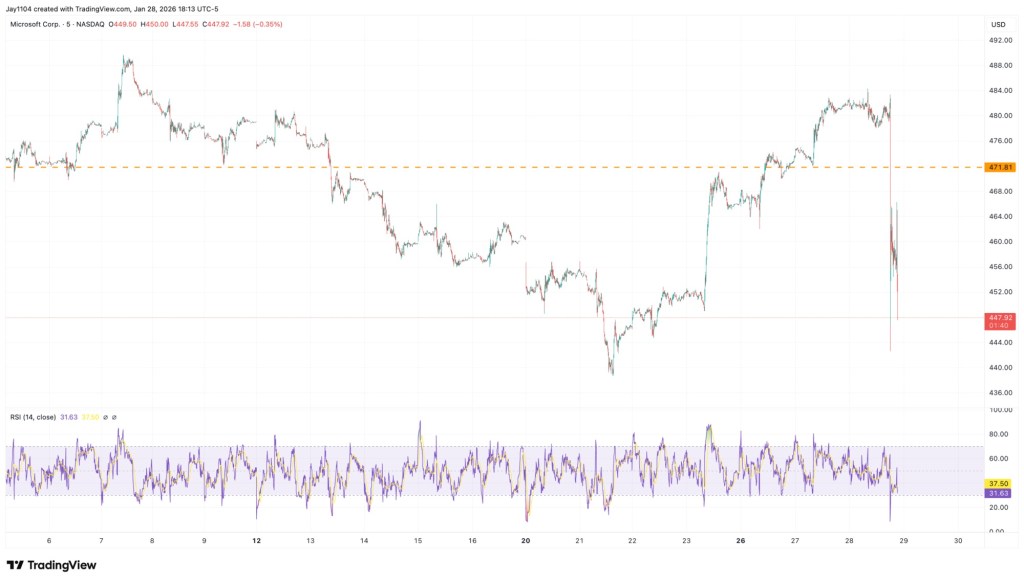
A sharp pullback in Microsoft (MSFT) has cascaded into a broader market correction. While the company beat earnings expectations on both the top and bottom lines, investors were disappointed by slower cloud performance and higher-than-anticipated capital expenditure plans. Microsoft shares have fallen 11.8% on the day (-12.3% YTD, -4.1% LTM), dragging the broader technology sector lower.
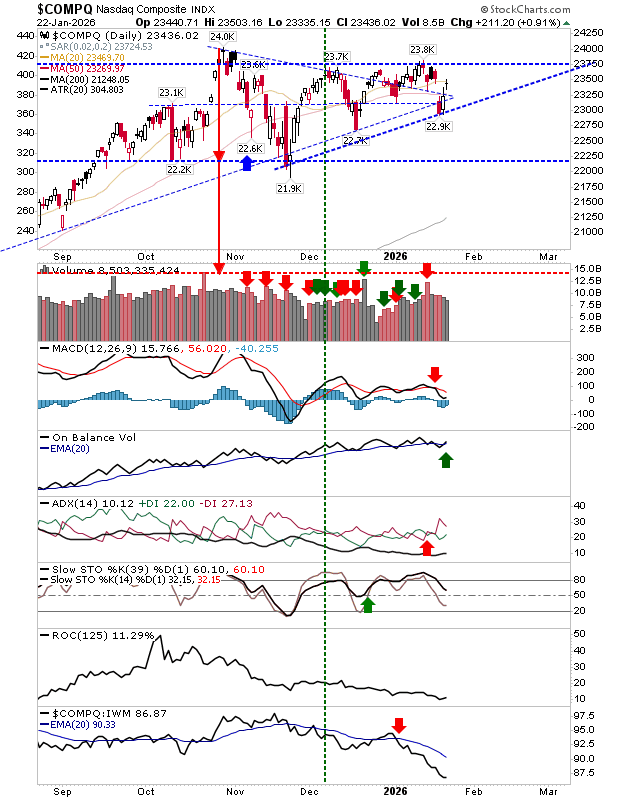
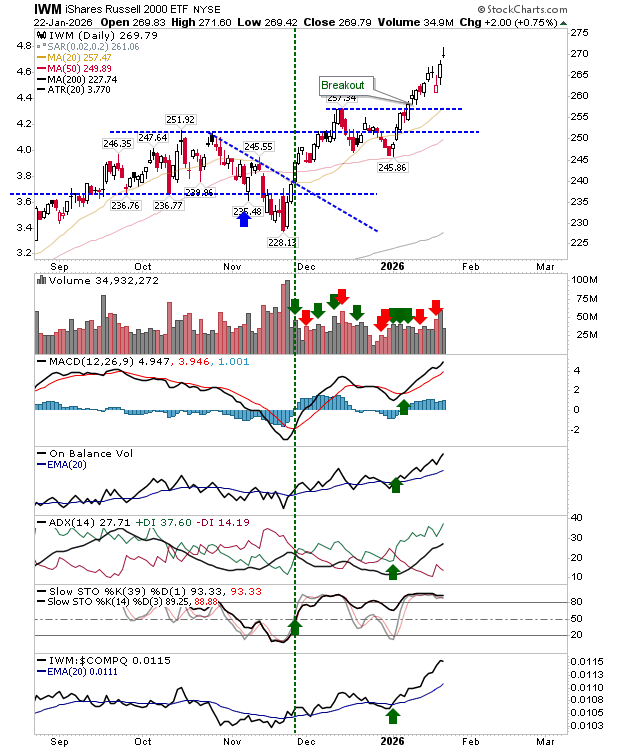
The NASDAQ slid 2.3%, with semiconductor stocks posting similar losses. The Magnificent Seven index declined 1.6%, pulling the S&P 500 down 1.3%, although the equal-weighted S&P slipped just 0.3%. The Dow Jones Industrial Average fell 0.4%, while the Russell 2000 dropped 1.1% in sympathy. Market volatility picked up, with the VIX jumping to 19.4.
Adding to the pressure, precious metals sold off, with gold down 2.2% and silver falling 3.5%. By contrast, copper surged 3.4% to a fresh all-time high of $6.58. Crude oil rallied 3.7% to $65.20 per barrel—after briefly touching $66.50—marking a gain of more than 10% over the past week amid rising risks of conflict involving Iran, the highest level since June 2025. Natural gas and gasoline prices also moved higher.
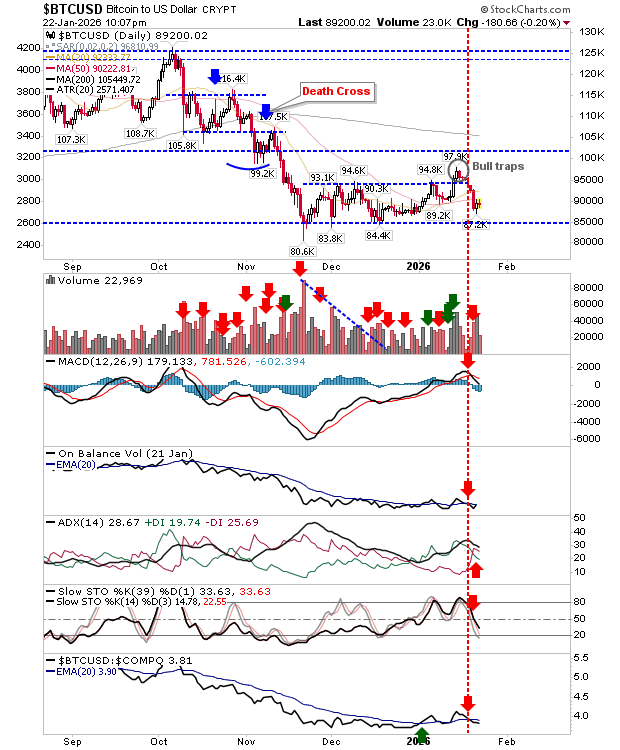
Risk-off sentiment was further evident in cryptocurrencies, with Bitcoin sliding 5% to below $85,000, its lowest level in a year.
Bond markets remained relatively calm. The U.S. 2-year yield eased 2 basis points to 3.55%, while the 10-year slipped 1 basis point to 4.23%. International yields, including those in Japan, were largely unchanged, and the U.S. dollar index was flat on the session.
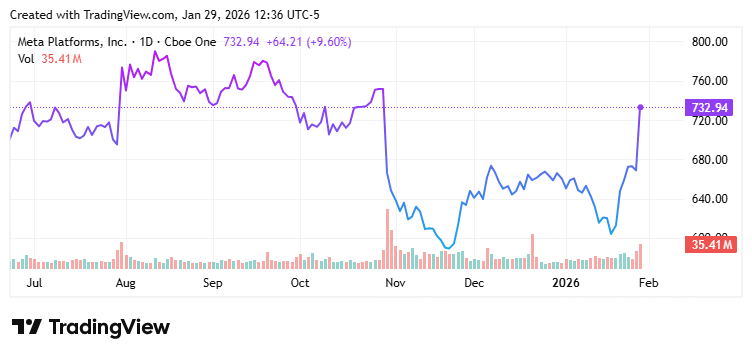
Overall, the market damage remained concentrated in technology and basic materials. Energy stocks advanced, and communication services outperformed, supported by strength in Meta Platforms (META). Meta shares jumped 7.6% following solid earnings beats and a well-received conference call, lifting the stock to gains of 9% year-to-date and 6.3% over the past 12 months. Meanwhile, consumer staples, utilities, industrials, financials, and real estate sectors all traded in positive territory.
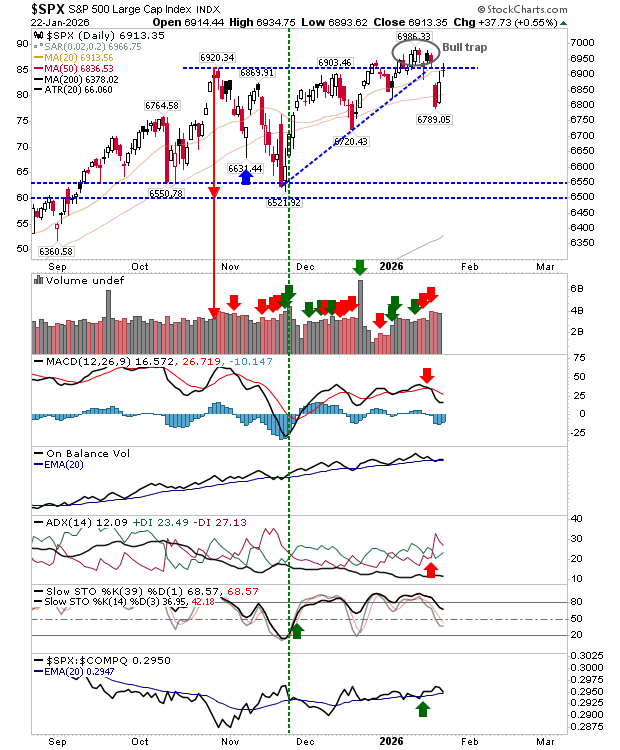
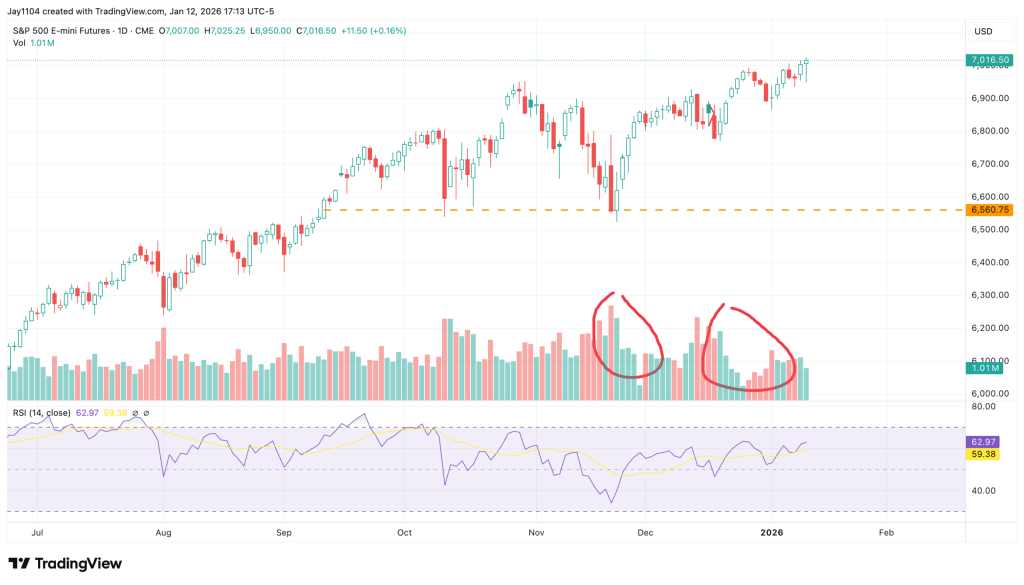
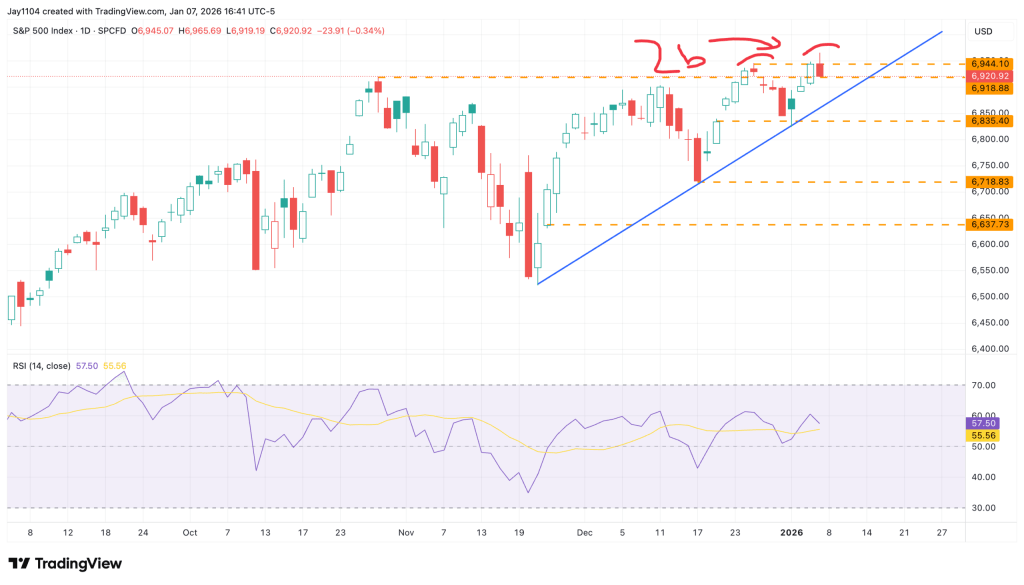
This selloff increasingly looks like a textbook buying opportunity, with early signs of a rebound already emerging across the major equity indexes. Another factor weighing on sentiment is the renewed risk of a government shutdown, which is especially challenging given the ongoing data blackout following last year’s record-length shutdown.
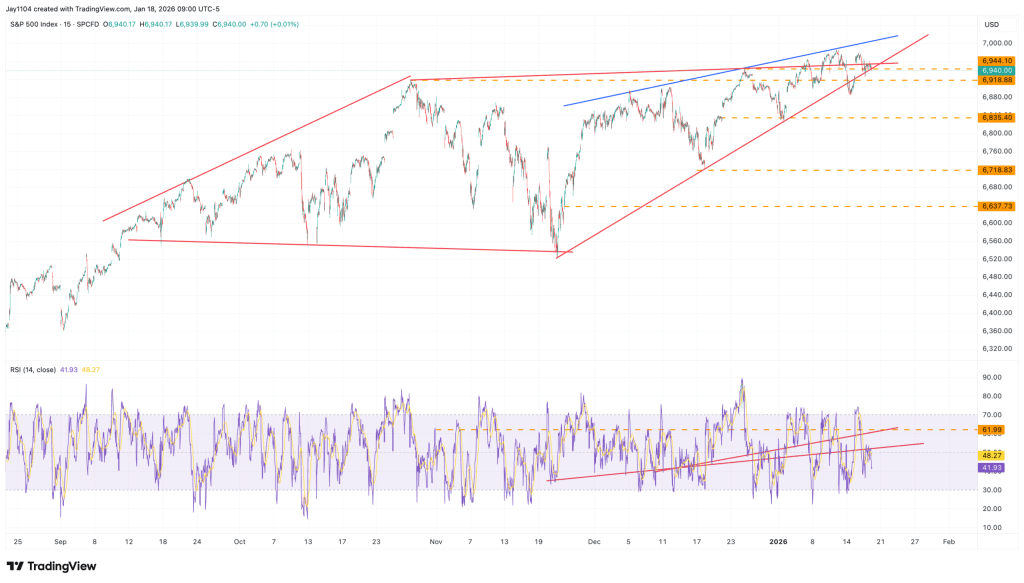
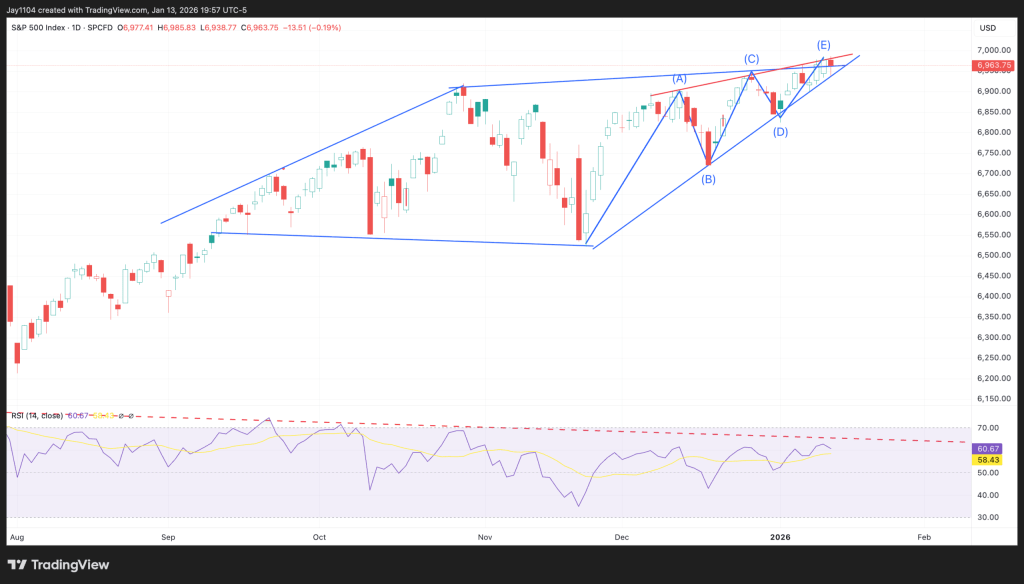
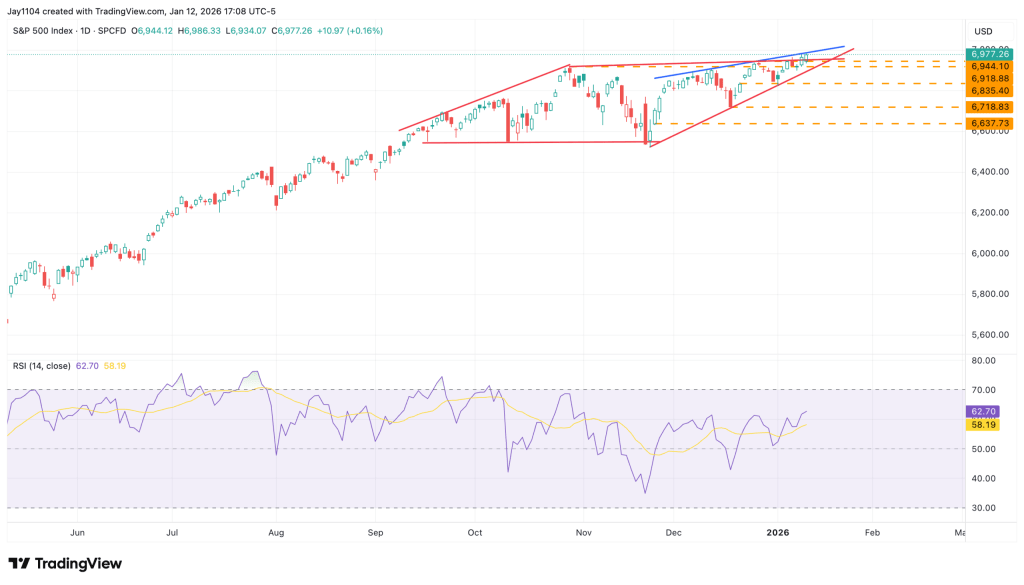
While the recent swing—from the S&P 500 touching 7,000 just yesterday to bottoming near 6,870 today—represents a level of volatility that has unsettled some investors, the fundamental backdrop of the economy remains solid. Volatility has clearly picked up, but the broader trend continues to point higher.
After spending months in the doldrums, Meta Platforms appears to have reshaped the narrative around its business. The Magnificent Seven stock slumped 11% in October following its third-quarter earnings release, as investors grew increasingly concerned about runaway spending on artificial intelligence.
That skepticism now looks to be fading after Meta’s fourth-quarter 2025 earnings report, released on Jan. 28. Shares climbed roughly 8% in after-hours trading by 7:00 p.m. ET, prompting investors to rethink the company’s outlook, with growth prospects increasingly overshadowing prior worries about spending.
Meta delivers strong earnings beat and upbeat guidance
In the fourth quarter, Meta reported revenue of $59.9 billion, representing growth of about 24% and comfortably exceeding expectations of $58.3 billion, or 21% growth. Adjusted earnings per share (EPS) came in at an impressive $8.88, up nearly 11% year over year and well above the consensus estimate of $8.16.
The standout highlight, however, was Meta’s guidance for the first quarter of fiscal 2026. At the midpoint, the company forecasts revenue of $55 billion, far surpassing analysts’ expectations of $51.3 billion.
This outlook implies quarterly revenue growth of roughly 30%, which would mark Meta’s fastest expansion rate since the third quarter of 2021. Such an acceleration is precisely what investors had been hoping for and offers further confirmation that the company’s investments in artificial intelligence are beginning to pay off.
Among Meta’s underlying performance metrics, growth in ad impressions delivered was particularly notable. The measure, which tracks the number of ads shown across Meta’s platforms, rose 18% during the quarter—its strongest pace in nearly two years. Chief Financial Officer Susan Li attributed this performance to robust user engagement and growth, highlighting that watch time on Instagram Reels increased 30% year over year, signaling a meaningful rise in platform engagement.
Stronger engagement is an encouraging signal for Meta, indicating that its AI-driven recommendation and ranking algorithms—responsible for determining what content users see and when—are becoming more effective. As these systems improve, users spend more time across Meta’s platforms, enabling the company to serve a greater volume of advertisements.
Markets shrug off higher-than-expected spending outlook
Expectations of sharply higher capital spending have been the key drag on Meta’s shares in recent months. Against that backdrop, the company’s latest CapEx guidance came in well above even elevated market expectations.
Meta now projects capital expenditures of $115 billion to $135 billion in 2026, compared with Wall Street estimates of roughly $110 billion. At the midpoint, this implies a 73% jump from 2025 CapEx of $72.2 billion.
In addition, Meta guided for total expenses of $162 billion to $169 billion in 2026, materially higher than consensus forecasts of around $150 billion.
Reading between the lines, however, reveals a crucial detail in Meta’s 2026 outlook. Management stated that “despite the meaningful step up in infrastructure investment, in 2026, we expect to deliver operating income that is above 2025 operating income.”
Since revenue equals operating income plus total expenses, this guidance allows for an implied revenue estimate. Meta generated $83.3 billion in operating income in 2025, and using the upper end of its 2026 expense guidance at $169 billion implies potential full-year revenue of roughly $252.3 billion.
That figure would represent about 25.5% growth from Meta’s 2025 revenue of $201 billion—well above the approximately 18.3% growth rate analysts had been projecting for 2026.
Growth eclipses spending concerns as Meta’s AI strategy gains traction
Although Meta’s expense guidance initially appeared to be the primary concern for investors, the company ultimately rose above those figures with exceptionally strong growth projections. While critics continue to argue that Meta has yet to produce a best-in-class general-purpose AI model, the company’s financial performance tells a compelling story.
Meta’s AI strategy is proving effective, driving faster growth in its core business of social media advertising. After a challenging stretch, Meta Platforms appears to have delivered precisely what was needed to restore investor confidence.
U.S. stock index futures slipped slightly on Thursday evening after Wall Street ended mostly lower, as weaker-than-expected results from Microsoft rekindled doubts over the returns on heavy AI spending, while investors absorbed a wave of other corporate earnings.
S&P 500 futures dipped 0.3% to 6,975.0 points, Nasdaq 100 futures declined 0.3% to 25,916.75 points, and Dow Jones futures also fell 0.3% to 49,049.0 points by 19:36 ET (00:36 GMT).
Wall Street dips as Microsoft’s slide weighs; Apple earnings take center stage
The S&P 500 and NASDAQ Composite closed Thursday’s regular session on a weak note, with technology stocks among the session’s biggest laggards.
Shares of Microsoft Corporation (NASDAQ:MSFT) plunged 10% after the company’s quarterly earnings highlighted slower cloud revenue growth and record AI-related spending, failing to reassure investors about near-term returns.
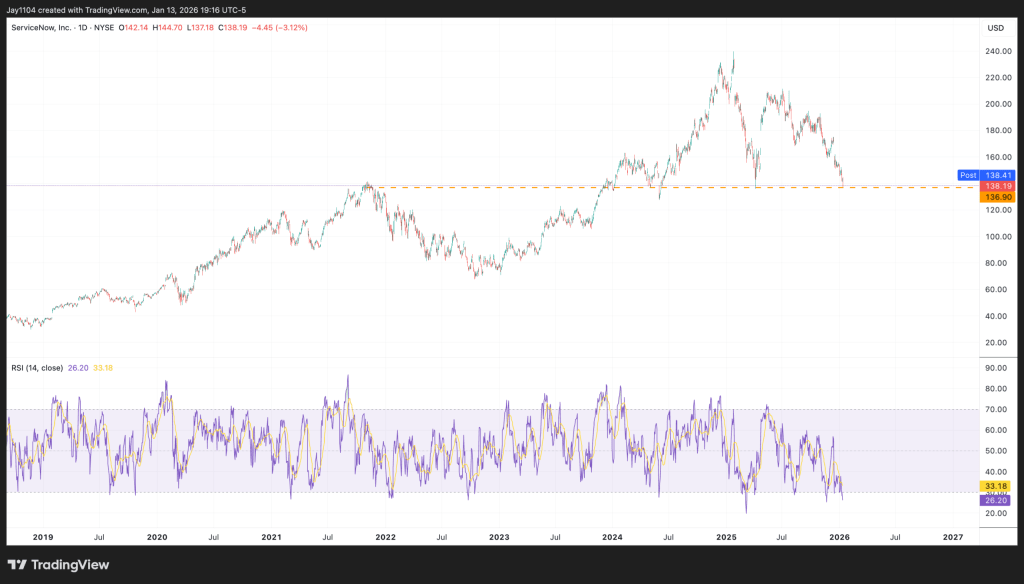
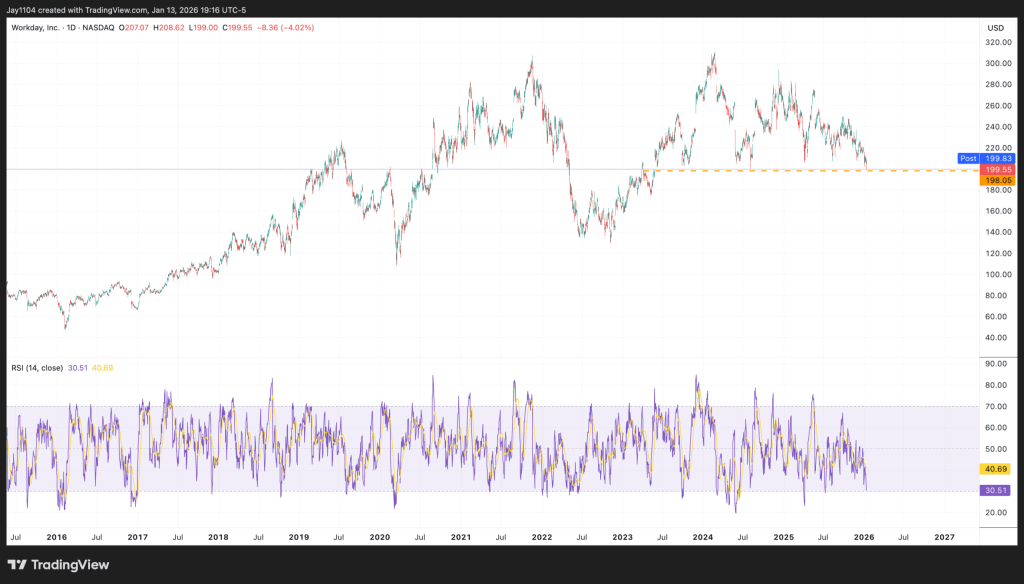
Microsoft’s selloff dragged down broader technology sentiment, with software peers including ServiceNow Inc (NYSE:NOW) and SAP (NYSE:SAP) also posting steep declines following disappointing earnings and outlooks.
Investors were also focused on Apple Inc.’s (NASDAQ:AAPL) earnings released after the close, which topped expectations as strong iPhone demand and a recovery in Greater China boosted both revenue and profit.
Apple reported roughly $143.8 billion in revenue and earnings per share well above consensus estimates, sending its shares up nearly 1% in after-hours trading.
SanDisk jumps on earnings beat; Trump backs spending agreement
Elsewhere on the earnings front, shares of SanDisk Corporation (NASDAQ:SNDK) jumped 16% in after-hours trading after the storage-chip maker posted a strong profit beat and lifted its outlook, driven by stronger-than-expected demand for data-center and AI-focused memory products.
By contrast, Visa (NYSE:V) shares edged lower despite surpassing first-quarter earnings and revenue forecasts, as investors focused on weaker-than-expected transaction volumes and ongoing caution surrounding broader consumer spending.
On the political side, President Donald Trump voiced support for a bipartisan spending agreement crafted by Senate Republicans and Democrats aimed at avoiding an imminent government shutdown, expressing his backing on Truth Social and calling for cooperation.
The deal would provide funding for most federal agencies while deferring divisive immigration issues for future negotiations.
The S&P 500 ended the session largely unchanged ahead of a largely uneventful Federal Reserve meeting, which offered little new information beyond reaffirming that the U.S. economy remains in fairly solid condition. The tone of Chair Jay Powell’s press conference also suggested that, at least while he remains at the helm, there are likely to be few—if any—interest-rate cuts in the near term.
Earnings released after the close were mixed. Microsoft (NASDAQ: MSFT) fell roughly 6.5%, while Meta Platforms (NASDAQ: META) surged about 7.5%. From an options standpoint, both stocks had bearish setups heading into earnings, with elevated implied volatility and heavy call-delta positioning at higher strike levels. Following the results, implied volatility declined, causing higher-strike calls to lose value and prompting the unwinding of hedges.
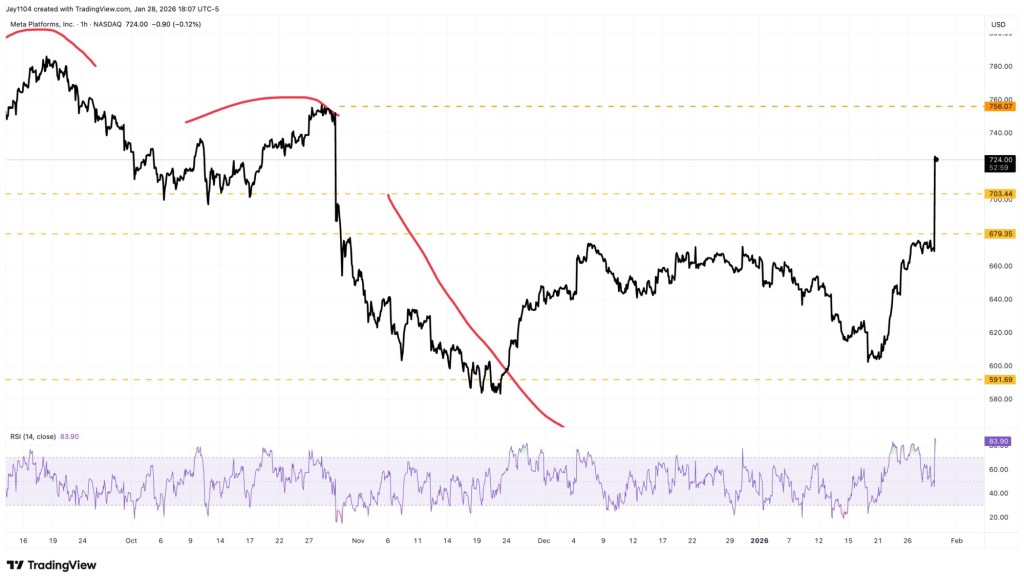
For Meta, the key technical level was $700, which the stock managed to break through, at least initially. Revenue guidance significantly exceeded expectations, leading the market to overlook higher-than-expected capital expenditures for now. The key question will be whether Meta can hold above the $700 level once regular trading resumes.
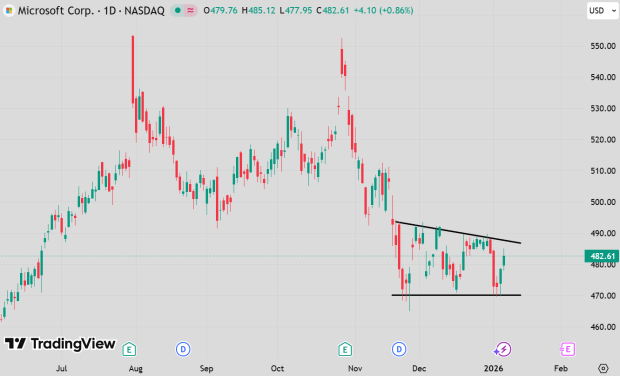
For Microsoft, the key level was $500, which the stock failed to break despite reporting better-than-expected results. Investor sentiment was weighed down by weaker-than-expected growth in its Azure cloud business.
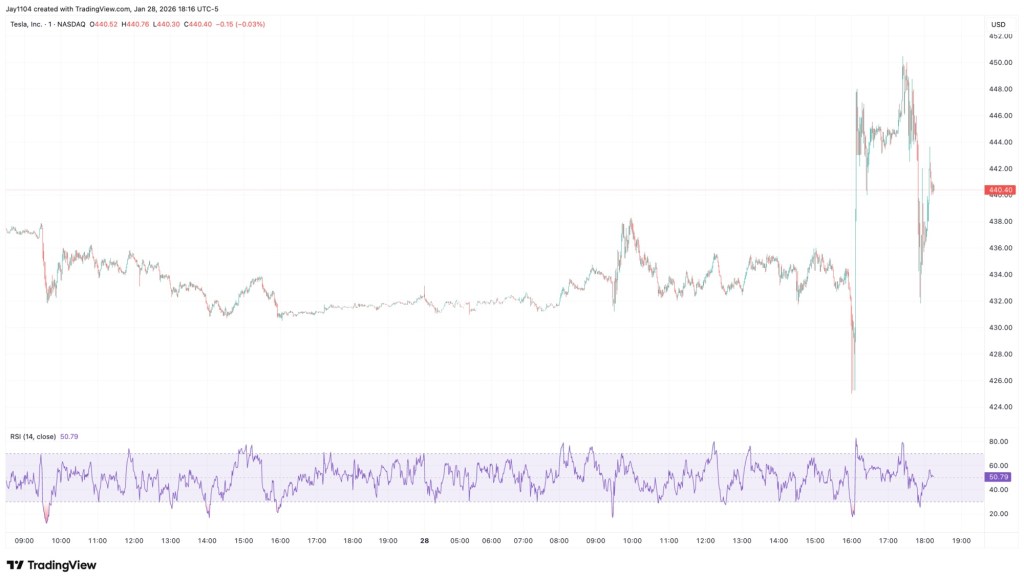
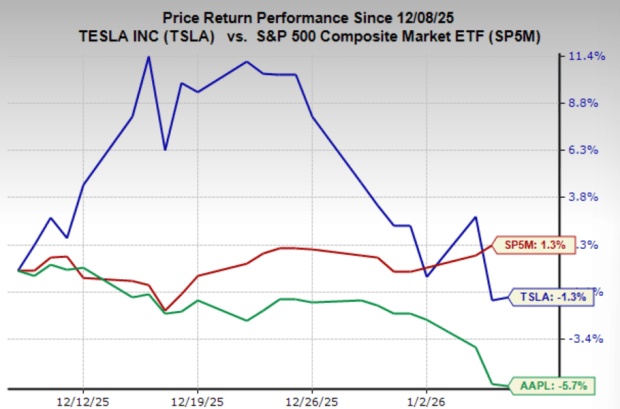
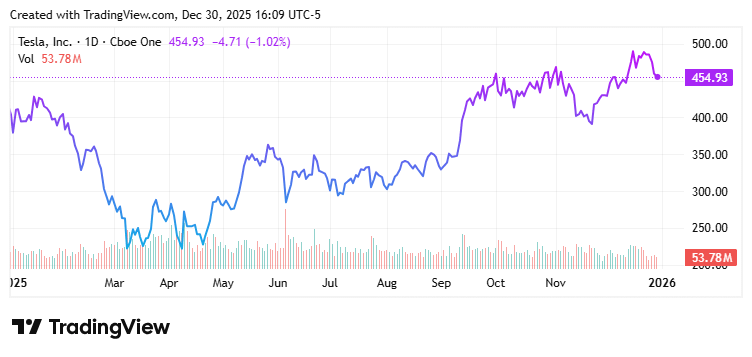
For Tesla (NASDAQ: TSLA), the setup ahead of earnings was more mixed, but $450 clearly stood out as the key level to break. So far, the stock has tested that threshold but has been unable to hold above it.
After-hours moves can be unpredictable, which is why it often makes sense to wait and see how price action develops during regular trading hours. How the CDS market trades tomorrow may be even more telling, potentially offering a clearer read on the true implications of the earnings reports.
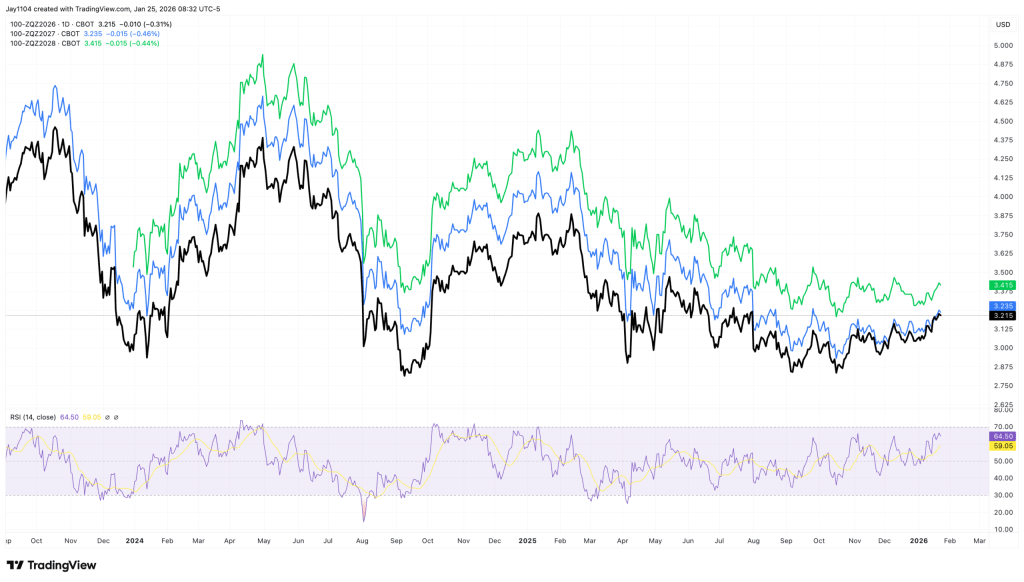
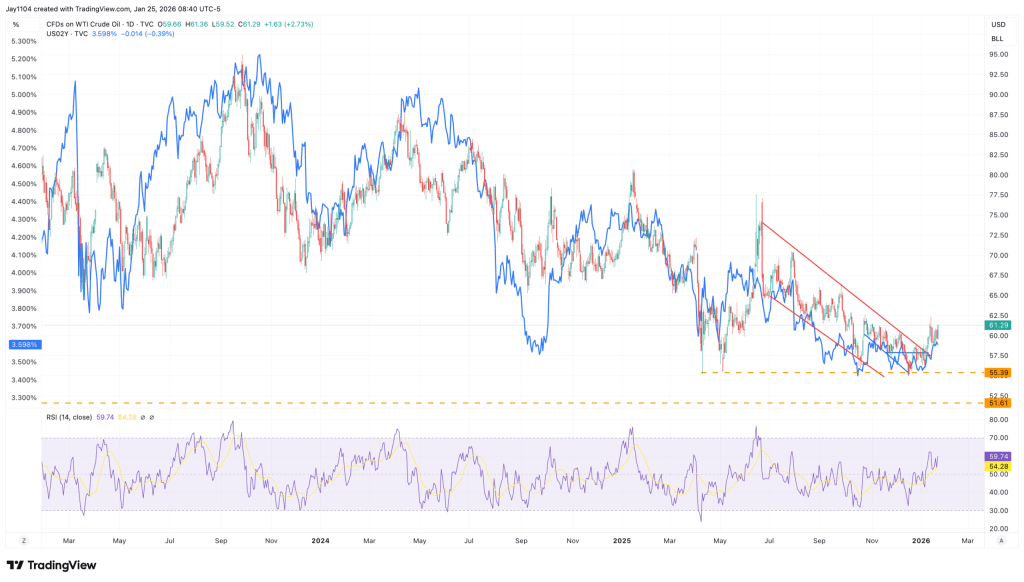
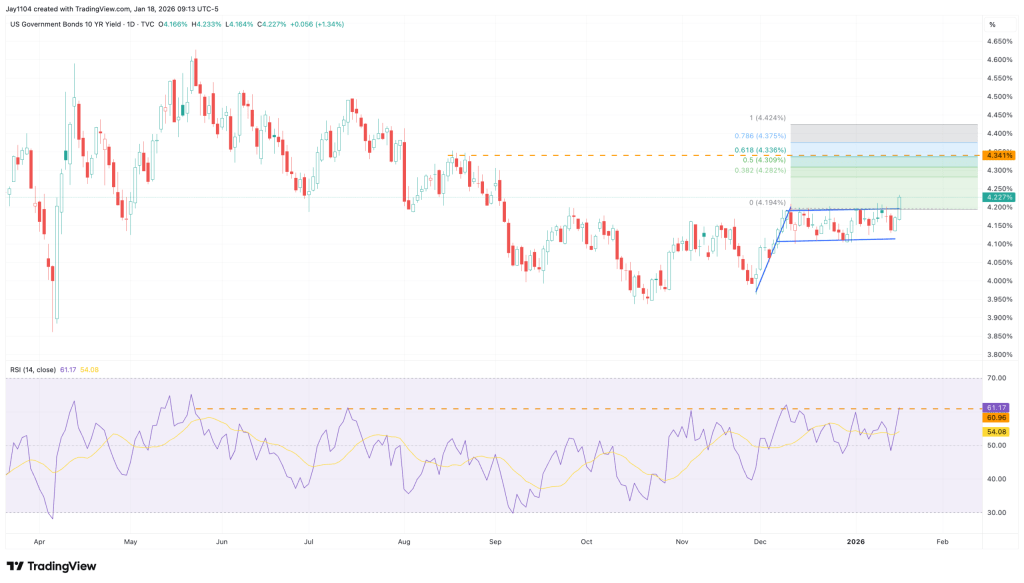
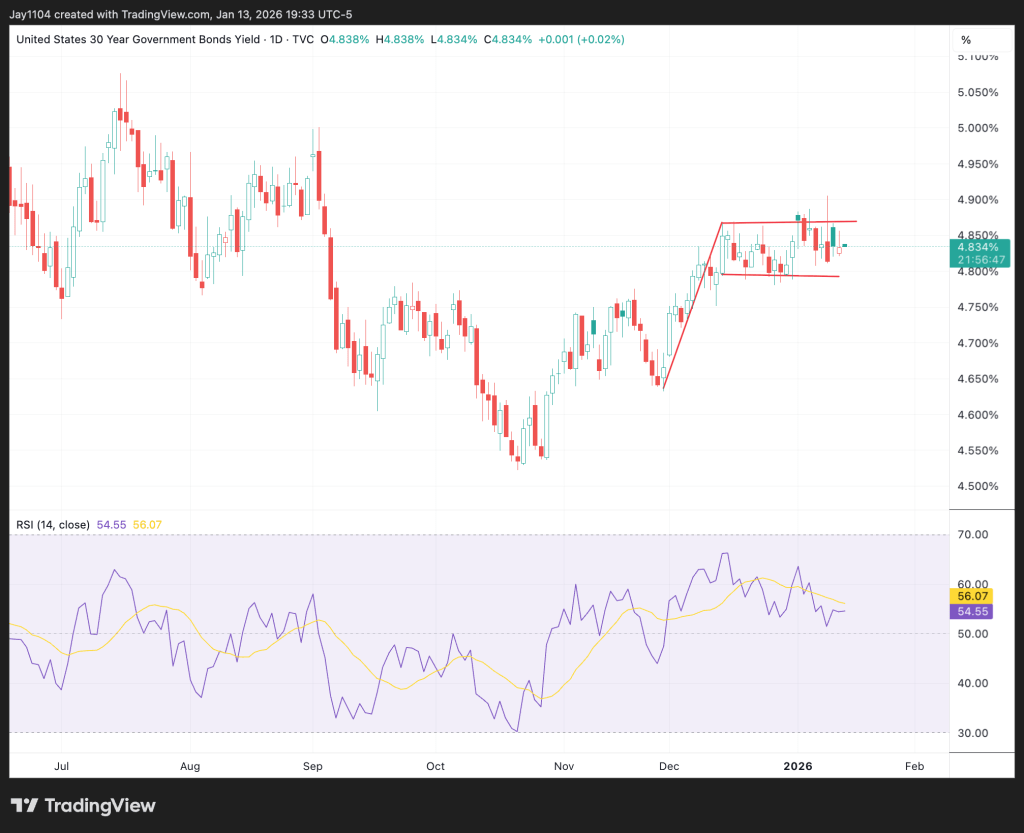
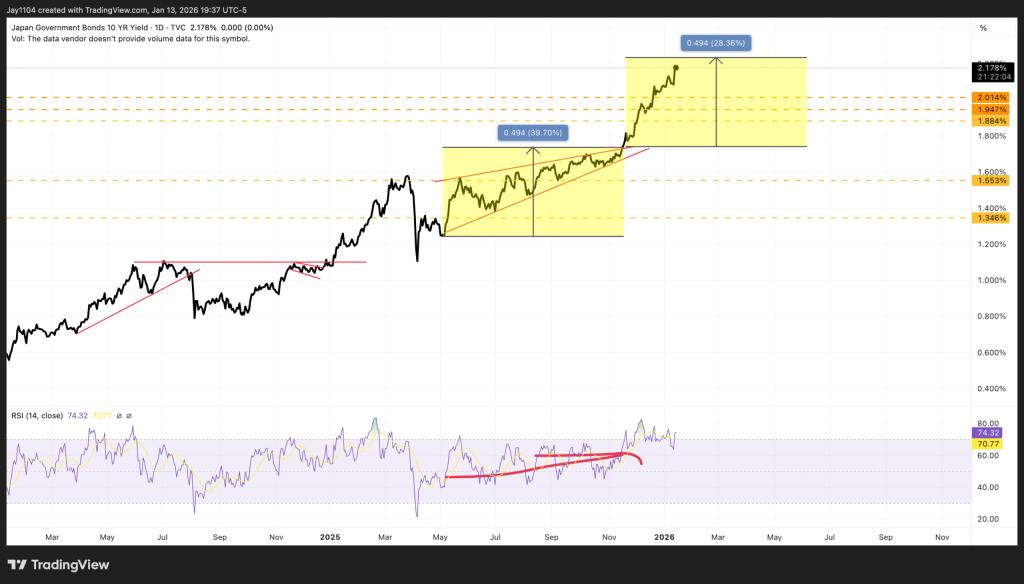
For now, near-term rate expectations appear more closely tied to oil than to any other factor. Crude has broken out and moved above its 200-day moving average, a technical development that could set the stage for a rally toward $65 in the near term.
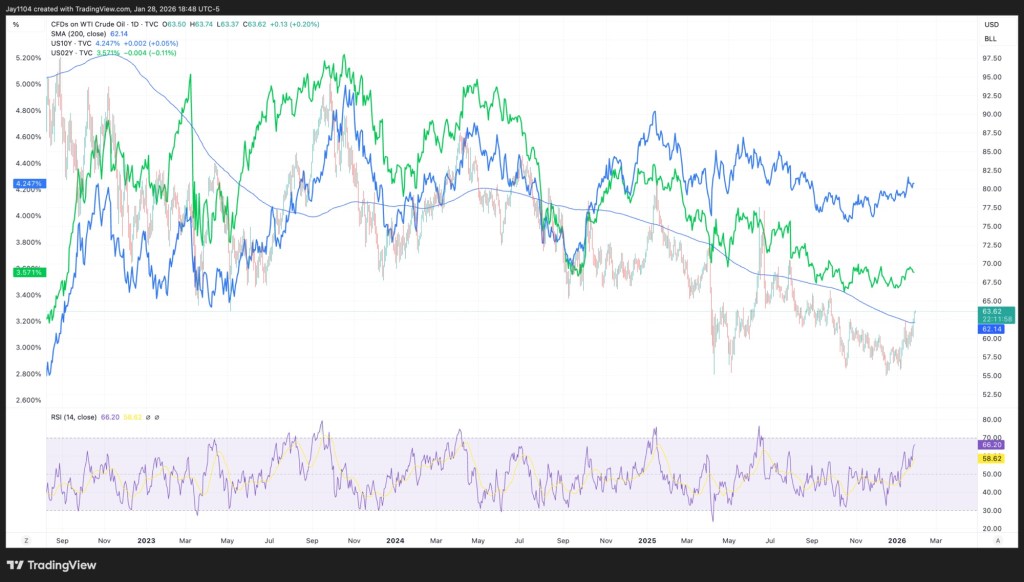
Whether looking at the 2-year or 10-year Treasury yield, the correlation with oil prices since late 2022 has been remarkably strong. As a result, if oil continues to move higher, it would likely put upward pressure on interest rates as well. In that sense, oil may have been the final missing link in the case for higher rates.
U.S. stock index futures were largely unchanged late Tuesday as investors remained cautious ahead of the Federal Reserve’s interest rate decision and a busy earnings schedule featuring major technology leaders.
S&P 500 futures edged up 0.1% to 7,017.50, while Nasdaq 100 futures rose 0.3% to 26,155.75 by 20:10 ET (00:10 GMT). Dow Jones futures were flat at 49,154.0.
S&P 500 closes at a record as Dow edges lower on Medicare concerns
During Tuesday’s regular session, the S&P 500 climbed 0.4% to a record closing high, extending its advance as investors rotated back into growth stocks and responded positively to broadly solid earnings results. Gains in technology shares led the move, pushing the benchmark to a fresh peak.
The Nasdaq Composite jumped 0.9%, driven by strength in megacap stocks.
Meanwhile, the Dow Jones Industrial Average fell 0.8%, weighed down by steep declines in healthcare and insurance shares. Major health insurers came under pressure after the U.S. government released a Medicare Advantage payment plan that the market perceived as less favorable than anticipated.
Markets focus on Fed decision and megacap earnings
Investor focus has shifted squarely to the Federal Reserve, which kicked off its two-day policy meeting on Tuesday. The central bank is widely expected to leave interest rates unchanged when it delivers its decision on Wednesday, with markets pricing in a pause as policymakers assess easing but still-elevated inflation alongside signs of steady economic growth and a resilient labor market.
Close attention will be paid to Fed Chair Jerome Powell’s remarks for indications on how long rates may remain at current levels and when eventual cuts could begin.
“The key will be any dissent and the Fed’s communication, particularly around questions of central bank independence,” ING analysts said, adding that the decision will also be overshadowed by President Trump’s upcoming nomination of a new Fed chair.
Corporate earnings are another major catalyst this week, with four members of the so-called “Magnificent Seven” technology group set to report. Tesla, Meta Platforms and Microsoft are scheduled to post results on Wednesday, followed by Apple on Thursday.
Given their heavy weighting in major equity indexes, guidance from these companies on artificial intelligence investment, cloud demand and consumer trends is expected to play a key role in shaping near-term market direction.
President Donald Trump once again surprised markets by announcing an increase in tariffs on South Korea to 25% from 15%, citing Seoul’s failure to implement a trade agreement reached last July. The move targets sectors such as autos, lumber, and pharmaceuticals, yet South Korean equities ended up surging 2% to fresh record highs. The KOSPI initially slid more than 1%, but the dip quickly attracted buyers seeking exposure to Asia’s strongest-performing equity market of 2025.
With South Korea’s industry minister set to travel to Washington, investors appear to be betting on a negotiated climbdown, reviving the popular “TACO” trade—Trump Always Chickens Out. Few are surprised that Seoul has been reluctant to commit massive U.S. investments while the risk of abrupt tariff threats remains a defining feature of the administration.
Tariff uncertainty also boosted demand for precious metals, pushing gold and silver back toward record levels. Gold rose 1% to $5,063 an ounce, while silver jumped 5% to $109 an ounce.
Asian equities were broadly firmer, supported by optimism that blockbuster earnings from the U.S. “Magnificent Seven,” beginning with Meta, Microsoft and Tesla later this week, will help sustain the global equity rally into 2026. MSCI’s Asia-Pacific index excluding Japan climbed 1% to a new high, while Japan’s Nikkei added 0.7%, even as the yen hovered near a two-month peak—normally a headwind for exporters.
European equities are poised for a firmer open, with EURO STOXX 50 futures up 0.3%. U.S. futures are also higher, as Nasdaq futures climb nearly 0.6% and S&P 500 futures rise 0.3%. The global economic calendar remains relatively quiet ahead of Wednesday’s Federal Reserve policy decision, at which interest rates are widely expected to be left unchanged. Nevertheless, the meeting is likely to be dominated by the Justice Department’s investigation into Fed Chair Jerome Powell, adding extra scrutiny to his post-meeting press conference. Any indication that Powell may choose to remain on the Fed’s board after his term ends in May—a move permitted under Fed rules—could provoke an unpredictable reaction from President Trump.
The year ahead offers a clear divide between bullish and bearish outcomes for investors. Will 2026 deliver another period of above-average returns, or mark a turning point toward disappointment? Optimists contend that the foundations for a sustained rally remain intact. A robust technology cycle, heavy corporate investment, and supportive policy settings all suggest further upside. Pessimists, however, warn that key growth drivers are losing momentum, market leadership has become uncomfortably narrow, and underlying economic stress is increasingly evident.
After a strong 2025, investors are entering a shifting market environment. Liquidity is still plentiful, but concerns over stretched valuations, labor-market pressure, and consumer resilience are mounting. Much hinges on how long optimism can outweigh economic realities, and whether expected gains from artificial intelligence and capital spending arrive quickly enough to counteract the drag from debt burdens, interest costs, and widening inequality.
Sentiment remains broadly constructive, though far from unanimous. Equity strategists are split, while bond markets reflect expectations of rate cuts alongside rising recession risk. Fiscal stimulus may postpone a downturn, but it also exacerbates longer-term imbalances. For investors, the central challenge is maintaining objectivity. Both the bullish and bearish narratives are credible, and timing will be decisive. In fact, 2026 could validate elements of both cases, making adaptability the most valuable strategy.
Below, we examine the bullish and bearish scenarios for 2026 in detail, assessing the macroeconomic and market forces behind each view. By translating these dynamics into practical portfolio considerations, investors can prepare for either outcome. Ultimately, success in 2026 will hinge less on forecasting accuracy and more on disciplined risk management.
The Bullish Case
The bullish thesis rests on several core pillars: a fresh surge in technology-led investment, accommodative fiscal policy, improving liquidity conditions, and the ongoing strength of both corporate balance sheets and consumer activity. Together, these forces have propelled markets higher, and proponents argue they will continue to support gains through 2026.
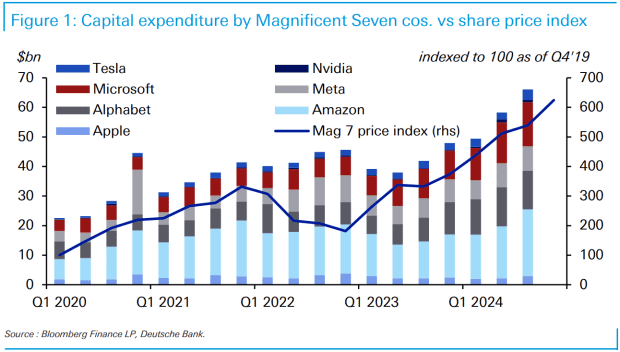
Central to the bull case is the rise of a potentially transformative technology cycle driven by artificial intelligence and large-scale infrastructure upgrades. Unlike earlier tech booms fueled primarily by optimism, this cycle is already translating into substantial capital spending. The so-called “Magnificent Seven” have collectively pledged over $600 billion toward data centers, semiconductor capacity, and AI-related services. This investment is rippling across software, energy, and industrial supply chains. Should the anticipated productivity improvements materialize, corporate earnings could accelerate, providing fundamental support for elevated valuations.
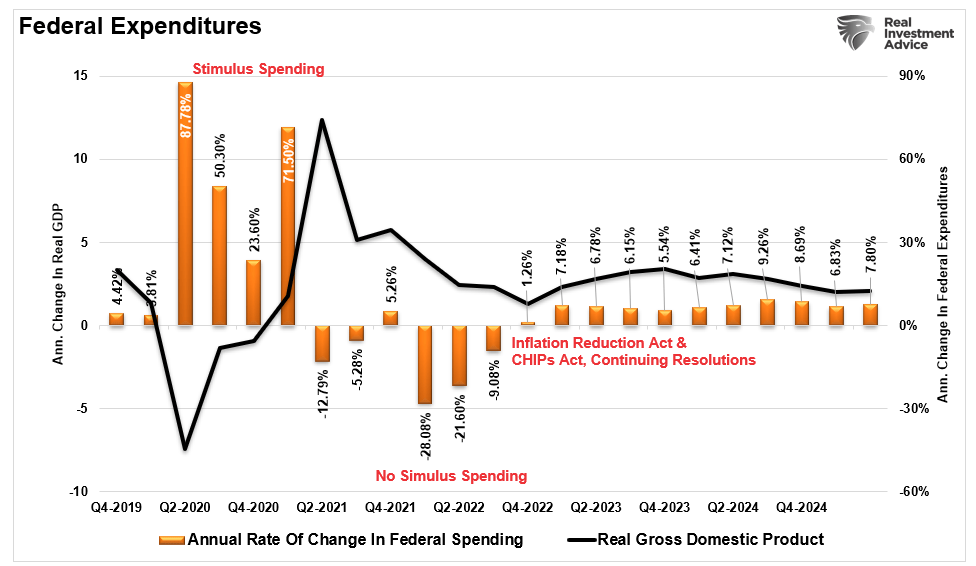
Fiscal policy is also positioned to support growth. Under a Trump-led administration, proposed tax cuts and direct transfers are expected to bolster both corporate activity and consumer spending. While $2,000 stimulus checks may not appear dramatic on their own, they can meaningfully lift short-term consumption and provide relief to small businesses. When paired with income tax reductions, these initiatives create a favorable backdrop for GDP growth and market sentiment. As recent history shows, following the 2022 market correction and widespread recession concerns, ongoing fiscal support has continued to play a stabilizing role in economic expansion.
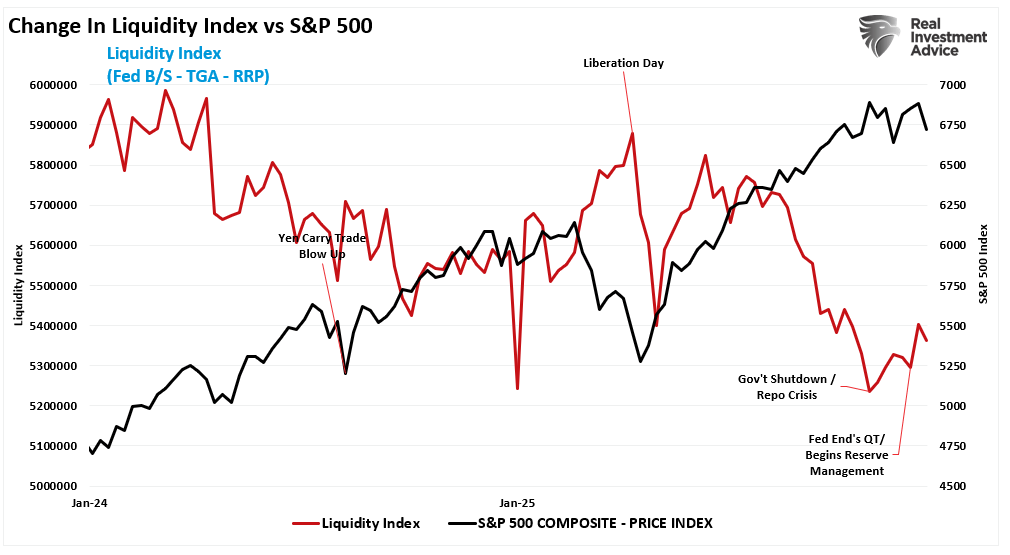
The monetary environment is also turning more supportive for bulls. Quantitative tightening concluded in December 2025, and the Federal Reserve has since shifted toward what many describe as “QE Lite,” combining rate cuts with monthly purchases of roughly $40 billion in short-term Treasuries. Officially framed as “reserve management,” the objective is to maintain ample liquidity within the financial system. As interest rates decline, credit conditions are likely to loosen, providing a favorable backdrop for risk assets. Rising liquidity has historically supported higher equity valuations, with technology and growth stocks typically benefiting the most from this dynamic.
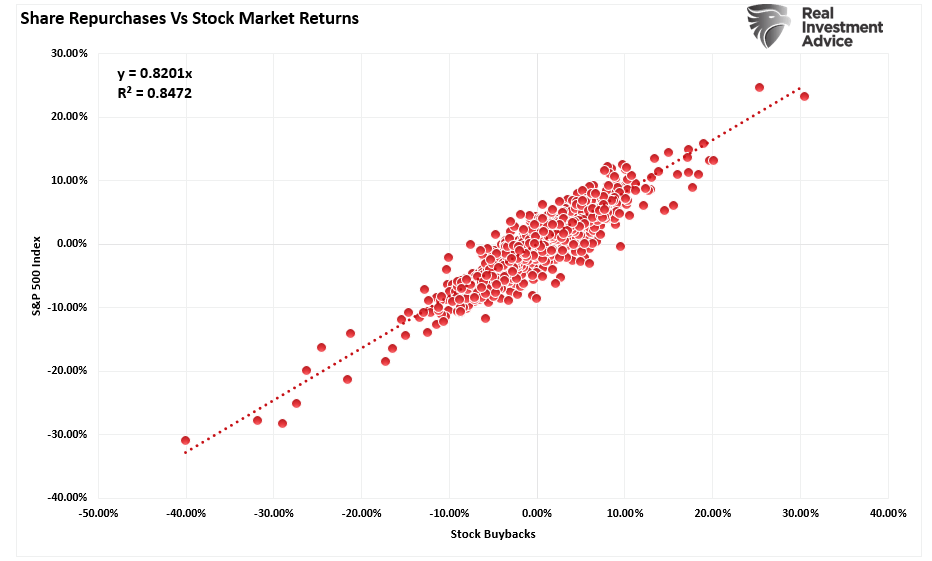
Corporate actions further reinforce the bullish narrative. Share buyback authorizations are projected to reach a new record of more than $1.2 trillion in 2026. Although often framed as a “capital return strategy”—a characterization that misses the point—buybacks have shown a strong correlation with equity market performance. Notably, since 2000, corporate repurchases have accounted for nearly all net equity demand, underscoring their outsized influence on stock prices.
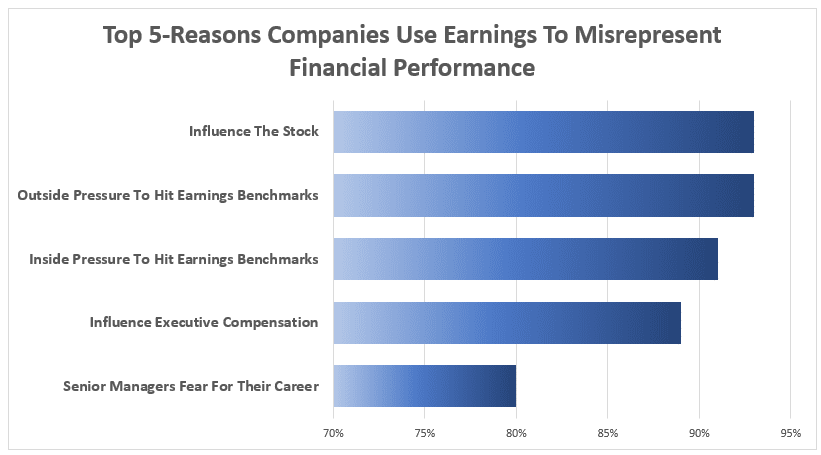
Importantly, the notion that buybacks signal management’s confidence in future earnings is misleading. In practice, repurchases are frequently used as a form of financial engineering to boost per-share results and beat Wall Street expectations. This dynamic is likely to intensify in 2026, further supporting reported earnings growth and reinforcing the bullish case.
Finally, deregulation tied to the so-called “Big Beautiful Bill” is expected to relax capital requirements for banks, enabling them to hold a greater amount of collateral. While this should support the Treasury market, it also expands overall lending capacity. Much of that capacity is likely to flow into leverage for hedge funds and Wall Street trading desks, as looser regulatory constraints encourage greater risk-taking.
The bullish thesis ultimately rests on a reinforcing feedback loop: innovation spurs capital investment, rising investment lifts earnings, policy measures inject liquidity, and investors respond by increasing risk exposure. As long as each link in this chain remains intact, the upward trend can persist.
The Bearish Case
The bearish case starts with a key observation: many of the forces that powered the 2025 rally are now fading or already fully reflected in prices. Elevated valuations, softening economic data, and rising speculative excesses suggest that current market momentum may be masking deeper structural vulnerabilities. With that in mind, it is worth examining several of these risks more closely.
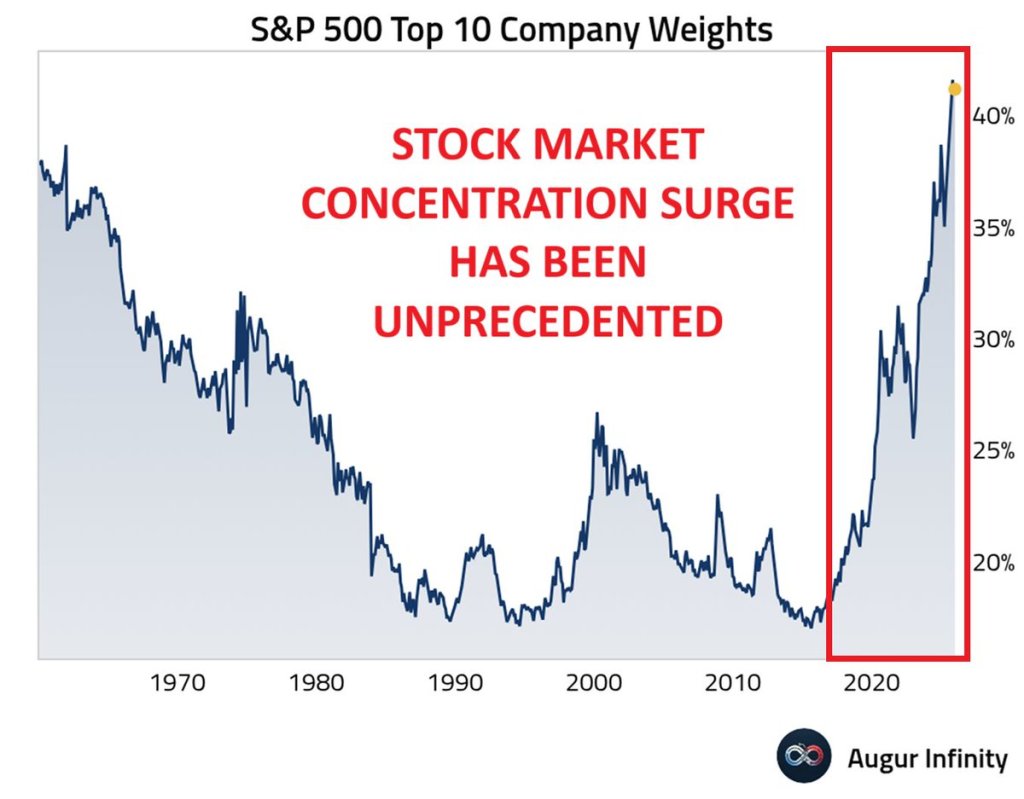
One of the most visible concerns is market concentration. In 2025, the bulk of equity gains came from just 10 companies on a market-capitalization-weighted basis, a dynamic amplified by the continued shift into passive ETF investing.
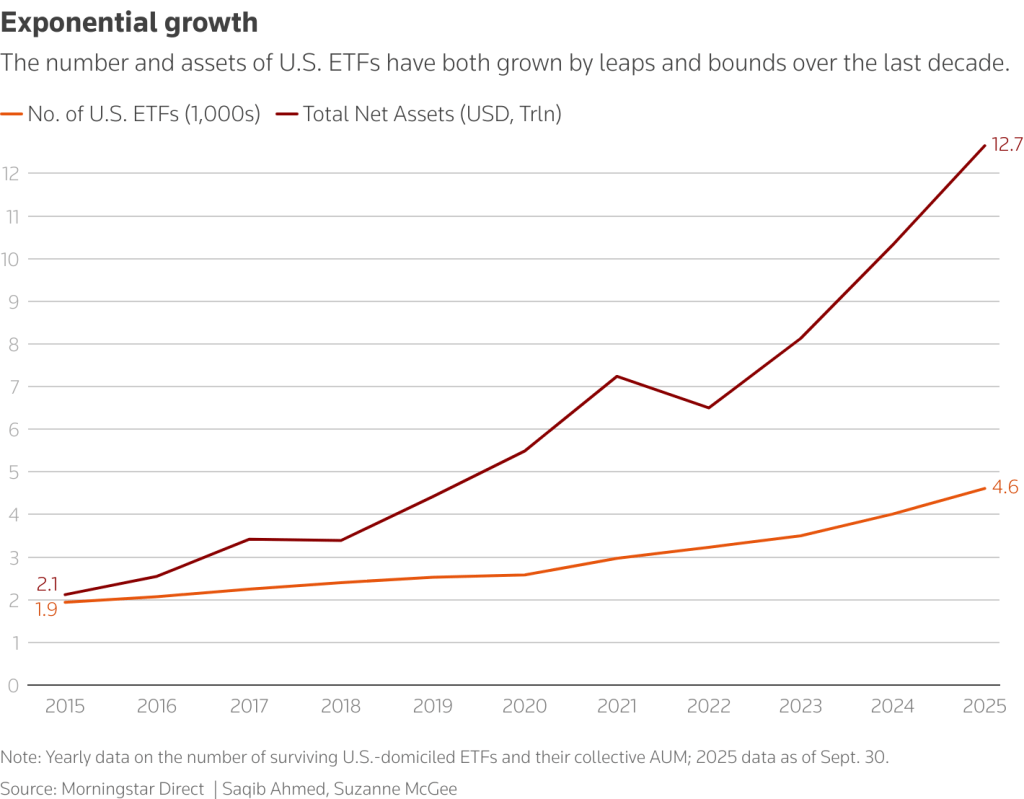
Passive investing has evolved from a niche approach into the dominant force shaping equity markets. Index funds and ETFs now represent more than half of U.S. equity ownership. Because these vehicles allocate capital according to market capitalization rather than valuation, fundamentals, or business quality, the largest companies attract a disproportionate share of inflows. This has created a powerful feedback loop in which rising prices draw in more capital, and those inflows, in turn, push prices even higher.
This narrow leadership is inherently fragile. Should investor flows into ETFs reverse, a disproportionate share of selling—roughly 40%—would be concentrated in the same 10 stocks. History shows that when market performance depends on a small handful of names, volatility tends to increase and drawdowns can be sharp.
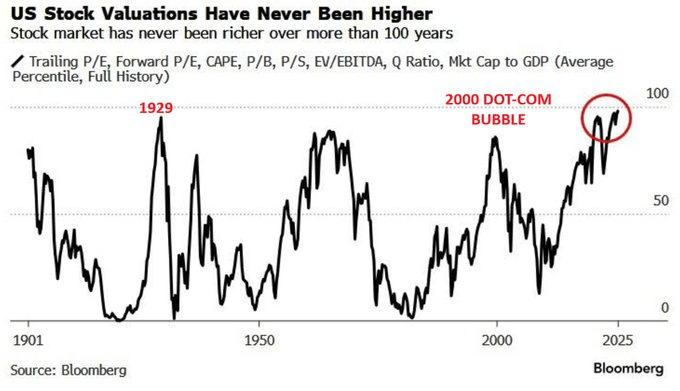
Valuations present another clear risk. Price-to-earnings multiples on the S&P 500 remain near cycle peaks, leaving little room for error. Growth assumptions are ambitious, and even modest earnings disappointments could trigger a meaningful repricing. While enthusiasm around AI has driven a surge in investment, much of this spending is circular—companies are investing in AI largely to produce and sell AI-related products. That dynamic may prove self-limiting over time, particularly if end demand weakens or costs begin to outstrip returns.
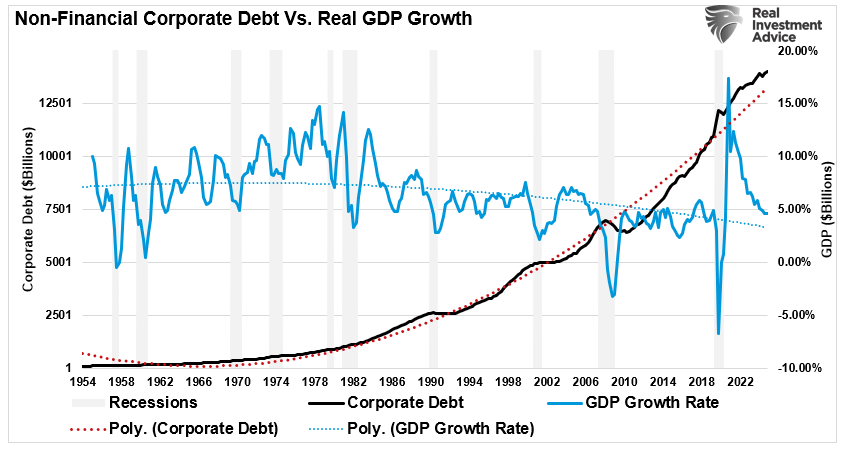
A significant portion of the current investment cycle is also being financed with debt, as companies borrow to fund capital spending, repurchase shares, and sustain dividend payouts. If interest rates remain high or credit conditions deteriorate, rising debt-servicing costs could quickly erode earnings gains.
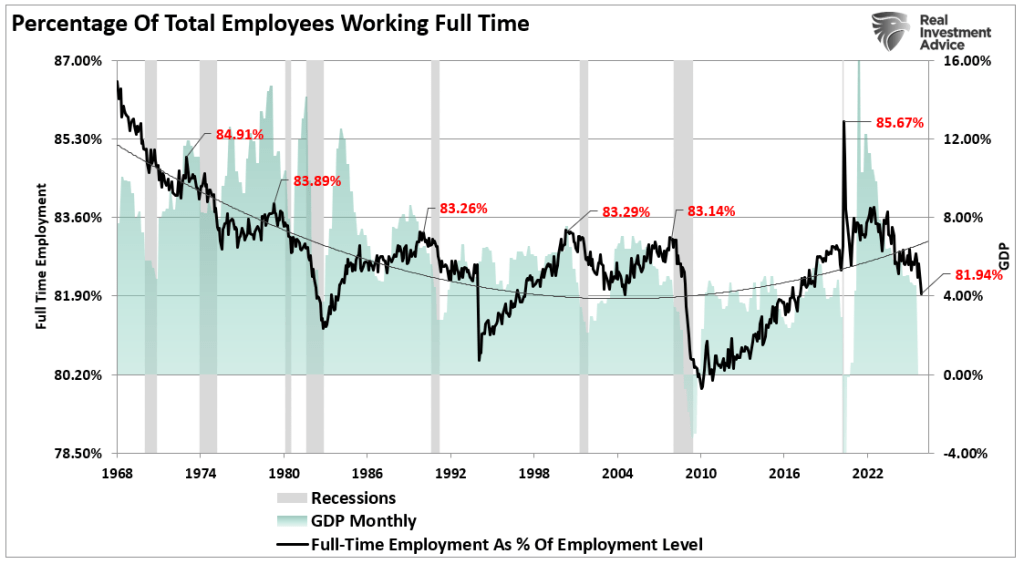
The broader economic risk is that the reallocation of capital toward technology and automation could sideline large segments of the workforce. While the buildout of data centers may employ thousands during construction, only a fraction of those jobs—perhaps a few hundred—remain once operations begin. Over time, this dynamic could weigh on employment growth, increase the risk of demand destruction, and may already be showing early warning signs.
This dynamic underpins the concept of a “K-shaped economy.” While high-income households and asset owners continue to prosper, lower-income consumers are facing increasing strain. Consumption patterns are diverging as financially pressured households cut back, leaving the top 20% of earners responsible for nearly half of total consumer spending. Signs of stress are already emerging, with rising auto loan and credit card delinquencies, stagnant real wages for many workers, and persistently high costs for housing and essential goods.
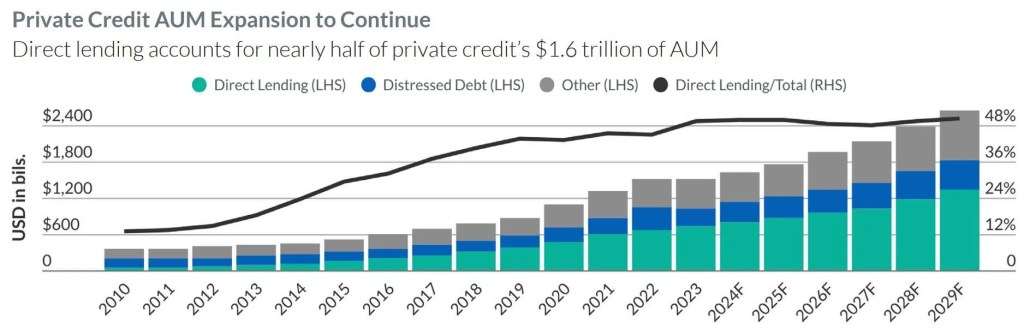
At the same time, risks within the credit system—particularly in private markets—are growing. Private credit has expanded rapidly in recent years, yet limited transparency makes it difficult to fully assess systemic vulnerabilities. Regulators have begun to pay closer attention, and default rates in middle-market lending are climbing. Should these stresses intensify, the fallout could extend across banks, hedge funds, and pension portfolios.
The bearish argument is not one of an imminent crash, but of growing fragility. Beneath the headline gains, the market appears increasingly exposed to earnings disappointments, tighter credit conditions, and weakening consumer demand.
The key takeaway is that 2026 may validate elements of both the bullish and bearish narratives. Preparation, rather than prediction, will be essential.
Navigating Whatever Comes Our Way
Investors should treat 2026 as a year in which both the bullish and bearish narratives may ultimately be validated. In the first half, bullish momentum is likely to persist, supported by strong sentiment, ample liquidity, and continued growth in corporate investment. Optimism around AI, fiscal support, and a potential pause in monetary tightening could propel equity indexes higher.
By the second half, however, underlying vulnerabilities may begin to surface. Elevated valuations increase sensitivity to earnings disappointments, while widening economic inequality could weigh on the outlook for consumer demand and corporate revenues. Should these pressures intensify, market sentiment could shift rapidly.
Navigating such a divided year will require a tactical approach—participating in early upside while avoiding excessive exposure to risks that may materialize later in the year.
Early 2026: Participate in Momentum, but Manage Exposure
Overweight sectors poised to benefit from capital spending and ample liquidity, including technology, industrials, and energy.
Prioritize high-quality growth companies with durable earnings and strong cash-flow generation, rather than momentum-driven narratives.
Implement trailing stop-loss strategies to protect gains if market sentiment shifts.
Use periods of volatility to add selectively, while scaling back position sizes as valuations become more stretched.
Avoid excessive concentration in AI-related stocks, even during strong rallies, as crowding increases dispersion and downside risk.
Mid-to-Late 2026: Emphasize Defense and Cash-Flow Stability
Gradually rotate toward defensive, value-oriented sectors such as healthcare, consumer staples, and utilities.
Increase exposure to dividend-paying companies with strong balance sheets and resilient cash flows.
Raise cash allocations or shift into short-duration Treasuries to preserve flexibility.
Allocate selectively to high-quality credit while reducing exposure to private credit and high-yield debt.
Monitor consumer credit conditions, labor-market trends, and bank earnings for early signs of financial stress.
Throughout the Year: Maintain Discipline and Objectivity
Adhere to valuation discipline regardless of shifts in market narratives.
Keep portfolios well diversified to withstand both volatility and sector rotation.
Let data—not headlines—drive allocation decisions.
Rebalance regularly, particularly if strong first-half performance leads to excessive concentration in certain sectors.
In 2026, tactical flexibility, risk awareness, and discipline are likely to matter more than adopting a purely bullish or bearish stance. It is a year in which both camps could be partially wrong. Markets rarely move in straight lines, but a sound investment process should remain consistent throughout.
The year ahead is likely to test investors with heightened volatility, as both the bullish and bearish arguments carry real weight. A new technology cycle may generate genuine economic momentum, yet it also introduces risks tied to elevated valuations, debt-fueled growth, and widening inequality. With markets effectively pricing in near-perfection, history suggests outcomes often fall short of expectations.
Whether 2026 delivers further gains or a sharp correction, performance will hinge on effective risk management. Avoid anchoring to any single narrative. Let data guide decisions, respect your signals, and remain willing to adjust as conditions evolve.
Ultimately, the objective is not to chase short-term returns, but to endure—and compound—across full market cycles.
U.S. stock index futures showed minimal movement on Monday night, with Dow futures edging lower after a policy proposal from the Trump administration, as investors stayed cautious ahead of an important Federal Reserve decision and major tech earnings.
S&P 500 futures hovered near flat at 9,982.0, while Nasdaq 100 futures rose 0.2% to 25,898.2 by 19:54 ET (00:54 GMT). Meanwhile, Dow Jones futures slipped 0.3% to 49,409.0.
Wall Street ended higher, with the Dow up 0.6%, the S&P 500 gaining 0.5%, and the Nasdaq rising 0.4%.
The Trump administration proposed flat-rate payments for Medicare Advantage.
Dow futures edged lower after major health insurers slumped in late trading, following a Trump administration proposal to keep Medicare Advantage payment rates nearly flat, below market expectations. Shares of UnitedHealth, Humana, and CVS fell sharply on concerns that weaker reimbursement growth would squeeze margins amid rising medical costs. Separately, President Trump announced a hike in tariffs on South Korean imports to 25%, citing Seoul’s failure to ratify a trade deal.
Investors await the Fed decision and key megacap earnings.
Markets are in wait-and-see mode ahead of the Fed meeting, with rates expected to stay unchanged and focus on signals about future cuts. Attention is also on earnings from the “Magnificent Seven,” with results from Microsoft, Meta, Tesla, and Apple likely to shape sentiment, especially around AI investment, demand trends, and margins.
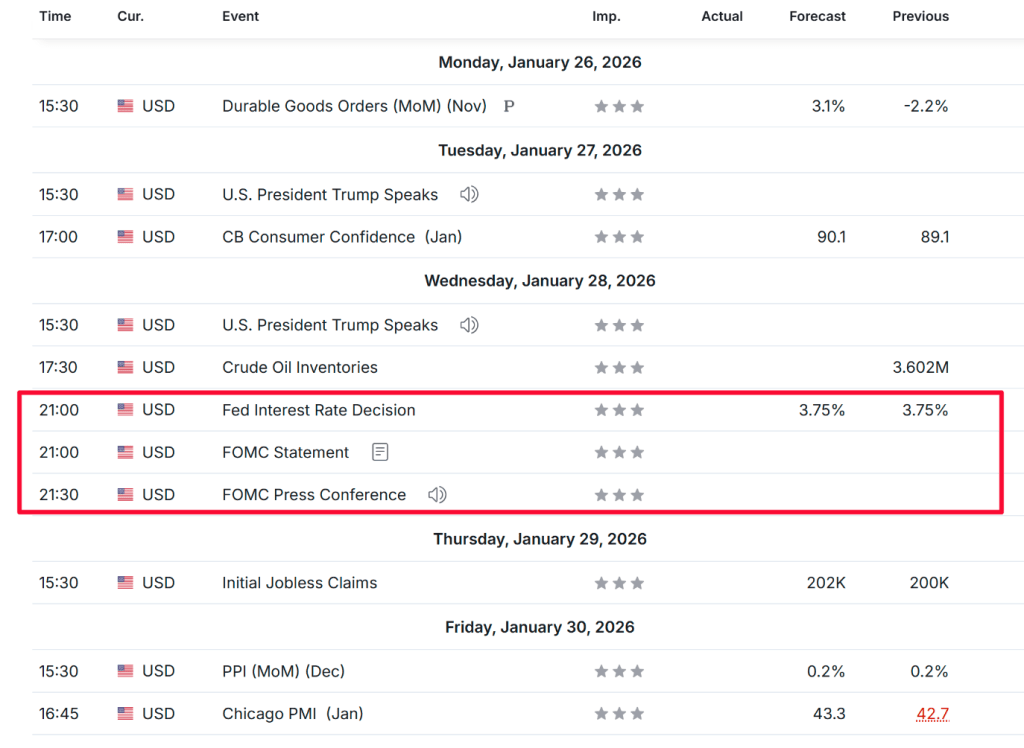
Wednesday brings the FOMC meeting and Chair Powell’s press conference, and it wouldn’t be surprising if President Trump chose that moment—ideally around 2:30 p.m. ET—to announce his pick for the next Fed chair. Such timing would dominate headlines, catch financial media off guard, and inject maximum uncertainty into markets.
That said, the Fed is not expected to cut rates at this meeting, which should keep the event relatively uneventful. In the bigger picture, what the Fed does between now and May may prove less important, particularly if a new chair is appointed and moves quickly toward easing.
Markets appear to be dialing back expectations for aggressive rate cuts. Current pricing suggests the fed funds rate settles near 3.25% by December, with little additional easing beyond that. To meaningfully shift those expectations, the nominee would likely need to be notably dovish—something markets already anticipate, given the widespread assumption that Trump will select a policy-leaning accommodator.
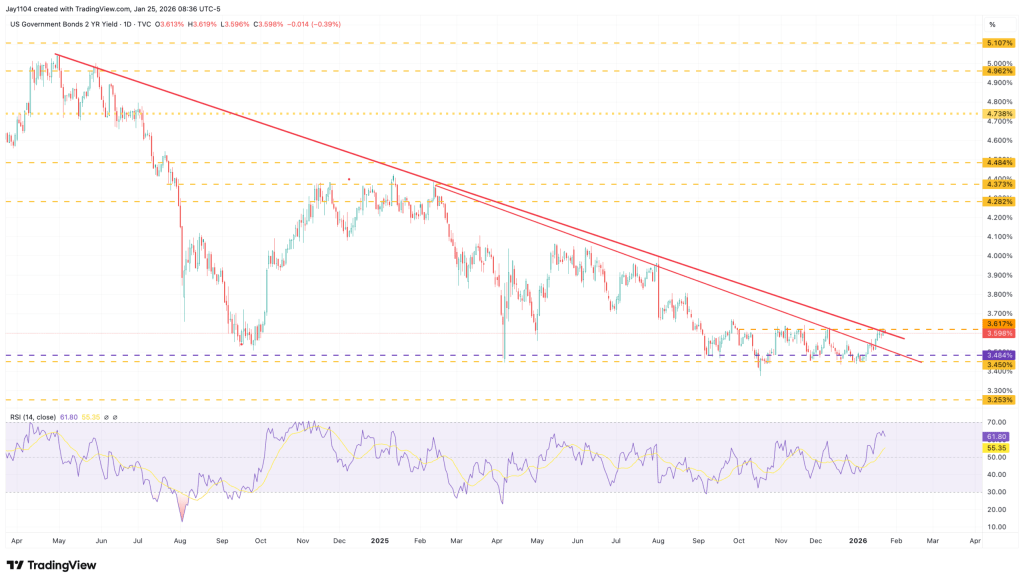
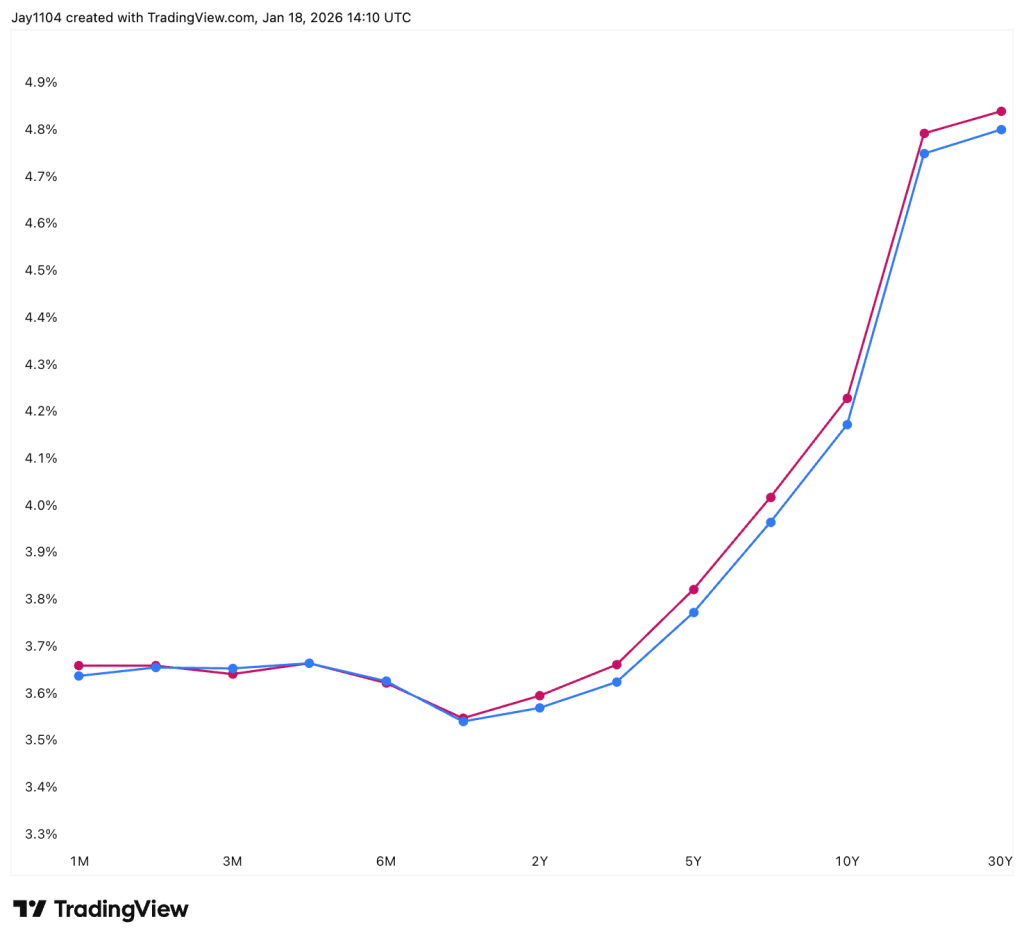
As a result, the risk of a breakout in the 2-year Treasury yield appears increasingly credible, with initial resistance near 3.62%. Beyond that, a move back toward the 4% level cannot be ruled out. From a technical perspective, the setup supports this view: the 2-year yield has formed multiple bottoms in recent months, and the RSI has begun to turn higher, signaling building upside momentum.
The direction of the 2-year yield may ultimately be more closely linked to oil prices. With inflation still hovering near 3% and crude having fallen to around $60 from highs in the $120s, the message is clear: a rebound in oil prices could quickly reignite inflation pressures. That dynamic likely explains why the price action in oil and the 2-year yield charts has begun to look strikingly similar.
The Bank of Japan once again chose to kick the can down the road, leaving rates unchanged and, in my view, offering little in the way of a clear policy roadmap. The yen’s strength on Friday appeared to be driven solely by reports of a possible “rate check” by the New York Fed on behalf of the U.S. Treasury—widely interpreted as a warning signal that currency intervention could be imminent. Perhaps the strategy is to keep markets stable until after the snap election in February. It’s hard to say, but it should be telling to see how markets react once Japan reopens on Monday.
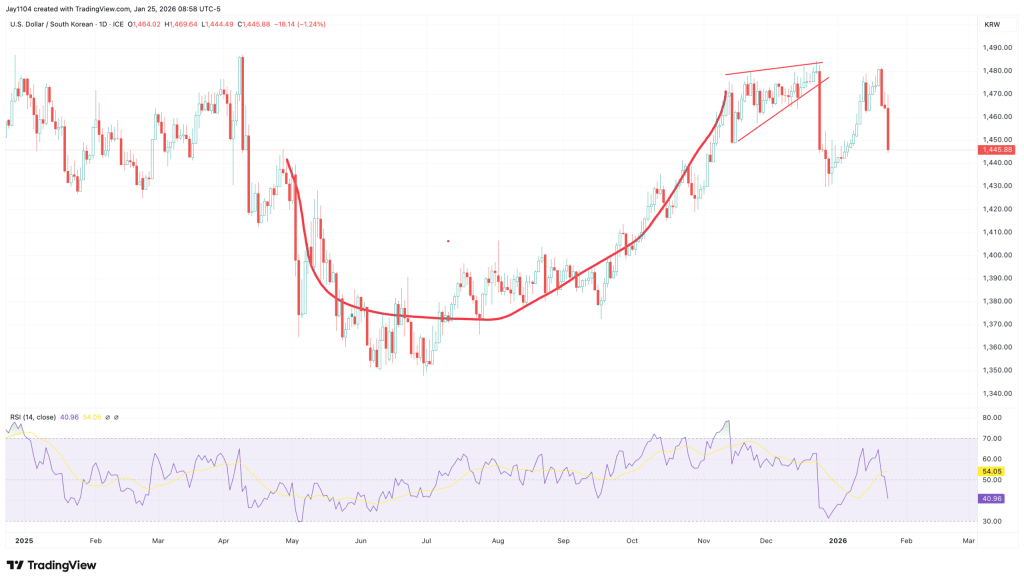
The Korean won also strengthened notably against the U.S. dollar on Friday. In recent weeks, there has been growing chatter that the KRW had become excessively weak, so it’s likely the currency took the developments around the yen as a warning signal and moved to reprice accordingly.
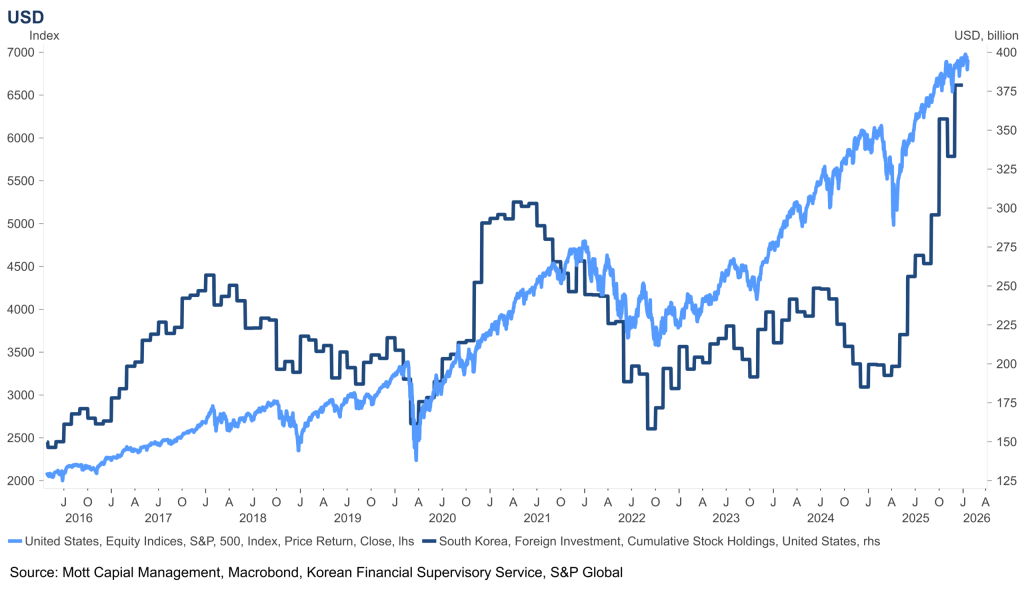
The Korean won likely matters more than many investors realize, given the sizable exposure South Korean investors have built up in U.S. equities. That dynamic is probably one of the reasons the KRW has weakened so significantly in the first place—buying U.S. stocks requires selling won for dollars.
If the KRW begins to strengthen from here, it could start to put pressure on that trade. For investors who are unhedged on the currency side, a stronger won increases the risk of FX-related losses on their U.S. equity holdings, potentially prompting position adjustments.
Of course, this week also brings major earnings reports from Microsoft, Apple, Tesla, and Meta. From what I can see, all four stocks are currently sitting in positive gamma with positive delta positioning. Implied volatility typically builds into earnings because of the event risk, which sets up a familiar dynamic: unless a company delivers truly blowout results, the reaction can easily turn into a sell-the-news move. Once earnings are released, implied volatility collapses and hedges are unwound as delta decays, potentially putting pressure on the shares.
This week’s spotlight will be on the Fed’s FOMC meeting, Chair Powell’s press conference, major Big Tech earnings, and the looming U.S. government shutdown deadline. Apple is set to report earnings after Thursday’s close, with expectations rising for a beat-and-raise quarter. Meanwhile, Starbucks looks like a sell, as profit growth continues to slow and a weaker outlook is anticipated.
The stock market finished Friday on a mixed note, as both the S&P 500 and Nasdaq Composite recorded their second consecutive weekly declines.
The Dow Jones Industrial Average slipped 0.5% for the week, while the S&P 500 edged down about 0.4%. The tech-heavy Nasdaq fell by less than 0.1%, and the small-cap Russell 2000 lost 0.3%.
Looking ahead, the coming week is set to be a blockbuster, packed with potential market catalysts. Investors will be watching a crucial Federal Reserve policy meeting alongside a wave of earnings from major technology companies.
The Fed is widely expected to hold interest rates steady on Wednesday, though markets could see volatility as Chair Jerome Powell addresses the media in his post-meeting press conference.
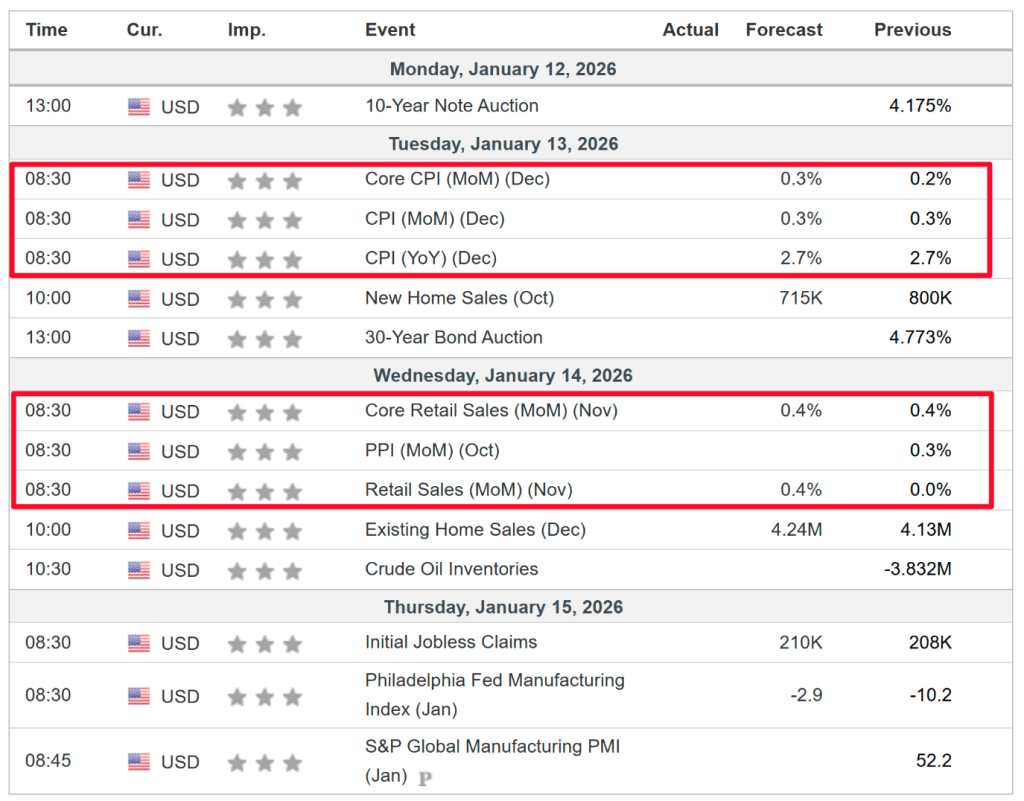
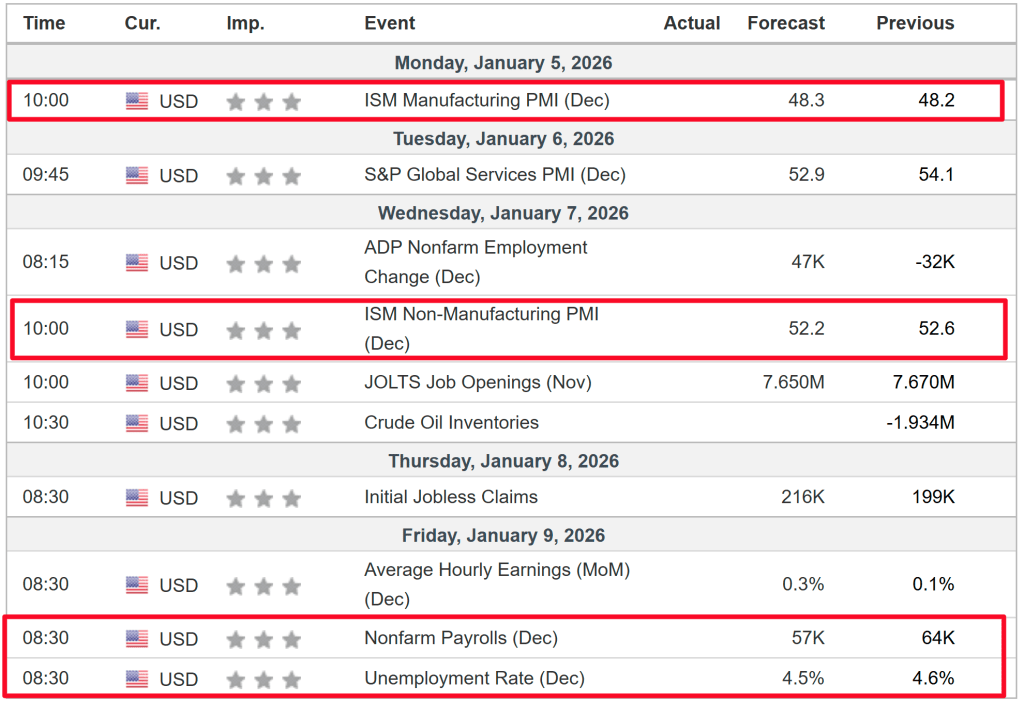
Other key economic releases on the calendar include durable goods orders on Monday and The Conference Board’s Consumer Confidence Index for January on Tuesday. Friday will also bring the release of the December producer price index.
At the same time, earnings season ramps up sharply, with four members of the “Magnificent Seven” set to report this week. Microsoft (NASDAQ:MSFT), Tesla (NASDAQ:TSLA), and Meta Platforms (NASDAQ:META) are scheduled to announce results Wednesday evening, followed by Apple (NASDAQ:AAPL) after the close on Thursday.
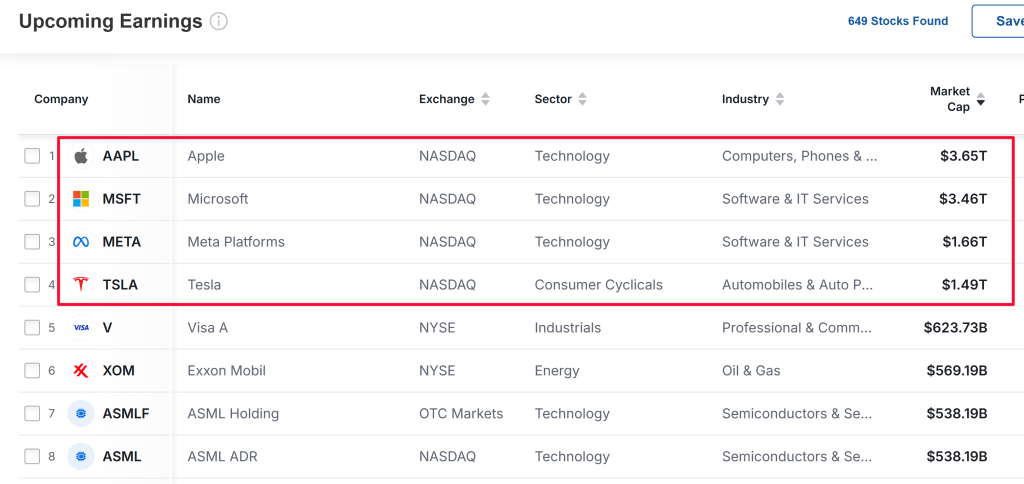
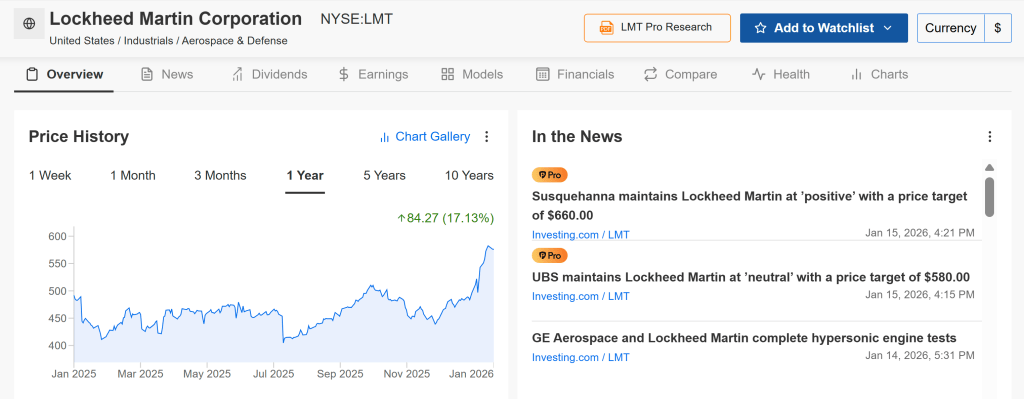
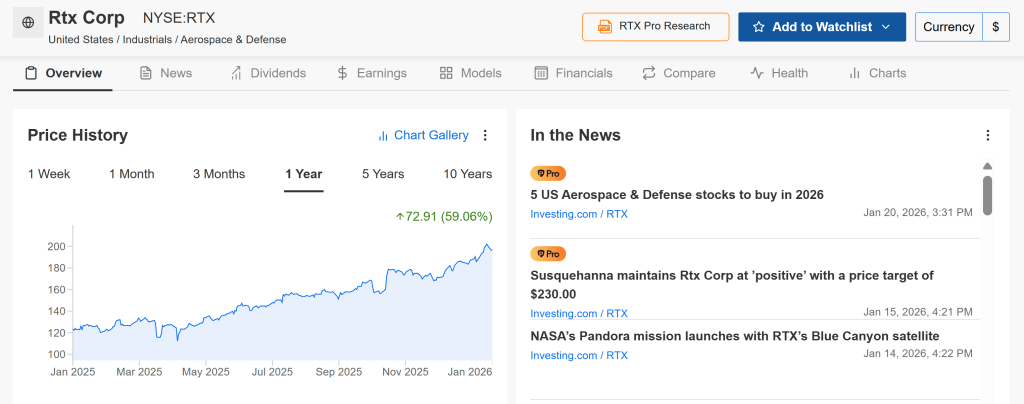
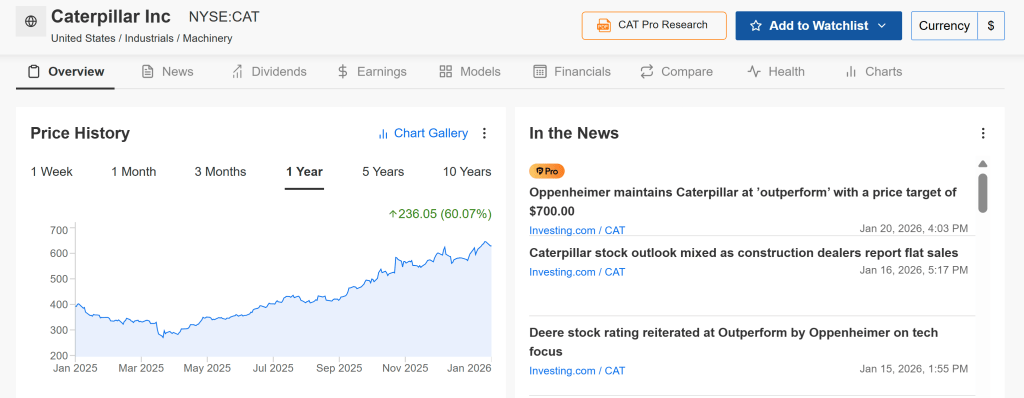
These mega-cap names will be joined by a long list of other major companies, including IBM (NYSE:IBM), ASML (NASDAQ:ASML), SanDisk, Exxon Mobil (NYSE:XOM), Chevron (NYSE:CVX), Visa (NYSE:V), Mastercard (NYSE:MA), American Express (NYSE:AXP), SoFi Technologies (NASDAQ:SOFI), UnitedHealth Group (NYSE:UNH), Boeing (NYSE:BA), UPS (NYSE:UPS), Caterpillar (NYSE:CAT), General Motors (NYSE:GM), Verizon (NYSE:VZ), AT&T (NYSE:T), Starbucks (NASDAQ:SBUX), American Airlines (NASDAQ:AAL), RTX (NYSE:RTX), and Lockheed Martin (NYSE:LMT).
Adding to the uncertainty, Congress faces a Friday deadline to fund the government once again, with the risk of a prolonged shutdown looming.
No matter how markets ultimately move, I outline below one stock that could attract strong buying interest and another that may face renewed downside pressure. Keep in mind, this outlook is strictly for the week ahead, from Monday, January 26 through Friday, January 30.
Stock to Buy: Apple
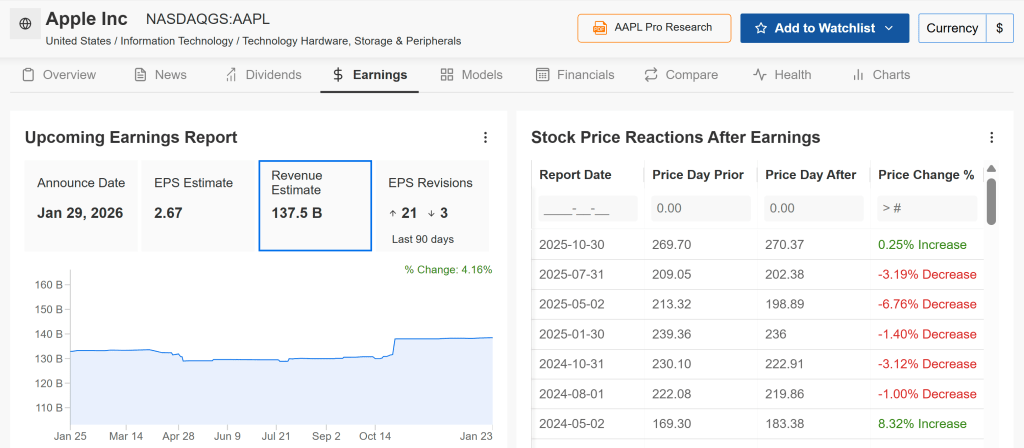
Apple is scheduled to report earnings after the market closes on Thursday, with conditions lining up for a possible upside surprise. Wall Street is increasingly calling for a beat-and-raise quarter, as consensus forecasts point to double-digit revenue growth fueled by steady iPhone demand and continued expansion in services.
Options markets are pricing in a post-earnings move of roughly plus or minus 4%. Meanwhile, earnings expectations have turned more optimistic, with profit estimates revised higher 21 times in recent weeks versus just three downward revisions, according to InvestingPro data—underscoring the growing bullish sentiment surrounding Apple’s results.
Apple is expected to post adjusted earnings of $2.67 per share, representing an 11.2% increase from a year ago, while revenue is projected to climb 10.6% year over year to $137.5 billion. Analysts are looking to the iPhone and Services segments to lead the charge, pointing to double-digit growth and a strong pipeline of upcoming products, including a foldable iPhone and an AI-enhanced Siri.
With sentiment leaning bullish, the market appears positioned for a positive surprise. Price targets reaching as high as $350—implying roughly 41% upside—suggest that even a modest earnings beat could be enough to trigger a rebound in the stock.
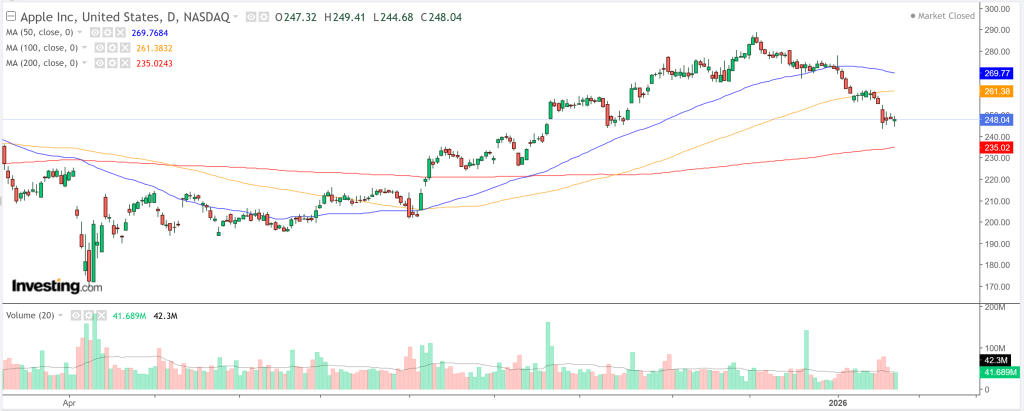
So far in 2026, Apple shares have struggled, falling roughly 9% year to date to finish Friday at $248.04. The decline has mirrored broader volatility across the tech sector, alongside investor concerns that Apple’s AI strategy may be lagging rivals such as Alphabet.
That said, the recent pullback is shaping up as a potential buying opportunity. The stock is trading in deeply oversold territory, and while daily technical indicators still signal a “Strong Sell,” key support sits near $247.53 (pivot S1). A decisive move above resistance at $248.87 could open the door to a rebound toward $260 or higher, particularly if earnings guidance exceeds expectations.
Trade Setup:
Entry: $248 (pre-earnings)
Target: $265 (gain ~7%)
Stop-Loss: $240 (risk ~3%)
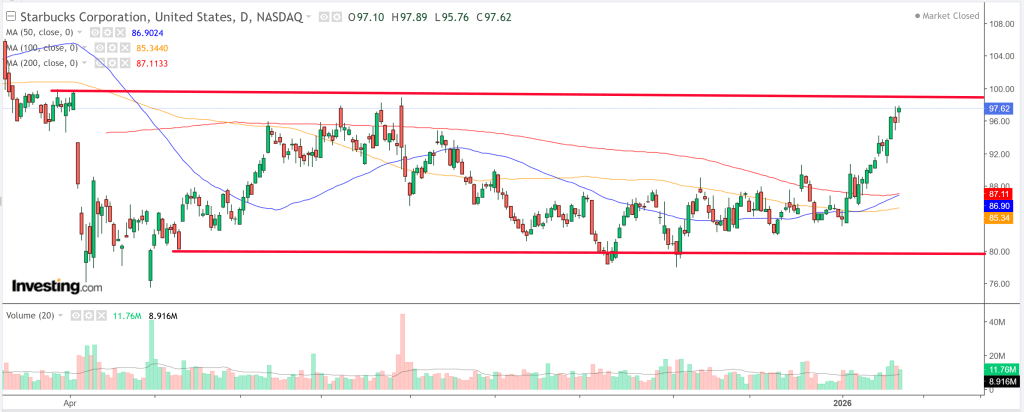
Stock to Sell: Starbucks
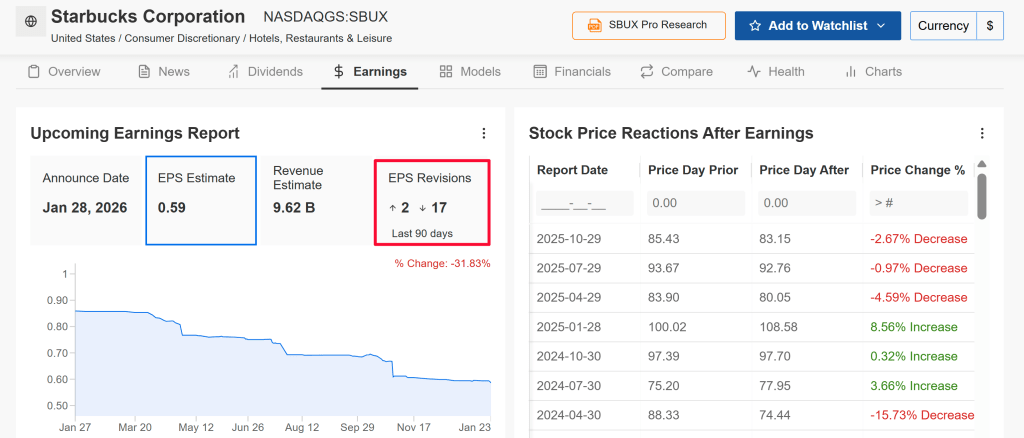
Starbucks is set to report earnings Wednesday morning, but unlike Apple, it heads into the week on much shakier footing. The coffee chain is grappling with slowing same-store sales in core markets, intensifying competition, changing consumer spending habits, and persistent cost pressures from labor and commodities.
Options markets are pricing in a post-earnings move of about plus or minus 6.4%, highlighting elevated downside risk. Sentiment has also turned notably bearish, with 17 of the 19 analysts tracked by InvestingPro cutting their EPS forecasts over the past three months ahead of the report.
Wall Street is bracing for a difficult quarter, with earnings per share projected to fall 15.9% year over year to $0.59, even as revenue is expected to edge up 2.5% to $9.62 billion.
Starbucks is also contending with intensifying competition from value-focused fast-food chains such as McDonald’s and Dunkin’, alongside pressure from local coffee shops. At the same time, its China growth narrative—once a major upside driver—has increasingly become a source of investor concern.
Looking ahead, expectations are building that CEO Brian Niccol may caution about continued near-term weakness, citing softer customer traffic, higher operating costs, and lingering uncertainty around the company’s turnaround efforts.
So far in 2026, Starbucks has been one of the stronger performers, climbing roughly 16% year to date and closing Friday at $97.62. However, the technical setup suggests the stock may be overextended heading into earnings.
Key pivot support lies near $96.25, with resistance around $97.84. A downside break below support could open the door to a pullback toward the $90 level if earnings or guidance disappoint.
Asian equities traded mixed on Monday as investors positioned ahead of a pivotal Federal Reserve policy meeting later this week and awaited major technology earnings, while Japanese shares fell sharply as the yen strengthened.
U.S. stock indexes ended last week lower, and futures linked to Wall Street declined further during Asian trading on Monday.
Nikkei tumbles as yen surges
Japan’s Nikkei 225 fell nearly 2%, deepening losses in exporter stocks as the yen strengthened sharply against the U.S. dollar amid speculation that Japanese and U.S. officials could intervene in currency markets to support the battered currency.
A firmer yen typically weighs on Japanese exporters’ overseas earnings, reinforcing risk-off sentiment in Tokyo. Meanwhile, gold surged to record highs as safe-haven demand intensified, underscoring investor caution ahead of major global policy decisions.
Elsewhere in Asia, South Korea’s KOSPI slipped nearly 1% after touching an intraday record of 5,023.76 points, while China’s Shanghai Composite was little changed.
Australia’s S&P/ASX 200 added 0.1%, while Singapore’s Straits Times Index fell 0.4%.
Indian markets were closed for a public holiday.
Fed meeting and packed tech earnings slate in focus
Traders are firmly focused on this week’s Federal Reserve meeting, where officials are broadly expected to keep interest rates unchanged, with markets closely watching for any adjustment in forward guidance on future policy moves as inflation pressures persist. Remarks from Fed Chair Jerome Powell and other policymakers later in the week are likely to influence sentiment across global risk assets.
Investor attention is also fixed on a packed earnings calendar, featuring quarterly results from most of the so-called “Magnificent Seven” technology heavyweights, including Microsoft Corp (NASDAQ:MSFT), Meta Platforms Inc (NASDAQ:META), Tesla Inc (NASDAQ:TSLA) and Apple Inc (NASDAQ:AAPL), whose results often set the tone for wider markets.
In Asia, major technology names such as Samsung Electronics (KS:005930) and SK Hynix Inc (KS:000660) are also scheduled to report earnings.
Caution around AI-related stocks remains, with technology shares underperforming in some sessions amid growing concerns over elevated valuations and rising costs.
Overall, market participants remain guarded ahead of key policy and earnings catalysts, weighing optimism over artificial-intelligence-driven long-term growth against near-term macroeconomic and currency risks.
Jefferies says Microsoft’s recent pullback presents an attractive entry opportunity
Jefferies analyst Brent Thill wrote this week that the recent pullback in Microsoft Corporation (NASDAQ: MSFT) shares has created an attractive buying opportunity. He highlighted the company’s expanding backlog, deepening AI partnerships, and continued strength in cloud computing as the foundations of a robust multi-year growth outlook among large-cap technology names.
Thill noted that the stock has declined about 18% since the first fiscal quarter, despite Microsoft disclosing roughly $250 billion in commitments to OpenAI and an additional $30 billion linked to Anthropic. He added that Microsoft’s current valuation—around 23 times calendar-year 2027 earnings—now trades below that of Amazon and Google, even though Microsoft offers what he sees as superior earnings visibility.
According to Thill, Microsoft’s record level of contractual commitments is the primary catalyst for buying at current prices. He expects second-quarter remaining performance obligations to show the largest sequential increase on record, driven largely by the OpenAI and Anthropic agreements, which he says provide “unprecedented multi-year demand visibility.”
Azure remains a central source of upside. Thill described Azure demand as constrained by supply rather than demand, noting that Microsoft plans to double its data-center capacity over the next two years. After beating Azure revenue guidance for three straight quarters, he believes that execution on new capacity alone could push results above consensus expectations for both fiscal second-quarter Azure performance and full-year 2026 forecasts.
The analyst also pointed to accelerating AI monetisation from Copilot and other first-party products. With Azure representing roughly 30% of total revenue, he said sustained outperformance in the cloud business could push overall revenue growth into the high-teens.
Although Thill acknowledged ongoing capacity constraints and elevated capital expenditures, he believes Microsoft is well positioned to generate meaningful upside to both revenue and earnings through fiscal 2026.
Analyst upgrades Google to Strong Buy as AI stack accelerates
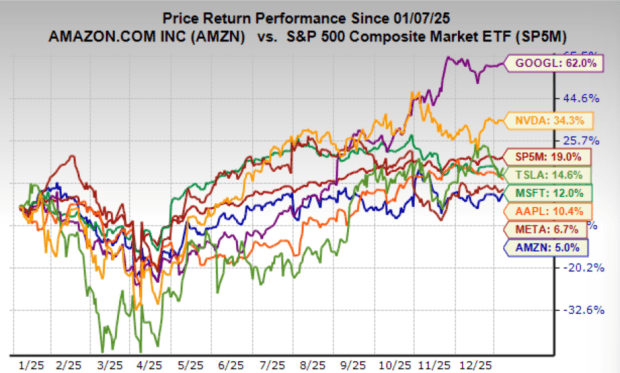
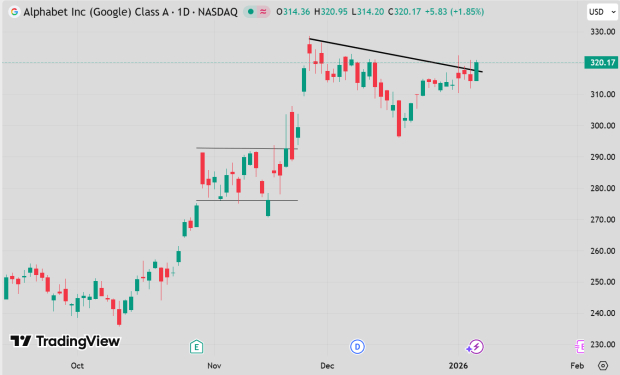
Earlier this week, Raymond James upgraded Google parent Alphabet (NASDAQ: GOOGL) to Strong Buy, arguing that the company is entering a phase in which its AI stack is “shifting into high gear,” creating the conditions for meaningful upward revisions to medium-term forecasts.
Analyst Josh Beck said updated bottom-up analysis across Search and Google Cloud Platform (GCP) led him to raise his 2026 and 2027 estimates, with his 2027 revenue projection now exceeding broader Street expectations. He believes Alphabet is “entering a cycle of strengthening AI stack momentum and upward estimate revisions that could produce one of the highest-quality top-line AI acceleration stories in the public markets.”
Beck added that in 2026, the AI stack narrative and related forecast upgrades are likely to become the primary performance drivers among mega-cap internet stocks, rather than a simple mean-reversion trade.
Within Cloud, Beck projects GCP revenue growth of 44% in 2026 and 36% in 2027, ahead of consensus. He attributes this to strong momentum in infrastructure and platform services, underpinned by large-scale TPU and GPU deployments and increasing adoption of the Gemini API and Vertex AI.
By the end of 2027, Beck estimates that GCP could generate approximately $25 billion in annualised revenue from TPUs, around $20 billion from GPUs, about $10 billion from the Gemini API, and roughly $2.5 billion from Vertex AI.
In Search, Beck projects revenue growth of 13% in both 2026 and 2027—above broader Street expectations—as softness in core search is offset by the expanding adoption of AI Overviews, AI Mode, and Gemini. He expects AI-driven queries to drive stronger cost-per-click growth as improved context and conversion rates enhance monetisation.
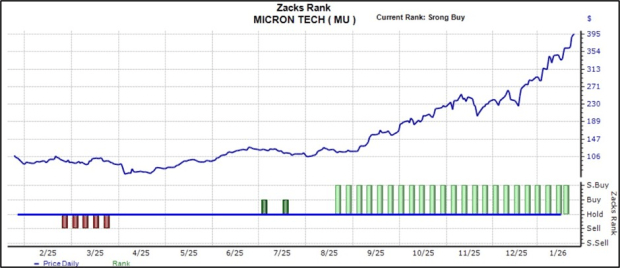
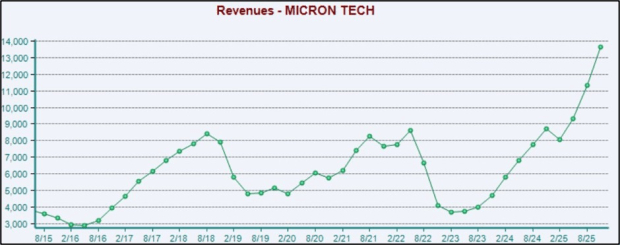
Stifel starts Micron at Outperform, citing a multi-year memory market upturn
Brokerage firm Stifel initiated coverage of Micron Technology with an Outperform rating, arguing that the memory industry is entering a multi-year upcycle driven by structural AI demand and persistently tight supply conditions.
Stifel believes Micron is well positioned to benefit from rising average selling prices and a favorable mix shift toward higher-margin products, as memory increasingly becomes a critical constraint within AI systems. “Access to memory has emerged as a key bottleneck in AI racks and systems, boosting demand for higher-performance, higher-bandwidth memory solutions,” the firm said.
With supply expected to remain constrained through 2027, Stifel sees an environment supportive of sustained pricing power and margin expansion. Against this backdrop, the firm expects Micron to capture significant ASP growth and expand margins, forecasting non-GAAP EPS growth of more than 275% over the next two years.
High-bandwidth memory (HBM) is central to Micron’s growth thesis, according to Stifel. As AI models become more complex and require faster access to larger data sets, next-generation chips are incorporating more HBM, increasing memory’s share of overall AI infrastructure spending. As the industry’s number-two player, Micron is expected to see HBM revenue grow 164% in fiscal 2026 and a further 40% in fiscal 2027, with DDR and QLC NAND also benefiting from AI-driven demand.
Stifel also highlighted several risks, including the potential re-emergence of Samsung as a more formidable HBM competitor, elevated capital spending that could shift value toward equipment suppliers, a possible easing in DRAM supply-demand dynamics, and the risk that chipmakers design their own base logic dies.
On valuation, Stifel noted that Micron trades at roughly 9.7 times calendar 2026 earnings, modestly below historical averages. “While valuation increasingly reflects significant growth expectations, we believe the shares can continue to perform on the back of a multi-year, AI-driven product cycle characterized by tight supply,” the firm concluded.
Mizuho says Arm selloff presents a buying opportunity
Mizuho analyst Vijay Rakesh said investors should take advantage of the recent pullback in Arm Holdings shares to build positions, arguing that market concerns around handset demand have become excessively pessimistic.
Arm’s stock has declined roughly 30% since November, even as the Philadelphia Semiconductor Index has risen about 10%. Rakesh described the selloff as “overdone,” adding that Mizuho would “be buyers of ARM on the approximately 30% pullback.”
According to Rakesh, Arm’s growth drivers extend well beyond smartphones. While mobile royalties account for about 50% of revenue, he noted that Arm has historically outpaced handset market growth and is projected to expand at annual rates of 7% to 31% between 2021 and 2027.
A key catalyst is the ongoing transition to Arm’s v9 architecture, which delivers roughly double the average selling price per core compared with v8, providing a structural uplift to royalty revenue. Rakesh also highlighted rising interest in custom silicon, noting that potential ASIC and CPU ramps in 2027 and 2028 could contribute more than $1 billion in incremental revenue.
He further pointed to opportunities tied to AI-focused custom chips, including a potential training and inference ASIC associated with OpenAI and SoftBank. That initiative alone, he said, could conservatively generate around $1 billion in revenue during the 2027–2028 period.
Beyond mobile, Arm is gaining traction in data centers as hyperscalers increasingly adopt its architectures. Rakesh cited platforms such as AWS Graviton, Microsoft Cobalt, Meta’s planned CPU, and Nvidia’s Grace and Vera as evidence of a growing custom silicon customer base and an improving royalty mix.
Rakesh reiterated Mizuho’s Outperform rating and $190 price target, saying Arm remains “well positioned as the broadest global semiconductor platform.”
Morgan Stanley grows more positive on European semiconductor stocks
Morgan Stanley upgraded the European semiconductor sector to Overweight this week, arguing that the group offers an attractive environment for selective stock picking as diversification inflows gather pace, valuation dynamics improve, and semiconductor equipment companies stand to benefit from the next phase of the AI capital expenditure cycle.
The firm’s strategists noted that European equities are attracting increased diversification inflows while beginning to emerge from a long-standing valuation discount to U.S. markets. Within this context, semiconductors stand out as a sector where strengthening bottom-up fundamentals are increasingly driving top-down performance. Morgan Stanley said its preferred expression of this view remains analyst-led stock selection rather than broad factor exposure.
“While European equities already appear highly idiosyncratic, we see further scope for stock-level dispersion in Europe to rise toward cycle highs,” the strategists wrote.
The upgrade is anchored in the semiconductor equipment segment. Morgan Stanley highlighted ASML as the dominant contributor to European Top Picks performance year to date, accounting for more than half of weighted gains. ASML also represents roughly 80% of the MSCI Europe Semiconductors and Semiconductor Equipment index.
Looking ahead, the bank said risks in the AI investment cycle are shifting away from demand and toward execution and transition. “For 2026, the key risk in the AI capex cycle is execution and transition, not demand,” the strategists wrote, arguing that this dynamic favors European semiconductor equipment exposure—particularly companies tied to extreme ultraviolet lithography.
Morgan Stanley expects upcoming order intake to confirm higher foundry and memory capital spending through 2027, alongside stronger-than-expected demand from China.
From a portfolio construction standpoint, the firm said it adjusted its sector model to reflect improving earnings momentum and broader price-target revisions for European semiconductors, while neutralising accrual factors and reducing China exposure. These changes lifted the sector to second place in Morgan Stanley’s internal rankings, just behind banks.
At the stock level, ASML and ASM International remain Morgan Stanley’s Top Picks, with BE Semiconductor Industries also highlighted as an Overweight-rated beneficiary of the same themes.
When Tesla introduced the Semi in 2017, it billed the vehicle as a game-changer for the heavy-duty trucking industry. Almost ten years on, however, only a limited fleet is in operation. Repeated production delays and Tesla’s focus on higher-visibility ventures such as passenger cars, AI, and robotics have kept the Semi on the sidelines. Still, 2026 could prove to be the decisive year in determining whether the truck can evolve from a pilot project into a viable commercial offering.
Worldwide sales of heavy-duty trucks reached roughly 2.8 million units in 2024, including about 400,000 in the U.S. Yet electrification in the Class 8 segment remains minimal, as fleet operators tend to prioritise total cost of ownership over branding or technological novelty.
Tesla argues that the Semi offers a strong economic proposition, citing a claimed 500-mile range from an approximately 850 kWh battery, ultra-fast charging rates of up to 1.2 MW, and significantly lower energy and maintenance costs compared with diesel alternatives. Elon Musk has repeatedly characterised demand as “ridiculous” and the business case as a “no-brainer” for fleet operators.
On paper, momentum appears to be building. Filings associated with California’s electric-truck incentive programme indicate that nearly 900 Semis were applied for in 2025—more than any traditional truck manufacturer has historically secured. Early customers, including DHL and RoadOne, report performance exceeding expectations and have signalled intentions to expand their fleets once mass production begins.
Execution risks, however, remain substantial. Tesla is aiming for annual output of up to 50,000 units from its Nevada facility by the end of 2026, a lofty target given that the entire U.S. day-cab tractor market totals fewer than 100,000 units per year. Additional concerns include battery supply constraints following a significant writedown by a major 4680-cell supplier, while drone footage suggests the Nevada production line is not yet fully installed.
Bernstein analysts also caution that, based on current assumptions, the Semi’s total cost of ownership may still marginally exceed that of best-in-class diesel trucks.
For established manufacturers such as Daimler, Volvo, and Paccar, Tesla’s influence is unlikely to be felt immediately. Diesel-powered trucks continue to dominate the market, and the electrification of long-haul freight is expected to progress gradually.
However, if Tesla succeeds in scaling production in 2026, the Semi could alter industry perceptions, prompting increased investment and putting pressure on margins within one of the sector’s most important profit pools.
Monday – U.S. markets were closed for Martin Luther King Jr. Day.
Ciena Corp
What happened? On Tuesday, Bank of America lowered its rating on Ciena Corp. (NYSE: CIEN) to Neutral and set a price target of $260.
TL;DR: Ciena shares have jumped on strong hyperscaler-driven growth, but BofA turned more cautious due to concerns over potential backlog risks.
What’s the full story? Ciena’s shares have surged to record levels, now trading at roughly 40x forward earnings, about twice its 10-year average, reflecting strong expectations for sustained growth. Demand from hyperscale cloud providers has driven a sharp acceleration in revenue growth—from around 8% to approximately 30% in 1Q26—supported by a $5 billion backlog that provides solid visibility into next year’s revenues.
Analysts believe the current cycle has durability, fueled by rapid expansion in scale-across deployments, which are projected to rise 11-fold to $808 million by 2026, alongside continued leadership in 800G optical technology. Ciena’s market share has increased from 18% in 2024 to 22% in 9M25, with the company commanding roughly 50% share among major cloud providers, driven by its RLS systems and WaveLogic 6 Nano built on 3nm DSP, offering superior power efficiency versus competitors such as Cisco and Marvell.
However, risks remain. The company’s history offers a cautionary example: in 2022, backlog coverage fell sharply—from levels that once covered 96% of revenue to a 38% decline, triggering a 12% drop in the stock. With shares now valued at about 45x earnings, assumptions of peak growth leave little room for disappointment if backlog momentum weakens.
As a result, Bank of America downgraded the stock to Neutral, maintaining a $260 price objective, which implies only around 7% upside, suggesting much of the optimism is already reflected in the valuation.
Ulta Beauty
What happened? On Wednesday, Raymond James upgraded Ulta Beauty Inc. (NASDAQ: ULTA) to Strong Buy and raised its price target to $790.
TL;DR: Raymond James turns more bullish on ULTA, citing earnings upside from growth initiatives despite competitive and execution risks.
What’s the full story? Raymond James upgraded Ulta to Strong Buy from Outperform, lifting its price objective to $790 and modestly increasing its FY26 EPS forecast to $28.60 from $28.51. The firm sees a combination of strategic initiatives reigniting growth as Ulta enters FY26 following a year of restructuring.
Beauty demand remains resilient, while the company benefits from operational improvements implemented over the past year, including a refreshed leadership team, enhancements to its loyalty program, stronger digital capabilities, and expanded assortments in Wellness and Marketplace categories. Looking ahead, Raymond James highlights opportunities from deeper data analytics, adoption of agentic AI, and early-stage international expansion—initiatives expected to drive earnings growth without relying on valuation multiple expansion.
The firm believes Ulta is transitioning from an investment phase toward a period of return realization, with contributions expected across physical stores, e-commerce, and potential international markets. However, risks persist, including intensifying competition in beauty retail, potential softness in U.S. consumer demand, rising cost pressures, and execution risks tied to overseas expansion.
Overall, Raymond James views Ulta’s balanced exposure to both prestige and value-conscious consumers, its strong loyalty ecosystem, and improving operational leverage as creating an attractive risk-reward profile, supporting the Strong Buy rating.
Palantir
What happened? On Thursday, PhillipCapital initiated coverage of Palantir Technologies Inc. (NASDAQ: PLTR) with a Buy rating and a $208 price target.
TL;DR: PhillipCapital sees Palantir as a buying opportunity, driven by strong revenue and profit growth, and sets a $208 target.
What’s the full story? PhillipCapital expects Palantir’s FY25 revenue to rise 47% year over year to $4.2 billion, supported by a growing contribution from its commercial segment, which is forecast to expand 51% YoY, outpacing 43% growth in government revenue. The shift reflects accelerating enterprise adoption of AI-driven platforms beyond Palantir’s traditional defense and public-sector base. Net profit is projected to increase by approximately 1.9x, reflecting improving operating leverage.
The U.S. market, which accounts for roughly 66% of total revenue, is expected to remain the key growth driver. Revenue in the region is forecast to grow 66% YoY, supported by elevated government spending amid geopolitical tensions and a sharp acceleration in commercial contracts—nearly doubling in 3Q25—driven by demand for Palantir’s Artificial Intelligence Platform (AIP) and its ontology-based productivity tools.
PhillipCapital’s $208 price objective is derived from a discounted cash flow valuation, assuming an 8.3% WACC, 4.2% risk-free rate, and 8% terminal growth rate. While the stock trades at a lofty ~170x forward P/E, the firm argues this remains below prior peak valuation levels, leaving room for a potential re-rating as earnings visibility improves and Palantir’s addressable markets continue to expand.
Starbucks Co.
What happened? On Friday, William Blair upgraded Starbucks Corporation (NASDAQ: SBUX) to Outperform, without assigning a price target.
TL;DR: William Blair sees an imminent return to positive U.S. comparable sales, prompting an upgrade to Outperform.
What’s the full story? William Blair expects Starbucks to deliver its first positive domestic comparable-sales growth in two years during the December quarter, setting the stage for improved performance into fiscal 2026. While sales momentum is turning, the firm highlights margin recovery as the central investment debate. Americas operating margins are projected to fall to 13.4% in FY25, down from a peak of 20.8%, with an additional $500 million in labor-related cost pressures anticipated in the following year.
The firm is looking to Starbucks’ January 29 investor day for further clarity, anticipating a multi-year strategy focused on general and administrative cost reductions, productivity initiatives, and sustained comparable-sales growth. Over the longer term, William Blair models approximately 3% global unit growth combined with low-single-digit comparable sales, allowing consolidated margins to gradually approach 2023 levels by 2030.
Under this framework, Starbucks could generate a 15–20% compound annual growth rate in EPS over the next five years. Despite the stock being up roughly 15% year to date, William Blair sees a potential valuation path toward $140+ per share by 2029, based on a 30x multiple applied to $4.70+ in EPS, implying roughly 10% annual share price appreciation, with upside if comparable sales accelerate faster than expected.
As a result, William Blair upgraded Starbucks to Outperform, arguing that the recovery in sales is likely to precede and ultimately drive a more meaningful rebound in profitability beginning around 2027.
Micron (MU) is a global leader in advanced memory and storage technologies, playing a critical role in converting data into actionable intelligence. The stock has surged amid the AI-driven rally, as Micron’s products have become an essential component of AI infrastructure, particularly in addressing persistent memory bottlenecks.
The shares also highlight the effectiveness of the Zacks Rank framework. In August of last year, Micron was upgraded to the highly sought-after Zacks Rank #1 (Strong Buy) following upward revisions to earnings estimates, a shift that has since been accompanied by a strong and sustained rally in the stock price.
As illustrated above, the Zacks Rank may also have helped mitigate downside risk last March.
Why Micron Shouldn’t Be Overlooked
Micron delivered outstanding results in its latest earnings report, surpassing consensus expectations on both revenue and earnings, driven by rapidly accelerating demand tied to AI workloads. Revenue surged more than 55% year-over-year to a record high, while adjusted EPS jumped an impressive 185%.
The company’s cash-generation profile also strengthened significantly amid the favorable demand backdrop. Operating cash flow reached a record $8.4 billion during the period, sharply exceeding the $5.7 billion generated in the same period last year.
The positive momentum appears set to continue, with Micron’s Q2 guidance pointing to new records across revenue, margins, earnings, and free cash flow. In short, Micron plays a critical role in enabling the AI boom, as memory capacity remains a key bottleneck in advanced systems. This strategic positioning places the company in a strong overall stance and helps shield it from concerns about being an AI “also-ran” or laggard.
As illustrated below, Micron’s revenue has surged sharply in recent periods, reinforcing the strength of the current demand environment. The company’s top-line trajectory mirrors that of NVIDIA (NVDA – Research Report), widely regarded as the flagship beneficiary of the broader AI trade.
Micron vs. NVIDIA
While many AI-linked companies are likely to come under increased scrutiny in 2026, Micron represents a far more straightforward beneficiary of the broader infrastructure buildout. Memory remains a key bottleneck in AI systems, and MU has been capitalizing meaningfully on this constraint. The company recently announced its exit from the consumer memory segment, further underscoring its strategic focus on maximizing revenue from large-scale enterprise and data-center customers.
Micron noted that “AI-driven growth in the data center has led to a sharp increase in demand for memory and storage,” adding that the decision to wind down its Crucial consumer business was made to improve supply allocation and support for larger, strategic customers in faster-growing markets.
Overall, Micron stands out as one of the most compelling AI-related investment opportunities, drawing a clear parallel with NVIDIA. While NVIDIA dominates the GPU side of AI computing, Micron plays an equally critical role by supplying the high-performance memory required for those GPUs to operate efficiently.
Turning to NVIDIA, the company once again delivered a double beat versus consensus in its latest, record-setting earnings report. Revenue reached $57 billion, up 62% year-over-year, alongside a 67% surge in earnings per share. Data Center revenue climbed to $51.2 billion, representing a robust 66% annual increase and comfortably exceeding consensus expectations of $49.1 billion.
For investors looking to capitalize on the AI infrastructure buildout, both Micron (MU – Research Report) and NVIDIA (NVDA) stand out as premier choices, with each currently holding the highly sought-after Zacks Rank #1 (Strong Buy).
Shares of Apple (NASDAQ: AAPL) have come under sustained selling pressure, with the stock now trading around $245—nearly 15% below the record high reached just last month. The decline has been largely one-way, which is notable given Apple’s reputation as one of the market’s most reliable large-cap names. Broader market conditions have also weighed on the stock, as escalating geopolitical tensions have fueled a sharp risk-off move across equities in recent days.
What makes the current situation particularly striking is how stretched Apple’s technical signals have become. The stock’s relative strength index (RSI) has fallen into deeply oversold territory this month, currently hovering near 18—its lowest level since September 2008. Such an extreme reading suggests that selling may have been excessive and overly rapid, especially with the company’s earnings report scheduled for next week.
Understanding the Setup as Apple Heads Toward Earnings
An RSI reading this depressed would draw attention for any stock, especially one like Apple. With the company heading into a closely watched earnings report next week, the setup becomes even more compelling.
Apple has a well-established history of beating analysts’ expectations on a quarterly basis, and viewed through that lens, the current situation raises an important question. After such an aggressive sell-off, is it possible that the market has already priced in a worst-case outcome?
Apple’s Fundamentals Still Strengthen the Bullish Case
From a business perspective, Apple’s recent share price performance appears increasingly out of step with its underlying fundamentals. The company’s consistent ability to exceed earnings expectations is something few of its peers can rival. Gross margins remain solid, and its ecosystem-based model continues to deliver dependable cash flows.
Apple’s approach to returning capital also offers a meaningful buffer for investors considering an entry. A sizable share repurchase program alongside steady dividend growth means management is a regular buyer of its own stock during periods of weakness. While this doesn’t eliminate the risk of sharp pullbacks, it often helps prevent negative sentiment from persisting for long.
That said, the concerns driving the sell-off cannot be ignored. iPhone shipment volumes have softened, and the stock’s valuation is near the upper end of its recent range. These factors help explain investor caution, but they fall short of fully justifying the speed and magnitude of the recent decline.
Analyst Confidence Grows Ahead of Apple’s Earnings
The case for buying the dip is reinforced by steadfast analyst support for Apple. This week, Evercore added the stock to its tactical outperform list ahead of next week’s earnings, reflecting confidence that the company will deliver results above expectations.
Recent analyst commentary has focused on the composition of iPhone sales, with higher-end models reportedly making up a greater share of demand. This trend supports both average selling prices and margins. Meanwhile, services revenue is expected to continue providing a stable source of growth, helping to cushion any weakness in hardware volumes.
Evercore set a new price target of $330 for Apple, implying roughly 35% upside from current levels, and that still isn’t the most optimistic view on the Street. Wedbush released a bullish update last week, assigning a $350 price target and further supporting the argument that the market’s reaction has been excessive. With momentum already deeply washed out, even a modest beat on revenue or earnings could be enough to spark a meaningful shift in sentiment.
Apple’s Risk/Reward Looks Compelling at Current Prices
None of this suggests Apple is without risk. Next week’s earnings will carry more weight than usual, and a true disappointment could drive the stock lower—particularly if geopolitical tensions intensify.
That said, the risk/reward profile is becoming increasingly asymmetric. This is the most oversold Apple has been in nearly two decades, and for a company with its balance sheet strength, margin profile, and history of delivering shareholder returns, it’s difficult to ignore the appeal of buying at these levels.
Markets managed to rebound after Tuesday’s sell-off, but the bounce—despite attracting attention—fell short of fully recouping the earlier losses. More importantly, a significant “bull trap” remains in place for the S&P 500. Technical signals for the index continue to be mixed, with momentum indicators such as stochastics failing to move back into overbought territory—a key condition needed to support a sustained rally.
Bitcoin faces more significant challenges. Yesterday’s rise alone is far from sufficient to undo what was beginning to resemble the formation of a right-hand base. That said, this still appears to be the early stages of building a new base and could represent an attractive buying opportunity for investors willing to hold through what may be a year-long process, potentially targeting a move toward $125K. For now, technical indicators remain net bearish, and a break below $85K would invalidate any bullish outlook.
The Nasdaq has mounted a counter-trend bounce following the breakdown, but the symmetrical triangle pattern has already resolved, meaning attention now shifts to identifying new support and resistance levels. There is still a potential bullish scenario if price action evolves into a bullish ascending triangle.
On the other hand, the Russell 2000 shows the potential to form a bearish “evening star” pattern, though this would require a gap lower today. Setting that possibility aside, the index remains firmly in rally mode and is far from any “bull trap” conditions. Overall, technical indicators are net bullish.
For today, bulls may want to focus on Bitcoin, while bears should monitor the Russell 2000 for signs that a bearish “evening star” pattern could emerge.
Geopolitical tensions are rising as President Trump moves ahead with threats to levy tariffs on eight NATO allies while continuing his push regarding Greenland. Although overall markets have weakened, these frictions may spur higher defense budgets, accelerated resource reshoring, and expanded infrastructure investment. Below, we identify five U.S.-based companies that stand to gain from the intensifying U.S.–NATO standoff.
As tensions between the U.S. and NATO escalate over fresh tariffs and Greenland’s strategic resource base, defense, mining, and industrial shares appear well positioned for a strong upswing. Against this backdrop, five companies stand out—Lockheed Martin (NYSE:LMT), RTX (NYSE:RTX), Critical Metals (NASDAQ:CRML), Teck Resources (NYSE:TECK), and Caterpillar (NYSE:CAT). Each is set to benefit from increased U.S. defense spending, intensifying competition for Arctic resources, and ongoing efforts to shift supply chains away from Europe and China.
Lockheed Martin: A Leader in Arctic Defense Capabilities
Lockheed Martin appears to be among the primary beneficiaries of rising U.S.–NATO tensions, particularly as Greenland’s strategic value elevates the need for enhanced Arctic defense capabilities. The company’s advanced military platforms and surveillance systems are well suited to the region’s demanding operational environment.
Its F-35 fighter aircraft, along with missile defense and radar solutions such as the “Golden Dome,” play a central role in Arctic security, where Greenland’s geographic position strengthens U.S. monitoring capacity and deterrence against potential Russian and Chinese advances.
So far in 2026, Lockheed Martin’s shares are up roughly 19% year to date, supported by President Trump’s proposed $1.5 trillion defense budget for 2027, which points to expanded procurement activity. In periods of sustained geopolitical strain, investors typically favor companies with stable revenues and long-term contracts. Against this backdrop, Lockheed’s robust order backlog, strong free cash flow generation, and reliable dividend profile position it as a traditional “geopolitical hedge” stock.
RTX: Rising Demand Across Aerospace and Missile Systems
RTX, formerly known as Raytheon, stands out as a key beneficiary due to its broad defense technology portfolio tailored to the demanding requirements of Arctic environments. The company’s missile defense and advanced radar solutions are central to securing and monitoring strategically vital regions such as Greenland.
In particular, RTX’s Patriot missile defense system is regaining prominence as governments prioritize battle-tested platforms capable of operating in extreme climates while defending against increasingly sophisticated threats.
RTX shares are up about 7% year to date in 2026, following a strong 60% advance in 2025, with a record backlog of $251 billion underpinning continued momentum.
Looking ahead through the rest of 2026, RTX remains attractive amid rising orders from the Middle East, its inclusion in leading defense-focused ETFs, and expectations for roughly 20% earnings growth.
Critical Metals controls the Tanbreez project in Greenland, the largest non-Chinese rare earth deposit globally, directly linking the company to U.S. strategic resource objectives. Heightened geopolitical tensions could accelerate Washington’s push to secure access to these materials, which are essential for defense systems, missile technologies, and electric vehicles—reducing reliance on China and enhancing CRML’s strategic importance.
In addition, the company’s proprietary rare earth processing capabilities and its focus on North American operations position it to benefit from government initiatives aimed at strengthening domestic critical-materials supply chains and expanding strategic mineral stockpiles.
CRML shares have surged nearly 150% so far in 2026, propelled by strong high-grade drilling results and regulatory approval for its pilot processing plant in Greenland.
While the stock carries elevated risk, it offers substantial upside potential this year, with the possibility of capturing up to 50% of the Western rare earth supply. Despite ongoing volatility, secured offtake agreements and heightened U.S. national security priorities support the bullish case, with the stock still trading at an estimated 22% discount to net present value.
Teck Resources: A Global Metals and Mining Leader
Teck Resources is a leading diversified mining company with significant exposure to steelmaking coal, copper, zinc, and other essential industrial metals. While its operations are not exclusively Arctic-centric, Teck’s asset base firmly places it within the strategic raw materials space that underpins infrastructure development, defense manufacturing, and the global energy transition.
Should 2026 be marked by robust commodity demand, sustained decarbonization spending, and intensifying geopolitical rivalry, diversified miners such as Teck are well positioned to benefit from favorable pricing dynamics and rising shipment volumes.
TECK shares are up roughly 5% year to date, notching fresh 52-week highs as copper prices rally and investors rotate into the materials sector.
Looking ahead, Teck presents a compelling copper-focused opportunity, with its merger with Anglo American set to create a top-five global producer, unlock an estimated $800 million in synergies, and benefit from AI-driven demand growth. Analyst price targets in the $80–90 range are underpinned by structural supply constraints and sustained long-term commodity demand.
Caterpillar – Infrastructure & Arctic Expansion
Caterpillar stands out as a key beneficiary through its portfolio of heavy machinery and construction equipment critical to Arctic infrastructure expansion, including military installations, transportation networks, and mining projects.
Its specialized cold-weather and Arctic-rated equipment gives Caterpillar a distinct advantage in supporting development across Greenland and other high-latitude regions that gain strategic relevance amid heightened geopolitical tensions.
CAT shares are up roughly 10% year to date in 2026, building on a strong 58% gain in 2025, supported by a record backlog of $39.9 billion.
Looking ahead, Caterpillar remains a solid hold for 2026, with earnings per share projected to grow about 20.5%, aided by continued spending under the U.S. Infrastructure Act and expanding construction tied to AI-driven data center development.
Last week, we kicked off a broad review of the key macro forces shaping the stock market, focusing on the health of the economy and earnings expectations. The takeaway was clear: the economy appears to be in solid shape, and consensus forecasts for earnings growth this year are not just positive, but notably strong.
Admittedly, there has been no shortage of headlines and market volatility since then. It would be reasonable to dive into geopolitical developments, market breadth, or the current state of the AI trade. However, at least for now, none of these factors have altered the market’s primary trend. With that in mind, it makes sense to continue our top-down assessment of the major macro drivers.
Having already examined the economy and earnings, the remaining areas to address are inflation, Federal Reserve policy and interest rates, and market valuations. Let’s turn to those next.
What Is Inflation?
The Federal Reserve defines inflation as a sustained rise in the prices of goods and services over time, reflecting a general increase in the overall price level across the economy. Similarly, Investopedia and standard economics textbooks describe inflation as a gradual erosion of purchasing power, manifested through a broad-based increase in the prices of goods and services over time. The International Monetary Fund frames inflation as the pace at which prices rise over a given period, indicating how much more costly a representative basket of goods and services has become.
Or, as I was taught in my very first economics class many years ago, inflation can be summed up as “too much money chasing too few goods.”
In Focus
There is little doubt that inflation has dominated the attention of the Federal Reserve, policymakers, consumers, and financial markets for several years. Unless one has been completely disconnected from events, it is well known that inflation surged in the aftermath of the COVID crisis, driven by trillions of dollars in government stimulus flowing into household bank accounts and severe disruptions across global supply chains.
This surge fueled fears that the United States was heading back toward the inflationary turmoil of the 1970s—a period the Fed ultimately subdued, but only at significant cost to the economy. With the Consumer Price Index approaching double-digit territory in early 2022, such concerns were understandable.
As the pandemic faded and supply chains normalized, inflationary pressures also began to ease. By early 2024, CPI readings had fallen back near pre-pandemic levels, when face coverings were not yet a cultural norm. The key question now is whether the inflation spike has been fully brought under control.
While corporate pricing strategies and consumer behavior—both central drivers of inflation—are inherently difficult to forecast, it remains possible to analyze the components of the CPI and examine the historical forces that have shaped inflation trends.
A Framework for Understanding Inflation
Unsurprisingly, the team at Ned Davis Research Group has already taken this step. In short, there is indeed a model that addresses this—shown below.
The upper chart shows the Consumer Price Index, which represents the inflation rate, while the lower chart displays NDR’s Inflation Timing Model. Reading the model is fairly intuitive. When the blue line rises above zero, it signals that inflation pressures are likely increasing. Historically, readings above 10 have coincided with periods when inflation was significantly above normal levels.
The red box highlights the CPI period from late 2020 through early 2022. During that phase, the model effectively flagged the acceleration in inflation and warned that conditions were set to deteriorate. The model also performed well in the opposite direction in the fall of 2022. While widespread concern about inflation persisted, the model correctly indicated that inflation was poised to ease—and it did.
That downtrend continued until late 2024 or early 2025, when the model briefly suggested inflation was no longer moving in the right direction. However, the signal proved temporary, as the model dropped back below the zero line by the end of 2025. Encouragingly, recent data has validated the model’s current reading, with price pressures generally moderating and the inflation rate falling back below 3%.
Is 3% Becoming the New Inflation Norm?
Inflation skeptics are quick to push back against my relatively calm view, pointing out that inflation remains well above the Federal Reserve’s stated 2% target. From that perspective, they argue the Fed is unlikely to turn accommodative anytime soon. While this logic is understandable, it overlooks two important points: first, the Fed operates under a dual mandate, and second, its preferred inflation gauge—core PCE—differs from the inflation measures most often highlighted in the media.
Crucially, inflation is not the Fed’s sole concern. Maintaining a healthy labor market is equally central to its mission. As a result, the Federal Open Market Committee must carefully balance inflation pressures against broader economic conditions.
This helps explain why the Fed has been cutting interest rates even as inflation remains above target. The labor market has shown signs of weakening, prompting policymakers to act. Equity bulls have welcomed these moves, mindful of the long-standing adage that it rarely pays to fight the Fed. With rates coming down, investors have largely aligned with the bullish camp.
That said, it’s important to recognize that the Fed is not engaged in an aggressive stimulus campaign. Chair Jerome Powell and his colleagues are not attempting to jump-start the economy. Instead, they are seeking to bring interest rates back toward a more neutral, “normal” level—one that balances inflation with labor market stability.
In this context, the prevailing view is that the Fed is willing to tolerate inflation running somewhat above its 2% target while it works to shore up employment conditions. From that standpoint, an inflation rate around 3% may be acceptable—for the time being.
In Summary
The encouraging takeaway is that history suggests a modest amount of inflation can actually be beneficial—supporting stock prices, home values, and corporate earnings. From that perspective, inflation does not appear to be a headwind for equities at present. While this may not be a classic “don’t fight the Fed” environment, the central bank is also not acting as an adversary. As a result, my view is that investors can remain on the bullish path—for now.
U.S. stock index futures edged higher on Tuesday evening after Wall Street suffered sharp losses amid rising geopolitical tensions linked to President Donald Trump’s demands regarding Greenland. Netflix was a notable mover in after-hours trading, sliding nearly 5% after the streaming company issued guidance that disappointed the market.
Futures stabilized following Wall Street’s worst session in three months, as investors grew uneasy over President Trump’s push to acquire Greenland despite resistance from European leaders. S&P 500 futures gained 0.1% to 6,838.0 by 18:27 ET, while Nasdaq 100 and Dow Jones futures also rose 0.1% to 25,152.75 and 48,727.0, respectively.
Netflix falls after issuing a weaker-than-expected outlook; more earnings reports ahead
Netflix Inc (NASDAQ: NFLX) fell 4.8% despite reporting December-quarter earnings that topped market expectations, as its first-quarter guidance disappointed investors. The company pointed to weakening viewership for non-branded licensed content, signaling softer demand beyond its flagship in-house programming. Netflix’s outlook for 2026 also came in below expectations.
The results arrive amid a wave of mixed corporate earnings over the past week, particularly among major U.S. banks. The fourth-quarter earnings season continues in the days ahead, with Johnson & Johnson (NYSE: JNJ), Charles Schwab Corp (NYSE: SCHW), and Prologis Inc (NYSE: PLD) scheduled to report on Wednesday.
On Thursday, earnings are due from Procter & Gamble (NYSE: PG), GE Aerospace (NYSE: GE), Intel (NASDAQ: INTC), Abbott Laboratories (NYSE: ABT), and Intuitive Surgical (NASDAQ: ISRG). Elsewhere in Tuesday evening trading, United Airlines Holdings Inc (NASDAQ: UAL) jumped 5% after posting strong quarterly earnings and an upbeat outlook.
Wall Street rattled by Trump–Greenland dispute
Wall Street’s major indexes slumped sharply on Tuesday — the first trading day after a long weekend — as investors were unnerved by escalating geopolitical tensions tied to President Donald Trump’s aggressive push over Greenland and tariff threats against several European countries. The sell-off marked one of the market’s worst sessions in months, with the S&P 500, Dow Jones, and Nasdaq all posting significant declines amid heightened risk aversion.
Trump’s plan to pressure European allies with new tariffs in an effort to secure U.S. leverage over Greenland drew strong rejection from European leaders and amplified fears of broader trade conflict, prompting a flight from risk assets.
On the trading day, the S&P 500 dropped about 2.1%, the Nasdaq Composite slid nearly 2.4%, and the Dow Jones Industrial Average fell roughly 1.8%. Tech and broader market stocks led the weakness, underscoring how geopolitical uncertainty can quickly sour sentiment across sectors.
Few analysts had a U.S. invasion of Greenland anywhere near the top of their 2026 market outlooks. President Trump’s surprise weekend tariff move has triggered a classic risk-off reaction, with gold rallying around 2%, equities down 1.0–1.5%, and the dollar coming under modest pressure. This week’s World Economic Forum in Davos is now set to become a focal point for U.S.–European diplomacy, with elevated FX volatility likely.
USD: Too Early to Embrace the ‘Sell America’ Narrative
Washington escalated its pursuit of Greenland over the weekend, with the threat of 10% tariffs—potentially rising to 25%—on eight European countries appearing consistent with a broader “maximum pressure” strategy to force a deal. Political commentary in Europe suggests this could mark the end of the EU’s long-standing policy of accommodation toward the U.S., with France emerging as a key advocate for deploying the EU’s Anti-Coercion Instrument, which allows for retaliatory measures spanning tariffs, taxation, and investment restrictions against coercive trade actions.
The issue, alongside growing concerns about strains within NATO, is set to dominate the policy agenda in a week that might otherwise have focused on Ukraine. President Donald Trump is scheduled to speak at the World Economic Forum in Davos on Wednesday, followed by an EU leaders’ meeting on Thursday. A central question is whether Europe adopts China’s approach from last year—matching U.S. tariffs one-for-one—to ultimately force a de-escalation from Washington.
Initial market reactions have been cautious but telling: gold has gapped roughly 2% higher, German DAX futures are down around 1.5%, and the U.S. dollar is marginally weaker. While U.S. cash markets are closed for the Martin Luther King Jr. holiday, S&P 500 futures are indicating losses of about 0.8%. Still, it may be premature to revive the “Sell America” narrative. As with last April’s near-50% “Liberation Day” tariff threats, investors appear reluctant to chase what often proves to be aggressive rhetoric that ultimately gives way to diplomatic negotiation.
Nonetheless, these developments are likely to inject a degree of volatility into what has otherwise been a relatively calm investment environment. On the broader “Sell America” theme, we noted on Friday that there was little concrete evidence of meaningful de-dollarisation last year. Even in a scenario where geopolitical tensions were to escalate materially, it appears unlikely that the dollar would experience a sell-off on the scale of last year’s near-10% decline, particularly given that the buy-side was then unusually under-hedged in U.S. dollar exposure.
Beyond the Greenland issue, this week may also bring clarity on the future leadership of the Federal Reserve. President Trump could announce his nominee to succeed Jerome Powell as Fed Chair. The dollar rallied on Friday after reports suggested Trump wants Kevin Hassett to remain at the National Economic Council, with Kevin Warsh now viewed as the leading candidate—an outcome that would be modestly supportive for the dollar if confirmed.
Overall, U.S. economic data are likely to take a back seat to political developments in the coming days. In the near term, the dollar may probe lower levels. For DXY, gap resistance around 99.35 could cap upside, while a corrective move toward the 98.80–98.85 zone remains the mild tactical bias.
EUR: Unwelcome Developments
The renewed tensions surrounding Greenland and the prospect of fresh tariffs are particularly negative for European industry. This comes just as industrial confidence had begun to recover, with firms appearing to have adapted to last year’s tariff-related volatility. The latest developments are likely to sharpen the focus among European policymakers on boosting domestic demand and may even add momentum to long-delayed reforms such as the Savings and Investment Union, aimed at strengthening Europe’s capital markets and enhancing their competitiveness relative to the U.S.
In FX markets, EUR/USD has established support just below 1.1600. Initial intraday resistance is seen near 1.1650, with scope for a move toward the 1.1690–1.1700 area if that level is cleared. Short-dated implied volatility for EUR/USD, both one-week and one-month, has edged higher, reflecting the elevated uncertainty surrounding the week ahead.
GBP: Poised for Relative Outperformance This Week
We believe this week’s U.K. data — November employment figures and December CPI — may offer modest support to sterling, potentially extending the short-covering rally that has been underway since late November. While EUR/GBP was initially seen as the more vulnerable cross, with downside risks toward 0.8600, early-week dollar softness could shift the bulk of the move into GBP/USD. A sustained break above the 1.3415–1.3420 zone would open scope for a move toward 1.3450–1.3460.
That said, sterling historically underperforms during pronounced risk-off phases, and the current environment remains fluid with multiple cross-currents at play.
It’s been a long, cold and snowy weekend in New York—just enough snow to keep most people glued to the couch. For anyone hoping for a brief break from markets, U.S. trading is closed on Monday.
For committed market watchers, however, Weekend Wall Street and Weekend Tech offer little comfort. Both have been under pressure following the latest developments around Greenland, with Weekend U.S. Tech CFDs down roughly 75 basis points as of 8:30 a.m. ET on Sunday. While this move is not definitive, it suggests futures could open lower when trading resumes Sunday evening at 6:00 p.m. ET.
Attention also turns to Tuesday, when the Supreme Court may issue another opinion. Given how volatility was priced on Friday, it would not be surprising to see overnight volatility dynamics re-emerge, potentially pushing implied volatility higher into the 10:00 a.m. release window.
Tuesday also marks a $14 billion Treasury bill settlement, which is expected to tighten liquidity conditions further. As a result, the session could be eventful from the outset. If overnight funding rates begin to climb this week, pressure on usage of the Federal Reserve’s Standing Repo Facility would likely increase, with the key threshold for the overnight rate seen above 3.75%.
From my perspective, the technical setup in the S&P 500 looks fragile. The index appears likely to be in negative gamma when trading resumes on Tuesday, which could further amplify volatility. The rising wedge pattern remains intact, and a decisive break below the 6,900 support level would raise the risk of a more pronounced pullback.
Ten-year Treasury yields broke higher on Friday, and much of that move may have been linked to the quarterly refunding questionnaire sent to primary dealers later in the afternoon. The most notable steepening in the yield curve occurred in the belly, which would be consistent with speculation that the Treasury is considering shifting the 7-year note from a monthly new issue to a quarterly issuance with two reopenings.
This suggests the Treasury could be preparing the market for potential adjustments to issuance size or duration in the near to medium term, though that view remains speculative. Notably, yields rose most sharply in the 5- to 7-year sector, reinforcing this interpretation.
Had the move instead been driven by expectations around Kevin Hassett no longer being considered for Fed chair, yields would likely have increased more at the front end of the curve.
Regardless of the catalyst, the key point is that the 10-year yield has broken out in a meaningful way, suggesting that a move higher may now be unfolding. While confirmation on Tuesday will be important, it is clear that market dynamics have shifted.
Futures tied to major U.S. stock indexes fell after President Donald Trump raised the prospect of imposing tariffs as part of his push to acquire Greenland. European leaders discussed possible retaliation against the measures, which they described as a form of blackmail. Gold climbed to a fresh record high, while oil prices edged lower as traders assessed Trump’s remarks and the EU’s response. Elsewhere, China’s economic growth slowed in the fourth quarter but still met Beijing’s 2025 target.
U.S. futures and global stocks decline
U.S. stock futures pointed lower on Monday as investors weighed President Donald Trump’s threat to impose tariffs on several European countries until the United States is allowed to acquire Greenland.
By 03:05 ET (08:05 GMT), Dow futures were down 404 points, or 0.8%, S&P 500 futures had fallen 66 points, or 1.0%, and Nasdaq 100 futures were off 336 points, or 1.3%.
With U.S. cash markets closed for the Martin Luther King Jr. Day holiday, the immediate reaction to Trump’s latest tariff threat will be delayed. Risk-off sentiment has spread globally, dragging equities lower across Europe and Asia.
ING analysts said Trump’s comments, following last year’s sweeping global tariffs, have pushed trade tensions into “an entirely new dimension,” driven less by economic considerations and more by political motives. They added that while past experience suggests caution in reacting to dramatic announcements, some of Trump’s threats over the past year have ultimately been carried out.
Focus on Trump’s Greenland tariffs
European leaders agreed on Sunday to intensify efforts to counter President Donald Trump’s tariff threats, with reports suggesting EU officials are considering strong retaliatory measures if the levies are imposed.
On Saturday, Trump said he would introduce 10% tariffs on exports from eight European countries—Denmark, Sweden, France, Germany, the Netherlands, Finland, Norway and the United Kingdom—until the United States is able to acquire Greenland. He added that the tariffs would be raised to 25% if the purchase of the semi-autonomous Danish territory does not go ahead. Trump has framed the move as a national security necessity, a claim European governments have rejected, describing it as blackmail.
Ahead of an emergency EU summit in Brussels on Thursday, member states are expected to debate a range of responses, including a potential €93 billion tariff package on U.S. imports and the possible use of the bloc’s “Anti-Coercion Instrument,” which could restrict U.S. access to investment, banking and services markets. Reuters, citing an EU source, reported that the tariff package currently has broader backing.
Trump’s latest tariff threat has also cast doubt over the future of a U.S.–EU trade agreement reached last year, with EU officials saying they cannot approve the deal while Washington pursues control of Greenland. ING analysts said that while the outcome of the dispute remains uncertain, it underscores the lack of predictability in global trade and tariff policy.
Gold reaches record high
Gold prices climbed to record highs in Asian trade on Monday, nearing $4,700 an ounce, as investors rushed into safe-haven assets following President Trump’s latest tariff threat.
Spot gold rose 1.6% to $4,667.33 an ounce by 02:26 ET (07:26 GMT), after earlier touching a record $4,690.75. U.S. gold futures also hit a new peak at $4,697.71 an ounce.
Silver prices surged more than 4% to a fresh all-time high of $94.03 an ounce, supported by safe-haven demand as well as its role as an industrial metal.
Oil prices edge lower
Oil prices edged lower, giving back part of last week’s gains as markets weighed the growing risk of a trade dispute linked to Greenland. Brent crude slipped 0.1% to $59.74 a barrel, while U.S. West Texas Intermediate fell 0.1% to $55.95.
Crude had rallied early last week on concerns that unrest in Iran could threaten oil supplies from the Middle East, a region that accounts for a significant share of global output. Much of that risk premium faded after President Trump ruled out immediate U.S. military action, leading prices to pull back before stabilizing toward the end of the week.
China’s economy meets 2025 growth target
China’s economy grew slightly more than expected in the fourth quarter of 2025, data released on Monday showed, as policy stimulus and a pickup in consumption helped the country meet its annual growth target.
Gross domestic product rose 4.5% year on year in the October–December period, in line with forecasts but down from 4.8% in the previous quarter, marking the slowest pace in three years. On a quarter-on-quarter basis, GDP expanded 1.2%, marginally above expectations of 1.1%.
The result brought full-year 2025 growth to 5%, meeting Beijing’s target. The government is widely expected to set a similar 5% growth goal again, as it continues to face heightened U.S. trade tensions, weak consumer demand and a prolonged property sector downturn.
Bayer AG shares rose more than 7% on Monday after the U.S. Supreme Court agreed to hear the German group’s appeal in a pivotal Roundup weedkiller case, fueling optimism that a favorable decision could reduce the company’s long-standing legal burden.
The U.S. Supreme Court said on Friday it will consider whether federal pesticide regulations override state-level failure-to-warn lawsuits when the Environmental Protection Agency has not mandated cancer warnings for glyphosate-based products.
The case, known as Durnell, stems from an October 2023 Missouri jury ruling that found Monsanto—acquired by Bayer in 2018—did not adequately warn consumers about alleged cancer risks linked to Roundup, awarding $1.25 million in damages. Other allegations were dismissed, and the jury declined to impose punitive damages. A Missouri appeals court upheld the verdict in 2025.
Bayer argues that permitting such claims weakens the EPA’s authority, noting the agency has repeatedly determined that glyphosate is unlikely to cause cancer in humans and has approved Roundup labeling without cancer warnings. The U.S. Solicitor General has supported Bayer’s stance, warning that the Missouri decision could allow juries to overrule federal scientific judgments.
Investors viewed the Supreme Court’s move as a possible inflection point in litigation that has burdened Bayer’s valuation since its $63 billion purchase of Monsanto.
PCE inflation data, the start of the fourth-quarter earnings season, a Supreme Court ruling on tariffs, and the Davos World Economic Forum will all be in focus during the holiday-shortened week ahead.
GE Aerospace appears well positioned for an earnings-driven rally, while United Airlines may face downside pressure amid weaker results and persistent sector headwinds.
U.S. equities slipped on Friday, ending the week with modest declines across the Dow Jones Industrial Average, S&P 500, and Nasdaq, as investors digested President Donald Trump’s latest remarks on the Federal Reserve and broader geopolitical developments.
For the week, the Dow Jones Industrial Average slipped 0.3%, the S&P 500 eased 0.4%, and the Nasdaq Composite declined 0.7%, while the small-cap Russell 2000 gained 2% to notch another record close on Friday.
Volatility may pick up in the week ahead as investors evaluate prospects for economic growth, inflation, interest rates, and corporate earnings against a backdrop of persistent trade and geopolitical tensions.
Over the weekend, President Donald Trump said eight NATO member countries could face tariffs of up to 25% unless an agreement is reached allowing the United States to purchase Greenland.
U.S. financial markets will be closed on Monday in observance of the Martin Luther King Jr. Day holiday. On the economic front, Thursday’s core PCE price index— the Federal Reserve’s preferred inflation measure—will be the key data release to watch.
The fourth-quarter earnings season also ramps up, with results due from several high-profile companies, including Netflix (NASDAQ:NFLX), Intel (NASDAQ:INTC), United Airlines (NASDAQ:UAL), Procter & Gamble (NYSE:PG), Johnson & Johnson (NYSE:JNJ), GE Aerospace (NYSE:GE), and 3M Company (NYSE:MMM).
Investors are additionally awaiting a U.S. Supreme Court ruling on the legality of President Donald Trump’s global tariffs, after the court declined to issue a decision last week. The justices are also set to hear arguments related to Trump’s effort to remove Federal Reserve Governor Lisa Cook.
Attention will also turn to Davos, Switzerland, where Trump is scheduled to attend the World Economic Forum, potentially generating fresh headlines.
Against this backdrop, regardless of broader market direction, I outline below one stock that appears positioned for upside demand and another that could face renewed downside pressure. These views are strictly short-term, covering the week ahead from Monday, January 19 through Friday, January 23.
Top Pick: GE Aerospace Poised for Gains
GE Aerospace is set to report earnings this week, with expectations calling for another strong quarter. Analysts are forecasting solid results, supported by robust aerospace demand and a new wave of engine orders, including Delta’s recent selection of GE’s GEnx engines for its expanding Boeing 787 fleet.
The company is scheduled to release its fourth-quarter update before the market opens on Thursday at 6:30 a.m. ET. Options markets are bracing for heightened volatility, with implied pricing suggesting a post-earnings move of approximately ±5.2% in GE shares.
Analysts are forecasting another strong quarter, with consensus estimates pointing to adjusted earnings of $1.44 per share, up from $1.32 a year earlier, alongside revenue growth of roughly 13% year over year to about $11.2 billion. Performance is being underpinned by structural tailwinds, including sustained demand for LEAP and GEnx engines—both of which are sold out for the remainder of the decade—as well as rising engine deliveries.
Investor focus is expected to center as much on GE’s forward guidance as on its headline results. Recent announcements around new orders and capacity expansions have bolstered confidence in the outlook for 2026, with analysts projecting full-year earnings of approximately $7.01 per share.
As a global leader in jet engines and aerospace systems, GE Aerospace continues to benefit from a recovery in commercial air travel and strong growth in its high-margin aftermarket services business.
GE remains in a strong upward trend, with its share price up 78.8% over the past year and trading just 2.3% below its 52-week high. Momentum indicators continue to point higher, with technical signals flashing a “strong buy” across multiple timeframes.
If GE delivers the anticipated double-digit revenue growth, maintains or expands margins, and provides upbeat commentary on future demand, the stock could extend its rally as investors further re-rate GE Aerospace as a high-quality, cash-generative industrial leader.
Trade Setup:
Entry: $326 (pre-earnings)
Targets: $340 → $350 (gain ~5%-7%)
Stop: $315 (risk ~3%)
Stock to Sell This Week: United Airlines
By contrast, United Airlines is confronting increasing headwinds ahead of its fourth-quarter earnings release, scheduled for Tuesday at 4:00 p.m. ET. While the carrier has demonstrated resilience in recent quarters, consensus expectations suggest growing challenges that could result in an earnings miss or a muted market response.
Options-implied volatility signals a potential post-earnings move of roughly ±5.9% in UAL shares, underscoring the elevated risk around the report.
Wall Street expects the Chicago-based carrier to post earnings of $2.96 per share, down 9.2% from $3.26 a year earlier. Revenue is forecast to come in around $15.4 billion, though rising operating costs, capacity-related pressures, and lingering issues such as service disruptions and softer international performance continue to cloud the outlook.
The broader airline industry remains challenged by ongoing operational strains, including flight delays, cancellations, and capacity constraints.
Adding to the uncertainty, renewed tariff pressures on European routes could further complicate United’s international operations. Heightened trade tensions and the risk of retaliatory measures may weigh on the airline’s sizable transatlantic network.
Recent technical signals reinforce the downside risk, with UAL’s one-hour indicators flashing a “strong sell” as both momentum and moving averages remain firmly tilted lower.
Against this backdrop, the stock appears vulnerable in the week ahead. Even if headline results come in near expectations, a cautious outlook or incremental pressure on key international routes could be sufficient to push shares lower.
Economic growth depends on population expansion and the formation of new households. While the idea of fewer people—less congestion, smaller crowds, and reduced strain on infrastructure—may seem appealing, the risks associated with population decline are often understated. Much like deflation, a shrinking population poses serious and potentially greater threats to long-term economic stability.
Demographers use the “total fertility rate” (TFR), defined as the average number of births per woman, as a key measure of population sustainability. A TFR of at least 2.1 is required to maintain a stable population, with the additional 0.1 accounting largely for infant mortality. Although the global TFR stood at 2.24 last year, this figure masks significant regional disparities. Excluding Africa, the global fertility rate falls well below 2.0.
In 2025, most major advanced economies reported TFRs under the replacement threshold of 2.0, underscoring the growing demographic challenge facing industrialized nations.
No major developed economy currently records a total fertility rate above the 2.1 replacement threshold. Outside of Africa, global population growth is already in decline. Historically, from 1950 to 1970, the world’s wealthiest nations averaged more than 2.7 births per woman. Since 1995, however, that figure has fallen sharply to around 1.6, reaching a record low of approximately 1.5 during the 2020–2025 period.
Globally, population growth remains marginally positive, driven largely by demographic expansion in Africa and rising life expectancy among older populations. However, Asia’s two largest economies—China and Japan—are experiencing population decline, a trend that constrains their long-term growth potential. More critically, shrinking cohorts of younger workers are increasingly unable to shoulder the financial burden of supporting aging populations that are living longer and often facing higher healthcare needs.
China has formally abandoned its long-standing one-child policy, but behavioral patterns shaped by decades of enforcement have proven difficult to reverse. Today, many young couples are reluctant to have even a single child, prioritizing career advancement and higher incomes instead. Compounding the challenge, the legacy of the policy produced severe demographic distortions. Prior to 2010, widespread prenatal sex selection—driven by the desire to raise a single male “heir” to support parents in old age—led to a significant gender imbalance, with roughly 118 male births for every 100 female births between 2002 and 2008. The result is a surplus of men and a shrinking pool of potential spouses.
In the mid-1990s, a typical Chinese household consisted of four grandparents, two parents, and one heavily relied-upon child—the so-called “young emperor.” This inverted demographic pyramid is financially unsustainable, as the burden of supporting multiple generations increasingly falls on a single income earner.
Europe faces an even steeper demographic challenge. With an average fertility rate of just 1.4 children per woman and a comparatively generous system of old-age pensions, the region confronts mounting fiscal pressure. These constraints help explain Europe’s historical reliance on the United States for security spending—a strategy that may prove risky as President Donald Trump presses European nations to assume greater responsibility for their own defense.
The United States remains in a stronger demographic position than Europe or much of Asia, in part because of its relatively effective assimilation of immigrants and higher rates of family formation in more conservative regions of the country. However, with the administration introducing tighter immigration restrictions and stepping up efforts to detain and deport undocumented workers, questions are emerging over whether there will be a sufficient supply of willing young workers to staff the growing number of factories being brought back onshore.
Another structural risk embedded in these demographic trends is the growing strain on Social Security and Medicare. These programs function as intergenerational compacts, in which today’s workers finance the retirement and rising healthcare costs of the elderly. Unlike 401(k) plans or IRAs, they are not savings vehicles but largely unfunded entitlements built on historical assumptions of higher birth rates and a broad, growing workforce.
As younger generations are increasingly less likely to marry, have children, or pursue stable, high-earning careers—instead relying more on gig-based employment—the system faces mounting pressure. These shifts raise serious concerns about the long-term sustainability of funding future benefits, particularly in a society producing fewer contributors to support the next generation of retirees.
Most Asian equities declined on Monday after U.S. President Donald Trump reignited global trade concerns by slapping tariffs on several major European countries over Greenland.
Chinese stocks limited their losses after fourth-quarter GDP data came in above expectations, with the economy also meeting Beijing’s 2025 annual growth target of 5%.
South Korean shares outperformed regional peers, driven by gains in chipmakers after U.S. memory giant Micron Technology said it would acquire a fabrication plant from Taiwan’s Powerchip Semiconductor Manufacturing for $1.8 billion.
Other regional markets largely followed the slide in Wall Street futures after Trump’s tariff threat, with S&P 500 futures dropping as much as 1% during Asian trading. U.S. markets are closed on Monday for a public holiday.
Asian stocks slip after Trump’s Greenland tariff move
Japan’s Nikkei 225 and TOPIX fell 1% and 0.5%, respectively, while Hong Kong’s Hang Seng index declined 0.8%.
Australia’s ASX 200 slipped 0.4%, Singapore’s Straits Times index lost 0.5%, and futures for India’s Nifty 50 dropped 0.4%.
Over the weekend, Trump threatened to impose trade tariffs of up to 25% on several European countries, saying the measures would stay in place until an agreement was reached for the United States to acquire Greenland.
European nations largely rejected Trump’s demands for the Danish territory, with France also reportedly preparing retaliatory economic steps against Washington.
Trump’s tariff threats compounded already elevated geopolitical tensions worldwide, keeping investors cautious toward risk-sensitive assets. Gold prices surged to a record high on Monday amid strong safe-haven demand.
Trump has repeatedly pressed for control of Greenland, arguing the territory is vital to U.S. national security. He has also floated the possibility of military action, a threat that appeared more credible following a U.S. incursion in Venezuela earlier this year.
China stocks steady as 2025 GDP hits official target
China’s CSI 300 and Shanghai Composite indexes traded within a narrow range on Monday after official data showed quarter-on-quarter GDP growth slightly exceeded expectations in the December period.
GDP expanded 4.5% year-on-year in the fourth quarter, matching forecasts and bringing full-year 2025 growth to 5%, in line with Beijing’s target.
The outcome was largely supported by resilient exports, as demand outside the United States remained strong, helping keep the manufacturing sector buoyant.
Consumer activity was also aided by ongoing stimulus measures, as policymakers worked to reverse a prolonged post-COVID confidence slump.
However, December data still pointed to uneven recovery, with fixed-asset investment contracting far more than expected and retail sales growth falling short of forecasts.
South Korean shares jump on chipmaker rally after Micron deal
South Korea’s KOSPI outperformed regional peers on Monday, climbing more than 1% on the back of gains in semiconductor stocks.SK Hynix and Samsung Electronics, the country’s two largest chipmakers, rose 0.2% and 1.9%, respectively.
Sentiment toward the memory-chip makers was boosted after rival Micron Technology announced a $1.8 billion investment to acquire a facility from Taiwan’s Powerchip Semiconductor Manufacturing.
Powerchip shares jumped 10% in Taipei trading following the announcement.Elsewhere in Asia, chip stocks retreated on Monday but remained supported by gains from last week after strong earnings from industry bellwether TSMC.
The Federal Reserve’s Beige Book released Wednesday indicated that “tariff-driven cost pressures were widespread across every district.” Out of the 12 Fed districts, only two saw mild price increases, while the remaining 10 experienced more intense price pressure. This suggests the Fed is unlikely to reduce benchmark interest rates at the upcoming FOMC meeting—unless signs of labor market weakness push them to cut rates again to support hiring.
Meanwhile, a 5.1% increase in existing home sales in December could point to a potential recovery in the housing sector. The median price of homes sold last month was $405,400, a gain of just 0.4% year-over-year, indicating that home price appreciation remains limited.
The Commerce Department reported that retail sales increased 0.6% in December, surpassing economists’ forecasts of a 0.5% gain. In addition, October’s retail sales were revised to a 0.1% decline, instead of the previously estimated 0.2% rise. Overall, 10 of the 13 retail categories posted higher sales in November, making this a strong performance that should continue to support solid GDP expansion.
Meanwhile, three missile-capable ships and an aircraft carrier are being deployed to the Middle East in a show of force aimed at pressuring Iran’s government. Crude oil markets are pricing in the possibility that Iran’s oil exports could be removed from global supply, depriving the regime of revenue. This signals that President Trump may take further action beyond sanctions and a 25% tariff on nations that trade with Iran.
Intense diplomatic efforts have been taking place between Iran and neighboring Arab countries. On Wednesday, President Trump said Iran had halted the killing of anti-government demonstrators and would not carry out death sentences against people accused of seeking to overthrow the regime. His comments suggested the U.S. might be stepping back from launching military strikes. Trump told reporters that the U.S. had received word Iran had “no plans to execute protesters.”He went on to say that new information indicated the deaths had ceased and the executions had been stopped, adding that many believed executions were scheduled for that day.
U.S. stock index futures were little changed Thursday evening as strength in tech shares and a strong report from TSMC helped Wall Street break a two-session slide.
Gains were further supported by upbeat results from Morgan Stanley and Goldman Sachs, though worries over escalating geopolitical risks in Iran limited the broader market advance.
S&P 500 futures edged up 0.1% to 6,988.50 by 18:35 ET (23:35 GMT). Nasdaq 100 futures also gained 0.1% to 25,727.0, while Dow Jones futures ticked up to 49,670.0.
Tech, chipmakers rise after TSMC’s bumper Q4
Chipmakers led Wall Street higher on Thursday after TSMC (NYSE:TSM) reported record fourth-quarter earnings and pointed to continued strong demand driven by artificial intelligence. As the world’s largest contract chip producer and a key industry barometer, TSMC surged 4.4% in U.S. trading.
Customer NVIDIA Corporation (NASDAQ:NVDA) advanced 2.2% after its report, while competitor AMD (NASDAQ:AMD) gained 1.9%. TSMC CEO C.C. Wei noted that both the firm’s clients and their own customers are still eager to secure more semiconductors amid a major buildout of AI infrastructure.
Wei also projected a steep increase in capital investment in 2026 as the company scales production to meet accelerating demand. Chip strength extended modestly into the wider tech sector, which had seen some profit-taking earlier in the week after sharp early January gains.
Wall St breaks 2-day losing streak, bank stocks gain
Wall Street’s major indexes ended a two-day slide on Thursday, helped by gains in tech stocks and upbeat earnings from several banks. Goldman Sachs Group Inc (NYSE:GS) and Morgan Stanley (NYSE:MS) jumped 4.6% and 5.8% after reporting strong December quarter results—boosting sentiment despite softer bank earnings earlier in the week.
The results effectively kicked off the fourth-quarter earnings season, with a wave of heavyweight names set to follow. Netflix Inc (NASDAQ:NFLX), 3M Company (NYSE:MMM), and U.S. Bancorp (NYSE:USB) will release earnings on Tuesday, while Johnson & Johnson (NYSE:JNJ) is due Wednesday.
Later in the week, Visa Inc (NYSE:V), Intel Corporation (NASDAQ:INTC), Abbott Laboratories (NYSE:ABT), and Intuitive Surgical Inc (NASDAQ:ISRG) are among many firms scheduled to report. By the close, the S&P 500 rose nearly 0.3%, the NASDAQ Composite added 0.25%, and the Dow Jones Industrial Average outperformed with a 0.6% gain fueled by bank strength.
The three major indexes had dropped for two consecutive sessions earlier this week amid market anxiety over escalating geopolitical tensions involving Iran.
Jerome Powell’s eight-year leadership at the Federal Reserve is ending amid significant challenges for the U.S. central bank and divided opinions among policymakers about the right approach to monetary policy. So, what might Powell’s last moves as Chair look like in this environment?
The labor market is still slightly weaker than full employment. Private sector job growth has stalled recently, and although the unemployment rate dropped a bit in December, it remains above what most economists consider the long-term natural rate.
On the inflation front, recent data are more promising. Core CPI inflation fell to 2.6% year-over-year in December from 3.1% in August. Some temporary shutdown effects may be lowering this figure by about 0.1 percentage points, and the Fed’s preferred inflation gauge, the PCE deflator, likely hasn’t improved as much. However, the overall trend for core inflation entering 2026 is clearly downward.
Given this, the Federal Open Market Committee (FOMC) likely has room to continue guiding the federal funds rate toward a neutral level in the near term. The forecast remains two quarter-point rate cuts in March and June, with the rate then holding steady at 3.00%-3.25%.
However, the opportunity for further rate reductions is narrowing. Fiscal stimulus from the recent One Big Beautiful Bill Act is expected to start boosting the economy by spring or summer. Additionally, tariff risks seem to be declining, which could also spur faster growth later in the year. The recent 75 basis points of rate cuts over the past three months will likely provide some support as well.
If labor market and inflation indicators show signs of overheating in the coming months, Powell and the FOMC might opt to pause policy adjustments and leave things steady for the next Chair. This successor could face skepticism from a committee under pressure from the Trump administration. The expectation of stronger economic growth in spring and summer further supports holding rates steady.
For now, the current forecast stands, but there is growing risk that rate cuts may be delayed or reduced compared to the baseline prediction.
TSMC (NYSE: TSM) reported a better-than-anticipated net profit for the fourth quarter on Thursday, as the global leader in contract chip manufacturing continued to capitalize on strong demand for its advanced chips driven by artificial intelligence.
The company also announced a significantly increased capital expenditure outlook for 2026, aiming to rapidly expand production capacity to keep up with growing AI-related demand.
TSMC’s CFO, Wendell Huang, revealed in a post-earnings call that the company expects its capital expenditure for 2026 to range between $52 billion and $56 billion, a substantial increase from $40.9 billion in 2025.
Huang also cautioned that TSMC’s mid- to long-term profit margins are likely to decline as the company continues expanding its production capacity, particularly in overseas locations. CEO C.C. Wei echoed these concerns, highlighting “significantly higher” capital spending and costs in the years ahead.
For the quarter ending December 31, TSMC posted a record net profit of T$505.74 billion ($16 billion), surpassing Bloomberg’s estimate of T$467 billion and significantly up from T$374.68 billion the previous year.
The company’s quarterly revenue, previously disclosed, rose to T$1.046 trillion ($33 billion), up from T$868.46 billion a year earlier. Huang forecasted first-quarter 2026 revenue between $34.6 billion and $35.8 billion.
TSMC’s strong performance was driven by robust demand for its advanced chips, with its 3-nanometer products contributing over 25% of revenue from its wafer segment.
CEO C.C. Wei indicated that the strong AI-driven demand is expected to continue in the coming years, with positive feedback from TSMC’s largest customers. He emphasized that the “AI megatrend” remains firmly in place.
While TSMC’s high-performance computing segment continues to be its primary revenue source, the smartphone chip division’s contribution increased slightly to 32% in Q4, up from 30% the previous quarter. This growth was likely boosted by Apple Inc., which incorporated new TSMC-made chips in its iPhone 17 lineup.
TSMC is also a crucial supplier of advanced AI processors to NVIDIA Corporation, a partnership that has significantly boosted its earnings and market value over the past two years.
The company has benefited greatly from a surge among major tech firms to expand data center infrastructure supporting AI development, as advanced processors are vital for handling AI models’ intense computing demands.
Last year, TSMC announced a $165 billion investment in the U.S., mainly targeting increased production capacity at its Arizona facility. This move also appears aimed at addressing the Trump administration’s push for more domestic manufacturing.
On Thursday, TSMC signaled plans to further expand U.S. production, with a goal of allocating 20% to 30% of its overall capacity to the Arizona plant.
TSMC is broadly seen as a key indicator of chip demand and the AI market trends.
ECB policymaker Martins Kazaks warned that the European Central Bank must remain vigilant as the U.S. administration’s criticism of the Federal Reserve introduces new risks to the global economic outlook. He was speaking after Fed Chair Jerome Powell was reportedly threatened with criminal charges over remarks about the renovation of the central bank’s headquarters, a move that has raised concerns about the independence of the world’s most influential monetary authority.
Kazaks, who heads Latvia’s central bank and is a contender for the ECB’s vice presidency, said such attacks resembled the politics of emerging economies and added to growing uncertainties facing the ECB, alongside the potential for an AI-driven financial bubble and China’s assertive trade practices. He stressed that risks to both inflation and growth exist on both sides, leaving no room for complacency, and warned that weakening the Fed’s independence could ultimately hurt lower-income Americans through higher inflation and interest rates. On China, he criticized subsidies, rare-earth export limits, and exchange-rate policies that restrain the yuan’s rise, suggesting they may conflict with WTO rules, and called on Europe to respond through long-overdue reforms and, if necessary, targeted industrial policy.
Kazaks said ECB interest rates remain appropriate, noting that euro zone inflation is showing positive signs, with even core inflation measures—excluding volatile items—moving closer to the ECB’s 2% target.
Today may bring another chance for the Supreme Court to issue a ruling on tariffs—we’ll know around 10:00 a.m. whether an opinion is released. The timing is notable for equities, as the S&P 500 is tightly consolidating and approaching a point where it must break in one direction. I still believe the setup looks more like a market top than the beginning of a melt-up. Technically, it could even be interpreted as a terminal diagonal triangle.
Ultimately, the key factor is volatility, which remains extremely subdued. While Tuesday did bring a notable rise in the left-tail index to 10.7—still a relatively low level—it was higher than before. In any case, we’ll find out today which way things break.
For now, interest rates seem stuck in place, with neither strong nor weak economic data moving the long end of the curve. Even the CPI report—despite undershooting on core inflation—failed to budge the 30-year yield. The setup still resembles a bull flag, but at the moment, there’s little follow-through.
If you’re looking for rising yields, Japan is where to focus. The 10-year JGB continues its steady ascent and is now around 2.17%. Based on the wedge pattern and a forward projection, the yield could push toward 2.25%.
On Tuesday, USD/JPY broke out, climbing past the 159 resistance level. Currently, the market seems to be focusing more on Japan’s fiscal spending plans than on interest rate differentials. A move up to 162 is looking more and more probable.
Software stocks took a severe hit. Shares of Salesforce (NYSE:CRM), ServiceNow (NYSE:NOW), and Workday (NASDAQ:WDAY) were heavily battered. Notably, ServiceNow has fallen back to its 2021 highs, which also align with the lows seen in April 2025.
Workday’s performance is actually even more troubling.
Salesforce seems to be holding up better than the others, but that’s not exactly reassuring. It looks like the market fears these companies might get disrupted or cannibalized by AI. Honestly, the charts across the board look pretty bleak.
WASHINGTON — On January 12, former Federal Reserve chairpersons strongly condemned the ongoing U.S. criminal investigation into current Fed Chair Jerome Powell, describing it as an “unprecedented attempt” to undermine the central bank’s independence.
Two Republican senators also criticized the Trump administration and questioned the Justice Department’s credibility in pursuing charges against Powell, whom President Trump has long aimed to replace amid his push for lower interest rates.
On January 11, Powell disclosed that the Federal Reserve had received grand jury subpoenas and faced threats of a criminal indictment related to his Senate testimony from June.
The controversy centers on a $2.5 billion (S$3.2 billion) renovation project for the Federal Reserve’s headquarters. In 2025, President Donald Trump suggested he might dismiss Chair Jerome Powell due to cost overruns related to the historic building’s refurbishment.
On January 12, former Fed Chairs Ben Bernanke, Alan Greenspan, and Janet Yellen, along with other ex-economic leaders, publicly criticized the Department of Justice’s investigation.
In a joint statement, they condemned the probe as “an unprecedented attempt to use prosecutorial attacks” aimed at undermining the Fed’s independence.
The statement added, “This is typical of how monetary policy is conducted in emerging markets with fragile institutions, often resulting in severe inflation and broader economic dysfunction.”
“Such practices are unacceptable in the United States.”
In an unusual statement on January 11, Mr. Powell criticized the administration, calling the building renovation and his congressional testimony mere “pretexts.” “The possibility of criminal charges stems from the Federal Reserve’s commitment to set interest rates based on its best judgment of the public’s interest, rather than aligning with the president’s preferences,” Powell stated.
He pledged to perform his duties “without political fear or favor.”
Separately, New York Fed President John Williams noted that historically, political interference in monetary policy often results in “unfortunate” consequences such as inflation.
Stocks Reach New All-Time Highs
Despite concerns triggered by the investigation, U.S. stock indices closed at record highs.
Bernard Yaros, lead U.S. economist at Oxford Economics, noted, “The fact that market-based inflation expectations have stayed steady suggests that investors are largely dismissing the probe as having little or no effect on the Fed’s independence.”
The Federal Reserve operates independently with a dual mandate to maintain price stability and low unemployment. Its primary tool is adjusting the benchmark interest rate, which influences U.S. Treasury yields and borrowing costs.
President Trump has frequently criticized Powell, labeling him a “numbskull” and “moron” for the Fed’s policy choices and not cutting rates more aggressively.
On January 12, White House spokeswoman Karoline Leavitt told Fox News that Powell “has proven he’s not very good at his job.” Regarding whether Powell is a criminal, she added, “That’s a question the Department of Justice will have to answer.”
Republicans Push Back Against Investigation
The Justice Department’s investigation has faced backlash from across the political spectrum.
On January 11, Republican Senator Thom Tillis, a member of the Senate Banking Committee, pledged to block the confirmation of any Federal Reserve nominee—including the next Fed chair—until the legal issue is “fully resolved.”
He stated, “The independence and credibility of the Department of Justice are now at stake.”
Another Republican senator, Lisa Murkowski of Alaska, backed Thom Tillis’ stance, describing the investigation as “nothing more than an attempt at coercion.”
Earlier, Senate Majority Leader Chuck Schumer, a leading Democrat, criticized the probe as an assault on the Federal Reserve’s independence.
David Wessel, a senior fellow at the Brookings Institution, warned of serious risks if the Fed were to come under President Trump’s influence.
Politicians might be tempted to keep interest rates low to stimulate the economy before elections, while an independent Fed is expected to set policy focused on controlling inflation and maximizing employment.
Wessel told AFP that if Trump succeeds in swaying the Fed, the U.S. could face higher inflation and reduced willingness from global investors to finance the Treasury.
Powell was originally nominated as Fed chair by Trump during his first term. His chairmanship ends in May, but he may remain on the Fed board until 2028. In 2025, Trump also attempted to remove Fed Governor Lisa Cook over allegations of mortgage fraud.
Chinese semiconductor shares climbed on Wednesday after reports said Beijing will restrict purchases of Nvidia’s H200 AI chips to limited, special-use cases. The news largely outweighed an earlier announcement that the U.S. had cleared sales of the H200 to China.
Shares of Semiconductor Manufacturing International Corp, the country’s largest chipmaker by output, rose nearly 2% in Hong Kong, while Hua Hong Semiconductor gained almost 5%. On the mainland, Cambricon Technologies and Moore Threads Technology—both promoted as domestic alternatives to Nvidia—also advanced.
According to The Information, Chinese authorities have told local technology firms that H200 purchases will only be approved under exceptional circumstances, such as for university research and development facilities. This development muted the impact of the U.S. Commerce Department’s decision to allow H200 exports to China, a move previously hinted at by President Donald Trump in late December and accompanied by strict conditions.
Beijing is seen as taking a cautious approach to the approval as it continues to pursue full self-reliance across the artificial intelligence supply chain, with chip manufacturing playing a central role due to the heavy computing demands of AI development and deployment. Although China made progress in chip production in 2025, it is still widely regarded as far from achieving complete technological independence.
Chinese technology stocks have advanced over the past week, driven by a wave of high-profile IPOs from leading domestic AI companies that boosted confidence in the sector’s growth outlook. The rally extended on Wednesday, with MiniMax Group and Zhipu—listed as Knowledge Atlas— the first of China’s so-called “AI tigers” to go public, climbing 4.4% and 17%, respectively.
The VIX 1-Day index closed below 10 on Monday, indicating that if a significant price surge follows the CPI report, it is unlikely to be driven initially by increased implied volatility. Instead, any substantial move would need to be supported by actual buying activity rather than a rise in volatility. However, volatility could still spike overnight, setting the stage for the familiar CPI-driven market reaction.
The S&P 500 appears stable for now, but I don’t believe this is the significant breakout many have anticipated since late October. Currently, the index hasn’t even fully cleared resistance at the trendline by a single bar. We witnessed similar patterns at the beginning of 2022 and 2025.
The market could keep inching up by 10, 20, or even 30 basis points, but considering the unusually low levels of both realized and implied volatility, along with one-month implied correlation at just 7, the odds aren’t in favor of a strong move. Monday’s trading volume in S&P 500 futures was so thin, it felt like December 22 all over again.
It seems the authorities have the ability to push the 3-month VIX back down to its July 2024 lows.
Perhaps those same market forces can drive the 1-month implied correlation down to 2.
Alternatively, the VXTLT bond market volatility index might decline to levels unseen since 2019.
The main takeaway is that, in my opinion, the market’s current structure is not set up for a sharp, explosive rally. While it may continue to grind upward, eventually volatility is likely to mean-revert higher, triggering a pullback similar to the one seen from late October into November.
Interestingly, despite numerous challenges in the oil market over the past four years, XLE has largely avoided a significant breakdown, instead trading mostly sideways throughout this period. If oil prices were to break out decisively and start climbing, it could signal a strong bullish trend for the sector. Currently, XLE is approaching a critical resistance level and merits close attention.
This could prove significant if oil’s breakout above the downtrend sustains and prices start climbing back into the $60 range. For now, $55 seems to be a support level, and oil remains one of the few commodities yet to make a notable upward move. It’s definitely worth monitoring for potential gains.
With holiday decorations packed away and investment professionals back at their desks, the serious market work for 2026 is officially underway. So far, investor sentiment appears optimistic, as the S&P 500 has posted a 1.76% gain—a promising start to the year.
Looking ahead, nearly every major Wall Street firm forecasts another strong year for stocks. While leadership within the market may shift, the broad consensus remains that stock prices are poised for healthy gains in 2026.
You might wonder how this optimism holds up amid concerns about AI bubbles, geopolitical tensions, inflation, and lofty valuations. Having wrestled with this question myself, I believe it’s worthwhile to step back and review the fundamental drivers underpinning the stock market.
From my experience managing money for over 40 years, I’ve learned that while short-term market movements are nearly impossible to predict, understanding the broader macroeconomic environment helps to get the major market moves “mostly right, most of the time.” Simply put, aligning with the dominant primary market cycle is my foremost objective in this line of work.
So, without wasting any time, let’s briefly review the key macro drivers: the economy, corporate earnings, inflation, the Fed and interest rates, and, naturally, valuations.
Since there’s quite a bit to cover—and I doubt many of you want to read a 5,000-word report on a Monday morning—I’ve decided to split this analysis into several parts. Today, we’ll begin with a focus on the economy and corporate earnings.
Overview of the Economy
The U.S. economy is generally divided into three main sectors: manufacturing, consumers, and government. Of these, the consumer sector—also known as the services sector—is by far the largest, accounting for roughly 70% of overall economic activity in the United States.
Because of this, the sluggish manufacturing sector, which has been in a prolonged slowdown, is less of a concern. While an improvement there would be welcome, consumer sentiment remains the primary driver of economic growth today.
It’s also important to highlight that high-income earners now dominate consumer spending. Reports indicate that the wealthiest individuals account for just over 50%—a record high—of all U.S. consumer expenditures. These affluent consumers are less sensitive to price increases and tend to maintain their spending habits despite inflation.
Indeed, the labor market has shown signs of weakening, which could eventually affect consumer spending. However, current evidence suggests that job market softness is primarily impacting lower-income consumers at this stage. This situation remains fluid—if job losses accelerate, the services sector would likely feel the impact. But for now, this hasn’t been the case.
The key takeaway is that despite negative headlines, the economy appears to be performing well. U.S. GDP growth was strong last year, moving from a slight contraction of -0.6% in Q1 to +3.8% in Q2 and +4.3% in Q3.
More recently, the Atlanta Fed’s GDPNow model—a real-time GDP estimate—registered a robust +5.4% last week.
From my perspective, anyone claiming the economy is weak or unstable is overlooking the actual data.
Company Earnings Reports
Earnings are often described as the lifeblood of the stock market, making it crucial to stay informed about corporate profit trends. To get straight to the point, corporate earnings are very strong—remarkably so.
For example, Q3 results showed about a 15% increase, significantly surpassing analyst expectations.
Looking forward, consensus estimates from Wall Street analysts predict that S&P 500 companies will see earnings grow by approximately 17.3% in 2026. Quite impressive.
Of course, analysts rarely get their projections exactly right. Estimates often start off too optimistic and are revised downward over time. So, it would be unwise to assume that 2026 earnings per share (EPS) will definitively rise by 17% compared to last year.
The important takeaway is that EPS growth is still expected to be strong this year—significantly above the historical average. (Goldman Sachs recently released a report titled “2026: An Earnings Story.”) My view is that as long as earnings come reasonably close to these expectations, there should be plenty of room for stocks to advance.
Is There Further Upside Potential?
The key question is how much further the stock indices can climb. While I’ll address valuations in the coming weeks, it’s clear to everyone that current stock multiples are quite high. This likely explains why Wall Street analysts are forecasting relatively modest gains of around 10% for the year—roughly in line with the S&P’s average annual return since 1980—even with anticipated earnings growth.
Given the strong economic outlook and expected earnings growth, it’s difficult for me to take a negative stance on the stock market.
That said, it might be prudent to temper enthusiasm somewhat due to elevated valuations. However, from a broader perspective, I believe the best approach is to stay on the bullish path and trust the market leaders to navigate any near-term challenges.
What shapes our lives are the questions we ask, refuse to ask, or never think to ask.
If economists were meteorologists, this week’s forecast would predict a data blizzard. However, clarity is expected to improve as markets receive highly anticipated reports on inflation, retail sales, and industrial production ahead of the Federal Reserve’s policy meeting on January 28.
Few economists expect Fed Chair Jerome Powell and the Federal Open Market Committee (FOMC) to ease monetary policy again later this month—and neither do we. This week’s data could either confirm or challenge that view, starting with the December consumer price index report on Tuesday.
The Fed drama intensified last week after President Donald Trump instructed Fannie Mae and Freddie Mac to purchase $200 billion in mortgage bonds—an action typically undertaken by the Fed itself. Many saw this move as an attempt to restart quantitative easing. Meanwhile, Fed Governor Stephen Miran told Bloomberg he anticipates 150 basis points of rate cuts this year.
What’s still missing, however, is significantly lower inflation and a recession that would justify such aggressive easing. This week will also feature speeches from several Fed officials, which could provide insight into the central bank’s thinking. The lineup starts with New York Fed President John Williams on Monday, followed by Governors Miran (Wednesday), Michael Barr (Thursday), Michelle Bowman (Friday), and Vice Chair Philip Jefferson (Friday).
Here’s a rundown of this week’s key data releases likely to influence the timing and scale of any future Fed rate cuts:
Inflation
Since the 43-day government shutdown in October and November, investors have struggled to gauge inflation accurately. The 2.7% year-over-year CPI rise in November, a slight dip from October’s 3.0%, was met with caution, as the shutdown likely disrupted the Bureau of Labor Statistics’ data gathering.
This increases the importance of the upcoming CPI and PPI reports, which will be key indicators before the FOMC’s January 28 interest rate decision.
The upcoming CPI report on Tuesday is expected to show a modest easing in inflation, with the Cleveland Fed’s model forecasting a 0.2% monthly increase and 2.6% year-over-year growth. The November PPI report, due Wednesday, is considered less impactful, while import and export price data for November will be released on Thursday.
Retail sales
Retail sales (Wednesday) are expected to show a slight increase in November after remaining flat in October (see chart). Overall, we believe consumer spending remains resilient despite rising living costs and soft employment figures. Additional important demand indicators this week include December existing home sales (Wednesday) and mortgage applications for the week ending January 9 (Wednesday).
Jobless claims
We anticipate layoffs will stay minimal, which has been the key insight from recent initial unemployment claims data (Thursday) (see chart). While demand for labor may be slowing in certain sectors, the feared AI-driven collapse in the job market has not materialized yet.
Composite economic indicators & business surveys
The composite cyclical indicators for December, due Thursday, are expected to show the coincident index holding at a record high, while the (mis)leading index continues its decline. Additionally, given delays in official hard data, the National Federation of Independent Business’ Small Business Optimism Index for December (Tuesday) should provide valuable insights, following its rise to 99 in November. Later in the week, the Federal Reserve banks of New York and Philadelphia will release their January business surveys (Thursday).
Our preferred coincident indicator is the S&P 500 forward earnings per share, which has accelerated in recent weeks and hit record highs (see chart).
This week, market attention will be on CPI inflation figures, retail sales data, and the kickoff of the Q4 earnings season.
Morgan Stanley is expected to see gains driven by robust quarterly results.
Meanwhile, Capital One Financial is likely to face challenges due to a proposed cap on credit card interest rates.
The stock market closed the first complete trading week of 2026 with the Dow Jones Industrial Average and S&P 500 reaching record levels, buoyed by the latest employment report.
Wall Street’s major indexes enjoyed a strong week, with the Dow Jones Industrial Average rising 2.3%, the S&P 500 gaining 1.6%, the tech-focused Nasdaq Composite climbing 1.9%, and the small-cap Russell 2000 soaring 4.6%.
Looking ahead, the upcoming week promises significant market activity as investors assess economic prospects and interest rate trends.
Key events on the economic calendar include Tuesday’s U.S. consumer price inflation report for December, which could trigger market volatility if the data exceeds expectations. This report will be released alongside producer price figures, offering a broader view of inflation, as well as the December retail sales numbers.
Additionally, the Q4 earnings season is about to begin, featuring major companies such as JPMorgan Chase, Bank of America, Wells Fargo, Citigroup, Goldman Sachs, Morgan Stanley, BlackRock, Delta Air Lines, and Taiwan Semiconductor set to report their results.
Additionally, the Supreme Court may deliver a ruling on the Trump tariffs this week, after not doing so last Friday.
No matter how the market moves, below I identify one stock expected to attract buying interest and another that might face renewed selling pressure. Keep in mind, my outlook covers just the upcoming week, from Monday, January 12 to Friday, January 16.
Morgan Stanley: Top Stock Pick to Buy
Morgan Stanley is set to deliver one of the strongest earnings reports in the financial sector this quarter, fueled by a notable rebound in mergers and acquisitions, a thriving IPO underwriting business, and strong results across its core investment banking divisions.
The company will release its Q4 results before the market opens on Thursday at 7:30 AM ET. Investors anticipate significant volatility in MS shares following the announcement, with options markets pricing in a potential move of about ±4.2% post-earnings.
Analysts hold a positive outlook, with all nine recent earnings revisions reflecting upward adjustments, highlighting Morgan Stanley’s strong presence in high-growth sectors such as AI-related financing and capital markets.
Morgan Stanley is projected to earn $2.41 per share, an 8.5% increase compared to last year, while revenue is expected to rise 9.4% year-over-year to $17.72 billion. This growth is anticipated to be driven by a rebound in global mergers and acquisitions, alongside robust performance in IPO underwriting and trading revenues.
In recent quarters, Morgan Stanley has effectively increased its market share in high-margin advisory services while sustaining its leading role in equity and debt underwriting, both of which contribute significant fee income when market conditions are favorable.
Technically, Morgan Stanley’s shares closed near $186.50 on Friday, trading above key moving averages and displaying bullish momentum ahead of the earnings report. Should the company deliver strong results with an optimistic outlook, the stock could push toward $200 shortly, making it an appealing buy for investors confident in the financial sector’s continued strength.
InvestingPro’s AI-driven quantitative model assigns Morgan Stanley a ‘GOOD’ Financial Health Score of 2.65, indicating solid capital reserves, strong liquidity, and a long history of dependable dividends.
Capital One Financial: Recommended Sell
On the other hand, Capital One Financial, a leading credit card lender, is expected to face considerable selling pressure this week following President Trump’s announcement of a temporary 10% cap on credit card interest rates. This policy, designed to alleviate consumer financial strain, poses a direct threat to the profitability of lenders that depend heavily on interest income from credit cards.
Given its large consumer credit card portfolio, Capital One is particularly exposed. With average credit card interest rates typically between 20-30%, a 10% cap would wipe out most of the company’s net interest income, which forms the backbone of its overall profits.
The proposed interest rate cap poses an urgent and substantial challenge to Capital One’s financial results, forcing the company to either accept sharply lower profits or withdraw from large segments of the credit card market that would no longer be financially viable.
Even prior to this announcement, Capital One Financial was struggling with increasing charge-offs and slowing loan growth, leaving the stock susceptible to further declines.
Shares closed around $250 on Friday, but if upcoming earnings (due January 22) reveal worsening credit quality or management signals concerns about future profitability, the stock could drop to $229 or below—a decline of 8-10% from current levels.
Whether you’re a beginner investor or an experienced trader, using InvestingPro can help you discover investment opportunities while managing risks in today’s challenging market environment.
Most Asian markets advanced on Monday, led by Chinese AI stocks amid rising optimism about the sector, though gains were limited by mounting geopolitical and macroeconomic risks. Trading volumes across the region were also muted due to a market holiday in Japan.
Technology stocks led the session, supported by gains in Chinese AI names and by following a rally on Wall Street late Friday. Weaker-than-expected U.S. nonfarm payrolls data also offered some backing, though near-term rate expectations were unchanged.
S&P 500 futures slipped 0.5% by 00:04 ET (05:04 GMT) after reports of a U.S. government probe into the Federal Reserve, which Chair Jerome Powell said was politically driven, raised concerns about the central bank’s independence.
Meanwhile, persistent global geopolitical tensions—including protests in Iran, a U.S. incursion into Venezuela, diplomatic friction between China and Japan, and the White House’s push to acquire Greenland—continued to weigh on sentiment.
Asian tech stocks rise, led by a rally in Chinese AI shares
South Korea’s KOSPI led regional gains, rising 1.2% thanks to strength in technology and semiconductor stocks. Hong Kong’s Hang Seng index climbed 0.8%, driven by gains in tech shares, while China’s mainland indices—the Shanghai Shenzhen CSI 300 and Shanghai Composite—advanced between 0.5% and 1%.
In Hong Kong, several newly listed AI companies continued their strong momentum. Z.AI, trading as Knowledge Atlas Tech (HK:2513) and recognized as China’s first publicly listed “AI tiger,” surged 25% on Monday.
Fellow newcomer MiniMax Group Inc (HK:0100) jumped over 20%, while chipmaker Shanghai Iluvatar CoreX SemiCon Co (HK:9903) gained nearly 3%. On the mainland, Cambricon Technologies Corp Ltd (SS:688256) rose by more than 3%. Taiwan’s TSMC (TW:2330), the world’s largest contract chipmaker, saw its shares increase 1.4% following strong year-on-year December sales reported last Friday.
TSMC’s solid performance, together with NVIDIA’s (NASDAQ:NVDA) recent chip launch and positive reception at the CES trade show, bolstered investor sentiment toward AI stocks.
Nevertheless, the sector was still recovering from significant losses experienced through late 2025 amid concerns about inflated valuations and circular investment patterns in AI.
Asian stocks open 2026 with mixed performance amid tech gains and geopolitical concerns
Broader Asian equities climbed on Monday, although the region still showed a mixed performance in the early weeks of 2026. A surge in technology stocks helped lift markets, but rising geopolitical tensions around the world dampened appetite for risk assets over the past week, counterbalancing much of the tech‑led rally.
South Korea’s KOSPI and Japan’s Nikkei 225 were among the strongest performers in the opening week, and Chinese benchmarks also finished higher, while indices with less tech exposure underperformed. Singapore’s Straits Times Index gained 0.7%, continuing its advance after the government signalled potential changes to sovereign wealth fund investment rules for GIC and Temasek. Australia’s ASX 200 rose 0.5%, supported by gains in mining stocks as precious and base metals strengthened.
In contrast, India’s Nifty 50 lagged its regional peers, dropping 0.5% amid increasing uncertainty over potential new U.S. trade restrictions on New Delhi. Geopolitical developments—including a U.S. intervention in Venezuela, ongoing diplomatic tensions between China and Japan, fears of possible U.S. action against Iran, and slow progress toward a Russia‑Ukraine ceasefire—kept market sentiment cautious.
Last year was another strong period for the world’s top technology firms, known as the Magnificent 7. While artificial intelligence clearly provided a boost, these companies’ core business performance remained robust even without AI-driven growth, continuing to deliver steady revenue increases and strengthening competitive advantages that few rivals can match. They remain central to some of the most powerful and lasting secular trends shaping the global economy. This strong foundation persists as we enter 2026, though individual positioning within the group has started to vary.
Interestingly, Meta Platforms (META) and Amazon (AMZN)—which were the two weakest performers in 2025—now appear to be among the best positioned for gains in the coming year, along with Alphabet (GOOGL). This doesn’t rule out further upside potential for the rest of the group, but it does indicate a shift in relative opportunities. Below, I detail the changing dynamics for each of the Magnificent 7 and share insights on how to approach trading them in 2026.
Amazon, Meta Platforms, and Alphabet Stocks Take Center Stage
After trailing the broader group in 2025, Amazon and Meta Platforms seem poised for a strong recovery in the coming year. Both companies continue to show steady revenue and earnings growth, but their stock prices have lagged, resulting in some of the most attractive valuations seen in years. Meta is currently trading at about 21.9 times forward earnings, while Amazon is around 30.7 times—both significantly below their historical averages. According to analyst ratings, Meta holds a Zacks Rank of #3 (Hold), indicating stable earnings revisions, whereas Amazon has a more favorable Zacks Rank of #2 (Buy).
Technical indicators also favor both Meta and Amazon. Meta’s shares have been trading within a narrow range recently, a pattern that often signals an impending breakout. Amazon shows a similar pattern but has already begun to move upward, breaking out on strong volume just yesterday.
From a fundamental perspective, both companies have strong bullish catalysts. Amazon is actively pursuing various AI-driven growth opportunities, particularly through AWS, where demand for cloud computing services remains strong. Meta has been one of the most effective users of AI in its advertising platform, converting technological advances into better monetization and higher margins. Additionally, Meta’s recent acquisition of Manus AI, though relatively low-profile, could be strategically important. Manus stands out among large language model (LLM) applications for its sophistication and may help Meta reestablish itself as a serious competitor in consumer-facing AI, an area where it has previously fallen behind.
In contrast, Alphabet was the best performer in the group last year as the market finally recognized its AI strengths. Its large language model is among the industry’s top, and its vertically integrated hardware ecosystem—centered on proprietary TPUs—provides a strong and unique competitive edge. Alphabet’s shares are now emerging from their own consolidation phase, indicating potential for further gains.
Together, these three companies present a well-rounded investment opportunity: two former laggards with improving technical and valuation setups, and one established leader continuing to deliver. In all cases, AI acts as a powerful catalyst, but not the sole basis for investment.
Nvidia and Microsoft Continue to Show Strong Potential
Microsoft (MSFT), a dominant force in global technology, has experienced a pause in its share price momentum in recent months, with little sustained progress since early summer and a slight decline during the fourth quarter. However, this consolidation seems to be settling. The stock has consistently tested a critical support level but has yet to break significantly below it, indicating that downward pressure may be easing.
On the fundamentals side, Microsoft’s outlook is strengthening. Earnings estimates have seen modest upward revisions, contributing to a Zacks Rank of #2 (Buy) for the stock. As long as the shares remain above the key support level around $470, the risk-to-reward ratio looks increasingly favorable.
Nvidia (NVDA) currently holds a Zacks Rank of #1 (Strong Buy), reflecting unanimous upward revisions to earnings estimates across various time frames. In just the past 60 days, analysts have increased next year’s EPS forecasts by about 16%, signaling continued positive surprises in its fundamentals.
The company’s valuation remains attractive relative to its growth prospects. Nvidia trades at roughly 40.1 times forward earnings, while its long-term EPS is expected to grow at an annualized rate of around 46% over the next three to five years. This results in a PEG ratio below 1—a rare and favorable setup for a company of this size.
Importantly, Nvidia is actively advancing despite its dominant position in the AI market. It is investing heavily across the entire AI technology stack, with a growing focus on next-generation architectures and inference optimization, which is set to become an increasingly lucrative area as AI workloads expand. This strategy was further supported by Nvidia’s recent acquisition and partnership with chip startup Groq, enhancing its capabilities in low-latency inference and performance-optimized chip design ahead of the upcoming Rubin architecture. These moves keep Nvidia firmly on investors’ radar.
Apple and Tesla Stocks Experience a Downward Trend
Although both Apple (AAPL) and Tesla (TSLA) experienced rallies late last year, their price trends remain concerning as we head into 2026. They are currently the only two stocks among the Magnificent 7 clearly trading in sustained downtrends, highlighting a shift in leadership within the group.
Tesla’s story remains ambitious, with Elon Musk emphasizing long-term prospects like autonomous driving and humanoid robots. However, investors are now focused more on near-term fundamentals, which have weakened. Tesla’s top-line growth has stalled since 2023, and its market share declined after being overtaken by BYD as the world’s largest EV producer last year. So far, there’s little sign of a meaningful rebound in vehicle demand.
Valuation also poses a major challenge for Tesla. It currently trades at over 200 times forward earnings and about 13 times forward sales—levels that surpass most high-growth, high-margin software firms. While Tesla has historically commanded premium valuations, slowing growth and changing market sentiment increase the risk of downside in the near to medium term.
Apple, on the other hand, doesn’t face the same fundamental risks but appears less attractive compared to its peers. The company has taken a cautious approach in the AI race, choosing not to match competitors’ aggressive infrastructure investments. Although this initially hurt sentiment amid fears Apple might fall behind, this strategy has proven more justifiable over time. Apple remains the world’s leading platform for mobile computing and consumer devices, positioning it as a key distribution channel for AI-powered applications in the future. Nevertheless, with fewer immediate catalysts and weaker momentum, Apple currently lags behind other Magnificent 7 stocks from a trading standpoint.
How Investors Can Position Themselves Within the Magnificent 7
As we enter 2026, the Magnificent 7 continue to present a wide range of opportunities. Variations in earnings momentum, technical trends, and near-term catalysts offer multiple ways for investors to engage—whether by riding the momentum of leaders or capitalizing on laggards poised for a rebound.
For investors, the key is to focus on areas where strong fundamentals align with positive price action. When approached thoughtfully, the Magnificent 7 should remain a central source of opportunity throughout 2026, not only as a group but also through the unique trajectories each company follows as the market cycle progresses.
Semiconductor Stocks to Consider Beyond Nvidia
The soaring demand for data is driving the next digital gold rush in the market. As data centers keep expanding and upgrading, the hardware suppliers behind these giants are set to become the NVIDIAs of the future.
One lesser-known chipmaker is uniquely poised to capitalize on this next phase of growth. It focuses on semiconductor products that industry leaders like NVIDIA don’t produce. This company is just starting to gain attention—exactly the kind of opportunity investors want to spot early.
Reflecting on the start of this century, the first striking observation is our national shortsightedness. After surviving Y2K and the dot-com crash in 2000, our leaders assumed the path ahead would be smooth sailing from year one onward.
However, reality proved otherwise, beginning with a series of black swan events, notably the attacks on the World Trade Center and Pentagon on September 11. While such events are inherently unpredictable, it’s remarkable that the Congressional Budget Office (CBO) economists confidently forecasted in 2001 a future of continuous budget surpluses, anticipating the complete elimination of national debt by 2011.
For reasons unknown, the CBO issues 10-year federal spending and revenue projections, despite having no solid factual or practical foundation to accurately forecast beyond a year or two—akin to trying to predict the weather a year in advance.
The January 2001 CBO report highlights this myopia. Their projections simply extended current trends indefinitely without grounding in reality. Under this unrealistic mandate, the CBO projected a cumulative surplus of $5.6 trillion for 2002–2011.
In reality, deficits over that decade totaled $6.1 trillion—a swing of $11.7 trillion. It would have been much simpler to just flip a plus sign to a minus. The projections failed to account for the soaring costs of Bush’s “War on Terror” post-9/11, which led to prolonged wars in Afghanistan and Iraq, the bursting of the real estate bubble, and massive TARP bailouts to rescue large banks.
In short, this is a summary of CBO’s flawed foresight:
The first takeaway from this bleak forecast is that the CBO economists assumed deficits would increase in a smooth, predictable fashion—almost as if they were drawing a straight line with minor fluctuations, rather than reflecting the unpredictable realities of economic growth.
A second point is that the 2003 Bush tax cuts were not the main driver of the deficits. In fact, annual deficits dropped significantly—from $413 billion in fiscal year 2004 (which began October 1, 2003) to just $161 billion in fiscal year 2007. This means the deficit shrank by more than half during the four years following the tax cuts and before the 2007 real estate crash.
While much of this now feels like distant history, the ongoing wars and the Federal Reserve’s drastic response to the 2008 financial crisis—keeping interest rates near zero for eight years, essentially through the entire Obama administration—contributed to massive deficits that have persisted through to today, especially in the five years following the COVID-19 pandemic.
Since 2001, U.S. federal deficits have averaged about $1 billion annually, but that figure has surged to over $2 trillion per year since 2020, according to the U.S. Treasury.
Today, the total federal deficit stands at $38 trillion, which amounts to roughly $110,000 owed per American—far from the anticipated surpluses once projected.
Following a Challenging 2000–2009, Markets Surged in the First Quarter
What about the markets? After nearly a “lost decade” lasting nine years from March 2000 to March 2009, all major market indexes have experienced remarkable growth—particularly gold relative to the U.S. dollar.
By March 9, 2009, three of the four major indexes—the S&P 500, NASDAQ, and Russell 2000—had fallen by 50% since the decade began (while the Dow was down 40%), but they bounced back strongly from 2009 through 2025:
Over the same 25-year period, the Consumer Price Index (CPI) increased by 83%, which means the real market gains were somewhat diminished.
The U.S. dollar performed even worse, losing about 10% in value overall (and 8% against the euro), while gold and silver surged more than 15 times in value:
The first-quarter returns were decent, but the strong performance of gold and silver signals that the dollar—and the CBO’s deficit forecasts—cannot be relied on in the long run. In fact, President Trump has set a goal for 2026 to deliberately weaken the dollar against the Chinese yuan to “help” exporters boost overseas sales. Much of the talk about the dominance of the “King Dollar” is just rhetoric. In reality, many politicians aim to devalue their currencies to encourage trade, turning paper money into a “race to the bottom,” while gold quietly holds its value, watching from the sidelines.
This brings us to the 2025 summary—a major victory for precious metals as the dollar dropped by 10%.
2025 Brought Massive Gains for Precious Metals
The year 2025 exemplified the key trends seen over the past 25 years—while the stock market continued to climb, gold and silver surged even faster. Although inflation is easing, gold today serves less as an inflation hedge and more as a safeguard against crises, a hedge against the dollar, and increasingly, a hedge against cryptocurrency volatility.
In 2025, the U.S. Dollar Index (DXY) dropped by 10%, allowing major global currencies to gain between 5% and 15%. Meanwhile, the poorest-performing investments of 2025 brought good news for consumers through lower food and energy prices:
So, if 2026 mirrors the gains of 2025, it will surely be a rewarding year for most investors.
The self-driving car industry has experienced a cycle of high hopes, costly setbacks, and ongoing delays. From Tesla’s (NASDAQ:TSLA) frequent missed deadlines to General Motors (NYSE:GM) shutting down its Cruise autonomous division following a pedestrian accident, achieving fully autonomous vehicles has been much tougher than early developers expected.
However, a fresh wave of innovation driven by artificial intelligence and strategic collaborations is revitalizing this groundbreaking technology.
At the forefront of this resurgence is Nvidia (NASDAQ:NVDA), the chipmaker whose leadership in AI computing is now expanding into the automotive sector, providing Western car manufacturers with a potential way to rival China’s rapidly progressing autonomous driving advancements.
The Present State of Autonomous Driving in the U.S.
The U.S. self-driving industry is currently at a critical juncture, with only a few companies still seriously competing. In 2019, Tesla CEO Elon Musk confidently predicted that a million autonomous vehicles would be on the roads within a year. However, the company only rolled out a limited robotaxi pilot program in late 2025, falling six years behind schedule. A major challenge has been the countless unpredictable scenarios, known as edge cases, that can confuse autonomous systems.
Traditional automakers have mostly pulled back from the sector. General Motors shut down its Cruise autonomous division following a serious incident where one of its vehicles hit and dragged a pedestrian.
Similarly, Ford Motor ceased its internal autonomous vehicle projects, choosing to withdraw from the capital-heavy competition. Alphabet’s (NASDAQ:GOOGL) Waymo remains the only company maintaining consistent operations, currently offering Level 4 robotaxi services in several U.S. cities.
At the same time, China has made significant advances supported by strong government backing and rapid deployment. Chinese automakers now account for about seventy percent of global electric vehicle production, while companies such as BYD, Baidu, and Pony.ai are growing their robotaxi services throughout Asia and the Middle East.
The Chinese government recently authorized two vehicles with Level 3 autonomous driving capabilities, permitting hands-free driving. This regulatory endorsement, along with better network infrastructure and more affordable costs, has established China as a rising leader in autonomous technology.
Nvidia’s Self-Driving Platform: Revolutionizing the Industry
At CES 2026 in Las Vegas, Nvidia introduced its solution to the autonomous driving challenge: the Alpamayo platform. Simply put, Alpamayo is a comprehensive toolkit that enables automakers to develop self-driving systems without starting from zero.
The platform features reasoning models that help vehicles interpret and respond to their environment, simulation tools for safely testing various scenarios, and datasets for training the AI. It can process data from cameras and radar sensors to make decisions on steering, braking, and acceleration while also providing explanations for its choices.
What makes Alpamayo especially noteworthy is that Nvidia has made it open-source, allowing any company to use and adapt it freely. This approach contrasts sharply with Tesla’s proprietary model.
Industry experts liken this to the smartphone battle between Apple’s (NASDAQ:AAPL) closed ecosystem and Android’s open platform. By offering a shared foundation, Nvidia empowers automakers to concentrate on differentiating their products rather than reinventing fundamental technology, potentially speeding up the entire industry’s development.
The platform is quickly gaining momentum. Mercedes-Benz revealed that its upcoming CLA model will incorporate AI-driven driving features powered by Nvidia’s technology, set to hit U.S. roads later this year. Additionally, a robotaxi partnership involving Lucid Group, Nuro, and Uber plans to leverage Nvidia’s chips and platform.
Ali Kani, Nvidia’s general manager of the automotive division, expressed optimism that recent fundamental AI improvements have resolved critical issues that once hindered self-driving technology, indicating the industry might be nearing a major breakthrough.
NVDA Share Forecast and What Investors Should Know
Nvidia’s stock mirrors its leading position in several AI-driven markets. As of January 2026, NVDA shares are trading around $185 each, with a market cap near $4.5 trillion, ranking it among the world’s most valuable companies.
The stock has delivered remarkable returns, rising more than 32% in the past year and an impressive 1,297% over five years, significantly outperforming the S&P 500’s 81% gain during the same timeframe.
Despite its high valuation, key financial indicators remain strong. In Q3 FY26, Nvidia reported revenues of $57 billion and earnings of $31.8 billion, surpassing analyst expectations for earnings per share by four cents.
The trailing price-to-earnings (P/E) ratio stands at about 46, while the forward P/E is 24, reflecting the market’s high growth expectations. However, a PEG ratio of 0.70 indicates that the stock’s valuation could be reasonable relative to its anticipated earnings growth. Nvidia continues to demonstrate strong profitability, with a profit margin above 53% and a return on equity exceeding 100%.
Analysts generally hold a positive outlook on Nvidia’s future. The average price target of $252 suggests about a 36% potential increase from current levels, with forecasts ranging from $140 on the low side to $352 at the high end. Most analysts have Buy or Strong Buy ratings, highlighting sustained strong demand for AI infrastructure.
While Nvidia’s automotive division offers a growing avenue beyond its core data center business, investors should be aware that the stock exhibits high volatility, with a beta of 2.31. The upcoming earnings report on February 25, 2026, is expected to shed more light on the company’s progress.
In our December report, we combined the Elliott Wave (EW) Principle with average midterm election-year seasonality and the Armstrong Pi-cycle turn dates to analyze the S&P 500 (SPX). We concluded that:
“… As long as the index remains above the November 21 low of 6720, it can position itself for a subdividing final 5th wave (gray waves W-i, ii, iii, iv, and v), potentially reaching as high as 7490 around April 18-28, 2026.”
Since then, the SPX has risen nearly 2% and appears to be unfolding as expected. With new price data now available, we have revised our short- to intermediate-term EW count but kept the same ultimate upside target range of approximately 7345-7490. Please refer to Figure 1 below.
Figure 1: Intermediate Elliott Wave analysis for the SPX.
Assuming the price stays above the specified warning levels*, with each additional breach raising the probability of the uptrend ending by 20%, we anticipate the index to ideally reach around 7100 for the blue W-iii wave, then decline to roughly 7015 for the blue W-iv wave, followed by a rally to approximately 7160 ± 40 for the orange W-3 wave, and so on. The current pattern depicts a standard impulse wave; however, the green W-5 wave could potentially form an overlapping ending diagonal, leading to an overlapping rally toward the lower boundary of the target zone (around 7345). At this stage, there is no sign that this scenario will unfold. Nevertheless, it’s important to note that once the green W-5 completes—expected around April 18-28—we anticipate a bear market similar to that of 2022 before a larger, multi-year rally to new all-time highs can commence.
Zenas BioPharma, Inc. (NASDAQ: ZBIO) disclosed in a Form 4 filing that Chief Executive Officer Leon O. Moulder Jr. acquired 100,000 shares of the company’s common stock across three transactions between January 7 and January 9, 2026. The total value of the purchases was approximately $1.639 million, with share prices ranging from $16.30 to $16.55.
Moulder bought 50,000 shares on January 7 at a weighted average price of $16.38, through multiple trades executed between $16.21 and $16.53. On January 8, he added 30,000 shares at an average price of $16.30, with individual transactions ranging from $15.82 to $16.60. The final purchase occurred on January 9, when he acquired 20,000 shares at a weighted average of $16.55, with prices between $16.05 and $16.87.
After these transactions, Moulder directly holds 366,155 shares of ZBIO stock. He also has voting and investment authority over an additional 36,928 shares held in a trust and 1,672,039 shares held indirectly through Tellus BioVentures LLC.
Separately, Zenas BioPharma recently announced favorable results from its Phase 3 INDIGO study of obexelimab for Immunoglobulin G4-Related Disease (IgG4-RD). The trial showed a 56% decrease in flare risk versus placebo and met all primary and secondary endpoints with statistical significance. However, Morgan Stanley downgraded the stock from Overweight to Equalweight and reduced its price target from $37 to $19, noting that the reported hazard ratio of 0.44 did not fully meet investor expectations.
In contrast, H.C. Wainwright reiterated its Buy rating and set a $44.00 price target, highlighting the trial’s clinically meaningful outcomes. Jefferies likewise maintained a Buy recommendation but lowered its target from $62.00 to $48.00, citing a higher-than-expected proportion of recurrent patients in the study. Analyst responses have been mixed, underscoring differing views on the trial’s implications. The study enrolled 194 participants and delivered notable reductions in investigator-reported flares as well as in the need for rescue therapy.
Most Asian stock markets saw modest gains on Friday, following a mixed close on Wall Street as investors remained cautious ahead of crucial U.S. jobs data that could influence expectations for future Federal Reserve interest rate cuts.
U.S. markets closed Thursday with mixed results: technology stocks pulled back after recent advances, putting pressure on the Nasdaq, while the Dow and S&P 500 showed little movement.
Futures for major Wall Street indexes remained mostly flat during Friday’s Asian trading session.
Asian stocks mostly flat as Nikkei posts gains
Asian markets showed limited movement, reflecting investor caution, with the technology sector leading declines.
South Korea’s KOSPI index remained mostly flat after reaching record highs earlier in the week, as chipmakers Samsung Electronics (KS:005930) and SK Hynix (KS:000660) dropped between 1.5% and 3%.
Australia’s S&P/ASX 200 gained 0.3%, while Singapore’s Straits Times Index held steady.
Futures for India’s Nifty 50 also remained largely unchanged.
In contrast, Japanese stocks outperformed the region, with the Nikkei 225 rising 1% and the broader TOPIX index increasing 0.3%. A weaker yen against the U.S. dollar supported exporters’ prospects.
Looking ahead, investor attention is focused on the U.S. nonfarm payrolls report expected later on Friday, which could offer crucial insights into the health of the world’s largest economy and influence the Federal Reserve’s monetary policy outlook.
China’s December CPI reaches highest level in 3 years, PPI deflation slows
In China, official data released on Friday showed consumer inflation rose to its highest level in nearly three years, offering tentative signs of improving demand.
The consumer price index increased 0.8% year on year in December, the fastest pace in about 34 months, while monthly prices rose 0.2%. At the same time, producer price deflation eased, indicating some stabilization in factory-gate prices.
The data indicated that China could be nearing an end to a prolonged deflationary period that has dampened economic growth, squeezed corporate earnings, and restrained consumer spending.
China’s blue-chip Shanghai Shenzhen CSI 300 index gained 0.3%, while the Shanghai Composite rose 0.6%. Hong Kong’s Hang Seng traded flat.
The S&P 500 ended Wednesday down roughly 34 basis points. The index now appears to be forming a possible 2B reversal top after failing to sustain a breakout to new highs. Instead, it turned lower and finished the session back near support around 6,920.
If the index cannot clear the 6,950 level and subsequently falls below 6,920, it could open the door toward the 6,835 area. More broadly, the S&P 500 has shown little net progress since late October, and such a move would also threaten the uptrend established from the November 21 lows. As a result, the index looks more exposed to downside risks than it might initially suggest.
BTIC S&P 500 Total Return Futures (EFFR) for the December 2026 contracts declined again on Wednesday, reaching their lowest level since March 2024. While some may interpret this as bullish on the basis that financing costs are easing, it is difficult to identify periods when the S&P 500 advanced while these contracts were falling—at least based on my observations. To me, this is clearly bearish and suggests that demand for leverage is weakening or that positions are being unwound.
Implied volatility increased on Wednesday ahead of Friday’s employment report and upcoming Supreme Court opinions, which could include a ruling on tariffs. Kalshi currently assigns a 30% probability that the Court upholds the tariffs, implying a 70% likelihood that they are overturned.
I anticipate implied volatility will keep increasing as we approach this news event. The VIX 1-day is likely to rise significantly by Thursday afternoon and could continue climbing after the jobs report, given that the Supreme Court rulings are expected later that day. In my view, a VIX 1-day reading between 15 and 20 appears very probable.
The ISM service index suggests potential positive revisions for fourth-quarter GDP growth. On Wednesday, the Institute for Supply Management (ISM) reported that its non-manufacturing service sector index increased to 54.4 in December from 52.6 in November, marking the third consecutive month of expansion and the fastest pace of growth in over a year.
The new orders sub-index rose sharply to 57.9 from 52.9, while business activity climbed to 56 from 54.5. Additionally, new export orders improved to 54.2, up from 48.7 in November. Out of 16 surveyed service industries, 11 showed expansion in December.
Conversely, the ISM manufacturing index fell to 47.9 in December from 48.2 the prior month, continuing its contractionary trend for the tenth straight month (a reading below 50 indicates contraction). Only 2 of 17 manufacturing industries—Electrical Equipment, Appliances & Components, and Computer & Electronic Products—reported growth, likely supported by strong data center demand.
ADP’s December report showed private payrolls increasing by 41,000, missing economists’ expectation of 48,000. This follows a loss of 29,000 private jobs in November, meaning just 12,000 private jobs were created over the last two months. Manufacturing shed 5,000 jobs in December, while education and health services added 39,000, and leisure and hospitality gained 24,000 jobs. Regionally, the West lost 61,000 private sector jobs, while the South led with a gain of 54,000.
Residential investment acted as a 5.1% drag on GDP growth during the second and third quarters. Strengthening GDP going forward will depend largely on stabilizing the residential real estate market, which remains sluggish due to high mortgage rates, rising insurance costs, and an oversupply in several key areas. According to the Intercontinental Exchange, prices for U.S. condominiums dropped 1.9% in September and October, with high homeowners association (HOA) fees and insurance expenses cited as major factors. In nine major metropolitan regions, over 25% of condominiums have fallen below their original sale prices. While multiple Federal Reserve rate cuts could help support home prices, the current weakness is fueling deflationary concerns that the Fed needs to address.
If deflation emerges from (1) weak housing and rental prices, (2) low crude oil prices, and (3) deflation imported from China and other struggling global economies, the Fed may need to implement rapid interest rate cuts totaling around 100 basis points. With President Trump expected to nominate a new Fed Chair soon, current Chair Jerome Powell is likely to become a lame duck. Minutes from the December Federal Open Market Committee (FOMC) meeting indicated at least one more 0.25% rate cut is probable, but any further deflationary signals could prompt the Fed to enact much larger reductions in key rates in the coming months.
President Trump is expected to nominate a new Federal Reserve Chair in January who will likely reverse the Fed’s current restrictive policies and adopt a more pro-business stance. Should Kevin Hassett, the current Chair of the Council of Economic Advisors, be appointed, the Fed would gain a strong economic advocate, a development that many find promising and exciting.
U.S. stock index futures were mostly flat on Wednesday evening, after Wall Street’s major benchmarks ended the session broadly lower from record highs, as investors looked ahead to key U.S. employment data due later this week.
S&P 500 futures edged up 0.1% to 6,967.0, while Nasdaq 100 futures were little changed at 25,837.25 by 20:03 ET (01:03 GMT). Dow Jones futures also added 0.1% to 49,263.0.
Wall Street Pulls Back From Record Highs Ahead of U.S. Jobs Data
During the session, the S&P 500 declined 0.3%, while the Dow Jones Industrial Average dropped 0.9%. In contrast, the Nasdaq Composite added 0.2%, supported by selective gains among large-cap technology stocks that helped offset broader market weakness.
Both the S&P 500 and the Dow had reached record highs in the previous session, and the mixed performance pointed to some profit-taking after the recent rally.
Figures from payroll processor ADP showed that private-sector job growth in December came in below expectations, signaling a slowdown in hiring momentum toward year-end.
Although the ADP report is often seen as volatile and not always a reliable guide to official government data, it added to evidence that the labor market may be gradually cooling.
Focus now shifts to Friday’s highly anticipated nonfarm payrolls report, which is expected to offer clearer insight into employment trends and wage growth. The data will be closely watched by markets evaluating the probability and timing of potential Federal Reserve rate cuts in the months ahead. Weaker-than-expected job growth could reinforce expectations that the Fed may begin easing policy earlier in 2026.
Attention on rising tensions between the US and Venezuela
Geopolitical strains continued to run high after U.S. forces apprehended Venezuelan President Nicolás Maduro, yet financial markets have so far exhibited only limited, short‑lived reactions to the dramatic turn of events. Investors appear to be largely unfazed by the heightened political risk, although the episode has introduced fresh uncertainty into the outlook for energy markets. U.S. President Donald Trump stated that Venezuela’s interim leadership would transfer up to 50 million barrels of crude oil to the United States.
After a sharp decline, three insiders stepped in to buy shares of U.S. apparel giant Nike.
On December 19, 2025, Nike experienced its steepest drop in some time, with shares tumbling 10.5% following the release of its latest earnings report. The results were mixed—highlighted by strong growth in running products but disappointing performance in China. Despite some positives, the market’s reaction indicated a notable decrease in investor confidence regarding Nike’s recovery prospects.
In this article, we examine the recent insider purchases, including buys from Nike’s CEO Elliott Hill and Apple CEO Tim Cook. Their actions suggest a bullish outlook on the stock, signaling a potential opportunity. But should investors follow their lead or approach Nike stock with caution?
Nike gains $3.5 million buy-in from independent directors, boosting investor confidence
Following Nike’s earnings report, the stock fell sharply below $60 per share— a level not seen since May 2025. On December 22, Tim Cook made a notable move, purchasing approximately $2.95 million worth of Nike shares at an average price near $59 each. Cook has been closely involved with Nike for many years.
He joined Nike’s Board of Directors in 2005 and currently serves as the Lead Independent Director. While independent directors are not company employees nor have other business ties beyond their board roles, they provide crucial oversight by advising management and balancing executive power.
As Lead Independent Director, Cook plays a key role in holding Nike’s management accountable and assessing their performance to ensure they act in shareholders’ best interests.
Notably, independent director Robert Swan also bought $500,000 worth of Nike shares on December 22, 2025. The purchases by Cook and Swan demonstrate that Nike’s independent directors remain confident in the company’s future direction.
Nike insiders Hill, Cook, and Swan signal confidence through recent share buys
These two purchases become even more significant when viewed alongside a recent insider buy by Nike CEO Elliott Hill. On December 29, 2025, Hill acquired just over $1 million worth of shares at an average price of approximately $61.
While Hill’s purchase alone is a bullish indicator, the combined activity of these three insiders strengthens the overall positive outlook. It indicates that both Nike’s management and its independent directors share confidence in the stock’s potential recovery.
Typically, management and independent directors serve as checks and balances to each other, so this consensus is a promising sign. It suggests that Hill’s optimism is supported by those tasked with scrutinizing his strategies. However, there remains the possibility that these insider buys were aimed at bolstering investor sentiment, making it somewhat challenging to gauge their true conviction.
Following a dip to just above $57 on December 22, 2025, Nike’s shares have surged nearly 13% to around $64.50. The stock climbed more than 4% on two occasions, largely driven by the impact of these insider purchases.
Limited short-term upside seen by analysts, with strong long-term growth prospects
Despite the optimism shown by Hill, Cook, and Swan, market consensus remains uncertain. The average price target for Nike stands just below $76, suggesting about an 18% potential gain.
However, MarketBeat’s data reveals that over 15 analysts lowered their price targets following Nike’s December 18, 2025 earnings report. The revised average target is around $69, indicating a more modest upside of approximately 7%.
For Nike to succeed moving forward, increasing sales growth while minimizing discounting is critical. Achieving this would boost profit margins and help reverse the recent decline in free cash flow.
Though progress in this area has been limited so far, Nike’s strong brand recognition offers significant leverage to improve these metrics. Currently, shares trade about 47% above their 10-year low but would need to climb roughly 158% to match their 10-year high.
While the long-term outlook appears generally positive, the possibility of short-term declines persists as long as investors remain unconvinced by Nike’s progress.
Market Trend Structure (often called Market Structure) describes how price moves over time by forming highs and lows. It helps traders understand trend direction, strength, and possible reversals.
Types of Market Trend Structure
Why Market Trend Structure Is Important
✔ Identifies trend direction ✔ Helps with entry & exit timing ✔ Improves risk management ✔ Works across all markets:
Stocks
Forex
Crypto
Commodities
✔ Valid on all timeframes
Some other market trend patterns
Understanding market trend patterns requires a strong foundation in fundamental knowledge to be truly effective.
Gold and silver prices rose as investors sought safe-haven metals amid heightened geopolitical tensions following the U.S. capture of Venezuelan leader Nicolás Maduro.
The capture of Venezuela’s President Maduro has raised concerns about how quickly the country can increase oil production, with analysts skeptical about major oil companies committing new investments amid the ongoing uncertainty.
Crude oil prices fluctuated as traders weighed the impact of Maduro’s capture on global supply and Venezuela’s energy sector. Brent crude dropped up to 1.2% before bouncing back near $61 per barrel, while WTI stayed above $57. Despite the instability, Venezuela remains a relatively small supplier in an already oversupplied market.
U.S. airlines are resuming Caribbean routes after a U.S. military operation in Venezuela caused regional airspace closures, which stranded thousands of travelers. Airlines like American and Delta responded by adding extra flights and larger planes, with American alone providing nearly 5,000 additional seats.
Upcoming jobs data, particularly the January 9 report, is set to influence markets. Labor market softness prompted the Fed to cut rates in its last three meetings in 2025, supporting stocks, but the potential for further rate cuts in 2026 remains uncertain.
The S&P 500 slipped toward the end of the year but still posted a strong 16% gain for 2025. January promises to be busy, with Q4 earnings and crucial inflation figures scheduled for release.
Dow Jones futures dipped slightly Sunday night, while S&P 500 and Nasdaq futures edged up. Over the weekend, former President Donald Trump claimed that the U.S. would “run” Venezuela following the capture of President Nicolás Maduro, though Maduro’s government remains intact.
The annual CES technology conference officially begins Tuesday in Las Vegas, with artificial intelligence expected to take center stage. CES 2026 will showcase major presentations from AI chip leaders Nvidia (NASDAQ: NVDA) and Advanced Micro Devices (NASDAQ: AMD), highlighting AI’s tangible applications across devices—from smart glasses and wearable life-loggers to robotaxis and humanoid robots.
Industrial technology will also receive attention, with keynote speeches from the CEOs of Caterpillar (NYSE: CAT) and Siemens (SIEGY). The four-day event will run through Friday.
Nvidia, AMD, and Taiwan Semiconductor Manufacturing (NYSE: TSM) will be key players at CES 2026 in Las Vegas.
$NVDA – Jensen Huang’s keynote: January 5 at 4:00 PM ET
$AMD – Lisa Su’s keynote: January 5 at 9:30 PM ET
$MRVL – Matt Murphy’s fireside chat: January 6 at 12:00 PM ET
$TSM – Monthly sales data release: January 9
Stocks dropped in the final trading session of 2025, causing the S&P 500 to register a loss for December. However, the index still posted a strong gain of over 16% for the year, marking its third consecutive year with double-digit growth, while the VIX remained near yearly lows.
After a quiet year-end, 2026 is expected to start actively with important economic reports, a Supreme Court decision on President Trump’s tariffs, his nominee for the next Federal Reserve chair, and the beginning of earnings season. Although next week’s earnings calendar is relatively light, a few companies such as AAR (NYSE: AIR), Commercial Metals (NYSE: CMC), and Acuity (NYSE: AYI) are scheduled to report.
US Economic Data
A series of key economic reports will be released during the first full week of January. Scheduled releases include the ISM manufacturing and services indexes, Commerce Department data on housing starts and building permits, and the Labor Department’s JOLTS report. The highlight will be Friday’s release of December payrolls.
On December 30, the Chicago Fed reported that its labor market model indicated only minor shifts in layoffs, quits, and hiring of unemployed workers for the month, projecting the unemployment rate to remain steady at 4.56%.
The tech boom and onshoring efforts are set to trigger a significant surge in capital spending. The majority of this investment is expected from the “Big Four” tech giants—Microsoft, Amazon (NASDAQ: AMZN), Alphabet (NASDAQ: GOOGL), and Meta (NASDAQ: META)—all of which have indicated their 2026 capital expenditures will likely surpass those of 2025.
The “Magnificent 7” — which includes Microsoft, Amazon, Alphabet, Meta, Apple (NASDAQ: AAPL), Nvidia, and Tesla (NASDAQ: TSLA) — are projected to collectively invest over $500 billion in capital expenditures in 2026. Although not officially committed to this amount, their guidance in late 2025 suggests an acceleration of substantial AI infrastructure spending in the coming year.
Onshoring also plays a crucial role in driving capital investment, as the Trump administration’s tariff team has secured commitments from foreign governments and companies to establish manufacturing facilities in the U.S. in return for reduced tariff rates.
Technical Analysis
DJIA Index
The DJIA continues to trade within an upward channel that began from the lows in August 2025. On Friday, December 26, 2025, the index was unable to move above the channel’s midpoint. Support is found near the lower boundary of the channel, around 47,900. A decisive move either above or below this 47,900 level will likely determine the next direction for the index.
Nasdaq 100 Index
The NDX continues to face resistance in the 25,870–25,900 range. As long as this resistance holds, the index is expected to trade within a range between 25,900 and 24,645. A clear break below the 25,000 level could pave the way for a decline toward 24,645.
SPX Index
Last week, the SPX fell below the 6,896 resistance zone. As long as it remains under this level, a decline toward 6,820 seems probable. A strong and sustained break below 6,820 would suggest further downside potential toward the 6,740–6,720 range. Otherwise, the SPX is likely to trade sideways within the 6,890 to 6,820 range.
Weekly US Indices Probability Map
The U.S. weekly market probability map for January 5–9, 2026 indicates a week characterized by mixed trading patterns. These maps are based on historical seasonality trends, with sentiment readings generated using a seasonality-driven scoring system.
This week’s highlights include the U.S. jobs report, ISM PMI surveys, and the CES Conference.
AMD is a recommended buy, driven by expected AI innovations presented in CEO Lisa Su’s CES keynote.
Cal-Maine Foods is a sell candidate ahead of a potentially disappointing earnings report and a weak outlook.
Wall Street’s major indexes closed mostly higher on Friday, the first trading day of 2026, boosted by gains in semiconductor and AI-related stocks. However, all three indexes still recorded slight declines for the week.
The Dow Jones Industrial Average slipped 0.7%, the S&P 500 dropped 1%, the tech-focused Nasdaq Composite fell 1.5%, and the small-cap Russell 2000 declined 1%.
The first full trading week of 2026 promises to be busy, with monthly jobs data taking center stage. Economists forecast nonfarm job growth of 54,000 for January, down from 67,000 in December, while the unemployment rate is expected to decrease to 4.5% from 4.6%. Additionally, the ISM manufacturing and services PMIs will be closely monitored by investors.
On the earnings front, only a few companies are scheduled to report this week, including Constellation Brands, Cal-Maine Foods, Jefferies Financial Group, Albertsons, and Applied Digital.
Meanwhile, investors in the tech and consumer sectors will be closely watching the CES conference in Las Vegas. Key companies to watch for product launches, strategic updates, and AI developments include Nvidia, AMD, Intel, Qualcomm, Meta Platforms, Samsung, LG, Sony, and Motorola.
No matter how the market moves, below I highlight one stock expected to gain interest and another that may face further declines. Keep in mind, my outlook is limited to the upcoming week, Monday, January 5 through Friday, January 9.
Stock to Buy: Advanced Micro Devices
AMD stands out as a strong buy this week, with the 2026 Consumer Electronics Show (CES) acting as a key catalyst. The highlight will be CEO Dr. Lisa Su’s opening keynote on Monday at 6:30 PM PT (9:30 PM ET).
Su is expected to present AMD’s vision for AI solutions across cloud, enterprise, edge, and devices, potentially unveiling new advancements in AI chips and related technologies. Historically, AMD shares tend to rally during the week of its major product announcements, often followed by multiple analyst upgrades.
Analysts remain optimistic, with a consensus Strong Buy rating supported by 40 Buy and 11 Hold recommendations, suggesting a 26.5% upside potential for 2026. TD Cowen recently named AMD among its top AI picks, setting a price target of $290.
Fundamentally, AMD’s growth is driven by its AI product portfolio, including the MI300 series accelerators, which are gaining ground against rivals like Nvidia.
AMD shares closed Friday at $223.47. From a technical standpoint, the stock has demonstrated resilience, recovering from mid-2025 lows near $150 to its current level, supported by strong trading volume. If the upcoming keynote meets expectations with announcements like new partnerships or product roadmaps, AMD could soon challenge its 52-week high around $270.
AMD holds a Financial Health Score of 2.98 (“GOOD”), indicating a solid balance sheet and strong operating momentum driven by excitement around its next-generation AI products.
Stock to Sell: Cal-Maine Foods
Cal-Maine Foods starts the week at $78.47, hovering near its 52-week low, as Wall Street anticipates a weak earnings report and a bleak outlook. The company faces headwinds including rising feed costs, supply chain challenges, and variable demand.
The largest U.S. producer and distributor of shell eggs is set to release its fiscal second-quarter results before the market opens on Wednesday at 6:00 AM ET, followed by a conference call at 9:00 AM ET.
Cal-Maine is projected to report earnings of $2.08 per share, a sharp 53.5% decline from $4.47 a year ago, driven by higher input costs and fluctuating demand. Revenue is expected to drop 14.7% year-over-year to $814.2 million, amid ongoing egg price volatility and potential disruptions from recent avian flu outbreaks that have affected supply chains.
Looking forward, the company’s guidance is likely to reflect continued uncertainty around production normalization and cost control, posing further challenges for investor confidence and stock performance.
Technically, CALM has slipped below key support levels, accompanied by declining volume that indicates weakening investor interest. Its one-year target price of $95.50 offers limited upside, but the risks from a disappointing earnings report outweigh potential gains.
With the likelihood of underwhelming results and cautious guidance, CALM is a sell this week to avoid volatility driven by these events.
Whether you’re a beginner investor or an experienced trader, using InvestingPro can help you uncover investment opportunities while managing risks in this challenging market environment.
Market volatility often feels personal. One week, your investment portfolio appears stable; the next, it drops, headlines turn alarming, and every conversation sounds like a prediction. This emotional rollercoaster is normal, but panic selling can turn temporary market swings into lasting financial damage.
For high-net-worth families and business owners, the stakes are even higher. Investments are not for entertainment—they serve real financial goals like retirement income, business transitions, philanthropy, and preserving long-term wealth.
The good news is, successful investing doesn’t require perfect timing. Instead, it demands a consistent process that withstands diverse market conditions, volatile periods, and unforeseen events. The most effective market volatility strategies emphasize preparation, discipline, and risk management, all geared toward sustainable long-term growth.
Key Takeaways
Market volatility is a normal part of investing; having a rules-based plan helps minimize panic selling and costly mistakes.
Effective risk management begins with clear asset allocation, defined investment horizons, and practical guardrails.
Portfolio diversification works best when intentional and based on asset class exposure—not simply by increasing the number of holdings.
Regular rebalancing reinforces the discipline of “selling high” and helps reduce volatility over time.
Maintaining a steady investment psychology keeps investors focused on long-term performance rather than daily market fluctuations.
What Market Volatility Really Means in the Stock Market
Market volatility reflects shifting expectations. Stock prices fluctuate, bond yields change, and the market continuously reprices risk as economic conditions evolve. Factors such as inflation risk, interest rate changes, and unexpected news can quickly alter market values.
Volatility is not limited to equities. When interest rates rise, bond prices typically fall, often surprising investors who expect fixed-income assets to provide stability. In the bond market, price fluctuations are driven by interest rate risk, credit risk, and credit quality—especially in high-yield bonds and certain bond funds.
Not every market downturn signals a crisis, but each one tests whether your portfolio aligns with your risk tolerance and investment objectives.
Investment Psychology: Why Many Investors Make Costly Moves
During volatile periods, investment psychology can undermine sound judgment. Loss aversion makes market declines feel unbearable, while recency bias convinces investors that recent events will dictate future outcomes. Coupled with constant commentary on indices like the Dow Jones and “potential winners,” investors face emotional pressure from all sides.
Risk-averse investors are particularly vulnerable. When fear peaks, many abandon their original plans and move to cash at inopportune moments. Hesitation to re-enter the market thereafter can significantly harm long-term returns.
The solution is not bravado but structure. A well-designed, rules-based investment plan reduces the likelihood of reactive decisions during turbulent times.
Practical Risk Management Strategies for a Diversified Portfolio
During periods of market turbulence, the objective isn’t to predict headlines but to manage risk effectively and keep your balanced portfolio aligned with your long-term financial goals.
1. Start With Asset Allocation and Risk Tolerance
Asset allocation is one of the most important factors driving long-term investment performance. A well-designed allocation reflects both your risk tolerance—the level of risk you are comfortable with—and your risk capacity, which is more practical and considers your time horizon, liquidity needs, and how much additional risk your financial plan can realistically withstand without forcing unwanted changes.
If a market downturn would compel you to sell assets to cover life expenses, your portfolio’s overall risk might be too high for your situation. This is especially critical for business owners nearing liquidity events or investors approaching retirement, who need to ensure their allocation aligns with their unique financial circumstances.
2. Build Portfolio Diversification That Holds Up Across Market Conditions
Portfolio diversification is effective when your assets respond differently under the same market conditions. Simply owning multiple mutual funds tracking similar benchmarks can still expose you to a single dominant risk factor.
A truly diversified portfolio includes exposure to multiple asset classes, such as:
Equities across various sectors
International stocks for broader geographic exposure
Fixed income securities selected by credit quality and duration
Cash or short-term instruments to manage liquidity risk
This approach reduces overall portfolio volatility by not relying on a single market narrative. It also preserves long-term growth potential by avoiding overconcentration in any one area.
3. Use Fixed Income Investments With Eyes Open
Bonds can provide portfolio stability, but selecting the right bonds is crucial. Government and high-quality bonds often behave differently from corporate or high-yield bonds, especially during economic stress. Credit risk and duration significantly impact bond performance.
Rising interest rates typically cause bond prices to fall, particularly for longer-duration bonds. Bond funds may also experience unexpected market value fluctuations, and selling during market stress can lock in losses. Understanding interest rate risk, credit quality, and bond price sensitivity across economic cycles is essential.
Fixed income investments play an important role but should be tailored to your time horizon and investment objectives—not based on assumptions or market noise.
4. Rebalancing With Discipline to Manage Risk
Rebalancing is a disciplined approach to managing risk and maintaining a balanced portfolio. It helps prevent emotional trading by systematically adjusting your holdings back to your target asset allocation.
Over time, rebalancing reinforces the “sell high” discipline by trimming assets that have grown disproportionately and adding to those that have lagged behind. While it’s not a guarantee of gains, this method effectively controls risk and reduces portfolio drift during volatile market conditions.
5. Plan Liquidity to Reduce Forced Selling
Liquidity risk becomes a critical concern when cash is needed during a market downturn. Having a clear cash plan, maintaining an emergency reserve, and carefully timing large expenses can help minimize the risk of being forced to sell investments at unfavorable prices.
This strategy is especially vital for investors with irregular cash flows, upcoming tax obligations, or significant business expenses. A well-structured liquidity plan safeguards your long-term investment goals by preventing your portfolio from being tapped as an emergency fund.
Shares of auto giant Tesla Inc. closed lower for the fourth consecutive session on December 29, signaling a notable shift in momentum just days after the stock reached a fresh all-time high. Since that peak just before Christmas, Tesla shares have declined nearly 8%, marking a sharp reversal after a hard-fought rally.
The timing of Tesla’s recent pullback makes it particularly notable. In a market hovering near record highs, Tesla’s sudden loss of momentum just as it enters blue sky territory raises a critical question: is this a healthy pause or an early sign that the rally is losing steam?
Let’s explore the arguments on both sides.
A Pullback Was Always Possible Amid Tesla’s Rapid Rally
Tesla has surged more than 100% since April, with its longer-term uptrend remaining firmly intact. Even after the recent decline, the stock has not broken any major trend structures—it simply looks more pronounced coming off a record high. Many investors had anticipated the rally to accelerate after Tesla finally cleared long-term resistance, rather than pull back.
From a technical perspective, a pullback of this magnitude is normal and consistent with previous corrections the stock has experienced this year. The latest rally phase was largely one-directional, making profit-taking after major milestones expected.
Tesla’s shares could fall another 8% and still remain within the rising trend channel that has supported the stock since spring. Viewed this way, the recent selloff represents a period of digestion rather than a breakdown. Healthy uptrends rarely move in straight lines—something Tesla investors are all too familiar with.
This outlook is further supported by Tradesmith’s Health Indicator, a volatility-based measure of stock price strength. According to this indicator, Tesla (TSLA) stock has remained in the green zone for four consecutive months, signaling a healthy underlying trend despite recent pullbacks.
A Change in Tone Marks Shift in Market Sentiment Around Tesla Stock
While a pullback is normal after reaching an all-time high, four consecutive lower closes suggest there is more at play than just short-term profit-taking. The sustained selling pressure indicates that bears have firmly taken control from the bulls, with little defense visible so far.
The critical question now is whether buyers will quickly re-enter the market. If they do, this pullback may be seen as a buying opportunity for long-term investors. If not, the market could begin to reassess the remaining upside potential ahead of the next major catalyst—January’s earnings report.
Analyst Support Remains Strong as Tesla Navigates Recent Price Decline
Despite recent weakness, analyst conviction in Tesla remains firm. Over the past week, both RBC and Canaccord Genuity reaffirmed their Buy ratings on the stock. Canaccord Genuity even raised its price target to $551, implying roughly 20% upside from current levels.
These positive calls suggest that the recent selloff is a minor pullback within a larger, ongoing uptrend that still has significant room to grow, even if near-term price action appears uncomfortable. While Sell ratings, such as one from UBS Group last week, persist, they remain rare exceptions in an otherwise solid analyst consensus.
This broader trend of sustained analyst support is particularly important during periods of market uncertainty like the current one.
Why the Next Few Trading Sessions Are Crucial for Tesla Stock
Despite the ongoing pullback, it would be a mistake to dismiss the recent price action entirely. Runs of consecutive red days like this are rare for Tesla, especially so soon after hitting new highs. The fact that this is occurring while the broader market remains strong adds an extra layer of concern.
Tesla’s high valuation intensifies this tension. Trading with a price-to-earnings ratio above 300, the stock leaves little margin for error. Any sign of disappointment in the company’s upcoming earnings report at the end of January could lead to a swift selloff. Confidence, not just momentum, is now a crucial factor.
This makes the upcoming sessions particularly important. How Tesla performs through the remainder of the holiday week and into early January will provide vital clues about the health of the rally. Stabilization or a quick rebound would suggest the pullback is routine. Continued weakness, however, would encourage bearish sentiment and shift the narrative from consolidation to growing doubt.