Tag: commodity trading

  • Global markets update: Futures retreat, gold continues sliding, Bitcoin nudges down

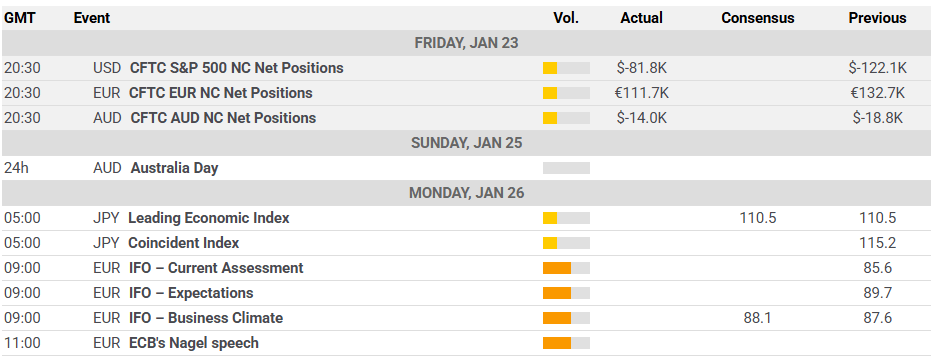
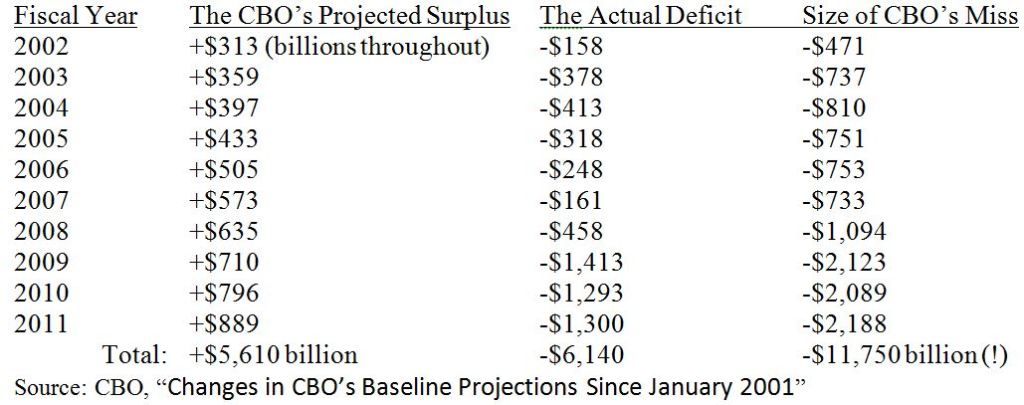
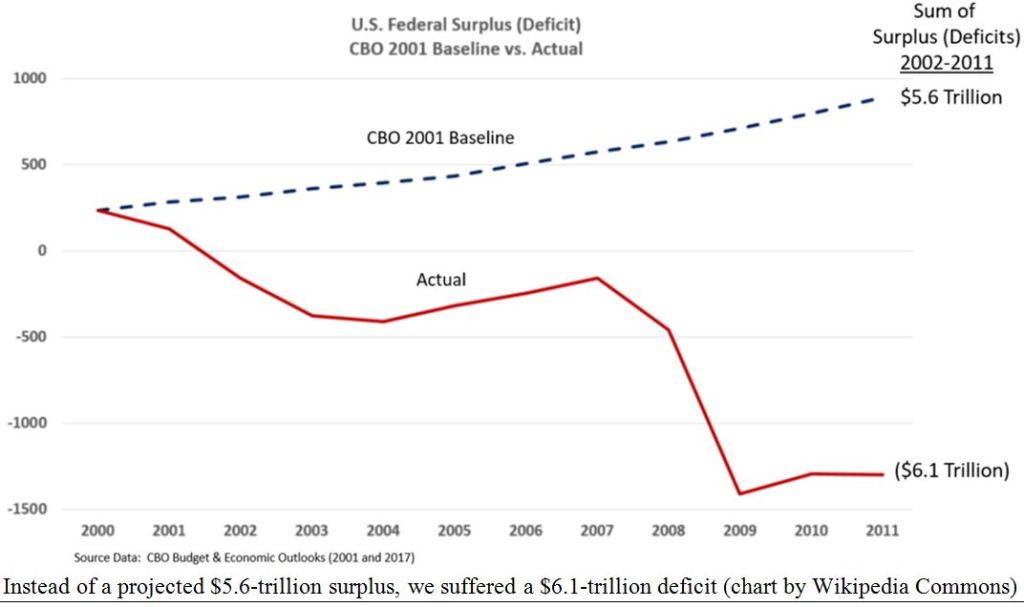
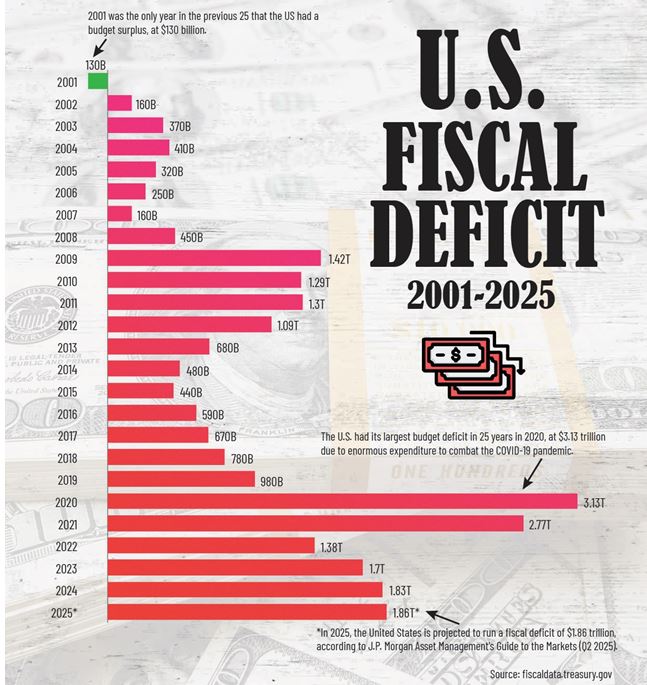
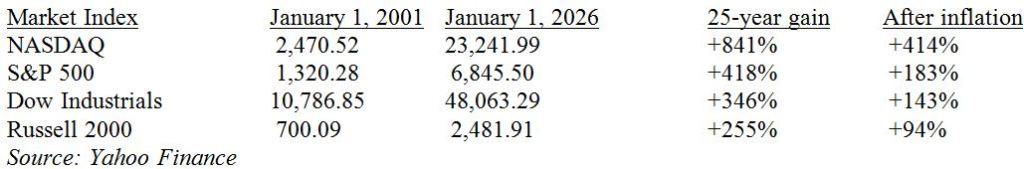
    U.S. stock index futures edge lower as a sharp selloff in gold and silver weighs on investor sentiment ahead of a packed week of major corporate earnings and key economic releases. Bitcoin continues to slide after dropping below $80,000 over the weekend. Elsewhere, Oracle signals plans for fresh fundraising, while speculation over potential executive changes at Walt Disney grows ahead of its upcoming quarterly results.

    Futures edge lower

    U.S. equity index futures moved lower on Monday, pointing to a continuation of last session’s losses at the start of the new trading week.

    As of 03:11 ET (08:11 GMT), Dow futures were down 323 points, or 0.7%, S&P 500 futures had declined 62 points, or 0.9%, and Nasdaq 100 futures were lower by 291 points, or 1.1%.

    Market participants are closely watching a heavy slate of upcoming corporate earnings alongside a new monthly jobs report. Together, these releases could shed light on the health of the U.S. economy and test the resilience of a stock market rally now in its fourth year.

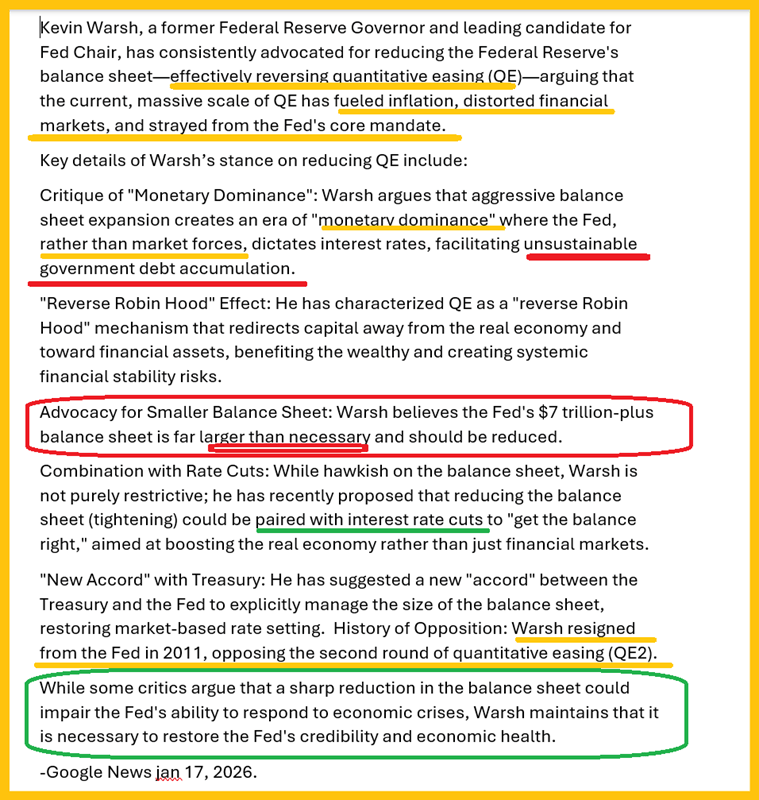
    Beyond ongoing questions over the durability of the artificial intelligence-driven rally, investors are also weighing the implications of President Donald Trump’s nomination of Kevin Warsh as the next Federal Reserve Chair. If confirmed by the Senate, Warsh would bring his long-held calls for a shift in the monetary policy framework to the world’s most influential central bank.

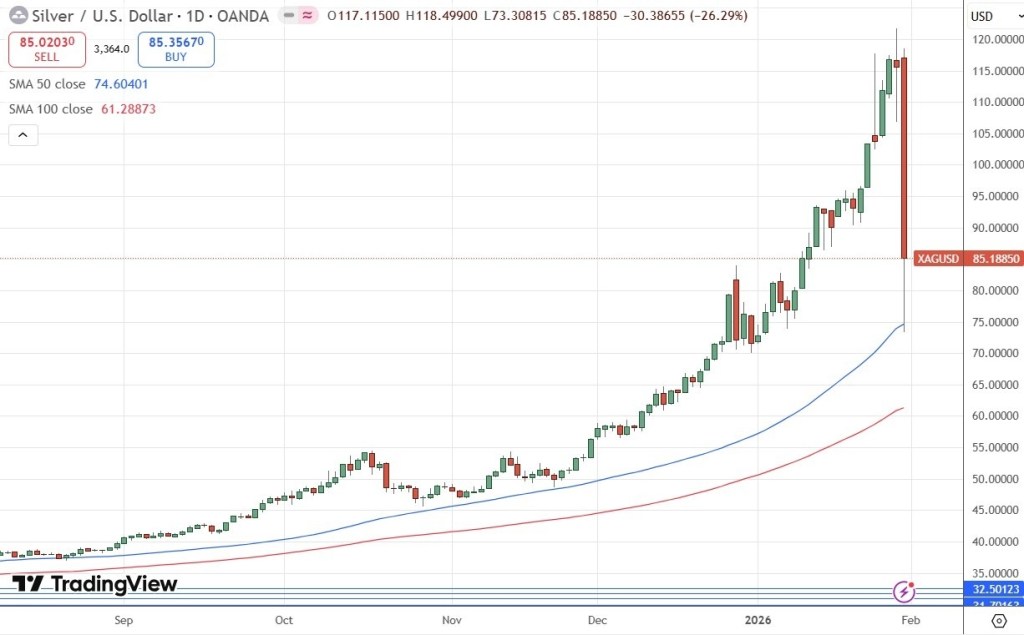
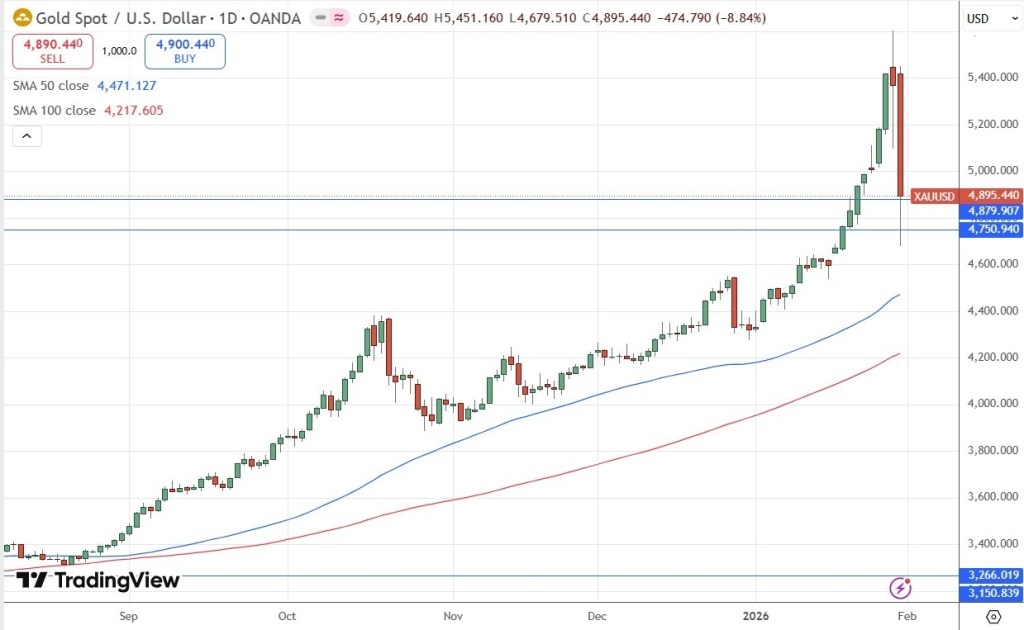
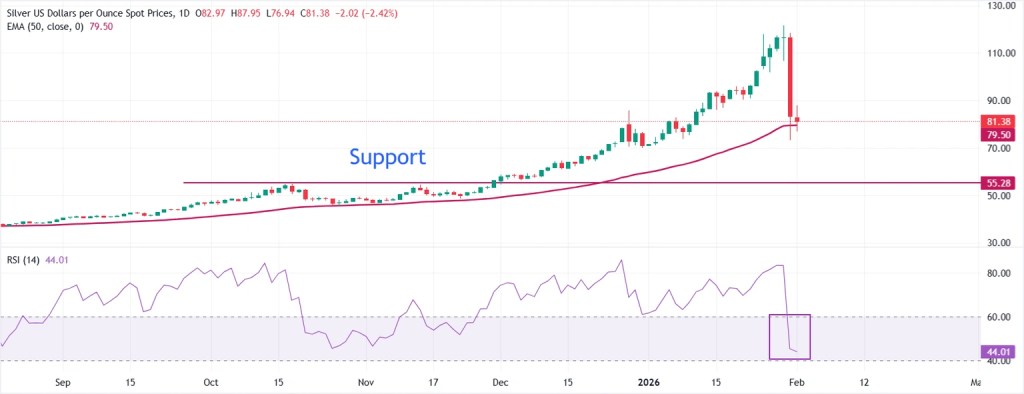
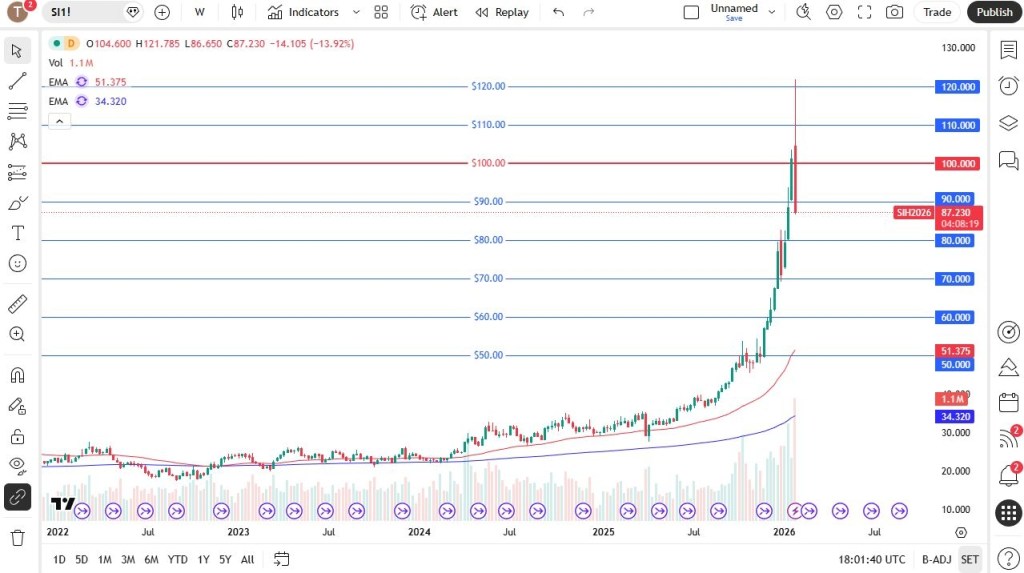
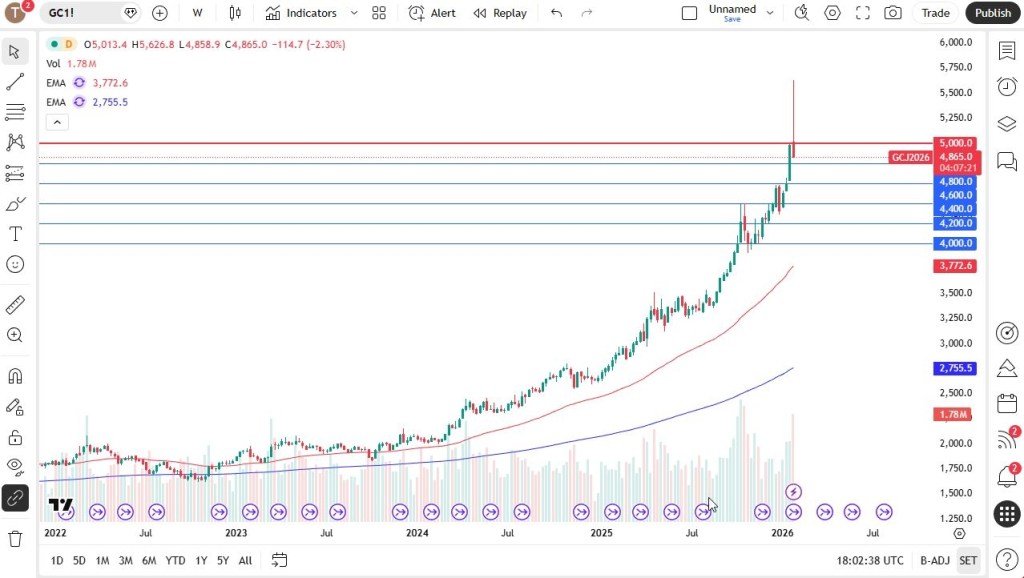
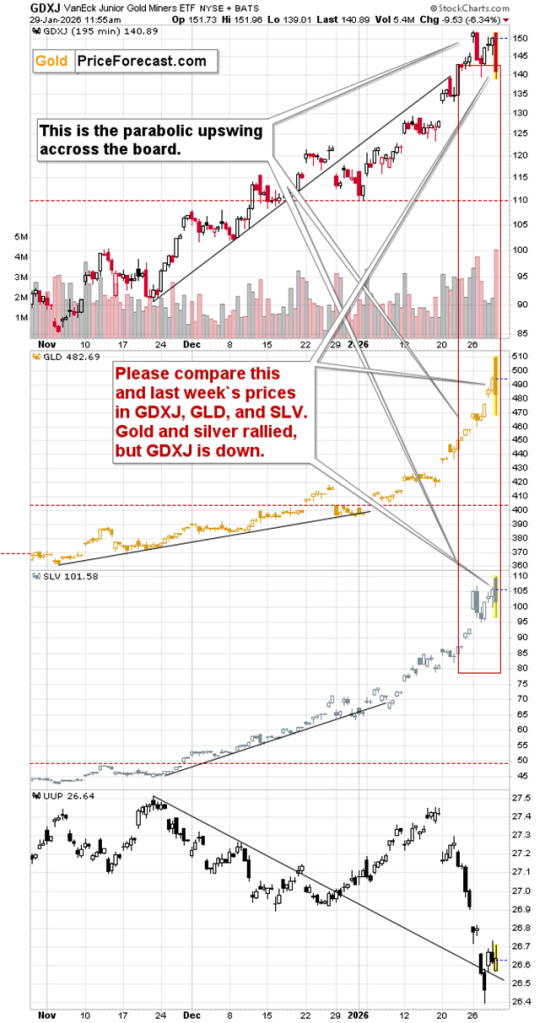
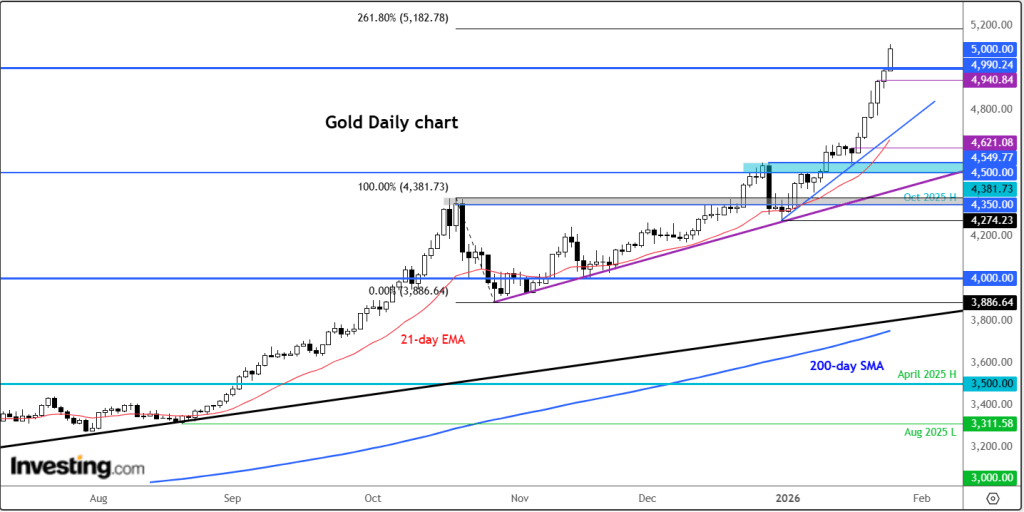
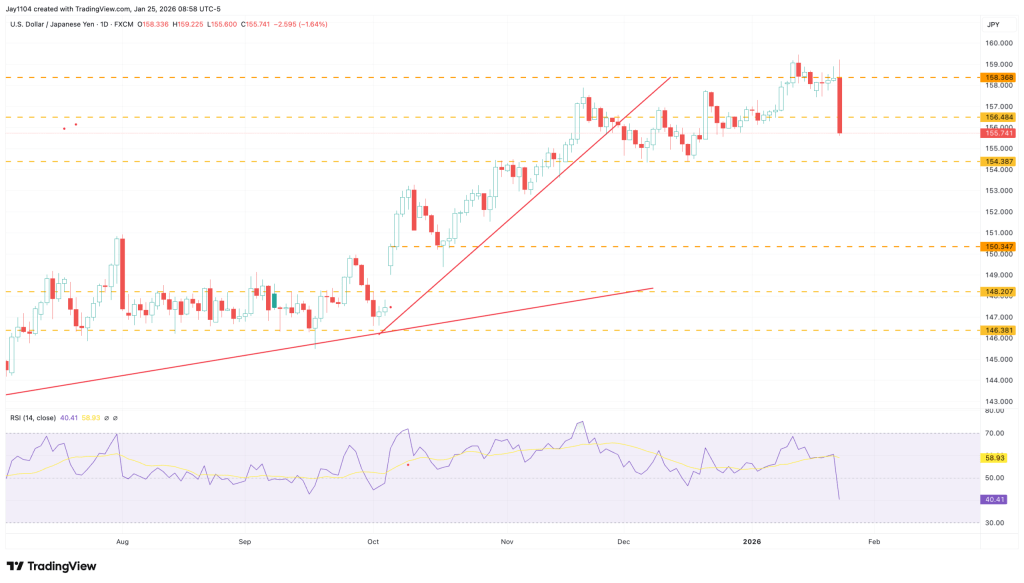
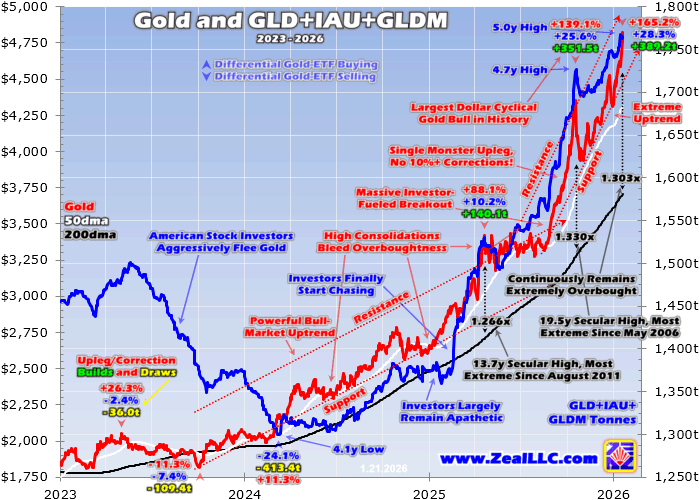
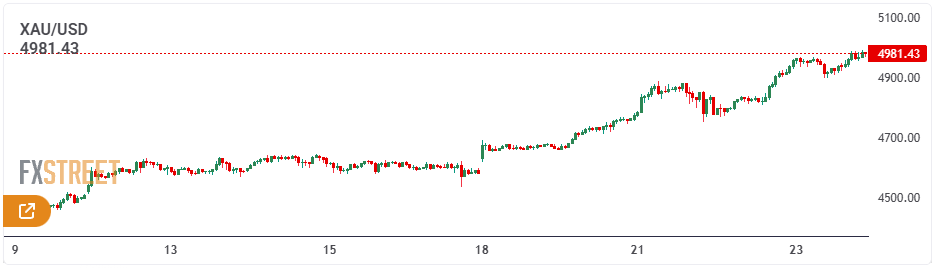
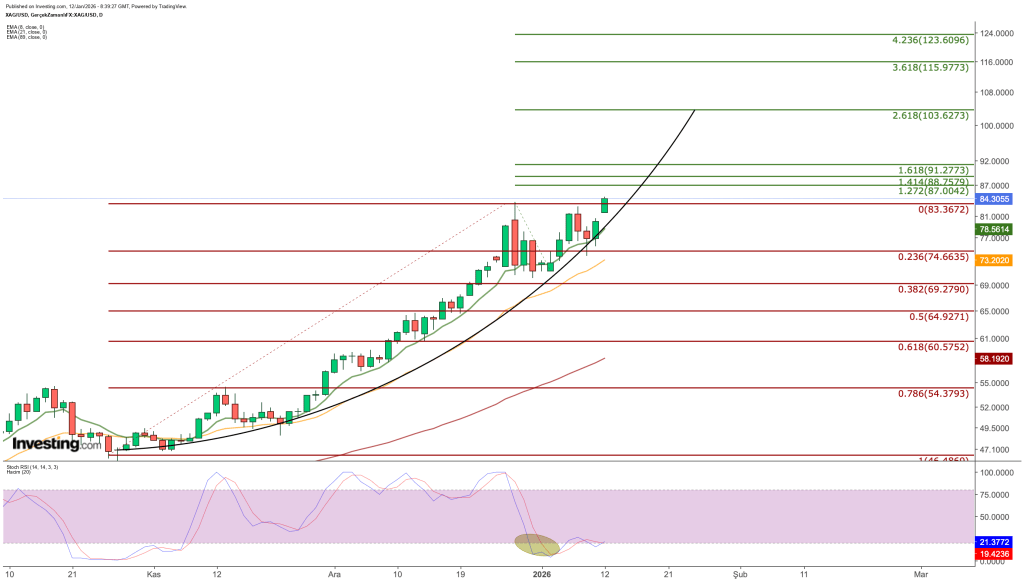
    Gold and silver extend their selloff

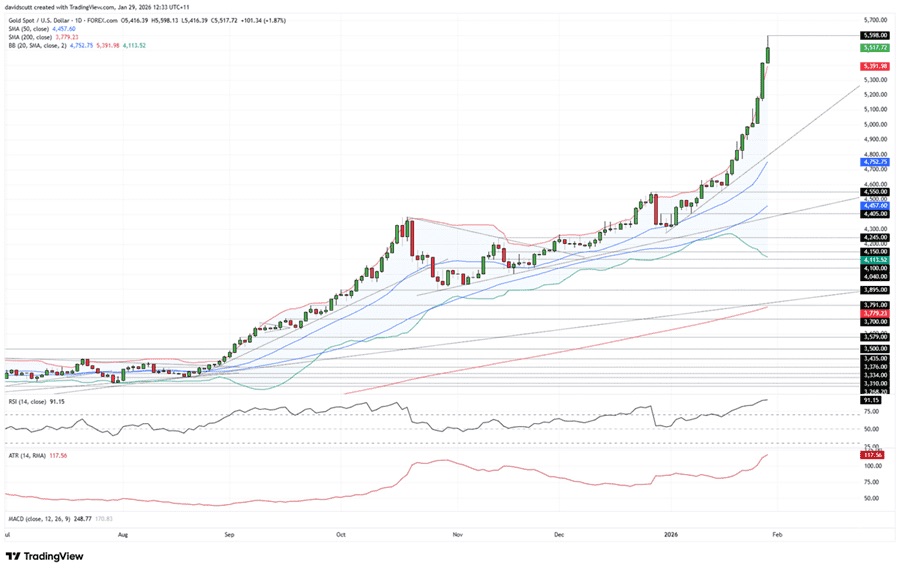
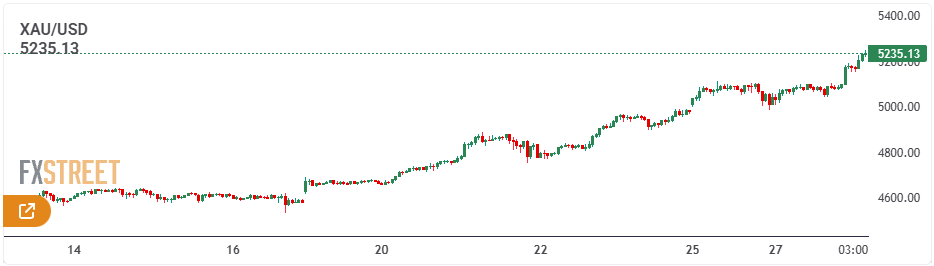
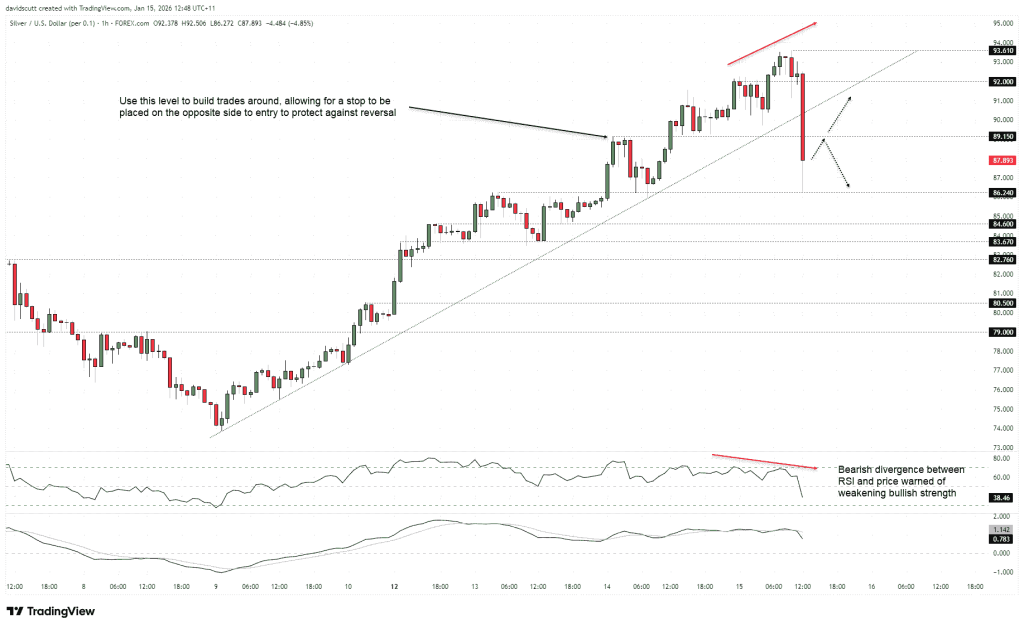
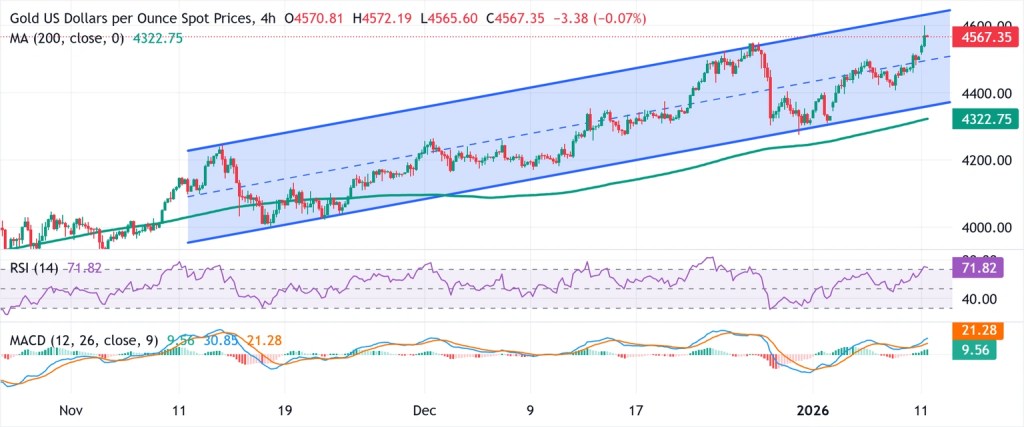
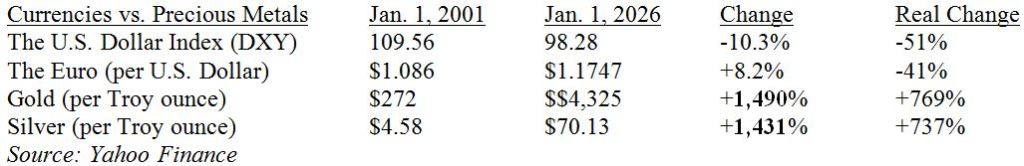
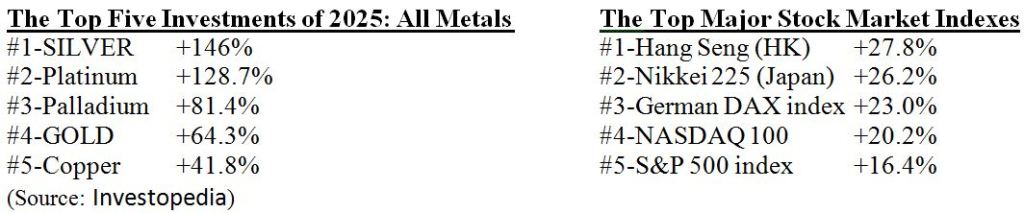
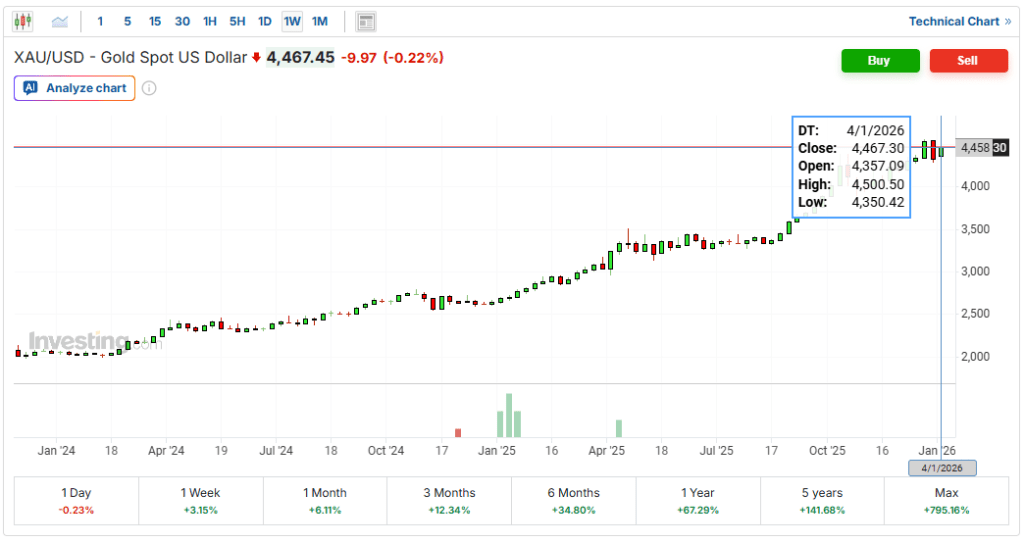
    A sharp decline in both gold and silver, continuing the historic drop seen on Friday, weighed heavily on market sentiment—especially in Asia, where equities broadly fell.

    Following a nearly 10% plunge late last week, spot gold fell another 4.9% to $4,626.80 per ounce by 03:27 ET, slipping well below the $5,000 mark it had just recently surpassed. Silver, which had benefited from speculative interest and industrial demand, also faced selling pressure but had somewhat stabilized around $79 an ounce as of 03:30 ET.

    Analysts attribute the metals’ losses to a stronger U.S. dollar and widespread profit-taking after their significant rally in recent months.

    Investors also showed concern about Kevin Warsh’s potentially hawkish stance in the long term. Although Warsh—formerly a Federal Reserve governor—has supported President Trump’s calls for sharply lower interest rates, he has been critical of the Fed’s asset purchase programs.

    “Warsh is viewed as the most inflation-focused candidate for the Fed chair, reducing the chances of aggressive monetary easing. This sparked a wave of selling, with gold enduring its steepest decline in four decades,” ANZ analysts noted.

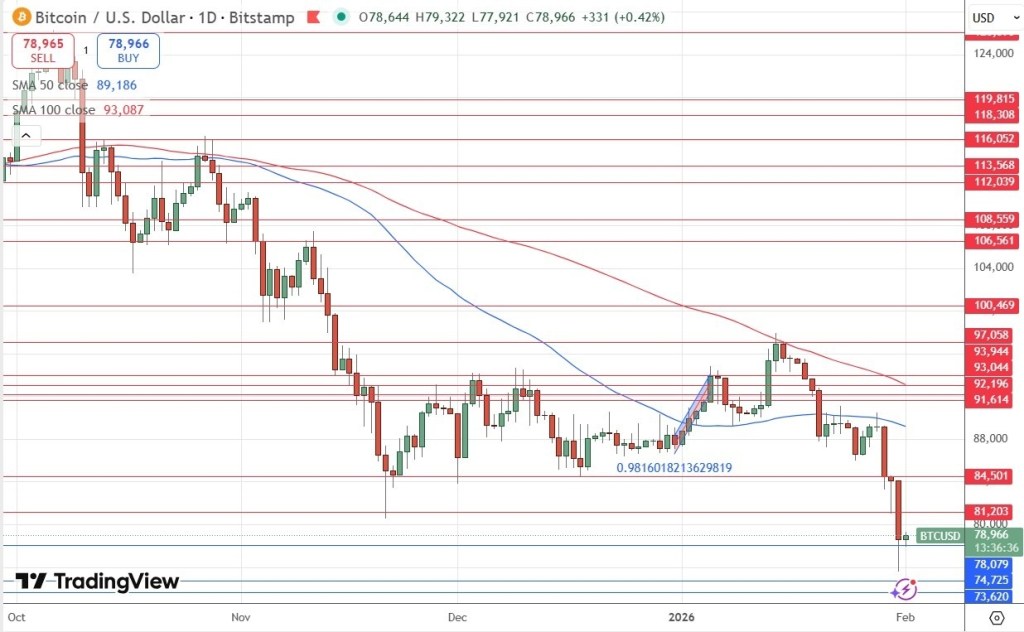
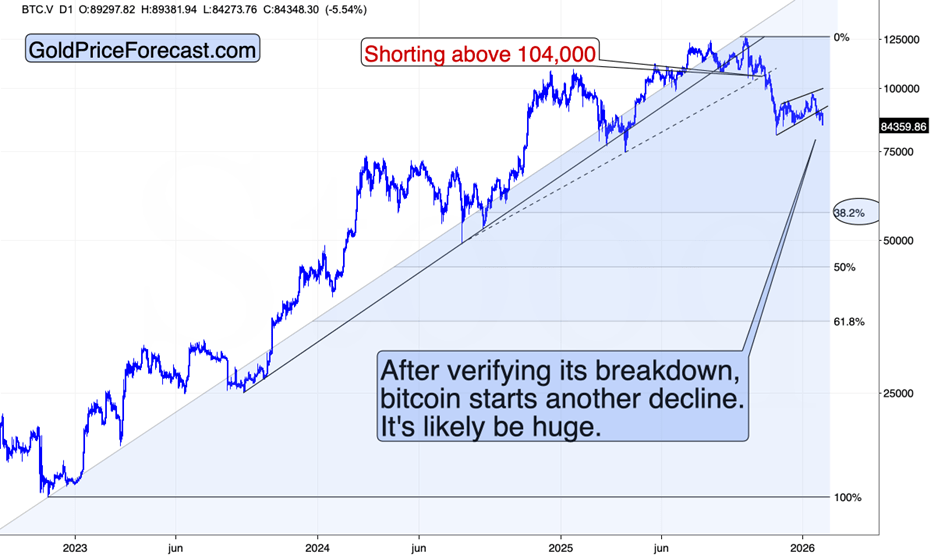
    Bitcoin continues to decline

    The risk-averse mood extended to cryptocurrencies, with Bitcoin dropping over 2% to $76,892.4. On Saturday, the leading digital currency fell below the $80,000 mark, continuing its decline from Friday. Some investors worried that Kevin Warsh might support shrinking the Federal Reserve’s balance sheet, which could reduce liquidity in the financial system.

    Larger Fed balance sheets have historically supported cryptocurrencies by injecting cash into money markets, providing backing for riskier assets.

    This latest slide marks another downturn for Bitcoin since reaching its all-time high last October. Once buoyed by optimism over increased cash flows and a friendlier regulatory environment under Trump, the token has now lost about one-third of its value.

    With turmoil spreading across stocks, commodities, and crypto, Jonas Goltermann, Deputy Chief Markets Economist at Capital Economics, described the past few days as “unusually hectic […] for financial markets” in a recent note.

    Oracle announces plans for new fundraising

    On Sunday evening, Oracle Corporation announced plans to raise new capital in 2026 to support the expansion of its AI and cloud infrastructure amid rising demand for computing power.

    The company aims to generate between $45 billion and $50 billion in gross proceeds during 2026, utilizing a mix of debt and equity financing.

    About half of the funds will come from a combination of equity derivatives and common stock, according to a company statement.

    Oracle plans to raise its debt funding through a single, one-time issuance of investment-grade senior unsecured bonds in early 2026, with no additional debt expected afterward.

    Analysts at Vital Knowledge highlighted that roughly half of the total funding will come from equity-linked securities, including a $20 billion at-the-market (ATM) common equity program.

    They noted, “Oracle’s $20 billion ATM offering is the first time a major tech company has been compelled to raise equity since the AI boom began. If this signals a shift toward greater fiscal caution in the industry, it could lead to a slower overall pace of spending.”

    Disney set to release earnings

    Walt Disney is set to release its earnings before the opening bell on Monday.

    While the company’s continued focus on its streaming services, alongside its vital parks and studios divisions, will be closely watched, much of the attention may center on leadership succession.

    According to the Wall Street Journal, Disney CEO Bob Iger has informed colleagues that he intends to step down and reduce his day-to-day involvement before his contract expires on December 31.

    Board members are expected to convene soon to decide on Iger’s successor, with several media outlets naming Experiences division head Josh D’Amaro as the likely frontrunner.

    Sources: Scott Kanowsky

  • Weekly FX Outlook: EUR/USD, Crude Oil, Bitcoin, Silver & Gold

    Fundamental Analysis & Market Sentiment

    Last week’s best trade ideas were as follows:

    • Long EUR/USD after a daily close above 1.1866, resulting in a 0.24% loss.
    • Long Silver, which ended with a loss of 18.62%.
    • Long Gold after a daily close above $5,000, producing a 2.26% loss.

    Taken together, these positions generated a total loss of 21.12%, or 7.04% per asset. While this was a sizable drawdown, the broader performance of my weekly forecasts over recent weeks remains positive, as earlier gains were exceptionally strong and more than offset this setback.

    Key market data from last week:

    • U.S. Federal Reserve policy meeting: No surprises, with interest rates left unchanged.
    • U.S. Producer Price Index (PPI): The standout data release of the week. Inflation came in far hotter than expected, with headline PPI rising 0.5% month-on-month and core PPI increasing 0.7%, versus forecasts of just 0.2% for both. This reinforced a more hawkish Fed outlook, lifted the U.S. dollar, and accelerated the sharp reversal in Silver (and Gold). As a result, expectations for a second U.S. rate cut in 2026 were pushed back to October.
    • Bank of Canada policy meeting: No change to interest rates, as anticipated.
    • Australian CPI: Inflation exceeded expectations, with an annual rate of 3.8% versus 3.5% forecast, strengthening the case for possible RBA rate hikes and supporting the Australian dollar early in the week.
    • Canadian GDP: Slightly weaker than expected, showing zero month-on-month growth.
    • U.S. unemployment claims: In line with forecasts.

    While PPI and Australian inflation influenced market moves, two broader developments likely had an even greater impact:

    • Federal Reserve leadership: President Trump announced his nominee for the next Fed Chair, Kevin Warsh. Although regarded as a hawk, Warsh is now thought to favor lower interest rates. The nomination contributed to the collapse of the Silver rally and provided additional support to the U.S. dollar.
    • Geopolitical tensions: The U.S. continued its military buildup near Iran, raising the risk of a wider regional conflict. Polymarket currently assigns a high probability to a U.S. strike on Iran in March, despite President Trump still referencing the possibility of a diplomatic agreement. These tensions appear to be supporting crude oil prices, with WTI crude reaching a new four-month high last week.

    Meanwhile, the S&P 500 briefly pushed to a fresh record above 7,000. Although the index remains resilient, upside momentum is limited. In my view, a clearer resolution to U.S.–Iran tensions is needed before a more decisive directional move can develop.

    The Week Ahead: 2nd – 6th February

    The most significant data releases for the coming week, ranked by expected market impact, include:

    • U.S. Average Hourly Earnings and Non-Farm Payrolls
    • Preliminary University of Michigan Inflation Expectations
    • European Central Bank main refinancing rate decision and monetary policy statement
    • Bank of England official bank rate decision, voting breakdown, and monetary policy report
    • Reserve Bank of Australia cash rate decision, rate statement, and monetary policy statement
    • U.S. JOLTS job openings
    • Preliminary University of Michigan consumer sentiment
    • U.S. ISM services PMI
    • U.S. ISM manufacturing PMI
    • U.S. unemployment rate
    • New Zealand unemployment rate
    • Canadian unemployment rate
    • U.S. weekly unemployment claims

    This will be a particularly busy and potentially market-moving week, with three major central banks delivering policy decisions. Please note that Friday is a public holiday in New Zealand, which may reduce liquidity in related markets.

    Monthly Forecast February 2025

    For the month of January 2026, I forecasted that the USD/JPY currency pair would rise in value. Unfortunately, this was a losing trade.

    For the month of February, I forecast that the EUR/USD currency pair will rise in value.

    Weekly Forecast 2nd February 2026

    Last week, three currency crosses experienced unusually high volatility, prompting the following weekly trade forecasts:

    • Short NZD/JPY, which resulted in a 0.57% loss.
    • Short AUD/JPY, ending with a 0.32% loss.
    • Short NZD/CAD, producing a 0.39% loss.

    Overall, the Swiss franc and the New Zealand dollar emerged as the strongest major currencies of the week, while the U.S. dollar was the weakest. Market conditions were relatively subdued, with directional volatility dropping sharply—only 11% of major currency pairs and crosses moved by more than 1% over the week.

    Technical Analysis

    Key Support/Resistance Levels for Popular Pairs

    US Dollar Index

    Last week, the U.S. Dollar Index formed a notably large bullish pin bar, rejecting a fresh four-year low. On its own, this price action is bullish. However, the broader technical structure remains bearish, with the index still trading below its levels from 13 and 26 weeks ago. As a result, the technical outlook for the U.S. dollar is mixed.

    The nomination of Kevin Warsh as Federal Reserve Chair provided some support to the dollar during the week. Nevertheless, the forward outlook remains uncertain, and I believe the most attractive trading opportunities in the near term are likely to be independent of U.S. dollar direction.

    EUR/USD

    The EUR/USD pair recently staged a strong long-term bullish breakout as the U.S. dollar accelerated lower and printed a new 3.5-year low. However, the move quickly failed, with price retreating sharply and finding minimal follow-through support.

    This price action suggests the breakout may have been a temporary spike, although the potential for a sustained bullish trend should not be dismissed, as EUR/USD has historically shown a tendency to trend cleanly once momentum is established.

    That said, the appointment of a new Fed Chair and the renewed strength in the U.S. dollar late in the week—driven by hotter inflation data—argue for a more cautious stance.

    Accordingly, I would only consider a long position following a daily (New York close) above 1.2039.

    WTI Crude Oil

    WTI crude oil has surged strongly in recent sessions as the risk of a regional conflict centered on Iran has intensified. Prediction markets are currently assigning a high probability to a U.S. strike on Iran in March, a scenario that could significantly disrupt global crude supply. Against this backdrop, prices pushed to a new four-month high by the end of last week, with a daily close above $66.25 marking a potential six-month high.

    However, two important cautions should be noted:

    • While a daily close above $66.25 would typically attract trend-following buying, the current moving average structure does not confirm a bullish setup. Even in the event of military conflict, the move could prove to be a short-lived spike, especially if a rapid U.S. victory follows, potentially resulting in a failed breakout.
    • Unlike recent Democratic administrations, the Trump administration is likely to take aggressive steps to suppress crude oil prices, which could cap or reverse upside momentum.

    Bitcoin

    BTC/USD has finally completed a decisive bearish breakdown below the long-term support zone just above $81,000. Price is now firmly established beneath this level and has pushed to a new nine-month low, a development that is technically significant and clearly bearish.

    While equities and precious metals have rallied strongly in recent months, Bitcoin peaked at a record high several months ago and has since trended steadily lower. This divergence highlights a broader downturn across the crypto sector, with Bitcoin now showing clear signs of structural weakness.

    Despite early expectations that Bitcoin would fundamentally reshape global finance, real-world adoption remains limited outside parts of Africa. Practical usability is still constrained, and its underlying value proposition remains uncertain.

    Although I generally avoid short-selling, Bitcoin appears entrenched in a long-term bearish trend. I would not consider buying at current levels. Short positions may be worth considering, but only with strict risk management, as shorting is best suited to experienced traders.

    XAG/USD

    Silver experienced an exceptionally volatile week, surging more than 15% to hit a new all-time high and the long-discussed $120 options target, before suffering a dramatic reversal. The sell-off unfolded sharply on Thursday and Friday—particularly Friday—when prices plunged 28% in a single session.

    I had previously cautioned that the move was highly vulnerable to a sharp correction, and that while a long position was justified, it should be taken with a reduced position size.

    The sheer magnitude of the collapse, even with some bullish undertones and modest resilience in the bounce from the weekly lows, strongly suggests that another record high is unlikely in the near term. This extraordinary rally appears to be finished, and the most probable next phase is a period of erratic consolidation, marked by large swings and gradually diminishing volatility.

    XAU/USD

    Much of the analysis above regarding Silver also applies to Gold. That said, gold’s volatility was noticeably lower, and its price action showed greater resilience at the lows.

    While gold is also likely to enter a period of sideways consolidation, the underlying structure suggests it may recover to the upside more quickly than silver.

    Bottom Line

    My preferred trade for the coming week is:

    • Long EUR/USD, contingent on a daily (New York) close above 1.2039.

    Sources: Adam Lemon

  • Silver price outlook: XAG/USD finds near-term support above $70 ahead of US NFP week

    Silver prices are struggling to regain momentum after a sharp selloff on Friday. The metal came under heavy pressure as a stronger US Dollar—boosted by Kevin Warsh’s nomination as the next Federal Reserve Chair—combined with profit-taking to trigger a steep decline.

    Market participants are now turning their attention to the upcoming US Nonfarm Payrolls report for fresh clues on the Federal Reserve’s monetary policy outlook.

    Silver (XAG/USD) is trading cautiously around $80 during the Asian session at the start of the week, holding slightly above Friday’s fresh four-week low of $73.33. The white metal is attempting to stabilize after last week’s sharp selloff, during which it shed more than 30% from its record high of $121.66. The decline was driven by a stronger US Dollar, profit-taking following a strong rally, and expectations of a more hawkish Federal Reserve policy outlook.

    From a technical perspective, the firmer US Dollar continues to undermine Silver’s risk-reward profile. At the time of writing, the US Dollar Index, which measures the Greenback against six major currencies, remains near its weekly high at around 97.33.

    The US Dollar drew strong support on Friday after the White House nominated former Federal Reserve Governor Kevin Warsh to succeed Jerome Powell as Fed Chair. Analysts see Warsh’s nomination as preserving the central bank’s independence, countering earlier concerns sparked by President Donald Trump’s repeated comments that the next Chair would deliver additional rate cuts.

    Warsh is known for favoring a strong US Dollar during his previous tenure at the Fed, suggesting monetary conditions could remain relatively tight going forward.

    Looking ahead, investor focus will turn to the US Nonfarm Payrolls report for January, which is expected to play a key role in shaping expectations for the Federal Reserve’s future policy path.

    Silver technical analysis

    On the daily chart, XAG/USD is trading around $81.38, holding above the rising 50-day Exponential Moving Average near $79.50 and preserving the medium-term uptrend. The upward slope of the moving average continues to underpin the broader bullish bias. Meanwhile, the Relative Strength Index sits near 44, in neutral territory, reflecting a cooling in momentum after a previously overbought phase.

    As long as prices remain supported above the 50-day EMA, pullbacks are likely to attract initial buying interest around that dynamic level. However, the RSI’s position below 50 limits near-term upside, with a recovery above the midline needed to strengthen bullish momentum. If momentum stabilizes, buyers may look to extend the rebound, while a failure to regain traction could keep price action range-bound or tilt risks to the downside.

    Sources: Fxstreet

  • Oil prices tumble more than 3% on U.S.-Iran talks as OPEC+ keeps output steady.

    Oil prices slid sharply in Asian trading on Monday after reports of talks between the U.S. and Iran reduced some of the geopolitical risk premium in crude, while traders also took profits following recent gains.

    The decline came after the Organization of the Petroleum Exporting Countries and its allies (OPEC+) kept output levels unchanged at a weekend meeting, in line with expectations.

    Brent crude futures for April delivery plunged 3.3% to $67.07 a barrel by 20:31 ET (01:31 GMT).

    Oil had climbed to near six-month highs last week amid fears of increased U.S. military action against Iran, while severe cold weather in North America was also seen as a threat to supply. However, prices came under pressure on Monday as traders moved to lock in profits.

    Crude was further weighed down by a rebound in the U.S. dollar from recent four-year lows, after the greenback strengthened following President Donald Trump’s nomination of Kevin Warsh as the next Federal Reserve chair.

    Trump says Iran is in “serious talks” with the U.S.

    U.S. President Donald Trump said over the weekend that Iran was engaged in “serious talks” with his administration, raising the prospect of a possible easing of tensions between the two countries.

    His remarks followed statements from Iranian officials indicating that preparations were underway for negotiations with Washington.

    Trump has repeatedly warned of potential military action against Iran amid disputes over its nuclear program and domestic unrest, and has ordered the deployment of U.S. naval forces to the Middle East.

    The move heightened fears of renewed U.S. strikes on Iran, raising the risk of further geopolitical instability in the Middle East and potential disruptions to regional oil supply. Crude prices surged as markets factored in a higher geopolitical risk premium.

    Escalating tensions, alongside recent weather-related disruptions in the United States, helped lift oil prices despite lingering concerns over weak global demand and the possibility of an oversupplied market in 2026.

    More recently, a significant production outage in Kazakhstan has also provided support to oil prices.

    OPEC+ keeps output levels unchanged

    OPEC+ on Sunday kept its oil output for March unchanged, reinforcing its decision to pause further production increases despite a recent rise in crude prices.

    The group has raised output by roughly 2.9 million barrels per day through 2025, but announced an open-ended halt to additional hikes in November, after oil prices fell by around 20% over the past year.

    OPEC+ also offered no forward guidance on production, likely reflecting elevated uncertainty surrounding the global economic outlook and ongoing geopolitical risks.

    Sources: Investing

  • How does a weaker dollar affect gold and Bitcoin?

    Gold and Bitcoin have diverged sharply in recent months, with Yardeni Research arguing that currency movements are becoming a key driver of that split.

    In its latest report, the firm revisited the long-standing question of whether Bitcoin can be considered “digital gold,” pointing out that both assets are difficult to value since neither generates interest or dividends. However, Yardeni cautioned that Bitcoin’s purely digital form could make it “potentially vulnerable someday to hacking by quantum-computing algorithms,” whereas gold’s main drawback is the need for physical storage.

    Bitcoin’s volatility has persisted. Yardeni noted that the cryptocurrency surged to a record near $125,000 in late 2025 before retreating toward $90,000.

    Gold, by contrast, has been in a strong uptrend since it “decisively broke out” in March 2024. Prices have climbed roughly 2.5 times since then, moving above $3,000 an ounce in early 2025. The firm maintains its long-term outlook that gold could reach $10,000 by the end of the decade.

    According to Yardeni Research, recent currency shifts are widening the gap between the two assets. The firm said a weaker U.S. dollar tends to hurt Bitcoin because it lowers Bitcoin’s value in other currencies, potentially encouraging foreign investors to sell. Some of those flows, it suggested, may be rotating into gold instead.

    In addition, a softer dollar can put upward pressure on U.S. inflation, which would further support gold prices. Yardeni also noted that dollar weakness generally favors U.S. investors in overseas markets, reinforcing its overweight stance on emerging-market equities.

    Sources: Investing

  • Weekly Forex & Markets Outlook: WTI Crude, GBP/USD, EUR/USD, DAX, Gold, Silver, USD/JPY, USD/CHF

    WTI Crude Oil

    The $66 level in WTI crude oil has proven to be a notable resistance zone, and prices are now retreating from that area. There is considerable uncertainty in the market over whether potential strikes against Iran could occur over the weekend, adding a layer of geopolitical risk.

    Even so, underlying supply-and-demand dynamics remain a significant constraint on price action. As a result, large, sustained moves appear unlikely, and the prevailing strategy may continue to favor selling into rallies rather than chasing upside momentum.

    British Pound

    The British pound pushed above the 1.3750 level, but buying momentum now appears to be fading as selling pressure shows signs of exhaustion. Notably, the weekly candlestick resembles a shooting star, a pattern that often signals difficulty in sustaining further gains.

    From here, a pullback could see GBP/USD slide toward the 1.35 area, a major round number with strong psychological significance. Part of this shift in sentiment may be tied to Kevin Warsh’s nomination as the next Federal Reserve Chair, as his comparatively hawkish stance has strengthened expectations for tighter U.S. monetary policy, weighing on the pound.

    EUR/USD

    The euro staged a strong rally earlier in the week but then reversed sharply after the initial upside move. This price action suggests the market may be entering a period of consolidation, raising the possibility that the recent breakout was a false move.

    Much will depend on how traders respond to the nomination of the new Federal Reserve Chair. For now, the euro appears to be losing momentum. On the downside, the 1.16 level could come into play. However, if buyers step back in quickly over the coming week, the pair could regain strength and push higher, potentially revisiting the 1.20 area, with a further extension toward 1.23 if bullish momentum builds.

    DAX

    The German DAX has spent most of the week in negative territory but continues to hold above the 24,500 level, an area that has become important support after previously acting as resistance. This ability to stabilize at a former breakout zone suggests underlying buying interest remains intact.

    Overall, the index appears to be in the process of bottoming and potentially turning higher, with scope for a renewed push to the upside. Looking further ahead, the outlook remains constructive. Ongoing fiscal support and heavy government spending in Germany should provide a tailwind for equities, leading to expectations that the DAX could be among the stronger-performing indices this year. As a result, the broader bias remains bullish.

    Silver

    Silver has become the focal point of market discussion after an extraordinary week of price action. After surging to around $122, the metal suffered a dramatic reversal, ending Friday in what can only be described as a sharp selloff.

    In a single session, silver plunged below the $90 level, and momentum now suggests a potential move toward $80. After such an extreme rally, a correction was inevitable, and the market now appears to be experiencing that long-overdue pullback.

    The selloff was likely exacerbated by the nomination of a more hawkish-than-expected Federal Reserve Chair, adding pressure to precious metals. Even in normal conditions, silver is known for its volatility, and the current environment has only amplified those swings. For now, price action has become exceptionally unstable, making silver largely untradeable for many participants.

    Gold

    Gold has been hit hard as well, but unlike silver, it benefits from strong central bank support, which should help it recover more quickly. Silver had moved so far beyond its fundamental norms that it began to resemble the kind of speculative excess often seen in smaller cryptocurrencies.

    Gold, by contrast, continues to attract substantial institutional and central bank demand. That said, it is possible the market has already set a peak, although it may be too soon to say so definitively. Given the way trading unfolded on Friday, it is difficult to ignore the risk of continued downside follow-through.

    Still, considering that gold was trading near $1,700 just two years ago, some form of correction was inevitable. When markets become stretched and overheated, this kind of reset is ultimately unavoidable.

    USD/JPY

    The U.S. dollar initially sank sharply against the Japanese yen over the week, but that move has since reversed decisively. The rebound suggests markets may be reassessing what now appears to have been an overly aggressive bet against the dollar.

    Given the significant interest rate differential between the two currencies, this type of recovery is broadly in line with how the pair might be expected to trade. Technically, USD/JPY found support at the 50-week EMA, and if prices can reclaim the 155 level, the next upside target could be a move toward 158 yen.

    USD/CHF

    The U.S. dollar declined sharply against the Swiss franc, briefly testing the 0.76 level. While that price point may not be especially significant on its own, it does raise the possibility of Swiss National Bank intervention if franc strength becomes excessive—a risk that remains in the background.

    Technically, the pair appears to be forming a hammer pattern following the breakdown, and more importantly, the U.S. dollar has begun to strengthen more broadly across global markets. Taken together, these factors suggest USD/CHF could be setting up for a rebound in the near term.

    Sources: Christopher Lewis

  • WTI Crude Weekly Outlook: Gradual Gains as Speculative Buying Emerges

    WTI crude oil has delivered two consecutive weeks of gains, giving day traders a favorable backdrop, and closed the weekend trading near $65.73. Prices at this level were last seen in the final week of September.

    The previous period when WTI consistently held at similar elevated levels was from mid-June through the end of July 2025. While crude has traded higher at times since then, the notable development for technical traders is the growing durability of the current upward momentum.

    From a chart perspective, support around $60.00 per barrel remained intact throughout the past week and began to demonstrate strength as early as Friday, January 23. As the new trading week gets underway, this technical stability may encourage renewed speculative buying, with some traders positioning for further upside in WTI prices.

    Volatility and Turmoil Mark Commodity Markets Over the Past Week

    In reality, WTI crude oil has remained relatively orderly, particularly given the absence of any extreme or destabilizing price swings. While the commodity did move higher, the advance was measured rather than explosive.

    On Tuesday, WTI rose from the mid-$60 range to around the mid-$62 level, showing early signs of upward pressure. By Wednesday, prices continued to firm, reaching the mid-$63 area. Momentum strengthened further into Thursday and Friday, when price action clearly accelerated to the upside, reinforcing the constructive tone in crude oil trading.

    By comparison with the turmoil seen in metals markets—and even in soft commodities such as cocoa and coffee—WTI crude oil has remained relatively restrained. Whether that composure will persist is an open question.

    Commodity markets often experience bursts of speculative intensity in cycles, yet WTI has been notably subdued over the past several months. That said, the prolonged bearish trend, marked by steadily declining prices, appears to have paused and reversed, with crude moving higher over the last two weeks.

    While geopolitical risks tied to Iran remain in the background, they are unlikely to be the primary driver behind the recent upside move in WTI prices.

    Iran, Venezuela, and Shifting Dynamics in the Global Energy Market

    Few things dominate markets like noise, with well-intentioned commentary offering countless explanations for sudden price moves in commodities. Weather events, wars, politics, trade agreements—even trivial anecdotes—are all quickly cited as causes. But the question remains: how many of these explanations actually reflect the true drivers behind price changes?

    • Commodity traders are highly seasoned, and major market participants operate with extensive intelligence gathered over months and even years. They work within long-term outlooks, but there is also one unavoidable factor: speculation.
    • At times, commodities move quickly simply because large orders enter the market and collective sentiment shifts. WTI crude oil is no exception to these forces. Over the past two weeks, buying interest in the energy sector has clearly increased.
    • Is this driven by speculative positioning, concerns about potential instability in the Middle East, or a blend of both? Beyond those considerations, fundamentals such as supply and demand also play a role—and by most measures, they remain relatively strong.

    WTI Crude Oil Weekly Outlook: Market Poised After Recent Stabilization

    The speculative trading range for WTI crude oil is seen between $59.20 and $70.10.

    WTI has clearly pushed higher, with the $60.00 level and the mid-$60s now appearing to act as near-term support. As the new week begins, the key question is whether the $65.00 area can hold and establish itself as a more durable floor. Broader commodity markets have displayed renewed strength across several sectors in recent weeks.

    The sharp advance in WTI may seem sudden, but it reflects a noticeable return of buying interest. Seasoned traders know crude oil has sustained higher price levels in the past, and its ability to post and maintain incremental gains has been evident over the last two weeks.

    That said, risk management remains critical when trading WTI. Price reversals can occur quickly, and without disciplined controls, such moves can result in significant losses for speculative traders.

    Sources: Robert Petrucci

  • Alamos CEO says gold prices may approach $6,000 by year-end

    Gold prices climbed to a new record above $5,600 an ounce this week, as persistent economic and geopolitical uncertainty continued to push investors toward traditional safe-haven assets.

    The metal is up more than 17% so far this year, building on last year’s strong advance. Gold’s sustained rally has been driven by a combination of heightened global uncertainty, expectations of lower U.S. interest rates, and consistent purchases by central banks as part of a broader move to diversify away from the U.S. dollar.

    Market anxiety has intensified in recent days after President Donald Trump said he intends to impose new tariffs on imports from South Korea, while concerns over a potential partial U.S. government shutdown re-emerged ahead of the January 30 funding deadline.

    Following bullion’s surge to record highs, Investing.com spoke with John McCluskey, chief executive of Canadian miner Alamos Gold (NYSE: AGI), to explore the factors behind the rally and his outlook for gold prices over the rest of the year.

    To what extent is today’s gold price driven by long-term structural demand, as opposed to short-term momentum and fear of missing out (FOMO)?

    McCluskey noted that gold prices are currently strongly underpinned by sustained central bank purchases from at least six countries, including China, Russia, and their trading partners. This long-term structural demand has steadily pushed gold higher over the past decade, with prices hitting a new peak above $5,000 this week.

    That rise has increasingly drawn in retail investors. According to fund managers, gold funds are experiencing record inflows, which is boosting both bullion prices and gold equities. Overall, structural demand remains the primary driver of current prices, but it has now spilled over into momentum-driven buying from retail investors.

    How much does gold’s outlook hinge on additional U.S. interest rate cuts, and what would be the impact if the easing cycle ends earlier than markets anticipate?

    “While U.S. Fed rate cuts may play a role, I don’t think gold’s outlook hinges on further easing, as prices have been—and continue to be—strongly supported by central bank buying. This trend has been in place for around a decade, and I believe there is still plenty of upside, with or without rate cuts,” McCluskey said.

    Would a potential easing of global geopolitical tensions be sufficient to trigger a significant pullback in gold prices?

    “While de-escalation could weigh on gold prices, there are numerous other tailwinds supporting the market, and I don’t see those trends fading anytime soon,” McCluskey told Investing.com.

    “I expect gold prices to continue rising. And it’s not just gold mining CEOs saying this—chief executives at major banks are also pointing to a stronger gold outlook,” he added.

    What is your outlook for gold prices by year-end?

    I believe the fundamental drivers supporting gold remain firmly in place, pointing to a sustained bull market. With retail investors only now beginning to participate, gold could consolidate around the current $5,000 level and potentially move toward analysts’ year-end targets in the $5,400–$6,000 range.

    Despite hitting record highs earlier in the week, precious and industrial metals retreated on Friday, as gold, silver, and copper declined amid profit-taking. The pullback followed a reassessment of expectations for aggressive U.S. interest rate cuts, alongside a stronger dollar.

    Spot gold slid more than 6% to $5,042 by 10:55 ET (15:55 GMT).

    The dollar gained after President Donald Trump announced former Federal Reserve Governor Kevin Warsh as his choice to lead the central bank, boosting the greenback against major currencies.

    Sources: Investing

  • Copper in an Electrified World

    Over the past year, market focus has largely centered on gold and silver, with investors weighing safe-haven demand, central bank purchases, and inflation concerns. Meanwhile, copper has been quietly revaluing. So far this year, copper is up about 4%, following a roughly 40% surge in 2025. Analysts increasingly warn that copper demand could exceed supply within the next decade.

    Introduction

    When Thomas Edison brought electricity to cities in the late 1800s, copper was essential for carrying power from generating stations to homes, factories, and public lighting. Over time, it has become a cornerstone of modern economies, deeply integrated into energy networks, industrial activity, transportation, and communications. Today, its role is more critical than ever.

    Copper now underpins electrification, AI infrastructure, electric vehicles, and defence systems. Yet the pace and scale of this shift are pushing the limits of global supply. According to S&P Global, without substantial new investment, the world could face a copper deficit of roughly 10 million metric tons by 2040.

    Copper’s record-high prices point to a fundamental shift in demand dynamics.

    At the start of the year, copper prices reached new record highs on the London Metal Exchange (LME), climbing to $13,407 per metric ton. So far this year, copper is up about 3%, building on a strong rally of roughly 40% in 2025.

    Historically, copper has behaved as a cyclical commodity, moving in step with global economic growth, especially construction and manufacturing. In past upswings, prices typically weakened once growth cooled or inventories were replenished. This time, though, the forces supporting demand look wider in scope and more enduring.

    A growing proportion of copper use is now tied to long-term electrification trends that are far less sensitive to short-term economic cycles.

    From the demand side, copper is indispensable as an electrical conductor. It allows efficient power transmission, resists corrosion, has inherent antimicrobial properties, and can be recycled repeatedly without losing performance. Viable substitutes are scarce. Aluminium is often mentioned as an alternative, but with only about 60% of copper’s conductivity, it requires thicker cables to deliver the same current and typically needs extra insulation because it dissipates heat less effectively.

    S&P Global projects that global copper demand will rise by roughly 50% by 2040, increasing from about 28 million metric tons today to around 42 million. This expansion is being driven by four key forces: baseline economic demand, the energy transition and new capacity build-out, AI and data centres, and defence modernisation.

    While traditional economic uses and energy-transition applications are expected to remain the dominant sources of growth, Asia is likely to account for around 60% of the additional demand.

    Around three-quarters of global copper demand comes from electrical uses, including power generation, transmission and distribution, electronics, and electrical equipment. Construction remains the largest single end-market, with copper heavily used in building wiring, plumbing, heating and cooling systems, and renovation projects. This provides a relatively stable foundation for demand, even when economic growth slows.

    The energy transition adds another powerful layer of demand. As transport and power systems become increasingly electrified, copper usage is rising across the economy. Electric vehicles are a key driver of this shift, as they contain nearly three times as much copper as internal combustion engine vehicles—about 2.9 times more—reflecting the added requirements for wiring, batteries, power electronics, and electric motors.

    More recently, AI and data centres have become a rapidly expanding source of copper demand. S&P Global estimates that copper consumption from data centres could increase from about 1.1 million metric tons in 2025 to roughly 2.5 million metric tons by 2040. Much of this growth reflects the copper needed for internal power distribution, cooling infrastructure, and the grid connections that supply these facilities. By the end of the decade, AI training data centres alone are expected to represent more than half of total data-centre-related copper demand.

    Beyond these established drivers, emerging technologies may provide additional upside. Humanoid robotics is still in its early stages, but it is relatively copper-intensive. A single humanoid robot typically contains between 4 and 8 kilograms of copper, used across motors, actuators, wiring, sensors, batteries, and semiconductors. Even modest adoption scenarios could therefore have a meaningful impact on demand.

    Defence is another area where copper consumption is set to rise. Heightened geopolitical tensions and the modernisation of military capabilities are leading to higher defence spending and quicker deployment of advanced technologies. Copper is extensively used in military equipment and infrastructure due to its conductivity, durability, and reliability in electrical systems, communications, and propulsion.

    Given copper’s strategic role, much of this investment is relatively insensitive to price. At the 2025 NATO summit in The Hague, member states committed to lifting defence spending to 5% of GDP. As a result, annual copper demand from defence applications is expected to approach 1 million metric tons by 2040—around three times current levels.

    A Constrained and Rigid Supply Landscape

    While global demand continues to rise, supply is expected to stay tight as existing mining assets age. Without substantial additions to capacity, the market could face a shortfall of roughly 10 million metric tons by 2040.

    Bridging this gap will be one of the major challenges of the coming decades, as the supply response is both complex and structurally limited. Substitution offers little relief, given copper’s unmatched conductivity, durability, and recyclability.

    Over time, mine depletion has made copper extraction more technically difficult and more expensive, while producers are also contending with tighter regulation and rising environmental and social opposition from local communities.

    These vulnerabilities have already led to repeated supply disruptions. Freeport-McMoRan has declared force majeure at its Grasberg mine—the world’s second-largest copper operation, accounting for roughly 4% of global output—with a full recovery not expected until 2027. Disruptions are also set to continue this month following strikes at Capstone Copper’s Mantoverde mine in Chile.

    Source: Morgan Stanley

    Bringing new copper projects online is a lengthy process, typically taking close to two decades—around 17 years—from initial discovery to first production, reflecting regulatory, environmental, political, and cost hurdles. Even so, today’s price levels do not provide strong enough incentives to develop major new deposits by 2040. Most high-quality, easily accessible resources have already been exhausted or are currently in production.

    This underscores the importance of maximising output from existing mines, improving operational efficiency, and simplifying permitting processes and incentive structures for new developments. Future supply growth will increasingly rely on deeper exploration, which is both more expensive and technically challenging. Although several deposits have been identified that could theoretically help meet future demand, many are unlikely to be developed because they are not viable under current prices or with existing technologies.

    Secondary supply from recycling offers an important supplementary source but cannot fully bridge the gap. Unlike many other metals, copper retains its key properties when recycled, making recycled material virtually indistinguishable from newly mined copper. As copper use expands across the economy, more scrap will become available as equipment and infrastructure reach the end of their life cycles.

    End-of-life copper waste is expected to grow by about 4% annually, surpassing 15 million metric tons by 2040. S&P Global estimates that if recycling rates increase from 50% in 2025 to 66% by 2040, recycled copper from end-of-life sources could add roughly 6 million metric tons to total supply.

    The expansion of recycling hinges on more efficient collection and processing systems. While scrap supply is more flexible than mined output, policy support will be critical to scaling recycling globally. Regions such as the United States, the European Union, and China have already implemented measures to set recycling targets or invest in supporting infrastructure.

    These initiatives are designed to boost secondary copper supply while lowering environmental impacts. Even with significant gains in processing efficiency, recycling is expected to account for at least one-third of total copper supply by 2040.

    Meanwhile, smelting and refining are heavily concentrated in China, making them a strategic chokepoint in the global supply chain. China controls a large share of global smelting capacity—around 12 out of 29 million metric tons worldwide—and continues to expand this position, further increasing industry concentration.

    Processing margins are coming under growing pressure as treatment and refining charges decline, while costs and regulatory burdens vary widely by region. At the same time, the high concentration of capacity—estimated at around 40–50% of the global total—adds to systemic fragility and increases exposure to geopolitical disruptions.

    For these reasons, governments increasingly view mineral supply chains as strategically vital. New models of international cooperation, along with greater participation by sovereign wealth funds, are emerging as alternative ways to strengthen and diversify access to critical minerals and reduce reliance on China-centric supply chains.

    Conclusion: A Global Race for Critical Metals

    The global economy is entering a phase of exceptional expansion in renewable energy, electric vehicles, artificial intelligence, data centres, and defence, all of which are driving a sharp increase in copper demand—the cornerstone metal of electrification. New technologies, ranging from electrified military systems to advanced robotics, are likely to intensify this trend further. The pace of electrification is now running ahead of the growth in copper supply.

    This race extends beyond geological availability to the downstream stages that determine mineral quality and value. China’s dominance in copper refining and magnet production represents a major vulnerability for global supply chains, prompting advanced economies such as the European Union to launch initiatives aimed at securing alternative sources and accelerating the development of domestic capabilities.

    Sources: Charles-Henry Monchau

  • Looking ahead to the week ahead: Warsh takes center stage alongside central banks

    The US Federal Reserve experienced an eventful week. On Monday, it contacted New York–based banks to assess their USD/JPY exposure, sparking speculation that Washington could be coordinating with Japan to address the Japanese Yen’s weakness. This development prompted a sharp sell-off in the US Dollar early in the week.

    The Fed’s midweek policy meeting resulted in no change to the federal funds rate, which was kept within the 3.50%–3.75% range, in line with expectations. During his press conference, Chair Jerome Powell avoided questions related to politics, his tenure, and the subpoena. However, he pointed to improving economic momentum and reduced risks to both inflation and the labor market.

    The US Dollar Index (DXY) has since rebounded toward the 96.90 level, recovering most of its weekly losses after President Donald Trump nominated former Fed Governor Kevin Warsh as the next Fed Chair on Friday. The nomination now awaits Senate approval. Looking ahead, the US is set to release several key data points next week, including the ISM Manufacturing PMI for January, MBA mortgage applications, Challenger job cuts, and weekly initial jobless claims.

    EUR/USD is hovering around the 1.1880 area after the US Dollar rebounded and recovered nearly all of its weekly losses. In the coming week, Hamburg Commercial Bank (HCOB) will release Manufacturing, Services, and Composite PMIs for both Germany and the Eurozone. Additional Eurozone data include the ECB Bank Lending Survey and December Producer Price Index (PPI), while Germany will publish December Factory Orders and Industrial Production figures.

    GBP/USD is trading near 1.3600 ahead of the Bank of England’s monetary policy announcement on Thursday. Governor Andrew Bailey’s subsequent press conference is expected to shed further light on the central bank’s outlook for interest rates. UK data releases include the final January S&P Global PMIs and the Halifax House Price Index.

    USD/JPY is holding close to the 154.50 level, paring earlier gains after Tokyo CPI data indicated easing inflation in January. Headline inflation slowed to 1.5% year-over-year from 2% in December, while core measures eased to 2%, undershooting forecasts. The softer inflation profile reduces pressure on the Bank of Japan to tighten policy.

    USD/CAD is trading around 1.3580, with the Canadian Dollar maintaining a slight edge against the greenback despite data showing economic stagnation in November. Monthly GDP was flat following a 0.3% contraction in the prior month and fell short of expectations for modest growth. Upcoming Canadian releases include January S&P Global PMIs and the Ivey PMI.

    Gold is trading near the $4,880 area after surrendering all weekly gains. Prices retreated from a record high of $5,598 as profit-taking emerged and the US Dollar strengthened sharply.

    Looking ahead: Emerging views on the economic outlook

    Scheduled central bank speakers for the week:

    Monday, February 2:
    – Bank of England’s Breeden
    – Federal Reserve’s Bostic

    Tuesday, February 3:
    – Federal Reserve’s Barkin

    Wednesday, February 4:
    – Federal Reserve’s Cook

    Thursday, February 5:
    – Bank of England Governor Andrew Bailey
    – Federal Reserve’s Bostic
    – Bank of Canada Governor Tiff Macklem

    Friday, February 6:
    – European Central Bank’s Cipollone
    – European Central Bank’s Kocher
    – Bank of England’s Pill
    – Federal Reserve’s Jefferson

    Central bank meetings and upcoming data set to influence monetary policy decisions

    Key economic data and policy events for the week:

    Monday, February 2:
    – Germany’s December Retail Sales
    – US ISM Manufacturing PMI

    Tuesday, February 3:
    – Reserve Bank of Australia monetary policy decision
    – US December JOLTS job openings

    Wednesday, February 4:
    – Eurozone January Harmonized Index of Consumer Prices (HICP)
    – US January ADP employment report

    Thursday, February 5:
    – Australia’s December trade balance
    – Eurozone December retail sales
    – Bank of England monetary policy decision
    – European Central Bank monetary policy decision

    Friday, February 6:
    – Canada’s January employment change
    – US January nonfarm payrolls
    – US February Michigan consumer sentiment

    Sources: Fxstreet

  • Silver Poised to Exceed $120 as Equity Breakout Falters

    So it turns out technicals still matter.

    I’ve been highlighting a $120 target for silver for months, most recently again on Monday. In fact, the first time I presented the chart projecting $120 as a long-term objective was years ago. That level has now been reached.

    Silver futures peaked at $121.75 before plunging below $107, eventually stabilizing near $110. The magnitude of the intraday reversal is a stark reminder that the white metal can fall even faster than it rises.

    Recall that in 2011, silver erased two months of gains in just six trading days. If history were to repeat, prices would be sitting just above $50 before Valentine’s Day. Possible? Yes—but the decline doesn’t need to be nearly as violent.

    A Potential Top Forming in Silver

    That said, it’s still possible silver pushes higher in the near term. The metal didn’t collapse by tens of dollars—it was simply extremely volatile earlier today. However, with the long-term target now achieved, and considering conditions in the U.S. Dollar Index and the broader equity market, there’s a growing case that silver may have just put in a top.

    The equity market may be especially critical in this context. The recent rebound in the U.S. Dollar Index failed to spark meaningful declines in precious metals, but today’s selloff in equities triggered much sharper downside moves. That contrast is an important signal.

    Stocks have once again been unable to hold above their 2025 highs, suggesting the rally may be exhausted. While this is another in a series of similar invalidations, the magnitude of today’s intraday decline in precious metals hints that this episode could be different.

    Adding to the cautionary tone, short-term weakness in mining stocks is also notable.

    I highlighted the red rectangle to illustrate how current prices in GLD, SLV, and GDXJ compare with last week’s levels. In short, gold and silver are higher, while miners are lower—exactly the type of divergence that often marks the end of a rally.

    Bitcoin Selloff Gains Momentum

    Another important signal is the accelerating decline in Bitcoin.

    After confirming its breakdown below the flag pattern, Bitcoin fell roughly 5% today.

    I previously noted that for those not yet short Bitcoin, this represented an attractive opportunity to initiate or add to positions if sizing felt insufficient. From a risk–reward perspective, that view still stands. The so-called “new gold” was perched at the edge—and has now taken its first decisive step lower.

    Last but not least—gold. The yellow metal initially surged, only to reverse sharply, plunging nearly $500 on an intraday basis. When I first became interested in the precious metals market many years ago, gold’s entire nominal price was well below that amount. Time flies—and so has the price of gold. That said, it appears gravity may be about to reassert itself once again.

    Sources: Golden Meadow

  • Gold Maintains Strong Momentum While Rotating Deep Within Upper Volatility Bands

    Gold futures continue to show strong bullish momentum, holding well above the VC PMI Daily Pivot near $5,329, reinforcing higher-timeframe trend alignment across both daily and weekly cycles. The sharp, near-vertical advance that began earlier this week is characteristic of classic “escape velocity” behavior, with price accelerating away from the mean during a synchronized time-and-price harmonic window.

    Within the VC PMI framework, price is now rotating inside the upper volatility band. Daily Sell 1 near $5,465 defines the first layer of structural resistance, while Daily Sell 2 around $5,588 marks the outer boundary of the current expansion envelope. The recent intraday peak near $5,626.8 indicates price is pressing into a late-stage extension phase, where probabilities begin to shift toward consolidation or orderly mean reversion rather than continued vertical advance.

    Square of 9 geometry supports this view. Angular projections from the latest weekly VC PMI Pivot near $4,864 project resistance harmonics into the $5,560–$5,620 region, closely overlapping with the Daily Sell 2 band. This confluence of time, price, and geometric resistance elevates the likelihood of a near-term inflection window.

    On the downside, rotational support remains layered at Daily Buy 1 near $5,205 and Daily Buy 2 near $5,070, with deeper mean support at the weekly VC PMI Pivot around $4,864 should downside volatility expand.

    Cycle analysis further identifies a key timing cluster between January 29 and February 2, derived from overlapping 30-day and 60-day harmonics. Historically, such windows tend to resolve momentum conditions via either range compression or a counter-trend rotation back toward the VC PMI mean. Momentum indicators, including MACD divergence behavior, suggest upside efficiency is fading, reinforcing the risk of a pause or rotational pullback rather than immediate continuation.

    From a strategic standpoint, trend-following participants may continue to trail protective stops below $5,205, while mean-reversion traders will look for rejection signals within the $5,560–$5,620 Square of 9 resistance arc. A sustained close above $5,588 would negate the near-term mean-reversion risk and reopen the path toward higher geometric extensions.

    Sources: Golden Meadow

  • WTI slips toward $64.00 despite heightened geopolitical tensions

    • WTI prices slipped but were still on course for roughly 12% monthly gains, underpinned by elevated geopolitical risk premiums.
    • Iran warned of an unprecedented response following renewed threats from President Trump over nuclear negotiations.
    • Meanwhile, the Trump administration loosened some sanctions on Venezuela’s oil sector on Thursday to attract U.S. investment.

    West Texas Intermediate (WTI) crude edged lower after three consecutive sessions of gains, trading near $64.00 a barrel during Asian hours on Friday. Still, the benchmark remained on track for about a 12% monthly increase, supported by a strengthening geopolitical risk premium.

    Geopolitical tensions stayed elevated after Iran warned it would “defend itself and respond like never before” following renewed threats from U.S. President Donald Trump, who urged Tehran to engage in nuclear negotiations. Iranian officials cautioned that any provocation would be met with retaliation.

    Tensions escalated further after the European Union designated Iran’s Islamic Revolutionary Guard Corps as a terrorist organization. Concerns were compounded by reports that the United States was bolstering its military presence near Iran, while Tehran announced live-fire military exercises in the strategically vital Strait of Hormuz, heightening worries over regional security.

    Markets are closely watching the potential impact of these developments on shipping through the Strait of Hormuz, a critical chokepoint between Iran and the Arabian Peninsula that handles daily flows of crude oil and LNG. According to Dow Jones Newswires, Westpac Strategy Group warned that any regime change in Iran would likely be disorderly, unlike the U.S-backed removal of Venezuela’s Nicolas Maduro or targeted strikes such as those on Fordow.

    Separately, the Trump administration eased certain sanctions on Venezuela’s oil sector on Thursday to attract U.S. investment following President Nicolas Maduro’s removal earlier this month. The U.S. Treasury authorized transactions involving Venezuela’s government and state-run PDVSA, allowing U.S. firms to produce, transport, sell, and refine Venezuelan crude.

    Earlier this month, oil prices also drew support from supply disruptions in Kazakhstan, freeze-offs in the United States, and tighter U.S. restrictions on Russian oil purchases, helping underpin prices this year despite lingering expectations of global oversupply.

    Sources: Fxstreet

  • Gold volatility surges as prices behave like a meme stock

    Gold’s most recent move was sharp, chaotic, and relentless. With volatility running high and prices stretched, managing risk is just as critical as getting the direction right.

    • Gold shows capitulation-like price behavior
    • Volatility jumps to multi-year highs
    • Prices look stretched after a rapid upside surge
    • Position sizing and risk management become paramount

    Gold shows meme-stock–like trading behavior

    Gold behaved less like a classic safe haven and more like a meme stock on Thursday, surging nearly $100 within minutes during early Asian trading. Prices briefly spiked toward $5,600 before reversing just as quickly. The sheer speed and magnitude of the move felt like capitulation in real time, likely exacerbated by thin liquidity during the transition from North American to Asian market hours.

    Although the price surge began around the same time, a CNN report later surfaced indicating that the U.S. was considering new military strikes against Iran. However, given that geopolitical tensions have been elevated for weeks rather than emerging suddenly, much of that risk was likely already priced in. In that sense, the headline appears more like a catalyst than the underlying cause of the move.

    Some traders also cited comments from Fed Chair Jerome Powell after the January FOMC meeting, in which he downplayed any macroeconomic signal from gold’s record highs. Still, those remarks seem to have played only a minor role, coming several hours before the most volatile phase of the price action unfolded.

    Volatility jumps sharply higher

    While today’s spike has understandably drawn attention, it is not an isolated event, instead forming part of a broader and accelerating expansion in volatility across the gold market.

    As illustrated above, the Gold Volatility Index (GVZ) has climbed to its highest level since the early days of the COVID-19 lockdowns in 2020, highlighting just how extreme price action in the traditional safe haven has become. GVZ measures implied volatility in gold options, offering insight into the magnitude of price swings the options market is anticipating. The surge suggests the market has entered a markedly different volatility regime, one in which unusually large moves are occurring with increasing frequency.

    The broader volatility environment is also clearly visible on the daily chart. Gold is trading well above its upper Bollinger Band, highlighting the speed and magnitude of the recent acceleration relative to prior conditions. Daily trading ranges have expanded sharply, with the 14-day ATR elevated at 117.56—making $100-plus moves routine rather than exceptional. Meanwhile, the 14-day RSI sits deep in overbought territory at 91.15, reinforcing that while the broader uptrend remains intact, price action is increasingly stretched and unstable.

    Risk management takes center stage

    In short, this is an exceptionally high-volatility environment where price behavior is far from normal. Gold has surged rapidly, leaving prices highly extended and vulnerable to sharp moves in both directions, even as the broader uptrend remains in place. In such conditions, traditional technical signals often lose reliability, making risk management and position sizing especially critical—particularly with mean-reversion risks running high.

    Sources: David Scutt

  • Gold and silver surge to record levels amid rising US–Iran tensions, boosting safe-haven demand.

    Gold prices jumped to a record near $5,600 per ounce on Thursday, extending recent gains after reports that U.S. President Donald Trump was weighing a new strike on Iran. Silver also climbed to a record above $119 per ounce, supported by strong safe-haven demand.

    Metal prices continued to climb with little sign of easing, driven by escalating global geopolitical tensions that boosted demand for physical assets and traditional safe havens. Additional support came from a weaker U.S. dollar and uncertainty surrounding U.S. policy, while copper prices also reached a new all-time high on Thursday.

    Spot gold jumped more than 2% to a record $5,595.41 per ounce, and April gold futures peaked at $5,625.89 per ounce. Although prices later retreated from these highs, gold was still trading comfortably above $5,500 per ounce by 00:45 ET (05:45 GMT).

    Spot silver also rose sharply, gaining over 1% to a record $119.4280 per ounce.

    “Gold is no longer viewed solely as a hedge against crises or inflation,” OCBC analysts noted. “It is increasingly seen as a neutral, dependable store of value that also offers diversification across a broad range of macroeconomic environments.”

    They added that this shift in perception helps explain why recent pullbacks have been limited and well-supported. OCBC has recently raised its 2026 gold price forecast to $5,600 per ounce.

    Trump considering major strike on Iran

    Former President Donald Trump is reportedly weighing a “major new strike” against Iran after talks over Tehran’s nuclear program and missile development broke down, CNN reported Wednesday night.

    The report follows Trump’s decision to deploy multiple U.S. naval vessels to the Middle East, alongside earlier threats of military action that he framed as backing nationwide protests in Iran.

    Earlier on Wednesday, Trump posted on social media urging Iran to reach a “fair and equitable” agreement with Washington and to abandon its nuclear ambitions. He also warned that any future U.S. strike would be significantly more severe than the mid-2025 attack, when American forces targeted Iran’s key nuclear facilities.

    According to CNN, Trump is now considering airstrikes aimed at Iranian political leaders and security officials accused of killing protesters, as well as additional attacks on nuclear sites.

    Any further U.S. military action could sharply escalate tensions in the Middle East, with Iran having pledged strong retaliation against such moves.

    U.S.-centric geopolitical risks have continued to support gold and other safe-haven assets, particularly after Washington launched a military incursion in Venezuela earlier this month. Trump’s demands related to Greenland also added to these tensions, though his rhetoric on that issue has eased in recent weeks.

    Meanwhile, gold prices showed little reaction to the U.S. Federal Reserve’s widely expected decision to keep interest rates unchanged, as the central bank also offered an optimistic assessment of the U.S. economic outlook.

    However, Chair Jerome Powell refrained from responding to questions regarding the Federal Reserve’s independence amid an ongoing Department of Justice investigation.

    Platinum gains ground as copper reaches a record high

    Strength in gold prices spilled over into the wider metals complex, supported by a weaker dollar and growing investor demand for safe-haven, physical assets viewed as neutral stores of value.

    Spot platinum climbed 2.6% to $2,775.73 per ounce, staying near recent highs. The precious metal remained close to record levels reached earlier this month, after largely moving in step with gold through late 2025.

    Copper also joined the broader metals rally, with benchmark futures on the London Metal Exchange surging more than 6% to a record $14,123.95 per tonne.

    Prices were further lifted by reports pointing to additional policy support for China’s struggling property sector. As the world’s largest copper importer, China’s real estate industry represents a significant share of global copper demand.

    Sources: Investing

  • Gold hits new record above $5,200 as Fed decision looms

    Gold prices climbed toward a fresh record near $5,220 during Asian trading on Wednesday, extending gains on a weaker U.S. dollar, persistent geopolitical tensions and ongoing economic uncertainty. Investors are now awaiting the Federal Reserve’s interest rate decision later in the day for further direction.

    Fundamental Analysis Overview

    Expectations of further policy easing by the U.S. Federal Reserve, persistent selling pressure on the U.S. dollar, continued central bank purchases, and record inflows into exchange-traded funds have provided strong support for gold prices.

    Although U.S. President Donald Trump stepped back from a tariff threat after saying a framework agreement had been reached on a future Greenland deal with NATO, the brief episode raised concerns about the reliability of global alliances. These doubts, combined with the prolonged Russia–Ukraine conflict, continue to fuel safe-haven demand for gold. Russia launched another large-scale drone and missile assault on Ukraine during the second day of U.S.-mediated peace talks in Abu Dhabi over the weekend, which concluded without an agreement. While trilateral discussions are set to resume on February 1, expectations for a breakthrough in the nearly four-year conflict remain low, keeping geopolitical risks elevated.

    Further weighing on market sentiment, Trump warned on Saturday that the U.S. could impose a 100% tariff on Canada should it proceed with a trade agreement with China. The possibility of renewed tensions over Greenland and other unpredictable policy moves from the Trump administration has undermined confidence in the U.S. dollar. As a result, the Dollar Index (DXY) has fallen to its lowest level since September 2025, pressured further by market expectations that the Fed could cut rates twice more in 2025. This environment continues to favor non-yielding assets such as gold, particularly as attention turns to the two-day FOMC meeting that began on Tuesday.

    The Federal Reserve is set to announce its policy decision on Wednesday and is widely expected to keep interest rates unchanged. As such, investor focus will center on the accompanying statement and Fed Chair Jerome Powell’s press conference for signals on the future policy path. Any guidance on the timing and pace of potential rate cuts will be critical in shaping near-term dollar movements and determining gold’s next directional move. In the shorter term, U.S. Durable Goods Orders data due later Monday could generate trading opportunities during the North American session.

    On the demand side, the People’s Bank of China extended its gold-buying streak for a fourteenth consecutive month in December. Other emerging market central banks, including those of Poland, India, and Brazil, were also active buyers in late 2025 and early 2026. Meanwhile, global investment demand through gold ETFs rose 25% in 2025, with total holdings increasing to 4,025.4 tonnes from 3,224.2 tonnes a year earlier. Assets under management climbed to $558.9 billion, reinforcing gold’s bullish case and supporting expectations for a continuation of the well-established uptrend amid a favorable fundamental backdrop.

    XAU/USD Technical Outlook

    The rising channel originating from $4,464.07 continues to support the broader uptrend, with upside currently constrained near $5,101.21. The MACD remains in positive territory, although the histogram is starting to narrow, indicating fading momentum even as the MACD line stays above the signal line. Meanwhile, the RSI is elevated around 78, signaling overbought conditions that may limit near-term gains and favor consolidation near the upper boundary of the channel.

    Should prices fail to break decisively above the channel top, a corrective move toward support at $4,934.92 could develop. Further contraction in the MACD histogram would strengthen the case for a pullback, while a downturn in the RSI from overbought levels would point to mean reversion within the channel. On the other hand, if bullish momentum persists and MACD remains supportive, the prevailing uptrend would stay intact, maintaining the upside bias defined by the ascending channel.

    Sources: Fxstreet

  • Oil prices gain on U.S. supply disruptions and weaker dollar

    Oil prices climbed in Asian trading on Wednesday, extending the previous session’s gains after severe cold weather disrupted U.S. production, signaling tighter supply conditions.

    Crude was also supported by a weaker dollar, which slid to near a four-year low this week, while markets continued to monitor heightened tensions between the United States and Iran following comments from President Donald Trump that a second armada was heading to the Middle East.

    Brent futures for March edged up 0.1% to $67.66 a barrel, hovering near a four-month high, while U.S. West Texas Intermediate futures rose 0.2% to $62.53 a barrel by 20:49 ET (01:49 GMT).

    Oil prices jump as U.S. snowstorm disrupts supply

    Oil’s advance this week was largely fueled by a powerful winter storm sweeping across the United States, which disrupted crude output in several producing regions.

    Exports from the U.S. Gulf Coast were also brought to a standstill, as heavy snowfall and sub-zero temperatures blanketed large parts of the country. According to Reuters estimates, roughly 2 million barrels per day of production were affected over the weekend.

    These supply interruptions have prompted traders to brace for sharp drawdowns in U.S. crude inventories in the weeks ahead, signaling tighter supply conditions in the world’s largest oil-consuming market.

    API data points to declining U.S. inventories

    Figures from the American Petroleum Institute released late Tuesday showed an unexpected decline in U.S. crude inventories last week. Stockpiles fell by roughly 250,000 barrels, according to the API, defying expectations for a 1.45 million-barrel build.

    The API report often foreshadows a similar trend in the official inventory data, which is scheduled for release later on Wednesday.

    Oil gains on softer dollar ahead of Fed rate call

    A weaker dollar also lent support to oil prices, as declines in the greenback tend to boost demand for commodities priced in the U.S. currency.

    The dollar index fell to near a four-year low on Tuesday, weighed down by investor concerns over U.S. economic uncertainty, the impending Federal Reserve interest rate decision, and intermittent trade and geopolitical policy moves under President Donald Trump.

    The Fed is broadly expected to keep interest rates unchanged at the end of its meeting later in the day, with markets focused on signals from Chair Jerome Powell regarding the policy outlook for the year ahead.

    Sources: Investing

  • Gold surges to a record above $5,200 an ounce as safe-haven demand rises and the dollar weakens

    Gold prices climbed to a record above $5,200 an ounce on Wednesday, supported by robust safe-haven demand and persistent weakness in the U.S. dollar. Other precious metals also stayed firm, with silver and platinum trading near recent record highs.

    Spot gold edged lower to $5,179.41 an ounce by 19:55 ET (00:55 GMT) after briefly touching a record peak of $5,202.06. Meanwhile, April gold futures jumped 1.8% to $5,215.46 an ounce.

    Safe-haven demand remained strong after U.S. President Donald Trump said a second armada was heading toward Iran, while expressing hope that Tehran would agree to a deal with Washington.

    Gold’s rally this year has been largely driven by uncertainty surrounding U.S. policy, with heightened geopolitical tensions fueled by developments in Venezuela and a dispute over Greenland.

    A weaker dollar also provided support to gold and broader metals markets, as investor concerns grew over elevated fiscal spending and the Federal Reserve’s independence under the Trump administration. Policy uncertainty pushed the dollar to multi-year lows earlier this week.

    Trump said on Tuesday that he was close to naming a successor to Fed Chair Jerome Powell, adding that interest rates would decline under new leadership. Ongoing friction between the White House and the Federal Reserve has further underpinned gold prices, as markets remain wary of political pressure on the central bank.

    Elsewhere in metals markets, spot silver gained 1.2% to $113.4325 an ounce, while spot platinum climbed 0.6% to $2,669.61. Both were trading near record levels.

    Sources: Investing

  • OCBC has raised its 2026 gold price forecast to $5,600 per ounce, citing increasing demand for safe-haven assets.

    OCBC has raised its end-2026 gold price target to $5,600 per ounce from $4,800, citing recent sharp gains and enduring structural demand rather than a shift in its core market view. Gold has climbed about 17% so far in 2026 and has stayed elevated despite periodic pullbacks.

    The bank said prices are now supported less by isolated event risks and more by a prolonged environment of uncertainty that is driving diversification into non-sovereign assets. OCBC highlighted a persistent pricing premium that cannot be fully accounted for by traditional factors such as yields, the US dollar, ETF flows, volatility, or policy uncertainty. This premium reflects a geopolitical and uncertainty component increasingly embedded in gold prices, fueled by ongoing geopolitical tensions, policy unpredictability, and concerns over confidence in the dollar. OCBC added that the broader uptrend remains intact, underpinned by structural geopolitical risks, accommodative monetary conditions, and continued support from official sector and ETF demand.

    Sources: Investing

  • Gold shrugs off all pullback signals — a sign the next leg higher may be building

    Gold has climbed beyond $5,100, underpinned by a softer US dollar and strong, persistent structural demand. Solid technical momentum and ongoing global policy uncertainty continue to favor hard assets such as gold and silver. While the focus on potential FX intervention raises the risk of near-term profit-taking, the broader rally still shows little sign of losing steam.

    Gold surged to a fresh record of $5,100 an ounce, while silver extended its rally with another 5% jump to around $110. The latest advance has been fueled by persistent US dollar weakness, signs of yen intervention, and broader unease over fiat currencies—long a structural pillar of gold’s appeal. Ongoing global policy uncertainty is also channeling capital into hard assets.

    With such an extensive list of supportive factors, even the most bullish investors may question how long the rally can continue without at least a pause, especially given how stretched valuations have become. The temptation for profit-taking at these levels is clear. Yet prices continue to refuse to roll over, and that resilience is becoming the key narrative. Despite a fading geopolitical risk premium and last week’s tariff U-turn by Trump—which, in theory, should have dampened safe-haven demand—gold barely reacted and instead pushed even higher, underscoring the strength of the current trend.

    US dollar remains under pressure amid easing rate expectations and declining investor confidence.

    At first glance, the explanation seems simple: the US dollar has weakened, giving gold a natural boost. A softer greenback makes gold more affordable for non-US buyers, and that effect is clearly visible. However, this move goes beyond a straightforward FX translation. Gold prices have also been rising in euro and sterling terms, pointing to broader, more structural demand rather than just currency-driven gains.

    That said, dollar weakness is still playing an important role. The greenback has slid amid recent geopolitical fractures, and suspected Japanese intervention in USD/JPY has added further pressure. Markets are increasingly convinced that Japanese authorities stepped in when USD/JPY pushed beyond 159. What really caught investors’ attention were reports that the Federal Reserve was “rate-checking” banks in New York around the London close. The idea that this may have been more than unilateral action by Tokyo—potentially involving coordination with Washington—is significant, as joint Japan–US intervention would send a far stronger signal than Japan acting alone.

    Bullish momentum remains firmly intact, with strong follow-through buying and little sign of exhaustion despite overextended conditions.

    Momentum is clearly carrying much of the move. The uptrend remains firmly intact, with trend-following behavior dominating as traders continue to buy dips rather than sell into strength. As long as that pattern persists, it is difficult to make a convincing case against further near-term gains.

    From a psychological standpoint, the $5,000 threshold has now been decisively cleared. It may have seemed ambitious only a few sessions ago—much like $4,000 did not long before—but strong technical momentum, a weakening US dollar narrative, and rising anxiety in global bond markets have made these once-distant milestones appear increasingly attainable.

    That said, macro fundamentals still deserve attention. Real yields, growth expectations, and inflation dynamics have not vanished, and eventually they will reassert influence. When they do, gold may find it harder to sustain these elevated levels without a renewed or deeper systemic risk backdrop.

    Key Levels to Monitor

    For now, the bias remains to the upside. The next resistance target is near $5,182, corresponding to the 261.8% Fibonacci extension of the major October downswing, with the $5,200 psychological level just above. On the downside, multiple support zones are in focus, starting with $5,000. Other round-number levels such as $4,900 and $4,800 may also provide support, while more significant longer-term support is seen around $4,500–$4,550.

    As long as the dollar stays weak, central banks continue to be net buyers of gold, and governments openly signal a willingness to intervene in FX markets, it is difficult to identify a catalyst that would meaningfully reverse gold’s advance at this stage, aside from bouts of profit-taking.

    Sources: Fawad Razaqzada

  • Oil prices slip as markets weigh US-Iran tensions and winter-related supply disruptions.

    Oil prices edged lower in Asian trading on Tuesday as markets focused on rising US-Iran tensions, while also monitoring potential supply disruptions caused by extreme winter weather in the United States.

    Crude had gained in recent sessions on fears that tensions with Iran could disrupt supply, while a severe snowstorm in the US was estimated to have shut in up to 2 million barrels of oil production over the weekend.

    However, expectations of tighter supply were tempered after Kazakhstan signaled it would resume production at the Tengiz oil field, its largest producing asset.

    Brent crude futures for March slipped 0.6% to $65.22 a barrel, while West Texas Intermediate futures fell 0.5% to $60.33 a barrel by 21:20 ET (02:20 GMT).

    Iran tensions, US weather disruptions in focus

    A US aircraft carrier and several destroyers were seen arriving in the Middle East over the weekend. President Donald Trump said last week that an “armada” was headed toward Iran, though he expressed hope it would not be used.

    The deployment followed Trump’s warnings to Iran over the killing of protesters during recent nationwide demonstrations, although unrest has eased in recent weeks and his rhetoric toward Tehran has softened.

    Meanwhile, a severe snowstorm in the US caused widespread disruptions, halting oil production and straining the power grid, with markets closely watching whether prolonged outages could further tighten crude supplies.

    Kazakhstan signals plans to resume production at the Tengiz oil field.

    Kazakhstan said on Monday it will resume output at the Tengiz oil field after a fire and power outage halted production. However, Reuters reported that initial volumes are expected to be limited, as the country has yet to lift a force majeure on CPC Blend exports.

    Kazakhstan is the world’s 12th-largest oil producer and a member of OPEC and its allies. The group is expected to keep production levels unchanged at its February 1 meeting, after steadily increasing output through 2025 before announcing a pause late last year to curb prolonged weakness in oil prices.

    Sources: CNBC

  • Rate-Cut Expectations Waver as Conflicting Macro Signals Emerge

    Wednesday brings the FOMC meeting and Chair Powell’s press conference, and it wouldn’t be surprising if President Trump chose that moment—ideally around 2:30 p.m. ET—to announce his pick for the next Fed chair. Such timing would dominate headlines, catch financial media off guard, and inject maximum uncertainty into markets.

    That said, the Fed is not expected to cut rates at this meeting, which should keep the event relatively uneventful. In the bigger picture, what the Fed does between now and May may prove less important, particularly if a new chair is appointed and moves quickly toward easing.

    Markets appear to be dialing back expectations for aggressive rate cuts. Current pricing suggests the fed funds rate settles near 3.25% by December, with little additional easing beyond that. To meaningfully shift those expectations, the nominee would likely need to be notably dovish—something markets already anticipate, given the widespread assumption that Trump will select a policy-leaning accommodator.

    As a result, the risk of a breakout in the 2-year Treasury yield appears increasingly credible, with initial resistance near 3.62%. Beyond that, a move back toward the 4% level cannot be ruled out. From a technical perspective, the setup supports this view: the 2-year yield has formed multiple bottoms in recent months, and the RSI has begun to turn higher, signaling building upside momentum.

    The direction of the 2-year yield may ultimately be more closely linked to oil prices. With inflation still hovering near 3% and crude having fallen to around $60 from highs in the $120s, the message is clear: a rebound in oil prices could quickly reignite inflation pressures. That dynamic likely explains why the price action in oil and the 2-year yield charts has begun to look strikingly similar.

    The Bank of Japan once again chose to kick the can down the road, leaving rates unchanged and, in my view, offering little in the way of a clear policy roadmap. The yen’s strength on Friday appeared to be driven solely by reports of a possible “rate check” by the New York Fed on behalf of the U.S. Treasury—widely interpreted as a warning signal that currency intervention could be imminent. Perhaps the strategy is to keep markets stable until after the snap election in February. It’s hard to say, but it should be telling to see how markets react once Japan reopens on Monday.

    The Korean won also strengthened notably against the U.S. dollar on Friday. In recent weeks, there has been growing chatter that the KRW had become excessively weak, so it’s likely the currency took the developments around the yen as a warning signal and moved to reprice accordingly.

    The Korean won likely matters more than many investors realize, given the sizable exposure South Korean investors have built up in U.S. equities. That dynamic is probably one of the reasons the KRW has weakened so significantly in the first place—buying U.S. stocks requires selling won for dollars.

    If the KRW begins to strengthen from here, it could start to put pressure on that trade. For investors who are unhedged on the currency side, a stronger won increases the risk of FX-related losses on their U.S. equity holdings, potentially prompting position adjustments.

    Of course, this week also brings major earnings reports from Microsoft, Apple, Tesla, and Meta. From what I can see, all four stocks are currently sitting in positive gamma with positive delta positioning. Implied volatility typically builds into earnings because of the event risk, which sets up a familiar dynamic: unless a company delivers truly blowout results, the reaction can easily turn into a sell-the-news move. Once earnings are released, implied volatility collapses and hedges are unwound as delta decays, potentially putting pressure on the shares.

    Sources: Michael Kramer

  • Gold’s Rally Increasingly Hinges on China as U.S. Buying Loses Momentum

    Gold’s record-setting bull market has resumed its charge—but under a new set of drivers. Aggressive buying from China has increasingly taken over from gold’s traditional engines of demand, namely U.S.-based gold ETFs and futures traders. With American participation fading, gold’s ability to hold lofty levels now rests heavily on sustained Chinese demand. This shift has helped gold remain elevated, postponing the corrective phase typically required to rebalance overheated markets.

    Between late July and mid-October 2025, gold surged an extraordinary 32.9% in just 2.7 months. During that stretch, the metal logged 24 record closes—roughly three-sevenths of all trading days—while its strongest gains were spread relatively evenly across the calendar. At the time, U.S. investors were aggressively piling into gold, providing powerful upside momentum.

    That enthusiasm was clearly reflected in holdings of the world’s largest gold ETFs—SPDR Gold Shares (GLD), iShares Gold Trust (IAU), and SPDR Gold MiniShares (GLDM). According to the World Gold Council’s Q3’25 data, these three vehicles together accounted for more than three-sevenths of all gold held by global ETFs. During the rally, their combined bullion holdings jumped 10.9%, or 169.4 metric tons, helping propel gold to around $4,350 by mid-October and pushing technical conditions to extreme levels.

    At its peak, gold was trading 33% above its 200-day moving average—ranking among the most overbought readings since 1981. The bull market had delivered gains of 139.1% over 24.5 months without a single correction exceeding 10%, making it the largest cyclical gold bull ever in U.S. dollar terms since the gold standard was abandoned in 1971. Historically, such excesses have almost always been followed by sharp pullbacks.

    A correction initially appeared to be unfolding, with gold dropping 9.5% into early November—its steepest decline of the cycle and close to formal correction territory. Then the pattern abruptly changed.

    Since mid-October, gold has climbed another 10.9% over roughly three months, yet this time without meaningful participation from U.S. investors. ETF holdings at GLD, IAU, and GLDM rose just 2.2% (37.8 tons), less than one-quarter of the prior buildup—and all of that increase occurred only in the past month. Those holdings didn’t even recover their mid-October peak until mid-December, shortly before gold began printing fresh record highs.

    Gold’s ability to avoid a deeper correction despite some of the most extreme overbought conditions in decades raised questions. Normally, such excesses demand a reset in sentiment and positioning. Since U.S. investors were not driving the rebound, another source of demand had to be absorbing supply.

    Clues emerged in the timing of gold’s strongest advances. Since mid-October, nearly all of gold’s gains have occurred on Mondays—a striking anomaly given that Mondays have historically been gold’s weakest trading day. Major upside moves were logged on November 10, November 24, December 22, January 5, January 12, and again this week following a Monday market holiday. Collectively, these few sessions accounted for the vast majority of gold’s rally since October.

    Closer inspection revealed that most of these gains occurred overnight during Asian trading hours—well before European or U.S. markets opened. In other words, Chinese traders were responsible for driving price action when the rest of the world was largely inactive. These sessions effectively became “China Mondays,” periods when Chinese market flows dominated global pricing due to minimal competing liquidity.

    Because China is uniquely active during the late Sunday-to-early Monday window, its influence on gold prices during that time is disproportionate. On other weekdays, extended trading hours in Western markets dilute that impact. The clustering of gains during these windows strongly suggests that China has become the primary marginal buyer supporting gold at record levels.

    Until U.S. investors re-engage meaningfully, gold’s resilience at these heights will depend largely on whether Chinese demand remains strong enough to keep the rally alive.

    China’s influence on Sunday-night trading is further magnified by the weekend effect. Weekends represent the longest stretch when traders are unable to react to new, market-moving developments. As a result, many participants square positions and shut down algorithmic trading systems ahead of the weekend. Meanwhile, algorithms that remain active into early Monday often have a backlog of news to process, which can intensify price moves during thin overnight liquidity. This dynamic can significantly amplify China-driven buying in gold.

    Before delving further into China’s growing dominance in the gold market, it’s useful to look at how dramatically conditions shifted around gold’s mid-October peak. In the months leading up to that high, heavy share buying in GLD, IAU, and GLDM was the primary force behind gold’s explosive rally. Since then, demand from U.S. equity investors has been largely muted. Even so, gold has managed to surge back into extreme overbought territory—an outcome that underscores how unusual and China-dependent this phase of the rally has become.

    China’s dominance during Sunday-night trading is reinforced by the structure of weekends themselves. Weekends are the longest periods when traders cannot respond to new, market-moving information. As a result, many participants flatten positions and shut down algorithmic systems before markets reopen. Meanwhile, algorithms that remain active into early Monday often need to process a backlog of news, which can magnify price movements in thin overnight liquidity. This dynamic amplifies China-driven gold buying when global participation is minimal.

    Before exploring China’s growing grip on gold prices further, it helps to contrast the months before and after gold’s mid-October peak. In the run-up to that high, aggressive share buying in GLD, IAU, and GLDM was the dominant force behind gold’s explosive advance. Since then, U.S. stock investor demand has been largely muted—yet gold has still surged back into extreme overbought territory, underscoring how unusual and externally driven this rally has become.

    While American equity investors were slow to chase this China-led surge until recently, U.S. gold-futures speculators jumped in aggressively. Futures positioning is reported weekly, and in late November—just after gold’s second “China Monday” surge—total speculative long positions stood at 307,000 contracts. Over the following seven weeks, that figure ballooned. By the January 13 Commitments of Traders report, total spec longs had risen to 362,400 contracts—an increase equivalent to roughly 172 metric tons of gold. That dwarfed the roughly 52-ton increase in GLD, IAU, and GLDM holdings over the same period, meaning futures traders significantly amplified China-driven momentum.

    However, futures-driven buying power is limited and quickly exhausted. Gold futures allow extreme leverage—often 20x to 25x—which dramatically restricts the pool of participants willing to assume such risk. Assessing speculative positioning within its historical range provides insight into whether traders are more likely to add exposure or begin selling.

    As of mid-January, speculative long positions were already 58% into their bull-market range, while shorts were just 6% in. The most bullish setup occurs when longs are near the bottom of their range and shorts are near the top, leaving ample room for buying. The current configuration is far closer to the opposite—suggesting diminishing upside fuel from U.S. speculators.

    That leaves gold’s ability to continue defying a necessary corrective phase largely dependent on China. Unfortunately, reliable, consistent data on Chinese gold markets is scarce, especially in English. Even if such data were available, it would require extensive historical analysis to establish meaningful relationships with price behavior.

    Still, anecdotal evidence is abundant. Major financial publications regularly report frenzied gold buying in China. Silver’s recent parabolic surge—largely driven by Chinese demand—appears to have spilled over into gold, fueling enthusiasm both domestically and globally. Without transparent data, Western analysts are left guessing how long this demand can persist.

    Cultural factors may offer some clues. In Western markets, gold had long been dismissed as outdated, resulting in minimal portfolio allocations for years. In contrast, gold has always held deep cultural significance in China. Chinese investors therefore began this cycle with far greater enthusiasm, potentially making them more willing to buy aggressively and stay invested longer.

    Capital controls also play a role. Chinese investors have limited avenues to diversify wealth outside the domestic financial system, while gold and silver offer a rare escape from policy risk. Additionally, Chinese culture places a stronger emphasis on wealth accumulation and status—traits that can fuel speculative behavior.

    These dynamics make China uniquely susceptible to a speculative gold mania. Evidence increasingly suggests one is underway, reinforced by the repeated “China Monday” surges. Yet Chinese markets remain opaque. Financial transparency is limited, economic data series have been quietly discontinued when trends turn unfavorable, and even official gold reserve figures from the People’s Bank of China are widely viewed with skepticism.

    For example, China reported identical gold reserves for more than six years before suddenly announcing a 57% jump in a single month—an implausible scenario. Many analysts believe China has accumulated far more gold than officially disclosed for years. If official reserve data lacks credibility, confidence in broader market transparency is equally questionable.

    That uncertainty is unsettling. History shows that speculative manias eventually end in sharp, symmetrical collapses once buying power is exhausted. Whether China’s gold frenzy lasts months—or reverses abruptly—is unknowable.

    What is clear is that gold’s recent breakout has been almost entirely driven during Chinese trading hours. Since December 19, gold has climbed roughly $487, yet nearly all of those gains occurred on just four “China Mondays.” This concentration of upside is highly abnormal and inherently risky.

    Chinese markets have repeatedly demonstrated how quickly sentiment can flip once fear takes hold. Any government action—such as curbing speculative activity—could trigger rapid selling. Without strong participation from U.S. investors or futures traders to absorb that supply, gold could fall sharply.

    In short, Chinese trading has seized control of the gold market. After peaking at extreme overbought levels in mid-October, gold required a corrective reset. That process was prematurely halted by surging Chinese demand. With U.S. participation limited and futures buying power fading, gold’s current position is precarious. If Chinese enthusiasm wanes or policy shifts intervene, a forced and potentially violent rebalancing could follow.

    Sources: Adam Hamilton

  • Gold climbs to a fresh record above $5,000 an ounce as investors seek safe havens

    Gold vaulted above the psychological $5,000-per-ounce threshold on Monday, building on last week’s explosive rally as investors flocked to the traditional safe haven amid escalating geopolitical risks.

    Spot gold climbed 1.1% to a fresh all-time high of $5,035.83 per ounce by 18:52 ET (00:52 GMT), while U.S. gold futures also advanced 1.1% to a record $5,074.71 per ounce.

    The precious metal surged more than 8% last week, repeatedly setting new highs, and is now up nearly 17% year-to-date.

    The broader precious metals complex also strengthened. Silver jumped over 2% to a record $106.56 per ounce, while platinum edged higher to a new peak of $2,798.46 per ounce.

    Gold has climbed sharply since the beginning of the year, supported by geopolitical tensions, expectations of looser U.S. monetary policy later in 2026, and continued buying from central banks and investors hedging against market volatility.

    Geopolitical tensions, Trump tariff threats lift gold

    A key catalyst behind gold’s sharp rally this month has been mounting friction between the United States and its NATO partners over Greenland, a dispute that has rattled global markets.

    President Trump’s comments on U.S. strategic ambitions in the Arctic have further strained transatlantic ties, fueling fears of wider diplomatic and economic repercussions.

    Adding to those geopolitical pressures, Trump escalated trade tensions with Canada over the weekend, warning of a 100% tariff on Canadian imports should Ottawa move forward with a trade agreement with China.

    Trump said on his social media platform that Canada could serve as a “drop-off port” for Chinese goods entering the United States, warning that Beijing would “eat Canada alive” if the agreement proceeds.

    Fed rate decision in focus

    Gold has also found support from expectations around U.S. monetary policy. The Federal Reserve is set to wrap up its policy meeting on Wednesday, with markets broadly expecting officials to leave interest rates unchanged.

    Although a hold decision is largely priced in, investors will closely examine the Fed’s statement and remarks from Chair Jerome Powell for signals on the timing and pace of potential rate cuts later this year.

    Gold typically benefits from lower interest rates, which reduce the opportunity cost of holding non-yielding assets.

    “Both the data and Chair Powell’s strong defence of central bank independence suggest there is little chance of a Fed rate cut on January 28,” ING analysts said in a note.

    “Attention will instead turn to President Trump’s forthcoming nomination for the next Fed chair, upcoming economic data, and whether that nominee can steer the committee toward additional rate cuts,” they added.

    Sources: Reuters

  • Gold gains momentum, nearing the $5,000 mark

    Gold prices remain firmly in an uptrend and are poised to test the key $5,000 per troy ounce level on Friday. The precious metal’s strong rally accelerates amid mounting US Dollar weakness and mixed US Treasury yields across the curve.

    Fundamental Analysis Overview

    Expectations of additional monetary easing by the US Federal Reserve (Fed) continue to support demand for the non-yielding yellow metal, even as geopolitical risks have eased following US President Donald Trump’s reversal on Greenland. The bullish momentum also appears largely undeterred by extremely overbought short-term technical conditions, reinforcing the view that Gold’s path of least resistance remains upward.

    On Wednesday, Trump announced the cancellation of planned tariffs on European allies related to US control over Greenland, after reaching a preliminary framework with NATO leaders on future Arctic security cooperation. He also dismissed the possibility of taking Greenland by force, encouraging risk appetite. However, the positive market response proved short-lived, as dovish Fed expectations dominated, outweighing Thursday’s US economic data and pushing the US Dollar (USD) back toward its lowest level since January 6, last seen earlier this week.

    Data from the US Bureau of Economic Analysis showed that final third-quarter GDP growth came in at 4.4%, marginally above the previous estimate of 4.3% and notably stronger than the 3.8% expansion recorded in the prior quarter. Meanwhile, the Core Personal Consumption Expenditures (PCE) Price Index — the Fed’s preferred inflation measure — rose 2.8% year-on-year in November, up from 2.7%, while the monthly increase remained steady at 0.2%.

    Further weighing on the USD, the US Department of Labor reported that initial jobless claims edged up by 1,000 to 200,000 for the week ending January 17, below market expectations of 212,000. Despite the better-than-expected figure, the data failed to offer meaningful support to the greenback amid the broader de-dollarization trend. Investors now turn their attention to upcoming flash PMI releases for insight into global economic conditions, which could influence risk sentiment and shape Gold’s trajectory as it heads toward solid weekly gains.

    XAU/USD Technical Analysis

    The broader uptrend remains supported by an ascending channel originating from $3,805.69, with XAU/USD now having decisively broken above the channel’s upper boundary around $4,742.80. The Moving Average Convergence Divergence (MACD) remains firmly above the zero line and continues to trend higher, indicating strengthening bullish momentum. Meanwhile, the Relative Strength Index (RSI) stands at 81.25, deep in overbought territory, which may limit immediate upside as momentum becomes stretched.

    That said, a sustained hold above the former channel ceiling opens the door for a continuation of the rally toward new highs. On the downside, initial support is seen near the ascending channel’s lower boundary at $4,437.79 should prices consolidate. A flattening MACD would point to fading upside momentum at elevated levels, while a pullback in RSI toward the 70 mark would help ease overbought conditions and reinforce trend stability. A failure to defend the breakout zone could trigger a move back into the previous range, whereas continued momentum would keep bullish control intact.

    Sources: Fxstreet

  • Gold prices surge to record highs amid Trump–Iran tensions; $5,000 per ounce within reach

    Gold prices climbed to an all-time high during Asian trading on Friday, edging closer to the widely monitored $5,000-per-ounce mark after U.S. President Donald Trump said American ships had been deployed toward Iran, boosting demand for safe-haven assets.

    Silver and platinum also reached record levels on Friday. Although precious metals eased slightly after Trump announced a trade agreement involving Greenland, continued uncertainty over the deal and heightened tensions with Iran sustained investor demand for safe havens.

    Spot gold climbed as much as 0.7% to a new record of $4,967.48 an ounce, while February gold futures advanced more than 1% to $4,969.69 per ounce.

    Spot silver surged almost 3% to an all-time high of $99.0275, and spot platinum gained nearly 1% to reach a record peak of $2,692.31 per ounce.

    Trump says a large U.S. naval “armada” is being sent toward Iran as tensions escalate

    Speaking to reporters aboard Air Force One on Thursday night, Trump said the United States had dispatched a naval fleet toward Iran, warning Tehran against harming protesters or resuming its nuclear program.

    “We have an armada moving in that direction, and hopefully it won’t need to be used,” Trump said, adding that he would prefer to avoid any escalation. According to reports, a U.S. aircraft carrier along with several destroyers is expected to arrive in the Middle East in the coming days.

    Earlier in January, Trump had warned Tehran against the killing of protesters as Iran faced nationwide demonstrations against the Nezam.

    However, although he later softened his tone toward Iran, Trump’s remarks on Thursday reignited concerns about the possibility of U.S. military intervention in the Middle East.

    Gold and metals post strong start to 2026

    Metal markets surged through January as escalating geopolitical risks drove investors toward physical safe-haven assets. A U.S. military move into Venezuela early in the year, along with Trump’s threats related to Greenland, boosted demand for low-risk investments.

    So far in 2026, spot gold has risen nearly 15%, while silver has jumped close to 39% and platinum has gained about 21%.

    A weaker U.S. dollar has also supported metal prices, as mixed economic signals fueled expectations that the Federal Reserve will cut interest rates later this year. The Fed is set to meet next week and is widely expected to keep rates unchanged for now.

    Trump’s criticism of the Fed further lifted safe-haven demand, alongside growing concerns about worsening fiscal conditions in developed economies, particularly Japan. Sharp sell-offs in Japanese and U.S. government bonds in recent weeks have prompted investors to rotate into gold.

    Sources: Investing

  • Gold eases from record levels near $4,900 an ounce after Trump signals Greenland deal

    Gold prices edged lower in Asian trading on Thursday after touching a record high near $4,900 an ounce in the prior session, as U.S. President Donald Trump’s retreat from tariff threats linked to Greenland tensions dampened safe-haven demand. Spot gold declined 0.7% to $4,799.55 an ounce by 20:36 ET (01:36 GMT), after hitting a record peak of $4,888.1 an ounce a session earlier. March U.S. gold futures also slipped 0.8% to $4,801.75 an ounce.

    Gold jumped on Wednesday as geopolitical tensions intensified following a transatlantic dispute over Greenland and threats of tariffs on European imports. The rally earlier this week lifted bullion close to the psychological $5,000 level, with investors seeking a safe haven amid heightened global uncertainty.

    Prices later pulled back after President Trump, speaking at the World Economic Forum in Davos, said he would refrain from imposing the tariffs and ruled out the use of force in the dispute over the Danish territory. He added that a “framework” agreement was taking shape to ease tensions with NATO allies.

    “It’s a long-term deal — the ultimate long-term deal — and it puts everyone in a very strong position, particularly when it comes to security and minerals,” Trump told reporters. Gold also faced mild pressure from a modest rebound in the U.S. dollar, with the Dollar Index trading slightly higher after rising 0.1% in the previous session.

    Sources: Bloomberg

  • Oil prices hold steady as Greenland tariff concerns ease; US crude inventories in focus

    Oil prices were largely flat in Asian trade on Thursday as U.S. President Donald Trump eased tariff threats related to Greenland. Market participants also weighed an increase in U.S. crude inventories alongside recent supply disruptions. At 22:07 ET (03:07 GMT), March Brent futures inched up 0.1% to $65.31 a barrel, while WTI crude rose 0.2% to $60.74. Both benchmarks have posted modest gains over the past two sessions, underpinned by supply concerns after OPEC+ member Kazakhstan suspended production at the Tengiz and Korolev oilfields on Sunday.

    Trump retreats from tariff threats against Greenland

    Market sentiment improved after President Trump unexpectedly softened his position on Greenland on Wednesday, stepping back from threats to impose tariffs on European countries as leverage to annex the Danish territory. He ruled out the use of force and indicated that a framework for a potential deal was emerging, easing concerns over a sharp escalation in U.S.–EU tensions that could have pressured global growth and energy demand. The de-escalation supported broader risk appetite, although oil markets remained cautious amid mixed supply and demand signals.

    U.S. crude inventories increase again, API data shows

    The American Petroleum Institute (API) reported that U.S. crude stockpiles increased by 3.04 million barrels in the week ending Jan. 16, following a build of more than 5 million barrels the previous week. Gasoline inventories surged by 6.21 million barrels, signaling weaker demand, while distillate stocks—including diesel and heating oil—slipped by 33,000 barrels.

    On the demand front, oil prices drew some support after the International Energy Agency raised its forecast for global oil demand growth in 2026 on Wednesday. Despite the upward revision, the IEA continues to expect the oil market to remain in a substantial surplus through 2026.

    Sources: Investing

  • Gold: How Rising War Risks and Debt Strains Could Drive Prices Toward $20,000

    The modern state increasingly rests on three foundations: debt, fiat currency, and coercive power. Concepts such as “national security” and “critical minerals” have become the latest government talking points, widely promoted and readily accepted by the public. Meanwhile, personal preparedness—once a priority during health crises—has faded from focus, even as harmful consumer habits and ultra-processed foods continue to be normalized and aggressively marketed.

    Political leaders often project strength through military posturing and geopolitical confrontation while avoiding personal sacrifice, financing these actions primarily through expanding debt and currency creation. In several regions, power structures are maintained through force, information control, and repression rather than genuine legitimacy or accountability.

    Across parts of the world, regimes with deeply troubling records are frequently rebranded as sources of “stability” when it suits geopolitical or economic interests, particularly in energy and resource markets. This pattern underscores a broader contradiction: governments race to announce ambitious initiatives and sweeping strategies, yet largely ignore the importance of real savings and sound money.

    Against this backdrop, a growing share of the global population—particularly in Asia, along with a minority of investors in the West—has turned toward long-term wealth preservation through tangible assets such as gold and silver. For those already positioned this way, the erratic behavior and short-term thinking of governments is more a source of frustration than fear.

    Gold is the currency of independent citizens. While the U.S. dollar is technically due for its fifth cyclical rebound against gold in the past 50 years, that does not mean it must happen immediately—and when it does…. Gold-focused savers should stay prepared to add to their gold holdings—and silver as well.

    On the weekly chart, gold appears technically overbought, yet its price behavior is beginning to resemble the equity market’s powerful advance in the mid-1990s. Momentum indicators such as RSI and Stochastics are finding support near the 50 level before pushing above 70 and remaining elevated for extended periods—an indication of strong, persistent trends rather than imminent reversals.

    Against a backdrop of rising debt, expanding fiat issuance, and escalating geopolitical risks, prominent gold investors such as Pierre Lassonde have projected that gold prices could approach the $20,000 level in the years ahead.

    From a portfolio-management perspective, selectively taking profits—up to roughly 30% in many cases—can be prudent, not as a call on a fiat-denominated price peak, but as a way to build liquidity. That capital can then be redeployed during the next meaningful pullback, which is likely to occur at price levels well above today’s.

    Psychologically, sharp corrections can be challenging, particularly for investors without available cash. Maintaining some dry powder through partial profit-taking enables investors to add to gold, silver, and mining positions when opportunities arise—this is the primary rationale for trimming exposure now.

    Fundamentally, the case for gold remains exceptionally strong. Recent statements suggesting potential military actions involving NATO allies underscore the degree of geopolitical uncertainty. Even without direct conflict, such rhetoric alone could propel gold significantly higher against fiat currencies. In the event of an actual escalation, price moves of $2,000 per ounce—or more—could unfold rapidly.

    The Shiller (CAPE) ratio—an inflation-adjusted price-to-earnings measure for the S&P 500—highlights the extreme valuation levels currently embedded in U.S equities.

    If U.S. policymakers continue to pressure European allies through aggressive tariff measures while openly discussing military options, the resulting backlash could be severe. At some point, a tipping point may be reached, prompting European governments and institutions to rapidly reduce exposure to U.S. government bonds and U.S. equities.

    Such a scenario would carry profound risks. Asset freezes or retaliatory measures could follow, severely disrupting global financial markets. Under those conditions, gold could experience explosive upside moves, potentially rising by thousands of fiat-denominated dollars in very short order. At the same time, forced selling from Europe could trigger a rapid collapse in U.S. equity markets, with a speed and scale rivaling—or even exceeding—historic market crashes.

    The broader takeaway is that gold increasingly functions as a form of sovereign money for billions of individuals, particularly across Asia, who already view it as a long-term store of value. As pressures build on systems dominated by fiat currency, debt expansion, and coercive policy tools, the resilience of those systems may be tested. Should confidence fracture, the adjustment—especially in the U.S.—could be both abrupt and far-reaching.

    Turning to the 10-year Treasury yield chart, the recent upside breakout carries profound implications for both the U.S. government and gold. For years, the notion of unlimited quantitative easing was promoted as a sustainable solution, but that framework was always unrealistic. Instead, it appears to be giving way to a regime of persistently higher interest rates—and, in parallel, steadily rising fiat-denominated gold prices.

    This shift reflects a deeper issue: confidence in governments and their currencies is eroding. As debt burdens expand and monetary credibility weakens, markets are beginning to price in a structural change rather than a temporary cycle. In that environment, higher yields and higher gold prices are not contradictions but complementary signals of systemic stress.

    The loss of trust in fiat-based systems is no longer a distant risk; it is an active force shaping global markets—and one that is likely to persist.

    While a new Federal Reserve chair has yet to be appointed, the leading candidate, Kevin, is known to favor aggressive quantitative tightening and has openly described equity markets as severely overvalued. To restore credibility in the U.S. government, its bond market, and the dollar, a substantial and sustained QT program would likely be required.

    What I continue to regard as one of the most significant base formations in market history is the inverse head-and-shoulders pattern on the CDNX. I have long argued that a breakout from this structure would likely coincide with a major move higher in long-term interest rates, and recent developments suggest that this scenario is unfolding decisively.

    My long-term objective for the CDNX stands at 10,000, and well before that level is reached, many junior resource stocks could deliver outsized returns—potentially achieving multi-hundred- or even thousand-fold gains.

    Another chart I encourage investors to monitor closely is the GDX-to-gold ratio. Of particular note is the 14,3,3 Stochastics oscillator at the bottom of the chart. As the upside breakout gains traction and the rally develops, this momentum indicator could remain in overbought territory not merely for months or years, but potentially for an extended secular period.

    The broader takeaway is clear: Markets appear to be entering a new phase—one defined by a sustained gold bull cycle. In this environment, informed and disciplined investors stand to benefit the most, as capital increasingly shifts toward real assets and away from fiat-based complacency.

    Sources: Stewart Thomson

  • Silver futures enter VC PMI expansion phase, eyeing $95.40–$101.25 in January cycle

    Silver remains in a high-momentum price-discovery phase, holding above the Daily VCPMI mean in the upper $89–$90 area, signaling sustained bullish momentum across both short- and intermediate-term timeframes.

    The current structure points to strong participation on corrective pullbacks, increasing the likelihood that dips remain brief as buyers continue to defend the Daily Buy 1 and Weekly VCPMI support zones between $85 and $87.

    From a time-cycle standpoint, the dominant 30-, 60-, and 90-day harmonic cycles remain in alignment with the broader expansion phase that began in early Q4. The market is now entering a near-term inflection window projected for January 18–20, a period that historically aligns with volatility compression and subsequent directional resolution. Should price sustain closes above the Daily Sell 1 level, the probability outlook shifts toward trend continuation, with upside targets extending to the Weekly Sell 1 and Weekly Sell 2 zones.

    Square of 9 price geometry identifies $93.75, $94.80, and $95.40 as key harmonic resistance levels—rotational nodes where trend acceleration or rejection is most likely to occur. A sustained acceptance above this zone would open the technical pathway toward the $98–$101 range, aligning with the upper Weekly Sell 2 projection and longer-term cycle expansion targets.

    Conversely, failure to rotate higher through this resistance band would favor a mean-reversion move back toward the Daily VCPMI mean and the Weekly Buy 1 support zone near $81–$83.

    From a structural perspective, silver’s resilience amid elevated volatility and margin pressure continues to validate a supported trend environment, with accumulation behavior dominating corrective phases. Rising open interest and consistent closes above the Weekly VCPMI further support the view that the broader market remains positioned for higher price discovery rather than distribution.

    Looking ahead, the secondary momentum window from January 27–30 marks the next key timing convergence, where the interplay between Square of 9 resistance and cyclical factors could drive either a decisive breakout or a rotational pullback.

    Traders applying the VC PMI framework should maintain discipline, executing systematically at predefined probability levels while separating emotional bias from structured risk and money management.

    Sources: Patrick MontesDeOca

  • WTI falls under $59.50 amid easing Iran tensions and rising US – EU trade war fears

    • WTI crude prices edged lower to around $59.25 in early European trading on Tuesday.
    • Tensions surrounding Iran have eased in recent days following earlier speculation about a potential U.S. attack.
    • Market attention is now turning to developments around Greenland after President Trump threatened to escalate tariffs on eight European countries.

    West Texas Intermediate (WTI), the U.S. crude oil benchmark, was trading near $59.25 during early European hours on Tuesday. Prices edged lower as concerns over supply disruptions from Iran eased, while traders continued to assess the implications of the U.S. push to take control of Greenland.

    There were no signs of escalating tensions in Iran over the weekend, although Supreme Leader Ayatollah Ali Khamenei said that 5,000 people were killed in anti-government protests this month, according to Reuters. The easing of tensions has reduced the risk of a potential U.S. attack that could disrupt supplies from a major OPEC producer, weighing on WTI prices.

    Traders are turning their focus to the Greenland crisis after U.S. President Donald Trump said on Saturday that Washington would impose an additional 10% import tariff from February 1 on goods from Denmark, Norway, Sweden, France, Germany, the Netherlands, Finland and the United Kingdom until the U.S. is permitted to purchase Greenland.

    Trump is expected to discuss Greenland at the World Economic Forum in Davos, Switzerland, on Wednesday, while European Union leaders are set to hold an emergency summit in Brussels on Thursday. Concerns that tensions could escalate into a broader U.S.–EU trade war have weighed on market sentiment and may add selling pressure to oil prices.

    “With fears around Iran easing in recent days following rumors of a U.S. attack, market attention has shifted to the Greenland issue and the potential depth of any fallout between the U.S. and Europe, as an expanded trade conflict could weigh on demand,” said Janiv Shah, an analyst at Rystad.

    Meanwhile, the American Petroleum Institute’s (API) crude inventory report is due later on Tuesday. A larger-than-expected draw could signal stronger demand and support WTI prices, while a bigger-than-forecast build would point to weaker demand or oversupply, potentially pressuring prices lower.

    Sources: Fxstreet

  • Gold breaks above $4,800 an ounce to hit a fresh record amid Greenland tensions

    Gold prices surged beyond $4,800 an ounce on Wednesday, hitting a fresh record as rising tensions surrounding Greenland and renewed trade disputes unsettled global markets, prompting investors to seek refuge in safe-haven assets.

    Spot gold advanced 1.7% to an all-time high of $4,844.39 an ounce by 21:13 ET (02:13 GMT), extending a powerful rally that has seen bullion notch multiple record highs this month.

    Meanwhile, U.S. gold futures rose 1.3% to $4,830.04 per ounce. Gold has gained more than 5% so far this week, including Wednesday’s advance, as geopolitical tensions continue to underpin safe-haven demand.

    The latest rally comes amid ongoing strain in U.S.–European relations over Greenland’s strategic significance. U.S. President Donald Trump has stated there is “no going back” on Greenland, citing Arctic security concerns, and has warned of potential tariffs on European nations—adding to market anxiety already heightened by global trade risks.

    In response, French President Emmanuel Macron said Europe would not yield to “bullies,” emphasising that mutual respect and cooperation—not pressure—should guide relations between allies. Speaking on the sidelines of the World Economic Forum in Davos, Macron’s comments highlighted growing European unease over Washington’s rhetoric and trade threats linked to the Greenland issue.

    Although Trump attempted to ease concerns by saying the U.S. was working toward a solution acceptable to NATO, investor caution has persisted.

    Demand for gold was further supported by a weaker U.S. dollar, which fell roughly 0.8% on Tuesday to its lowest level in two weeks. The U.S. Dollar Index remained under pressure during Asian trading on Wednesday, slipping a further 0.2%.

    A softer dollar typically boosts gold by making the metal more affordable for holders of other currencies, increasing demand for the non-yielding asset.

    Elsewhere in the precious metals complex, silver prices dipped slightly to around $93.9 per ounce after reaching a record high of $95.87 per ounce on Tuesday. Platinum also touched a fresh all-time high of $2,519.51 per ounce on Wednesday before giving back gains, last trading about 0.6% lower at $2,450.9 per ounce.

    Sources: Investing

  • Silver holds daily mean as bulls target $95 resistance

    Silver remains within a clearly defined VC PMI probability structure, consolidating around the Daily VC PMI mean near the $89.25 area. This zone represents the market’s equilibrium level, where directional momentum is established. A sustained close above the mean would trigger bullish momentum, statistically favoring a move toward the Daily Sell 1 level near $91.94, followed by the Daily Sell 2 region around $95.33.

    These upside targets also align with Square of 9 harmonic resistance levels, implying that any rally into these zones could be accompanied by heightened volatility and increased profit-taking.

    Time-cycle analysis points to a near-term inflection window between January 18 and 20, followed by a secondary momentum window from January 27 to 30. These periods align with current Square of 9 price geometry, where 45-degree and 90-degree harmonic rotations from the recent swing low intersect with the Daily and Weekly VC PMI bands.

    Historically, when these time and price relationships converge, markets tend to experience either an expansion in momentum or a corrective pause ahead of the next directional move.

    On the downside, corrective phases remain brief and shallow, underscoring a structurally supported trend. The Daily Buy 1 level near $85.86 and Daily Buy 2 around $83.17 mark high-probability accumulation areas, where the VC PMI model assigns a 90–95% likelihood of mean reversion back toward the daily equilibrium. These levels are further supported by the Weekly VC PMI mean near $87.40, which continues to function as dynamic support within the broader trend framework.

    From a higher-timeframe perspective, the Weekly Sell 1 level near $94.89 and Weekly Sell 2 around $101.25 represent the next key upside reference points should daily bullish momentum evolve into a sustained trend. A weekly close above both the daily and weekly means would confirm a structural shift, clearing the way toward these upper harmonic targets derived from Square of 9 geometry and Fibonacci extensions.

    Sources: Patrick MontesDeOca

  • Trump’s Greenland tariff threat, China growth slowdown move markets

    Futures tied to major U.S. stock indexes fell after President Donald Trump raised the prospect of imposing tariffs as part of his push to acquire Greenland. European leaders discussed possible retaliation against the measures, which they described as a form of blackmail. Gold climbed to a fresh record high, while oil prices edged lower as traders assessed Trump’s remarks and the EU’s response. Elsewhere, China’s economic growth slowed in the fourth quarter but still met Beijing’s 2025 target.

    U.S. futures and global stocks decline

    U.S. stock futures pointed lower on Monday as investors weighed President Donald Trump’s threat to impose tariffs on several European countries until the United States is allowed to acquire Greenland.

    By 03:05 ET (08:05 GMT), Dow futures were down 404 points, or 0.8%, S&P 500 futures had fallen 66 points, or 1.0%, and Nasdaq 100 futures were off 336 points, or 1.3%.

    With U.S. cash markets closed for the Martin Luther King Jr. Day holiday, the immediate reaction to Trump’s latest tariff threat will be delayed. Risk-off sentiment has spread globally, dragging equities lower across Europe and Asia.

    ING analysts said Trump’s comments, following last year’s sweeping global tariffs, have pushed trade tensions into “an entirely new dimension,” driven less by economic considerations and more by political motives. They added that while past experience suggests caution in reacting to dramatic announcements, some of Trump’s threats over the past year have ultimately been carried out.

    Focus on Trump’s Greenland tariffs

    European leaders agreed on Sunday to intensify efforts to counter President Donald Trump’s tariff threats, with reports suggesting EU officials are considering strong retaliatory measures if the levies are imposed.

    On Saturday, Trump said he would introduce 10% tariffs on exports from eight European countries—Denmark, Sweden, France, Germany, the Netherlands, Finland, Norway and the United Kingdom—until the United States is able to acquire Greenland. He added that the tariffs would be raised to 25% if the purchase of the semi-autonomous Danish territory does not go ahead. Trump has framed the move as a national security necessity, a claim European governments have rejected, describing it as blackmail.

    Ahead of an emergency EU summit in Brussels on Thursday, member states are expected to debate a range of responses, including a potential €93 billion tariff package on U.S. imports and the possible use of the bloc’s “Anti-Coercion Instrument,” which could restrict U.S. access to investment, banking and services markets. Reuters, citing an EU source, reported that the tariff package currently has broader backing.

    Trump’s latest tariff threat has also cast doubt over the future of a U.S.–EU trade agreement reached last year, with EU officials saying they cannot approve the deal while Washington pursues control of Greenland. ING analysts said that while the outcome of the dispute remains uncertain, it underscores the lack of predictability in global trade and tariff policy.

    Gold reaches record high

    Gold prices climbed to record highs in Asian trade on Monday, nearing $4,700 an ounce, as investors rushed into safe-haven assets following President Trump’s latest tariff threat.

    Spot gold rose 1.6% to $4,667.33 an ounce by 02:26 ET (07:26 GMT), after earlier touching a record $4,690.75. U.S. gold futures also hit a new peak at $4,697.71 an ounce.

    Silver prices surged more than 4% to a fresh all-time high of $94.03 an ounce, supported by safe-haven demand as well as its role as an industrial metal.

    Oil prices edge lower

    Oil prices edged lower, giving back part of last week’s gains as markets weighed the growing risk of a trade dispute linked to Greenland. Brent crude slipped 0.1% to $59.74 a barrel, while U.S. West Texas Intermediate fell 0.1% to $55.95.

    Crude had rallied early last week on concerns that unrest in Iran could threaten oil supplies from the Middle East, a region that accounts for a significant share of global output. Much of that risk premium faded after President Trump ruled out immediate U.S. military action, leading prices to pull back before stabilizing toward the end of the week.

    China’s economy meets 2025 growth target

    China’s economy grew slightly more than expected in the fourth quarter of 2025, data released on Monday showed, as policy stimulus and a pickup in consumption helped the country meet its annual growth target.

    Gross domestic product rose 4.5% year on year in the October–December period, in line with forecasts but down from 4.8% in the previous quarter, marking the slowest pace in three years. On a quarter-on-quarter basis, GDP expanded 1.2%, marginally above expectations of 1.1%.

    The result brought full-year 2025 growth to 5%, meeting Beijing’s target. The government is widely expected to set a similar 5% growth goal again, as it continues to face heightened U.S. trade tensions, weak consumer demand and a prolonged property sector downturn.

    Sources: Investing

  • The global economy is increasingly constrained by a declining workforce

    Economic growth depends on population expansion and the formation of new households. While the idea of fewer people—less congestion, smaller crowds, and reduced strain on infrastructure—may seem appealing, the risks associated with population decline are often understated. Much like deflation, a shrinking population poses serious and potentially greater threats to long-term economic stability.

    Demographers use the “total fertility rate” (TFR), defined as the average number of births per woman, as a key measure of population sustainability. A TFR of at least 2.1 is required to maintain a stable population, with the additional 0.1 accounting largely for infant mortality. Although the global TFR stood at 2.24 last year, this figure masks significant regional disparities. Excluding Africa, the global fertility rate falls well below 2.0.

    In 2025, most major advanced economies reported TFRs under the replacement threshold of 2.0, underscoring the growing demographic challenge facing industrialized nations.

    No major developed economy currently records a total fertility rate above the 2.1 replacement threshold. Outside of Africa, global population growth is already in decline. Historically, from 1950 to 1970, the world’s wealthiest nations averaged more than 2.7 births per woman. Since 1995, however, that figure has fallen sharply to around 1.6, reaching a record low of approximately 1.5 during the 2020–2025 period.

    Globally, population growth remains marginally positive, driven largely by demographic expansion in Africa and rising life expectancy among older populations. However, Asia’s two largest economies—China and Japan—are experiencing population decline, a trend that constrains their long-term growth potential. More critically, shrinking cohorts of younger workers are increasingly unable to shoulder the financial burden of supporting aging populations that are living longer and often facing higher healthcare needs.

    China has formally abandoned its long-standing one-child policy, but behavioral patterns shaped by decades of enforcement have proven difficult to reverse. Today, many young couples are reluctant to have even a single child, prioritizing career advancement and higher incomes instead. Compounding the challenge, the legacy of the policy produced severe demographic distortions. Prior to 2010, widespread prenatal sex selection—driven by the desire to raise a single male “heir” to support parents in old age—led to a significant gender imbalance, with roughly 118 male births for every 100 female births between 2002 and 2008. The result is a surplus of men and a shrinking pool of potential spouses.

    In the mid-1990s, a typical Chinese household consisted of four grandparents, two parents, and one heavily relied-upon child—the so-called “young emperor.” This inverted demographic pyramid is financially unsustainable, as the burden of supporting multiple generations increasingly falls on a single income earner.

    Europe faces an even steeper demographic challenge. With an average fertility rate of just 1.4 children per woman and a comparatively generous system of old-age pensions, the region confronts mounting fiscal pressure. These constraints help explain Europe’s historical reliance on the United States for security spending—a strategy that may prove risky as President Donald Trump presses European nations to assume greater responsibility for their own defense.

    The United States remains in a stronger demographic position than Europe or much of Asia, in part because of its relatively effective assimilation of immigrants and higher rates of family formation in more conservative regions of the country. However, with the administration introducing tighter immigration restrictions and stepping up efforts to detain and deport undocumented workers, questions are emerging over whether there will be a sufficient supply of willing young workers to staff the growing number of factories being brought back onshore.

    Another structural risk embedded in these demographic trends is the growing strain on Social Security and Medicare. These programs function as intergenerational compacts, in which today’s workers finance the retirement and rising healthcare costs of the elderly. Unlike 401(k) plans or IRAs, they are not savings vehicles but largely unfunded entitlements built on historical assumptions of higher birth rates and a broad, growing workforce.

    As younger generations are increasingly less likely to marry, have children, or pursue stable, high-earning careers—instead relying more on gig-based employment—the system faces mounting pressure. These shifts raise serious concerns about the long-term sustainability of funding future benefits, particularly in a society producing fewer contributors to support the next generation of retirees.

    Sources: Investing

  • Gold surges to record near $4,700/oz amid Trump’s Greenland tariff threats

    Gold prices jumped to record highs in Asian trade on Monday, nearing $4,700 an ounce, as strong safe-haven demand followed President Donald Trump’s threat to impose fresh tariffs on eight European countries over Greenland.

    Spot gold was last up 1.8% at $4,675.55 an ounce by 19:31 ET (00:31 GMT), after touching a session record of $4,690.75 earlier. U.S. gold futures rose 1.9% to $4,681.10 an ounce.

    The precious metal built on last week’s strong gains, during which bullion posted a series of record highs, supported by growing expectations of U.S. interest rate cuts and elevated geopolitical risks.

    Silver surged more than 4% to a fresh record high of $94.03 an ounce, buoyed by both safe-haven demand and its role as an industrial metal.

    U.S. President Donald Trump said on Sunday he would impose fresh tariffs on eight European countries that have opposed Washington’s plan to acquire Greenland. Trump said a 10% levy would be introduced from Feb. 1, with the rate set to rise to 25% in June if no agreement is reached.

    The affected countries include France, Germany and the United Kingdom, along with several Nordic and northern European nations. The move drew sharp criticism from European officials and reignited fears of a wider transatlantic trade dispute, driving investors toward precious metals.

    The tariff threat added to an already favorable environment for gold, which has been supported in recent weeks by expectations that the Federal Reserve will begin cutting interest rates later this year.

    Weaker U.S. economic data and signs of easing inflation have reinforced the case for monetary easing, lowering the opportunity cost of holding non-yielding assets such as gold.

    Geopolitical risks have also underpinned prices, with gold rising sharply last week amid renewed concerns over developments in the Middle East, including tensions involving Iran.

    Sources: Forbes

  • Canada and China cut EV and canola tariffs as relations reset

    Canada and China reached a preliminary trade agreement on Friday to sharply reduce tariffs on electric vehicles and canola, pledging to dismantle trade barriers and deepen strategic cooperation during Prime Minister Mark Carney’s visit.

    On his first trip to China since 2017 by a Canadian prime minister, Carney aims to repair relations with Canada’s second-largest trading partner after the United States, following months of diplomatic outreach.

    Canada will initially permit imports of up to 49,000 Chinese electric vehicles at a 6.1% most-favoured-nation tariff, Prime Minister Mark Carney said following talks with Chinese leaders, including President Xi Jinping.

    The move marks a sharp reversal from the 100% tariff imposed on Chinese EVs in 2024 under former Prime Minister Justin Trudeau, in line with similar measures taken by the United States. China shipped 41,678 electric vehicles to Canada in 2023.

    “This restores access to levels seen before the recent trade disputes, but within a framework that offers significantly more benefits for Canadians,” Carney said, adding that the import quota would be expanded gradually to around 70,000 vehicles over the next five years.

    “To build a globally competitive electric vehicle industry, Canada must learn from innovative partners, gain access to their supply chains, and stimulate domestic demand,” Carney said, distancing himself from former prime minister Justin Trudeau’s view that tariffs were necessary to shield local manufacturers from subsidised Chinese competitors.

    Canada’s decision to ease EV tariffs runs counter to U.S. policy, drawing criticism from some members of President Donald Trump’s cabinet ahead of a planned review of the U.S.–Canada–Mexico trade agreement. However, Trump himself voiced support for Carney’s approach.

    “That’s exactly what he should be doing. Signing trade deals is good for him. If you can strike a deal with China, you should take it,” Trump said at the White House.

    AGRI-FOOD PARTNERSHIP: Ontario Premier Doug Ford denounces the deal.

    “The federal government is effectively opening the door to a surge of low-cost Chinese-made electric vehicles without firm assurances of comparable or timely investment in Canada’s economy, auto industry, or supply chains,” Ford said in a post on X.

    China imposed retaliatory tariffs in March on more than $2.6 billion worth of Canadian agricultural and food exports — including canola oil and meal — in response to tariffs introduced by Trudeau. Additional duties on canola seed followed in August.

    As a result, China’s imports of Canadian goods fell by 10.4% in 2025.

    Under the new agreement, Canada expects China to cut tariffs on canola seed to a combined rate of around 15% by March 1, down from 84%, Carney said. He added that discriminatory tariffs on Canadian canola meal, lobsters, crabs and peas are also expected to be lifted from March 1 through at least the end of the year.

    Canadian canola futures climbed.

    The agreements are expected to generate nearly $3 billion in export orders for Canadian farmers, fishers and food processors, Carney said.

    China’s Ministry of Commerce said it would adjust anti-dumping duties on canola and lift anti-discrimination measures on certain Canadian agricultural and seafood products, citing Canada’s decision to lower tariffs on electric vehicles.

    Carney added that President Xi Jinping had agreed in principle to grant visa-free travel for Canadians visiting China, though further details were not provided.

    In a statement released by state-run Xinhua, the two countries said they would resume high-level economic and financial talks, expand trade and investment, and deepen cooperation in sectors including agriculture, oil, gas and green energy.

    Carney said Canada plans to double the size of its power grid over the next 15 years, creating potential opportunities for Chinese investment, including in offshore wind projects. He also said Canada is ramping up liquefied natural gas exports to Asia, with annual production set to reach 50 million tonnes by 2030, all of which will be shipped to Asian markets.

    Carney says China has become “more predictable”

    Given the growing complications in Canada’s trade relationship with the United States, it is unsurprising that Carney’s government is seeking to strengthen trade and investment ties with Beijing, which offers a vast market for Canadian agricultural exports, said Even Rogers Pay of Beijing-based consultancy Trivium China.

    U.S. President Donald Trump has imposed tariffs on certain Canadian goods and has even suggested that the longtime U.S. ally could become America’s 51st state. China, which has also been targeted by Trump’s tariffs, is eager to deepen cooperation with a G7 country traditionally seen as part of the U.S. sphere of influence.

    Asked whether China had become a more predictable and reliable partner than the United States, Carney said recent engagement with Beijing had delivered greater clarity and tangible outcomes. “Looking at how our relationship with China has evolved in recent months, it has become more predictable, and we are seeing results from that,” he said.

    Carney added that he had also discussed Greenland with President Xi Jinping, saying the two leaders found their views broadly aligned. Trump has recently revived his claim to the semi-autonomous Danish territory, prompting NATO members to push back against U.S. criticism that Greenland is insufficiently defended.

    Analysts said the warming of ties between Canada and China could alter the political and economic backdrop of Sino-U.S. competition, though Ottawa is unlikely to shift decisively away from Washington.

    “Canada remains a core U.S. ally and is deeply integrated into American security and intelligence systems,” said Sun Chenghao, a fellow at Tsinghua University’s Centre for International Security and Strategy. “A strategic realignment away from Washington is therefore highly unlikely.”

    Sources: Reuters

  • No layoffs even as tariff-related cost pressures continue across Federal Reserve districts

    The Federal Reserve’s Beige Book released Wednesday indicated that “tariff-driven cost pressures were widespread across every district.” Out of the 12 Fed districts, only two saw mild price increases, while the remaining 10 experienced more intense price pressure. This suggests the Fed is unlikely to reduce benchmark interest rates at the upcoming FOMC meeting—unless signs of labor market weakness push them to cut rates again to support hiring.

    Meanwhile, a 5.1% increase in existing home sales in December could point to a potential recovery in the housing sector. The median price of homes sold last month was $405,400, a gain of just 0.4% year-over-year, indicating that home price appreciation remains limited.

    The Commerce Department reported that retail sales increased 0.6% in December, surpassing economists’ forecasts of a 0.5% gain. In addition, October’s retail sales were revised to a 0.1% decline, instead of the previously estimated 0.2% rise. Overall, 10 of the 13 retail categories posted higher sales in November, making this a strong performance that should continue to support solid GDP expansion.

    Meanwhile, three missile-capable ships and an aircraft carrier are being deployed to the Middle East in a show of force aimed at pressuring Iran’s government. Crude oil markets are pricing in the possibility that Iran’s oil exports could be removed from global supply, depriving the regime of revenue. This signals that President Trump may take further action beyond sanctions and a 25% tariff on nations that trade with Iran.

    Intense diplomatic efforts have been taking place between Iran and neighboring Arab countries. On Wednesday, President Trump said Iran had halted the killing of anti-government demonstrators and would not carry out death sentences against people accused of seeking to overthrow the regime. His comments suggested the U.S. might be stepping back from launching military strikes. Trump told reporters that the U.S. had received word Iran had “no plans to execute protesters.”He went on to say that new information indicated the deaths had ceased and the executions had been stopped, adding that many believed executions were scheduled for that day.

    Sources: Investing

  • Economic Forecast for the United States – January 2026

    Powell’s concluding move

    Jerome Powell’s eight-year leadership at the Federal Reserve is ending amid significant challenges for the U.S. central bank and divided opinions among policymakers about the right approach to monetary policy. So, what might Powell’s last moves as Chair look like in this environment?

    The labor market is still slightly weaker than full employment. Private sector job growth has stalled recently, and although the unemployment rate dropped a bit in December, it remains above what most economists consider the long-term natural rate.

    On the inflation front, recent data are more promising. Core CPI inflation fell to 2.6% year-over-year in December from 3.1% in August. Some temporary shutdown effects may be lowering this figure by about 0.1 percentage points, and the Fed’s preferred inflation gauge, the PCE deflator, likely hasn’t improved as much. However, the overall trend for core inflation entering 2026 is clearly downward.

    Given this, the Federal Open Market Committee (FOMC) likely has room to continue guiding the federal funds rate toward a neutral level in the near term. The forecast remains two quarter-point rate cuts in March and June, with the rate then holding steady at 3.00%-3.25%.

    However, the opportunity for further rate reductions is narrowing. Fiscal stimulus from the recent One Big Beautiful Bill Act is expected to start boosting the economy by spring or summer. Additionally, tariff risks seem to be declining, which could also spur faster growth later in the year. The recent 75 basis points of rate cuts over the past three months will likely provide some support as well.

    If labor market and inflation indicators show signs of overheating in the coming months, Powell and the FOMC might opt to pause policy adjustments and leave things steady for the next Chair. This successor could face skepticism from a committee under pressure from the Trump administration. The expectation of stronger economic growth in spring and summer further supports holding rates steady.

    For now, the current forecast stands, but there is growing risk that rate cuts may be delayed or reduced compared to the baseline prediction.

    Download full US Economy Forecast report

    Sources: Wells Fargo

  • Crude Oil Outlook: WTI Climbs to Highest Levels in Over Three Months as Escalating Iran Tensions Stir Market Worries

    Oil prices are rising sharply, as WTI nears $62 and Brent crude moves up toward $66 per barrel. These increases highlight the market’s responsiveness to geopolitical tensions, despite no actual disruptions in supply. The question remains: where will prices go from here?

    Main Highlights of WTI Crude Oil

    • WTI Crude Oil prices are sharply rising amid concerns that ongoing protests in Iran might escalate and impact production or disrupt the Strait of Hormuz.
    • However, this upward pressure is balanced by underlying fundamentals and a global surplus.
    • The current price around $62 is a crucial threshold: surpassing this resistance level could pave the way for a rally toward the six-month highs near $66.

    In today’s trading environment, it can be difficult for market participants to isolate the key drivers of price action on a day‑to‑day basis. Beyond enduring themes like economic growth trajectories, inflation trends, the expansion of AI infrastructure, and sovereign debt pressures, fresh geopolitical tensions seem to emerge almost daily.

    Amid simmering issues in places like Venezuela — and speculation about other potential flashpoints — Iran has become the dominant focus for energy markets. Nationwide protests there, sparked by severe economic strains and a collapsing currency, have raised serious questions about stability in one of the world’s most influential oil‑producing countries.

    Although these demonstrations have not yet led to direct disruptions in oil output, the unrest has prompted traders to price in a growing geopolitical risk premium. Concerns about possible escalation — including the risk of broader conflict or disruption to key infrastructure such as the Strait of Hormuz, through which a large share of global seaborne oil exports transit — are contributing to recent volatility in crude prices.

    As a reminder, Iran remains a key influence on global energy markets due to both its oil production capacity and its control over the Strait of Hormuz — a vital maritime chokepoint through which nearly 20 million barrels per day of crude and petroleum products transit, representing a large share of seaborne global oil flows. Any actual or perceived threat to exports or shipping through this route can have outsized impacts on pricing and risk sentiment.

    Against this backdrop, oil prices have recently climbed, with Brent trading in the mid‑$60s and WTI previously approaching the $62 per barrel area, as traders price in geopolitical risk tied to the unrest in Iran. This reflects markets’ sensitivity to potential escalations, even though there have been no confirmed widespread production outages to date.

    However, this upside is balanced by broader market fundamentals. Global oil inventories remain substantial, and additional output from other producers — including resumed Venezuelan exports and lingering oversupply concerns — continues to temper the rally. This backdrop helps explain why prices have fluctuated and, at times, pulled back when geopolitical anxieties ease.

    Looking ahead, the future direction of crude prices is likely to hinge on developments in Iran’s domestic unrest and whether tensions translate into actual disruptions in oil production or interference with key export infrastructure such as the Strait of Hormuz. So far, most of the price appreciation has been driven by risk premium and sentiment rather than physical losses of barrels.

    If broader instability were to disrupt supply routes or exports, markets could respond with a more pronounced and sustained price surge, particularly given the strategic importance of Middle East exports to the global oil system. However, short‑term moves are also currently influenced by macro factors such as inventory data and demand signals, as well as comments from policymakers that can quickly recalibrate risk perceptions.

    Technical Analysis of Crude Oil: Daily Chart for WTI

    Looking at the technicals, WTI Crude Oil is on a five-day winning streak, climbing from the lower end of its three-month trading range between $55 and $62 up to the upper boundary. Chart-wise, the current price level is a crucial threshold: a break above the $62 resistance — which also aligns with the 200-day moving average — could open the door for further gains toward the six-month highs around $66, where it would face resistance from the longer-term bearish trend line drawn from the second half of 2023’s peak.

    Conversely, if indications emerge that the protests are easing and stability is being restored in Iran, the geopolitical risk premium currently weighing on crude prices may diminish. This could trigger a reversal, causing prices to retreat below the $60 mark. Regardless of the outcome, oil traders should closely monitor developments in Iran in the days ahead.

    Sources: StoneX

  • Silver’s Record Rally Faces Resistance Amid Surging Volatility

    After reaching record highs and recording its largest four-day gain since 2008, silver’s momentum has sharply reversed. The price broke through its uptrend support from January 9, signaling a potential deeper correction.

    Despite strong macroeconomic tailwinds, selling pressure has intensified, likely fueled by heavy retail trader activity, which has contributed to significant volatility.

    The break of the uptrend was confirmed by a three-candle bearish reversal pattern on the hourly charts and bearish divergence in the RSI (14) indicator.

    Following the trend break, silver’s price dropped sharply to a support level at $86.24 before rebounding toward $89.15. This price range has been a key area of activity recently and will be important for traders monitoring short-term movements.

    If the bullish trend has ended and the price fails to climb back above $89.15 to rejoin the uptrend, traders might consider opening short positions just below this level with a tight stop-loss above it for protection. The initial target would be support at $89.24.

    Should this support break, key downside levels to watch are $84.60, $83.67, and $82.76, all of which previously acted as short-term support or resistance during the upward move. Further declines could target $80.50 and $79 if the sell-off gains momentum.

    However, as has often been the case with silver breakouts, bearish moves tend to be short-lived, so a strong wave of dip-buying remains possible. If buyers push the price back above $89.15, it could trigger new long positions aiming first for the previous uptrend level, followed by targets at $92 and the record high of $93.61.

    While I don’t put much emphasis on the mixed signals from the RSI (14) and MACD regarding the short-term direction, the bearish divergence between RSI and price before the drop did offer an early warning that the bullish momentum was weakening. This is an important factor to consider regardless of silver’s next move.

    Sources: StoneX

  • Gold prices fall back from record peaks after Trump eases Iran tensions and allays concerns about the Federal Reserve

    Gold prices declined during Asian trading on Thursday following three days of record-breaking highs, as U.S. President Donald Trump softened his position on the unrest in Iran and Federal Reserve Chair Jerome Powell eased concerns, reducing the demand for gold as a safe haven.

    Spot gold was last down 0.8% at $4,588.55 per ounce by 23:04 ET (04:04 GMT), while U.S. Gold Futures fell 0.3% to $34,594.10. In the previous session, gold reached a record peak of $4,642.72 per ounce.

    Other precious metals experienced even sharper drops, with silver plunging nearly 6% to $87.74 per ounce and platinum prices falling 4% to $2,309.52 per ounce.

    Gold retreats from highs as Trump adopts a milder approach toward Iran

    The precious metal had climbed to consecutive record highs amid concerns that escalating unrest in Iran might provoke U.S. military intervention and destabilize the Middle East, along with worries about political pressure on the U.S. Federal Reserve.

    Those fears subsided after President Trump indicated a softer approach toward Iran. He stated that he was reassured Iranian authorities would cease killing protesters and expressed his belief that there were no plans for large-scale executions at this time.

    His remarks lowered the chances of an immediate U.S. military response to the protests against the government of Supreme Leader Ayatollah Ali Khamenei, easing the geopolitical tensions that had driven gold’s recent surge.

    Trump states there is no intention to dismiss Fed Chair Powell.

    Gold prices also came under pressure after Trump attempted to ease worries about the Federal Reserve. In an interview with Reuters, he stated that he had no plans to remove Federal Reserve Chair Jerome Powell, despite ongoing investigations, which helped to alleviate investor concerns about the independence of U.S. monetary policy.

    The recent decline in gold was partly due to profit-taking following its rapid rise, which pushed prices well beyond key technical levels.

    Despite Thursday’s drop, gold remained supported by expectations of U.S. interest rate cuts later this year, ongoing geopolitical tensions, and robust central bank purchases.

    Lower interest rates generally benefit gold by decreasing the opportunity cost of holding a non-yielding asset.

    Sources: Investing

  • WTI Falls Below $61 Amid Rising U.S. Stockpiles and Resumption of Venezuelan Oil Exports

    WTI crude slipped to around $60.70 during Wednesday’s Asian trading session, pressured by significant increases in U.S. crude stockpiles. Meanwhile, President Trump assured Iranian protesters that support is forthcoming.

    West Texas Intermediate (WTI), the U.S. crude oil benchmark, was trading near $60.70 during Wednesday’s Asian session, as prices edged lower amid rising supply pressures. WTI has been pressured by Venezuela restarting oil exports and the latest American Petroleum Institute (API) report showing a large build in U.S. crude inventories, while traders await the official Energy Information Administration (EIA) stockpile figures later in the day.

    According to Reuters and industry sources, Venezuela has begun reversing recent production cuts made under its previous U.S. oil embargo, allowing crude exports to resume. Two supertankers carrying roughly 1.8 million barrels each departed Venezuelan waters, potentially marking the first shipments under a 50‑million‑barrel supply arrangement with Washington, following U.S. control of the country’s exports after political developments.

    U.S. crude inventories saw a significant increase last week, with the American Petroleum Institute (API) reporting a build of 5.27 million barrels for the week ending January 9. This contrasts sharply with the previous week’s drawdown of 2.8 million barrels and defies market expectations, which had forecasted a 2 million barrel decline.

    Despite the growing stockpiles, ongoing geopolitical tensions in Iran—a key oil producer—could provide support for WTI prices. U.S. President Donald Trump canceled all planned meetings with Iranian officials and pledged assistance to protesters amid reports of a severe crackdown by Iranian security forces, which has resulted in hundreds of deaths. Trump has repeatedly warned that the U.S. would intervene if the Iranian government continues to target demonstrators.

    Sources: Investing

  • Silver: These 3 Factors Are Coming Together to Push Prices Toward $100

    • Silver is being boosted by expectations of interest rate cuts, a weaker US dollar, and increasing geopolitical tensions.
    • Limited supply combined with record-high industrial demand make silver very responsive to changes in market risk sentiment.
    • Staying above $83.36 maintains potential for further gains, while dips toward $75 are likely to draw in buyers.

    Silver kicks off the week with robust momentum, fueled by multiple factors converging simultaneously. Safe-haven demand is increasing due to geopolitical tensions, the broader economic environment supports expectations of US interest rate cuts, and supply remains constrained amid strong industrial demand.

    As a metal that bridges both precious and industrial categories, silver typically reacts more quickly than many other assets to changes in market risk sentiment.

    Interest Rates, US Dollar, and Risk Sentiment Are Aligning Together

    Last week’s US December jobs report indicated a cooling labor market. Non-farm payrolls increased by only 50,000, while the unemployment rate fell to 4.4%, revealing softer underlying growth despite the headline figures.

    This data boosted market expectations for an earlier Federal Reserve interest rate cut. As rate cut bets rose and the US dollar weakened, demand grew for non-yielding assets like silver, giving prices fresh support.

    At the same time, increased judicial scrutiny of Jerome Powell and escalating tensions between the Federal Reserve and the administration have added more pressure on the US dollar. Rising political and institutional uncertainty has driven investors toward safe-haven assets, a trend that often causes sharper price swings not just in gold but also in silver, which typically experiences greater volatility.

    Safe Haven Demand Returns to Center Stage

    Uncertainty in the Middle East and global politics continues to drive safe haven demand in commodity markets. Rising protests in Iran and renewed tensions between Tehran and the US have pushed investors toward gold and silver.

    Recent moves by the Trump administration involving Venezuela and Iran, including plans for Venezuelan oil exports and new sanctions threats, have added further uncertainty. In this context, silver’s rebound above $80 an ounce shows how quickly changes in risk sentiment impact prices. Ongoing geopolitical risks from the Russia-Ukraine war and the Gaza conflict also reinforce the environment supporting strong demand for safe haven assets.

    Industrial Demand and Supply Challenges

    Attributing silver’s rise solely to macroeconomic and geopolitical factors overlooks a key part of the picture. Industrial demand for silver is projected to hit record highs in 2025 and remain strong into 2026. Currently, about 58% of global silver demand comes from industrial uses, driven by rapid growth in sectors like solar panels, electric vehicles, electronics, and AI-related hardware.

    This evolving demand profile is making silver a more strategic commodity, which helps explain why its prices often react faster and with greater volatility when risk appetite or commodity exposure shifts.

    On the supply side, constraints persist. Only around 27% of silver production comes from primary silver mines; the majority is a byproduct of copper, lead, zinc, and gold mining, limiting the ability to quickly ramp up output. Following several years of supply deficits from 2021 to 2024, total silver supply in 2025 is estimated at about 813 million ounces, compared to demand of roughly 1.24 billion ounces.

    Inventories in London, China, and the United States have dropped to low levels, underscoring the tight market conditions. China’s new export licensing system, implemented on January 1, has added extra pressure by complicating shipments, particularly for smaller producers. Meanwhile, silver’s designation as a critical mineral in the US, along with consistent physical buying in China and India, continues to bolster fundamental demand.

    Silver’s Technical Outlook

    On the daily chart, silver spent much of last week trading sideways between $74.66 and $83.36 while maintaining its overall uptrend. This consolidation above the rising trendline suggests a temporary pause rather than a reversal. Strong buying interest near $74 late last week, followed by a renewed push toward new highs this week, indicates that short-term momentum has shifted back to the buyers.

    Technically, the $83.36 level is crucial. A decisive break and sustained trading above this point would turn previous resistance into support. As long as silver stays above $83.36, any pullbacks are likely profit-taking rather than a trend change, keeping the bullish outlook intact.

    In this scenario, silver could pick up pace toward the Fibonacci extension targets at $87, $88.76, and $91.28. Holding above $91 would further strengthen the case for a run toward the psychological $100 mark, with a potential next target around $103.63 if momentum continues.

    Momentum indicators back this positive outlook. The Stochastic RSI has been hovering near oversold levels, increasing the chance of an upside signal if silver stays above $83.36. The moving averages remain bullish, with short-term exponential moving averages trending upward and price holding above the 8-day EMA at 78.56 and the 21-day EMA at 73.20, reinforcing the prevailing upward trend.

    On the downside, daily closes below $83 would raise concerns about breaking the short-term rising trend. In that case, the first support to watch is 78.56, aligning with the 8-day EMA. If that fails, the 74.50 to 74.66 zone becomes crucial, marking the base of recent consolidation and a key Fibonacci retracement level.

    A decisive break below this support band could lead to a deeper correction toward 69.28 and potentially 64.93. However, if the broader fundamentals remain supportive—such as expectations for rate cuts, a weaker dollar, elevated geopolitical risks, and ongoing supply constraints—any pullbacks near $75 are likely to attract buyers.

    In summary, fundamentals continue to favor silver, but technically, holding above $83.36 is critical to confirm the uptrend. As long as this level holds, silver’s path higher remains open for gradual gains.

    Sources: Investing

  • Gold maintains bullish trend but moves into a cautious zone

    Gold futures have entered a crucial expansion phase, with prices accelerating beyond key VC PMI levels on both daily and weekly charts, indicating momentum-driven growth rather than a mean-reversion scenario. The 15-minute /GC chart shows prices breaking through the VC PMI Daily Mean near $4,496 and pushing above the Sell 1 Daily level at $4,531, confirming robust upward price acceptance. Such moves typically happen when price action and timing converge, creating what traders call “escape velocity.”

    According to the VC PMI framework, the market is currently trading near the upper probability band, approaching Sell 2 Daily around $4,561 and Sell 1 Weekly near $4,567, with Sell 2 Weekly projected at about $4,633. Historically, these levels mark significant zones of exhaustion or pause, where momentum traders tend to take profits and the risk of mean reversion rises. Although strong trends can push prices beyond these points, the odds favor increased volatility followed by consolidation once these upper bands are tested.

    Time cycle analysis highlights the significance of the present period. The current advance is reaching a short-term cycle peak that aligns with the mid-January rhythm, typically linked to sharp intraday moves and heightened emotional trading. When price momentum accelerates into a cycle window while nearing VC PMI sell bands, markets often shift from trend continuation to sideways rotation. This doesn’t signal a major top but does indicate a high-risk zone for initiating new long positions, emphasizing the need for disciplined trade management.

    From the Square of 9 perspective, the current price range corresponds with significant harmonic rotations stemming from previous major swing lows. The $4,560–$4,640 zone marks an important angular relationship where price, time, and geometric factors intersect. Such geometric convergence points often serve as critical decision areas, influencing whether the market pauses, pulls back to the VC PMI mean, or accelerates into a larger upward move.

    In summary, gold maintains its bullish structure but is currently trading within a statistically and geometrically significant high zone. Traders are advised to focus on risk management, gradually take profits, and consider the likelihood of mean reversion around the VC PMI levels, while closely watching cycle developments to confirm whether the trend will continue.

    Sources: Investing

  • Silver Hits Escape Velocity: Variable-Changing PMI Reinforces Bullish Outlook

    Silver futures continue their strong upward momentum, trading near $79.80 after a significant rally that pushed prices well above the VC PMI (Variable Changing Price Momentum Indicator) average and into the upper resistance zone.

    This pattern indicates the market has entered what we call escape-velocity behavior—where the trend’s acceleration temporarily outweighs short-term oscillators but still respects longer-term geometry and cycle pressures.

    Looking at the VC PMI, the daily mean is holding steady around $76.02, providing dynamic support throughout the week. The market also successfully defended the Daily Buy 1 level at $73.38, confirming the strength of the current bullish setup.

    Now, prices are approaching the Daily Sell 1 zone near $78.70, with the Daily Sell 2 resistance at $82.24 closely matching the previous swing high of $82.58. This overlap suggests a higher likelihood of short-term profit-taking or consolidation, rather than a reversal of the uptrend.

    On the weekly VC PMI framework, silver stays solidly above the Weekly Buy 1 level at $73.70, with the Weekly VC PMI mean around $78.15, reinforcing that the prevailing trend is upward. However, the Weekly Sell 1 level at $83.78 and Weekly Sell 2 at $88.23 mark key resistance zones where momentum typically slows and volatility tends to increase.

    From a time-cycle perspective, silver is currently trading within a compressed late-week cycle window, a phase where markets often pause, rotate, or experience slight retracements before the next move. Such pauses are common in strong trends and usually serve to reset momentum for continuation rather than signaling a reversal.

    The present cycle alignment suggests an initial phase of range expansion, followed by consolidation, rather than signaling a trend exhaustion.

    The Square of 9 geometry further supports this view. The $82–$83 area corresponds with a significant angular resistance band, while the $78–$76 range serves as a key rotational support zone. As long as prices stay above the VC PMI mean, the primary square rotation remains bullish, with higher-level targets pointing toward the mid-$80s in upcoming cycle windows.

    In summary, silver maintains a strong bullish structure according to both the VC PMI and Square of 9 frameworks. Any short-term pauses or pullbacks should be seen as opportunities for mean reversion within the broader uptrend, rather than signs of trend reversal.

    Sources: Investing

  • Upcoming Economic Week: Inflation and Retail Sales to Shape Fed Policy Outlook

    If economists were meteorologists, this week’s forecast would predict a data blizzard. However, clarity is expected to improve as markets receive highly anticipated reports on inflation, retail sales, and industrial production ahead of the Federal Reserve’s policy meeting on January 28.

    Few economists expect Fed Chair Jerome Powell and the Federal Open Market Committee (FOMC) to ease monetary policy again later this month—and neither do we. This week’s data could either confirm or challenge that view, starting with the December consumer price index report on Tuesday.

    The Fed drama intensified last week after President Donald Trump instructed Fannie Mae and Freddie Mac to purchase $200 billion in mortgage bonds—an action typically undertaken by the Fed itself. Many saw this move as an attempt to restart quantitative easing. Meanwhile, Fed Governor Stephen Miran told Bloomberg he anticipates 150 basis points of rate cuts this year.

    What’s still missing, however, is significantly lower inflation and a recession that would justify such aggressive easing. This week will also feature speeches from several Fed officials, which could provide insight into the central bank’s thinking. The lineup starts with New York Fed President John Williams on Monday, followed by Governors Miran (Wednesday), Michael Barr (Thursday), Michelle Bowman (Friday), and Vice Chair Philip Jefferson (Friday).

    Here’s a rundown of this week’s key data releases likely to influence the timing and scale of any future Fed rate cuts:

    Inflation

    Since the 43-day government shutdown in October and November, investors have struggled to gauge inflation accurately. The 2.7% year-over-year CPI rise in November, a slight dip from October’s 3.0%, was met with caution, as the shutdown likely disrupted the Bureau of Labor Statistics’ data gathering.

    This increases the importance of the upcoming CPI and PPI reports, which will be key indicators before the FOMC’s January 28 interest rate decision.

    The upcoming CPI report on Tuesday is expected to show a modest easing in inflation, with the Cleveland Fed’s model forecasting a 0.2% monthly increase and 2.6% year-over-year growth. The November PPI report, due Wednesday, is considered less impactful, while import and export price data for November will be released on Thursday.

    Retail sales

    Retail sales (Wednesday) are expected to show a slight increase in November after remaining flat in October (see chart). Overall, we believe consumer spending remains resilient despite rising living costs and soft employment figures. Additional important demand indicators this week include December existing home sales (Wednesday) and mortgage applications for the week ending January 9 (Wednesday).

    Jobless claims

    We anticipate layoffs will stay minimal, which has been the key insight from recent initial unemployment claims data (Thursday) (see chart). While demand for labor may be slowing in certain sectors, the feared AI-driven collapse in the job market has not materialized yet.

    Composite economic indicators & business surveys

    The composite cyclical indicators for December, due Thursday, are expected to show the coincident index holding at a record high, while the (mis)leading index continues its decline. Additionally, given delays in official hard data, the National Federation of Independent Business’ Small Business Optimism Index for December (Tuesday) should provide valuable insights, following its rise to 99 in November. Later in the week, the Federal Reserve banks of New York and Philadelphia will release their January business surveys (Thursday).

    Our preferred coincident indicator is the S&P 500 forward earnings per share, which has accelerated in recent weeks and hit record highs (see chart).

    Sources: Investing

  • GBP/USD Faces Near-Term Resistance Around 1.3450 Level

    • GBP/USD inched up to around 1.3430 during Monday’s early European session.
    • The market remains cautious as federal prosecutors launch a criminal investigation into Fed Chair Powell.
    • With the RSI lingering near the midline, further consolidation is possible in the short term.
    • Key support to watch is at 1.3358, while immediate resistance is seen near 1.3458.

    The GBP/USD pair found some buying interest around 1.3430 during Monday’s early European trading session. The US Dollar weakened against the British Pound following Federal Reserve Chair Jerome Powell’s revelation that President Donald Trump threatened him with a criminal indictment, sparking concerns about the Fed’s independence.

    The US Justice Department issued subpoenas and threatened criminal charges linked to Powell’s Senate testimony regarding renovations at Federal Reserve buildings. Powell described the investigation as “unprecedented” and suggested it was motivated by Trump’s frustration over his refusal to lower interest rates despite the president’s repeated public pressure.

    Ray Attrill, head of currency strategy at National Australia Bank, commented, “This open conflict between the Fed and the U.S. administration clearly doesn’t bode well for the U.S. dollar.”

    Traders will be paying close attention to UK jobs data due Tuesday, as the results could provide insights into market expectations for the Bank of England’s monetary policy. Weaker-than-expected figures might put short-term pressure on the British Pound (Cable).

    GBP/USD Technical Analysis

    On the daily chart, the 100-day EMA is trending upward, offering support at 1.3358, with the price maintaining above this key moving average to sustain the broader bullish outlook. The RSI at 51.90 is neutral but trending slightly higher, indicating momentum is stabilizing following a recent pullback. Holding above the EMA could set the stage for a retest of resistance at 1.3458, preserving the recovery trend.

    The price currently trades just below the Bollinger Bands’ middle line at 1.3458, with the bands narrowing, signaling lower volatility and a consolidation phase. The RSI near 52 confirms a range-bound environment. A decisive move above the mid-band would increase upward momentum, potentially targeting the upper band at 1.3552. Conversely, a drop toward 1.3365 would bring the lower band into focus, risking a deeper correction.

    Sources: Fxstreet

  • Gold Maintains Uptrend Near Record Highs Amid Geopolitical and Fed Uncertainty

    • Gold has drawn buyers for the third consecutive day, supported by escalating geopolitical tensions that increase safe-haven demand.
    • Worries over the Federal Reserve’s independence are weighing on the US Dollar, providing additional support to the XAU/USD pair.
    • However, diminished expectations for further Fed rate cuts could limit gold’s upside ahead of important US inflation data.

    Gold (XAU/USD) continues to trade with a bullish bias near record levels, holding just under the $4,600 mark reached earlier this week as investors seek safety amid persistent geopolitical tensions and concerns about the Federal Reserve’s independence. Escalating unrest in Iran and broader global risks have kept safe‑haven demand elevated, supporting bullion’s strong performance.

    At the same time, worries over the U.S. central bank’s autonomy have weighed on the U.S. Dollar, encouraging flows into non‑yielding assets like gold. However, expectations that rate cuts may be less aggressive could temper upside momentum ahead of key U.S. inflation data due out this week.

    Daily Market Movers: Gold Boosted by Safe-Haven Appeal and Softening USD

    Following a significant U.S. operation in Venezuela earlier this month, President Donald Trump announced that Washington would oversee the country’s administration during a transitional period after Venezuelan leader Nicolás Maduro was captured — even posting an image on social media depicting himself as the “Acting President of Venezuela.”

    Geopolitical risks remain elevated globally. Protests in Iran, which have resulted in hundreds of deaths, continue to unsettle markets, while the ongoing Russia–Ukraine conflict — including confirmed strikes on Russian oil infrastructure — adds further supply‑side pressure.

    In Asia, rising tensions between China and Japan have intensified after Beijing restricted exports of rare earths and rare‑earth magnets in response to Tokyo’s recent political remarks. These developments have helped push gold toward fresh all‑time highs as investors seek safe‑haven assets.

    On the monetary policy front, U.S. Federal Reserve Chair Jerome Powell has defended the central bank’s independence after threats of a criminal indictment linked to a Senate testimony, emphasizing that rate‑setting should be based on economic evidence rather than political pressure.

    Recent U.S. jobs data showed a smaller‑than‑expected increase in nonfarm payrolls and a falling unemployment rate, which has tempered expectations for aggressive rate cuts by the Fed this year — a factor that has weighed on the U.S. dollar and supported flows into gold.

    With no major U.S. economic data scheduled for Monday, markets are likely to remain sensitive to comments from Federal Open Market Committee (FOMC) members, while this week’s U.S. inflation figures will be a key focus for traders.

    Gold’s Technical Outlook Remains Bullish Despite Overbought RSI Signals

    From a technical standpoint, gold’s recent rise over the past month has formed an upward-sloping channel, signaling a solid short-term uptrend that supports bullish momentum for XAU/USD. The price remains above the ascending 200-period Simple Moving Average (SMA), reinforcing the positive trend and providing dynamic support near the $4,320–$4,325 zone.

    The MACD indicator shows the line staying above the Signal line in positive territory, with an expanding histogram indicating strengthening bullish momentum.

    However, the Relative Strength Index (RSI) at 71.82 suggests overbought conditions, which could limit immediate upside and lead to some consolidation near the channel’s upper boundary.

    Any pullback is likely to find support near the channel’s lower boundary around $4,365, with the rising 200 SMA further underpinning the overall bullish outlook. Maintaining momentum above these support levels would keep the upward trend intact, while a decisive break above the channel resistance could trigger a fresh rally toward higher levels.

    Sources: Fxstreet

  • WTI Holds Steady Above $59 Amid Increasing Supply Concerns

    • WTI prices rise amid growing supply concerns linked to escalating unrest in Iran.
    • President Trump has warned Tehran against using force on protesters, while Iran has warned the U.S. and Israel against any intervention.
    • However, oil price gains may be capped due to anticipated resumption of Venezuelan exports and forecasts of a potential market oversupply.

    West Texas Intermediate (WTI) crude extended its gains for a third consecutive session, trading around $59.10 per barrel during Asian hours on Monday. The rise in oil prices is driven by growing supply concerns amid escalating protests in Iran. As OPEC’s fourth-largest producer, exporting nearly 2 million barrels per day, any conflict escalation poses a significant risk to global supply.

    The unrest, now in its third week and having reportedly resulted in hundreds of casualties, has prompted Iranian authorities to signal a harsher crackdown. Meanwhile, U.S. President Donald Trump warned Tehran against using force on protesters and suggested possible intervention if the situation worsens, while Iranian officials cautioned against any U.S. or Israeli involvement.

    Oil price gains may be restrained by expectations that Venezuelan crude exports could resume following political changes in the country, with the U.S. poised to receive or manage up to 50 million barrels of sanctioned oil under a new arrangement with interim authorities. This potential influx of supply has tempered some of the upside from geopolitical risk.

    However, uncertainty remains over the timing and scale of Venezuelan shipments, as shifting U.S. policy and the logistics of restarting exports from dilapidated ports and vessels cloud the outlook for actual flows.

    Meanwhile, traders are watching for possible supply disruptions from Russia amid ongoing Ukraine attacks on energy infrastructure and the prospect of tougher U.S. sanctions on Russian energy exports — factors that could add upward pressure on prices if they materially reduce output.

    Sources: Fxstreet

  • Oil prices remain steady despite deadly protests in Iran and relaxed restrictions on Venezuela

    Oil prices remained mostly steady during Asian trading on Monday as investors balanced concerns over potential supply disruptions due to escalating unrest in Iran against the likelihood of more Venezuelan crude returning to the market.

    As of 22:23 ET (03:23 GMT), March Brent crude futures rose slightly by 0.1% to $63.39 per barrel, while West Texas Intermediate (WTI) futures also increased by 0.1% to $59.15 per barrel. Both benchmarks had gained over 3% last week amid heightened geopolitical tensions.

    Iran’s lethal protests raise fears of oil supply disruption

    Markets have been closely monitoring Iran, a major oil producer in the Middle East, where widespread anti-government protests have escalated in recent days. According to rights organizations, over 500 people have died amid the unrest.

    Iranian authorities have warned that U.S. military bases in the region would be targeted if Washington intervenes in support of the protesters. This threat has intensified concerns about a wider regional conflict that could disrupt oil shipments passing through the Strait of Hormuz, a critical artery for global energy supplies.

    U.S. President Donald Trump adopted a tougher stance on Iran last week, declaring that the U.S. would not remain passive if Iranian forces continue harsh crackdowns on demonstrators.

    “Iran, as the fourth-largest OPEC member, produces about 3.2 million barrels per day of crude oil, which represents a significant supply risk for the market,” ING analysts noted in a recent report.

    Resumption of Venezuelan oil exports limits upside in oil prices

    However, gains were limited by news from Venezuela, where U.S. officials indicated they might ease restrictions on the country’s oil sector. U.S. Treasury Secretary Scott Bessent said additional sanctions could be lifted as early as next week to help facilitate the sale of Venezuelan crude and support oil exports.

    President Donald Trump also revealed plans for Venezuela to turn over up to 30 – 50 million barrels of previously sanctioned oil to the United States.

    Despite the prospects of renewed output, major oil companies are cautious about re-entering the Venezuelan market without substantial legal and political reforms. ExxonMobil has described the country as “uninvestable” without major changes, and analysts note that firms whose assets were nationalised previously may be reluctant to return without adequate compensation.

    Sources: Investing

  • Iran threatens to target U.S. bases if Washington launches an attack

    Tehran has declared it will attack Israel and U.S. military bases in the region if Washington intervenes militarily to support protesters in Iran.

    Speaking before the Iranian Parliament today, Speaker Mohammad Baqer Qalibaf accused the U.S. and Israel of “supporting recent riots and causing unrest” across Iran. He warned that Israel and U.S. military bases in the region would be considered “legitimate targets” if the U.S. launches any attacks against Iran.

    According to Reuters, Israeli authorities are currently on high alert due to the possibility of U.S. intervention to back the protest movement in Iran.

    The New York Times quoted knowledgeable U.S. officials saying that in recent days, President Donald Trump has received reports on potential military interventions in Iran as he considers acting on his threats to attack the country over accusations of “suppressing protesters.”

    While Trump has not made a final decision, officials indicate he is seriously weighing the possibility of launching strikes in response to Iran’s crackdown on demonstrations. Various options have been presented to the president, including attacks on non-military sites in Tehran.

    According to sources, U.S. Secretary of State Marco Rubio spoke by phone with Israeli Prime Minister Benjamin Netanyahu on January 10 to discuss the protests in Iran, the situation in Syria, and the peace agreement in Gaza. Earlier that day, Rubio posted on social media expressing U.S. support for “the brave people of Iran.”

    When asked about the New York Times report, the White House referred to President Trump’s recent public statements and social media posts.

    “Perhaps Iran is closer to freedom than ever before. America is ready to help,” Trump wrote on social media on January 10.

    The day before, he warned of “very strong” retaliation if Iran causes protester deaths as in previous incidents. He noted the demonstrators in Iran face “extreme danger” and said the U.S. will closely monitor developments.

    “Iran better not start shooting because if they do, we will shoot back,” Trump said, but emphasized this did not mean American troops would directly deploy to Iran.

    The protests, which began on December 28, 2025, sparked by small traders upset over the economic situation and the falling rial, have spread in Tehran and other cities in recent days. Iranian officials accuse “terrorist agents” from Israel and the U.S. of inciting the protests and escalating violence, claims denied by the U.S. State Department, which says Tehran is “distracting attention from internal problems.”

    International organizations citing local sources report that the Iranian government has blocked nationwide information flow, cut Internet access, and limited international communications, making it difficult to assess the full scope of the protests. Some human rights groups abroad report over 100 protesters have died and more than 2,000 have been arrested since late December 2025.

    Iran’s Supreme Leader Ali Khamenei declared that the government will not back down before the protests, claiming that the past two weeks of unrest are caused by agitators aiming to please the U.S. leadership. He mocked Trump’s intervention warnings, urging the U.S. president to focus on domestic issues.

    Iranian Judiciary Chief Gholamhossein Mohseni Ejei warned of “severe, maximum, and merciless” punishment for rioters, while the intelligence branch of the Islamic Revolutionary Guard Corps (IRGC) vowed not to allow the protests to continue.

    Sources: Vnexpress

  • Looking Back at the First 25 Years of the 21st Century

    Reflecting on the start of this century, the first striking observation is our national shortsightedness. After surviving Y2K and the dot-com crash in 2000, our leaders assumed the path ahead would be smooth sailing from year one onward.

    However, reality proved otherwise, beginning with a series of black swan events, notably the attacks on the World Trade Center and Pentagon on September 11. While such events are inherently unpredictable, it’s remarkable that the Congressional Budget Office (CBO) economists confidently forecasted in 2001 a future of continuous budget surpluses, anticipating the complete elimination of national debt by 2011.

    For reasons unknown, the CBO issues 10-year federal spending and revenue projections, despite having no solid factual or practical foundation to accurately forecast beyond a year or two—akin to trying to predict the weather a year in advance.

    The January 2001 CBO report highlights this myopia. Their projections simply extended current trends indefinitely without grounding in reality. Under this unrealistic mandate, the CBO projected a cumulative surplus of $5.6 trillion for 2002–2011.

    In reality, deficits over that decade totaled $6.1 trillion—a swing of $11.7 trillion. It would have been much simpler to just flip a plus sign to a minus. The projections failed to account for the soaring costs of Bush’s “War on Terror” post-9/11, which led to prolonged wars in Afghanistan and Iraq, the bursting of the real estate bubble, and massive TARP bailouts to rescue large banks.

    In short, this is a summary of CBO’s flawed foresight:

    The first takeaway from this bleak forecast is that the CBO economists assumed deficits would increase in a smooth, predictable fashion—almost as if they were drawing a straight line with minor fluctuations, rather than reflecting the unpredictable realities of economic growth.

    A second point is that the 2003 Bush tax cuts were not the main driver of the deficits. In fact, annual deficits dropped significantly—from $413 billion in fiscal year 2004 (which began October 1, 2003) to just $161 billion in fiscal year 2007. This means the deficit shrank by more than half during the four years following the tax cuts and before the 2007 real estate crash.

    While much of this now feels like distant history, the ongoing wars and the Federal Reserve’s drastic response to the 2008 financial crisis—keeping interest rates near zero for eight years, essentially through the entire Obama administration—contributed to massive deficits that have persisted through to today, especially in the five years following the COVID-19 pandemic.

    Since 2001, U.S. federal deficits have averaged about $1 billion annually, but that figure has surged to over $2 trillion per year since 2020, according to the U.S. Treasury.

    Today, the total federal deficit stands at $38 trillion, which amounts to roughly $110,000 owed per American—far from the anticipated surpluses once projected.

    Following a Challenging 2000–2009, Markets Surged in the First Quarter

    What about the markets? After nearly a “lost decade” lasting nine years from March 2000 to March 2009, all major market indexes have experienced remarkable growth—particularly gold relative to the U.S. dollar.

    By March 9, 2009, three of the four major indexes—the S&P 500, NASDAQ, and Russell 2000—had fallen by 50% since the decade began (while the Dow was down 40%), but they bounced back strongly from 2009 through 2025:

    Over the same 25-year period, the Consumer Price Index (CPI) increased by 83%, which means the real market gains were somewhat diminished.

    The U.S. dollar performed even worse, losing about 10% in value overall (and 8% against the euro), while gold and silver surged more than 15 times in value:

    The first-quarter returns were decent, but the strong performance of gold and silver signals that the dollar—and the CBO’s deficit forecasts—cannot be relied on in the long run. In fact, President Trump has set a goal for 2026 to deliberately weaken the dollar against the Chinese yuan to “help” exporters boost overseas sales. Much of the talk about the dominance of the “King Dollar” is just rhetoric. In reality, many politicians aim to devalue their currencies to encourage trade, turning paper money into a “race to the bottom,” while gold quietly holds its value, watching from the sidelines.

    This brings us to the 2025 summary—a major victory for precious metals as the dollar dropped by 10%.

    2025 Brought Massive Gains for Precious Metals

    The year 2025 exemplified the key trends seen over the past 25 years—while the stock market continued to climb, gold and silver surged even faster. Although inflation is easing, gold today serves less as an inflation hedge and more as a safeguard against crises, a hedge against the dollar, and increasingly, a hedge against cryptocurrency volatility.

    In 2025, the U.S. Dollar Index (DXY) dropped by 10%, allowing major global currencies to gain between 5% and 15%. Meanwhile, the poorest-performing investments of 2025 brought good news for consumers through lower food and energy prices:

    So, if 2026 mirrors the gains of 2025, it will surely be a rewarding year for most investors.

    Sources: Investing

  • Firms rush to book vessels and organize logistics to move Venezuelan oil, sources say

    Oil companies seeking to take part in newly approved exports of Venezuelan crude to the United States after the removal of President Nicolás Maduro are holding urgent talks to secure tankers and organize operations to safely transfer oil from ships and deteriorating Venezuelan ports, according to four sources familiar with the matter.

    Trading firms and energy companies such as Chevron, Vitol, and Trafigura are vying for U.S. government contracts to export Venezuelan crude, the sources said, after President Donald Trump announced that Venezuela could deliver up to 50 million barrels of previously sanctioned oil to the United States.

    Trafigura told the White House in a meeting on Friday that its first vessel is expected to load within the coming week.

    After months under a U.S. blockade, Venezuela has been storing crude aboard tankers and has nearly exhausted its onshore storage capacity. Many of these vessels are aging, poorly maintained, and subject to sanctions. Due to insurance and liability restrictions, other ships cannot directly interact with sanctioned tankers—even if U.S. licenses are granted—sources added.

    Onshore storage facilities have also suffered years of neglect, creating additional risks for companies attempting to load the oil.

    Shipping firms including Maersk Tankers and American Eagle Tankers are among those seeking to expand ship-to-ship transfer operations in Venezuela, according to three of the sources.

    According to one source, Maersk Tankers could reuse the ship-to-shore-to-ship logistics model it previously employed in Venezuela’s Amuay Bay. The company already operates in nearby Aruba and Curaçao, whose waters are frequently used for transferring Venezuelan oil. However, while such transfers are feasible in Aruba and at U.S. ports, they come at a higher cost.

    In a statement, Maersk said its presence in Venezuela remains limited, with only 17 employees in the country. The company confirmed that all staff are safe and accounted for, and that there have been no changes to its ocean services. Operations are continuing with only minor delays, and the situation is being closely monitored.

    Another shipping source noted that transfer operations will be further complicated by a shortage of smaller vessels needed to move oil from storage tankers to piers, where it can then be transferred to other ships, as well as by poorly maintained machinery and equipment.

    American Eagle Tankers (AET), which already facilitates Chevron’s shipments of Venezuelan crude to the United States, is being contacted by potential customers seeking to expand its capacity in the region, two sources said.

    Neither AET nor Chevron immediately responded to requests for comment.

    Sources added that while exports could potentially return to the roughly 500,000 barrels per day that Venezuela shipped to the United States before sanctions—allowing stockpiles to be drawn down within 90 to 120 days—reaching that level will be difficult if crude must be sourced from both offshore tankers and onshore storage facilities.

    Companies are also fiercely competing for loading slots at Venezuela’s main Jose oil terminal, where both capacity and operating speed are constrained. Chevron, a major joint-venture partner in the country, is working aggressively to maintain its preferential access to Venezuelan terminals while preparing its vessel fleet, according to one source.

    Meanwhile, oil firms including Chevron, Vitol, and Trafigura are already securing supplies of much-needed naphtha, a Venezuelan industry source said. Naphtha is commonly blended with heavy Venezuelan crude to reduce its density, making it easier to transport and refine.

    Sources: Reuters

  • Gold Holds Steady Ahead of US Jobs Report for Rate-Cut Signals

    Gold held steady as traders balanced a stronger dollar with upcoming U.S. economic data on Friday that could influence this year’s interest rate policy.

    Gold hovered around $4,465 an ounce, up 3.4% for the week through Thursday, but faced some selling pressure after U.S. initial jobless claims for the week ending January 3 came in slightly below expectations. Meanwhile, the Bloomberg Dollar Spot Index, which measures the strength of the U.S. dollar, has risen 0.5% so far this year, making gold more costly for many buyers.

    The December jobs report due Friday is expected to provide insight into whether the Federal Reserve will pursue additional interest rate cuts following three consecutive reductions in 2025. While nonfarm payrolls are forecasted to show stronger job growth, the unemployment rate is expected to remain steady—mixed signals that may reduce the likelihood of the Fed accelerating further rate cuts.

    Gold just completed its strongest annual gain since 1979, surging about 65% last year and hitting a record high of $4,549.92 in late December. The powerful rally was driven by central bank purchases and increased investment in exchange-traded funds, fueled by the “debasement trade.” Additionally, lower borrowing costs—beneficial for non-yielding assets like gold—have further propelled its rise.

    Traders are closely monitoring the upcoming selection of a new Federal Reserve chair. Treasury Secretary Scott Bessent indicated that President Donald Trump is expected to make a decision this month regarding Jerome Powell’s successor, as Powell’s term concludes in May. According to Bessent, four candidates are currently being considered.

    Sources: Bloomberg

  • Oil prices climb on supply disruption risks as Venezuela market worries fade

    Oil prices advanced during Asian trading on Friday, extending the previous session’s rebound as investors focused on possible supply disruptions in Russia and Iran amid geopolitical risks.

    At the same time, fears of an immediate rise in Venezuelan oil output subsided after the U.S. Senate approved a measure requiring congressional authorization for further military action by President Trump.

    Analysts said oil production in the country is unlikely to increase sharply in the near term, even with U.S. intervention.

    Brent crude futures for March rose 0.7% to $62.44 a barrel, while WTI futures gained 0.7% to $58.03 by 21:04 ET (02:04 GMT). Both benchmarks rebounded to levels seen before last week’s U.S. military action in Venezuela after posting more than 4% gains on Thursday.

    Oil prices were supported by positive inflation data from China, the world’s top oil importer, signaling a tentative economic recovery. However, gains were limited as traders remained cautious ahead of key U.S. nonfarm payrolls data that could affect interest rate expectations.

    Markets focus on potential supply disruptions in Russia and Iran

    Concerns about possible supply disruptions in Russia and the Middle East lent support to oil prices this week.

    The conflict between Russia and Ukraine showed little sign of resolution, with ongoing military actions. A drone strike on a tanker headed to Russia in the Black Sea heightened fears of further interruptions to Russian crude supplies.

    Compounding these concerns, reports indicated that U.S. President Donald Trump plans to endorse a bipartisan bill imposing even tougher restrictions on countries trading with Russia, aiming to increase pressure on Moscow to seek a ceasefire.

    Meanwhile, Iraq’s government approved a move to nationalize operations at the West Qurna 2 oilfield—one of the world’s largest—in an effort to avoid supply disruptions stemming from U.S. sanctions on Russia.

    In Iran, escalating nationwide anti-government protests have raised worries about potential impacts on oil production. The government responded with a countrywide internet blackout as demonstrations spread across major cities protesting the Nezam regime.

    Market concerns over Venezuelan oil supply ease

    Oil prices benefited from easing worries that a U.S. intervention in Venezuela would lead to a significant near-term surge in global crude supply.

    Earlier this week, Trump stated that Caracas could deliver up to $3 billion worth of oil to the U.S. and indicated plans for long-term U.S. influence over the country.

    However, Congress has advanced legislation that may restrict U.S. military involvement in Venezuela.

    Many analysts noted that while U.S. involvement could eventually help boost Venezuelan oil production, persistent political turmoil and deteriorated infrastructure make any near‑term surge in output unlikely.

    Oil prices initially plunged after the U.S. detained Venezuelan President Nicolás Maduro and signaled control over the country’s oil industry, but prices had fully recovered by Friday as markets judged immediate changes to supply to be limited.

    Still, crude prices were experiencing their steepest annual decline in five years in 2025, weighed down by concerns over a widening supply glut and sluggish demand growth—an outlook echoed by major global institutions forecasting continued oversupply into 2026.

    Sources: Investing

  • Markets Rattled as U.S. Eyes Control of Venezuela’s Oil Industry

    Oil prices weakened yesterday after President Trump said Venezuela would supply large volumes of sanctioned crude to the United States.

    Energy

    Developments in Venezuela remain in the spotlight, adding further downside pressure to oil prices. President Trump said Venezuela is prepared to sell up to 50 million barrels of sanctioned crude to the United States, a move that could also immediately weigh on Canadian crude exports to the U.S.

    Such a deal would effectively open a release channel for Venezuelan oil, which has struggled to reach global markets due to a U.S. blockade on sanctioned tankers entering and leaving the country. Redirecting these barrels to the U.S. could ease storage constraints and reduce the need for Venezuela to curb production.

    The U.S. Department of Energy confirmed that Venezuelan crude is already being marketed internationally, while Trump’s energy secretary stated that Washington intends to maintain long-term control over future Venezuelan oil sales. This strategy is reinforced by the continued tanker blockade, with two additional vessels reportedly seized yesterday.

    Washington’s growing influence over Venezuela’s oil sector also raises uncertainty about the country’s future role within OPEC.

    Meanwhile, Energy Information Administration (EIA) data showed U.S. crude inventories fell by 3.83 million barrels last week, the sharpest draw since late October. However, product balances were more bearish, as gasoline stocks rose by 7.7 million barrels and distillate inventories increased by 5.6 million barrels.

    These inventory builds point to refinery utilization remaining firm, while implied demand for both products softened somewhat over the past week.

    European gas prices moved higher yesterday, with TTF closing more than 2.5% up on the day. Colder conditions across parts of Europe, along with forecasts for below-average temperatures in the days ahead, are supporting the market. The current cold spell has also accelerated storage drawdowns, with EU gas inventories now at 58% of capacity, compared with a five-year average of 72%.

    The latest positioning data show that investment funds cut their net short exposure in TTF for a third straight week. Funds purchased 6.2 TWh during the latest reporting period, reducing their net short position to 72.4 TWh.

    Sources: ING Economic and Financial Analysis

  • Federal Reserve could accelerate rate cuts amid rising deflation risks

    The ISM service index suggests potential positive revisions for fourth-quarter GDP growth. On Wednesday, the Institute for Supply Management (ISM) reported that its non-manufacturing service sector index increased to 54.4 in December from 52.6 in November, marking the third consecutive month of expansion and the fastest pace of growth in over a year.

    The new orders sub-index rose sharply to 57.9 from 52.9, while business activity climbed to 56 from 54.5. Additionally, new export orders improved to 54.2, up from 48.7 in November. Out of 16 surveyed service industries, 11 showed expansion in December.

    Conversely, the ISM manufacturing index fell to 47.9 in December from 48.2 the prior month, continuing its contractionary trend for the tenth straight month (a reading below 50 indicates contraction). Only 2 of 17 manufacturing industries—Electrical Equipment, Appliances & Components, and Computer & Electronic Products—reported growth, likely supported by strong data center demand.

    ADP’s December report showed private payrolls increasing by 41,000, missing economists’ expectation of 48,000. This follows a loss of 29,000 private jobs in November, meaning just 12,000 private jobs were created over the last two months. Manufacturing shed 5,000 jobs in December, while education and health services added 39,000, and leisure and hospitality gained 24,000 jobs. Regionally, the West lost 61,000 private sector jobs, while the South led with a gain of 54,000.

    Residential investment acted as a 5.1% drag on GDP growth during the second and third quarters. Strengthening GDP going forward will depend largely on stabilizing the residential real estate market, which remains sluggish due to high mortgage rates, rising insurance costs, and an oversupply in several key areas. According to the Intercontinental Exchange, prices for U.S. condominiums dropped 1.9% in September and October, with high homeowners association (HOA) fees and insurance expenses cited as major factors. In nine major metropolitan regions, over 25% of condominiums have fallen below their original sale prices. While multiple Federal Reserve rate cuts could help support home prices, the current weakness is fueling deflationary concerns that the Fed needs to address.

    If deflation emerges from (1) weak housing and rental prices, (2) low crude oil prices, and (3) deflation imported from China and other struggling global economies, the Fed may need to implement rapid interest rate cuts totaling around 100 basis points. With President Trump expected to nominate a new Fed Chair soon, current Chair Jerome Powell is likely to become a lame duck. Minutes from the December Federal Open Market Committee (FOMC) meeting indicated at least one more 0.25% rate cut is probable, but any further deflationary signals could prompt the Fed to enact much larger reductions in key rates in the coming months.

    President Trump is expected to nominate a new Federal Reserve Chair in January who will likely reverse the Fed’s current restrictive policies and adopt a more pro-business stance. Should Kevin Hassett, the current Chair of the Council of Economic Advisors, be appointed, the Fed would gain a strong economic advocate, a development that many find promising and exciting.

    Sources: Investing

  • Gold stays strong as rising global tensions revive the case for hard money

    Critics of fiat currency have repeatedly tried—and failed—to call a peak in gold and silver. Once again, their arguments were derailed by geopolitical developments in Venezuela and beyond. The repercussions could prove even more supportive for the world’s most powerful form of money: Gold.

    Iran is increasingly becoming a flashpoint of unrest, with protesters chanting “Death to the dictator!” while the U.S. government threatens action against the regime. Meanwhile in Asia, Chinese social media is circulating alleged plans to remove Taiwan’s leadership in a manner similar to what happened to Maduro. At the same time, President Trump’s earlier claim that he could end the war in Ukraine within 24 hours has clearly proven unrealistic. The conclusion is straightforward: geopolitical forces are now providing exceptionally strong support for gold—arguably outweighing, at least for the moment, concerns over government debt.

    Gold appears to have broken higher from its October peak, and the pullback toward my $4,260 “speculator buy zone” is a technically normal correction. Investors who currently hold no gold should not wait around for a major selloff before entering the market. A small starter position is a better way to gain initial exposure to this exceptional asset. From there, larger allocations can be added during deeper pullbacks into strong support levels.

    Because people are forced to purchase nearly everything using their government’s debased fiat currency, their attention in the early phase of a fiat system is directed toward acquiring more fiat rather than accumulating gold.

    Over time, the purchasing power of fiat currency deteriorates rapidly, eventually pushing people to shift their focus toward gold. This is the phase America is expected to enter within the coming years. For those who have already adopted gold as their preferred currency, it will be a rewarding period—while for others, the transition may prove unsettling.

    The platinum chart looks impressive. While platinum isn’t considered money, it remains a valuable metal and a useful means to acquire more gold. My recommendation was to buy platinum when prices are below $1,000 and then sell 30% to 70% of holdings between $1,800 and $2,400, using the proceeds to purchase gold. Personally, I opted to sell 70% and keep the remaining 30% as a long-term investment.

    As for silver, there’s promising news: it might reclaim its role as a form of money. Rumors persist about central banks’ growing interest in this remarkable metal. Additionally, the era of robotics is dawning, with millions of robots set to replace human workers. Most will likely run on electricity generated by solar panels, which require silver for their production. While some manufacturers may switch to copper, a $100 price floor for silver appears inevitable.

    Examining this metal’s impressive price movement relative to gold, and with silver’s potential to regain recognition as money, my advice is to sell no more than 30% of your holdings during the current upward rally, which has brought prices into my targeted zone on the chart. Similar to platinum, gains should be reinvested not into depreciating fiat currencies, but into gold.

    Another important asset for investors focused on gold is uranium. The chart for yellowcake stocks (URNM ETF) is striking, displaying a bullish inverse Head & Shoulders continuation pattern with a notably strong high right shoulder. Additionally, the Stochastics (14,7,7) indicator is signaling a buy at the chart’s lower levels. Simply put, yellowcake stocks present one of the clearest momentum-driven buying opportunities available.

    What about the miners? This could be one of the most bullish charts worldwide. I’ve advised investors in mining stocks to watch the CDNX closely as a key indicator of upside potential for gold and silver miners across the board. The right shoulder appears to form a bull wedge, poised to trigger a powerful breakout for these significantly undervalued miners.

    The “mouthwatering” GDX versus gold chart has caught my attention. I urged investors to look for a Stochastics (14,3,3) flatline signal, which has now appeared. A breakout above the neckline of the large inverse Head & Shoulders pattern seems imminent.

    Put simply, if an investment cannot outperform gold—the ultimate store of value—there’s little reason to buy it; investors might as well hold gold directly. In the case of mining stocks, they seem poised to deliver one of the most significant wealth-building opportunities in market history. The key question remains: are informed investors ready to take advantage?

    Sources: Investing

  • Market Trend Structure

    Market Trend Structure (often called Market Structure) describes how price moves over time by forming highs and lows. It helps traders understand trend direction, strength, and possible reversals.

    Types of Market Trend Structure

    Why Market Trend Structure Is Important

    ✔ Identifies trend direction
    ✔ Helps with entry & exit timing
    ✔ Improves risk management
    ✔ Works across all markets:

    • Stocks
    • Forex
    • Crypto
    • Commodities

    ✔ Valid on all timeframes


    Some other market trend patterns

    Understanding market trend patterns requires a strong foundation in fundamental knowledge to be truly effective.