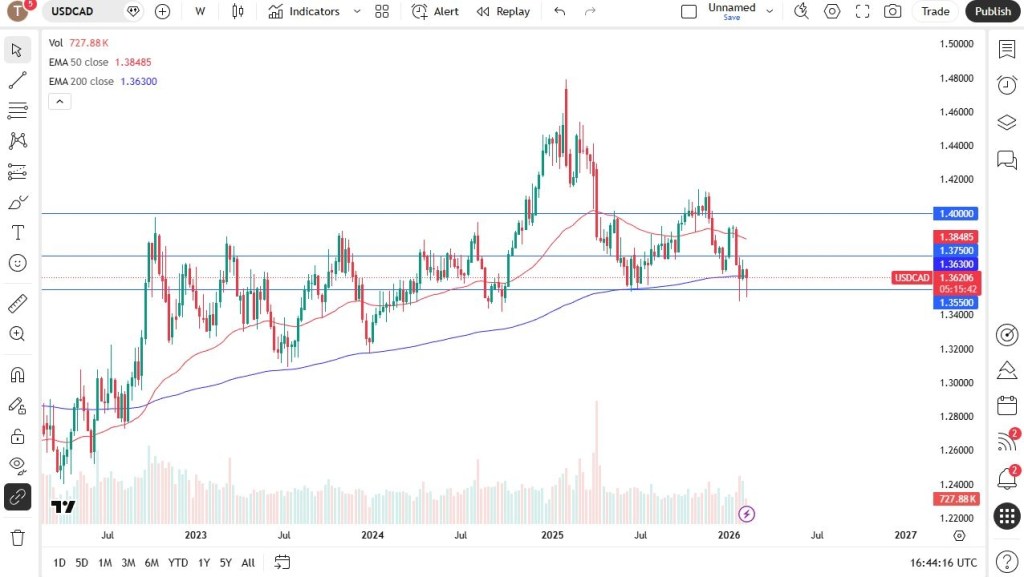
USD/CAD
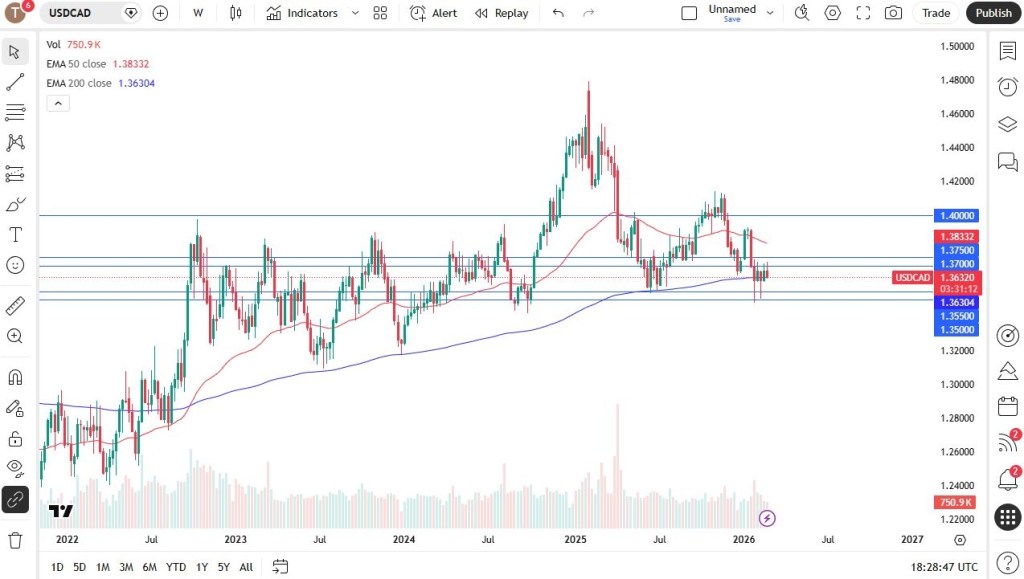
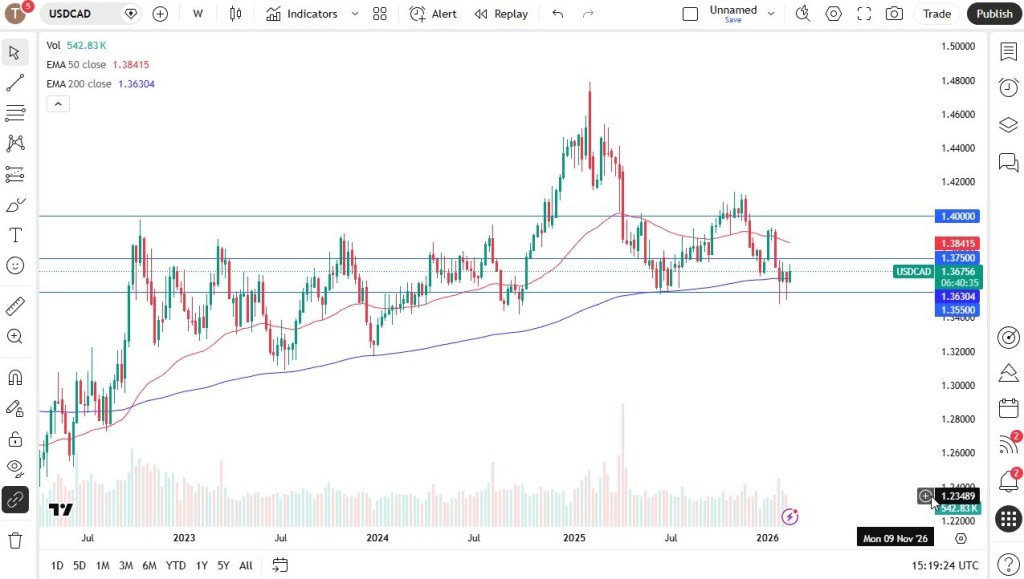
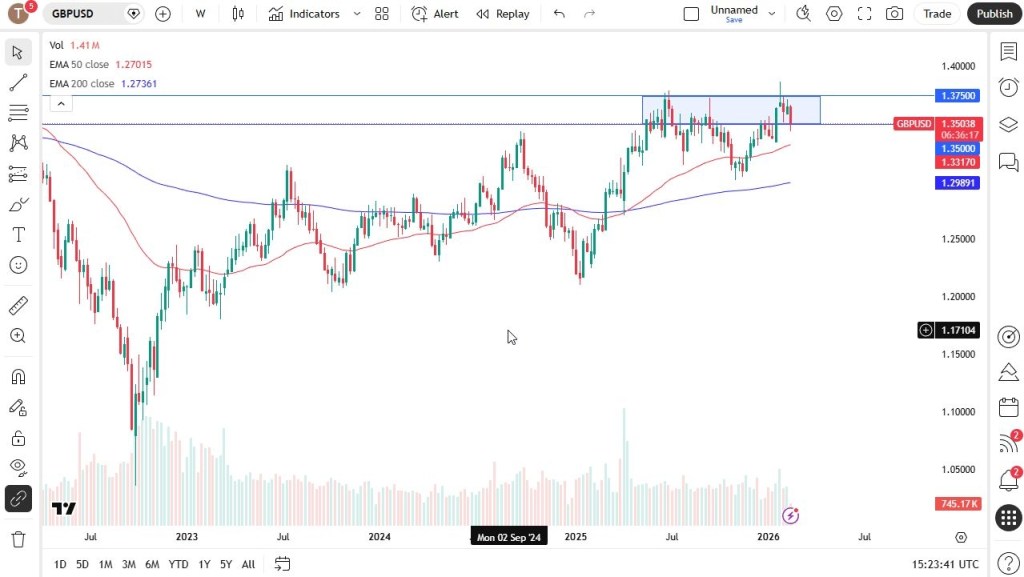
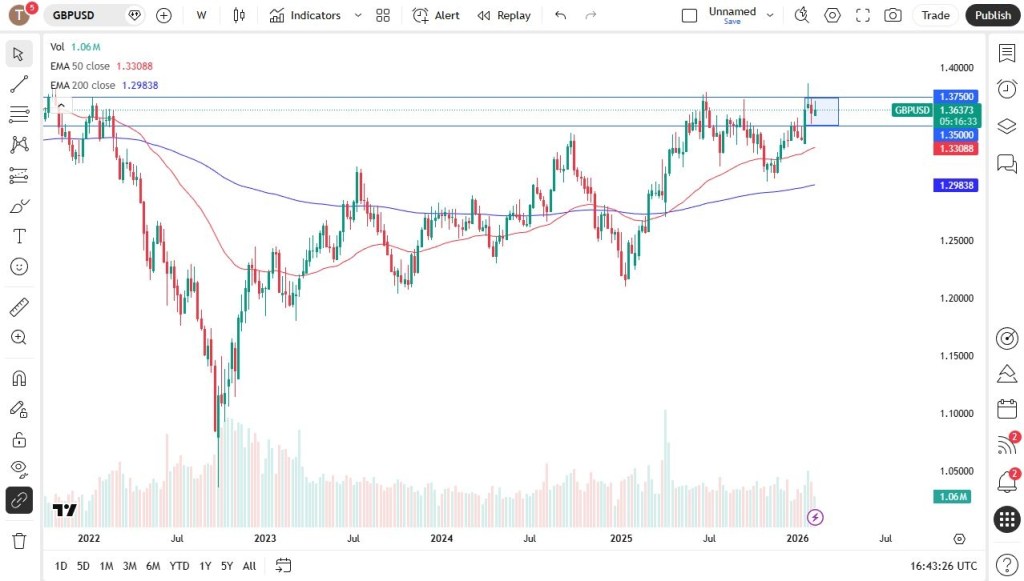
The U.S. dollar initially strengthened against the Canadian dollar over the course of the week, but has since pulled back and is now showing signs of indecision. This isn’t particularly surprising, given that the pair has been fluctuating within the same range for the past five weeks. Notably, the 1.3550 level continues to serve as solid support, while the 1.3750 area above remains a key resistance zone.
For longer-term traders, the prudent approach is likely to wait for a decisive breakout in either direction. In the meantime, short-term participants may keep trading the range, especially as the interest rate differential between the two currencies continues to narrow, encouraging back-and-forth price action.
EUR/USD
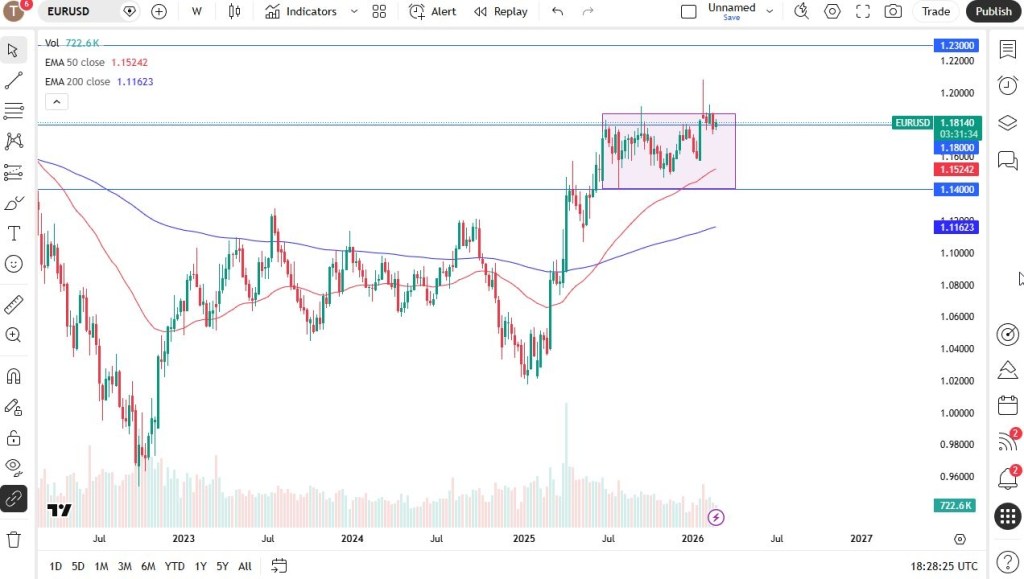
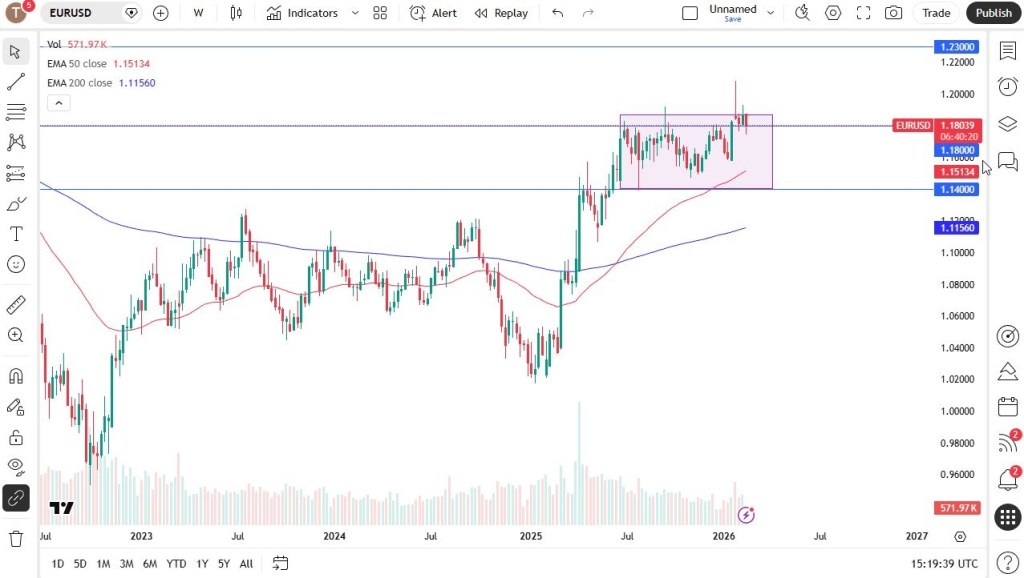
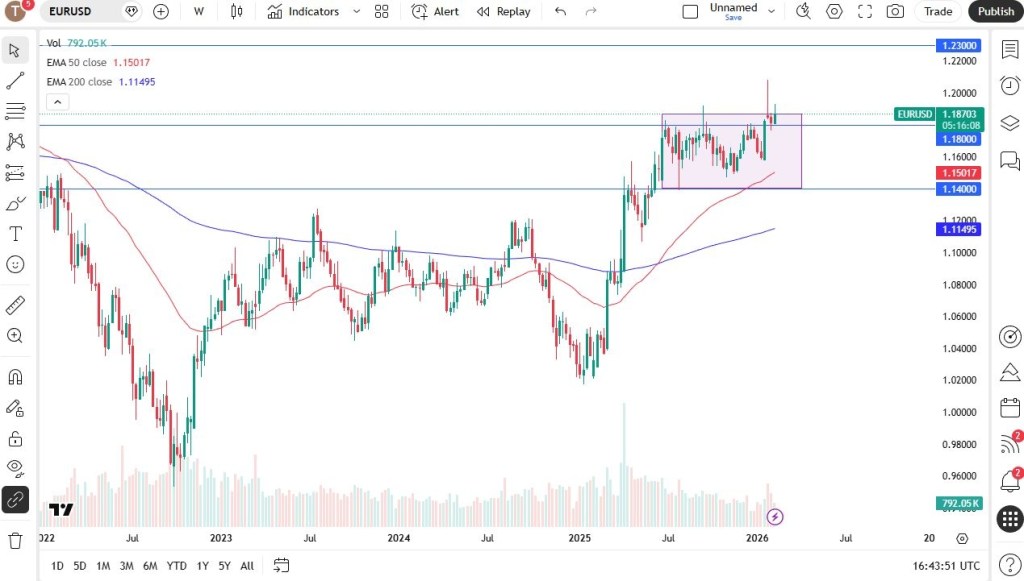
The euro has traded in a choppy, sideways manner throughout the week, much like the U.S. dollar against the Canadian dollar. The interest rate differential between the euro and the dollar is relatively modest, with the European Central Bank expected to hold rates steady while the Federal Reserve may move toward cutting them.
In this kind of environment, traders are searching for a catalyst to drive price in either direction. At the moment, the 1.18 level appears to be acting as a magnet, drawing price back toward it as the market struggles to establish a clear trend.
USD/MXN
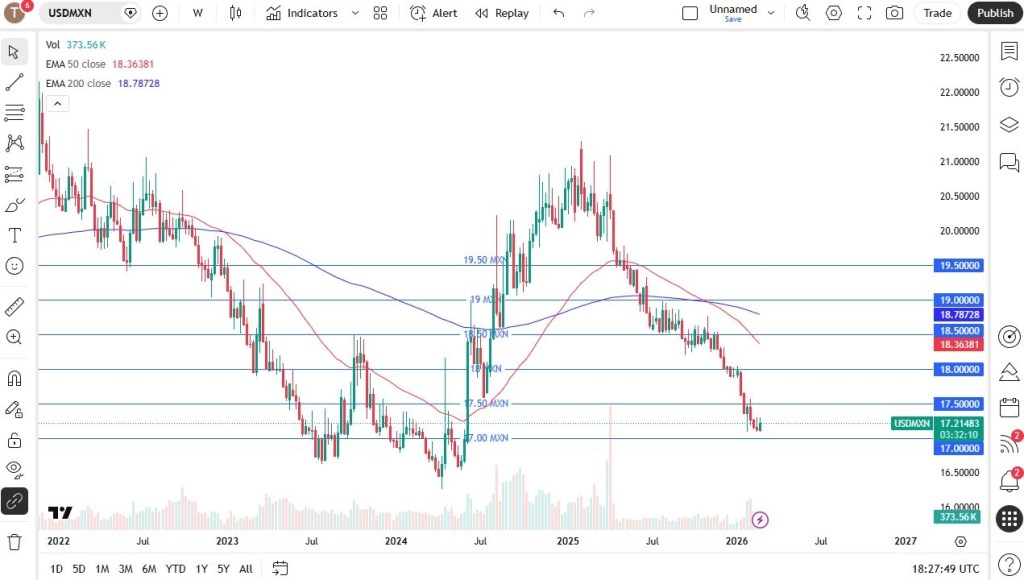
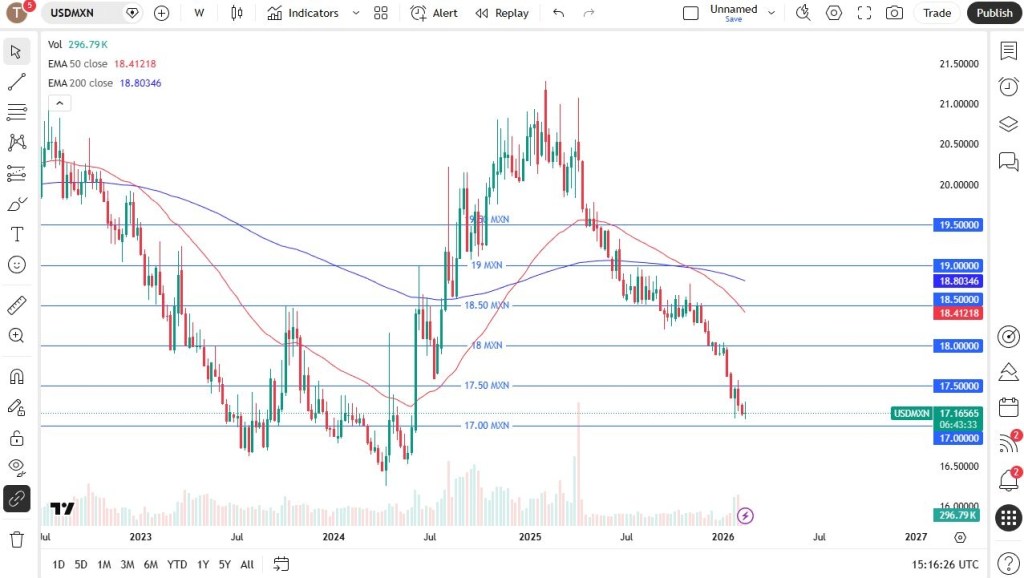
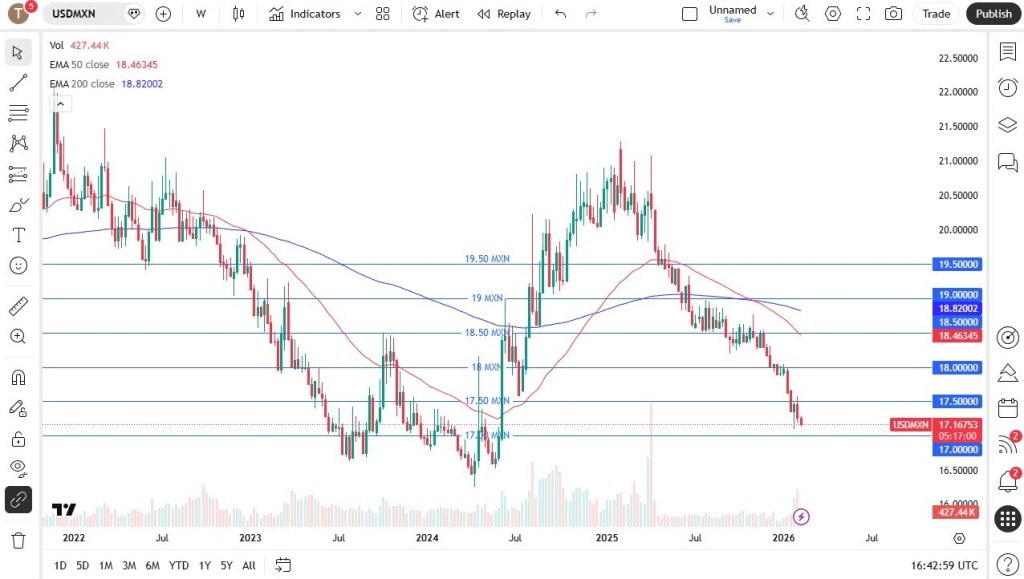
The U.S. dollar moved higher against the Mexican peso over the week, which isn’t particularly surprising given how sharply it had declined beforehand. If the pair continues to rebound, the 17.50 level is likely to attract selling pressure, making it a potential area to consider short positions.
A sustained break above 18.00 would be needed before entertaining the idea of a broader trend reversal. For now, the interest rate differential continues to favor the downside, so the pair is often used to collect positive swap. I rarely look to buy this market, though sharp upside moves can occur and prove highly profitable—typically driven by strong momentum or bouts of risk aversion, which tend to override the yield advantage.
BTC/USD
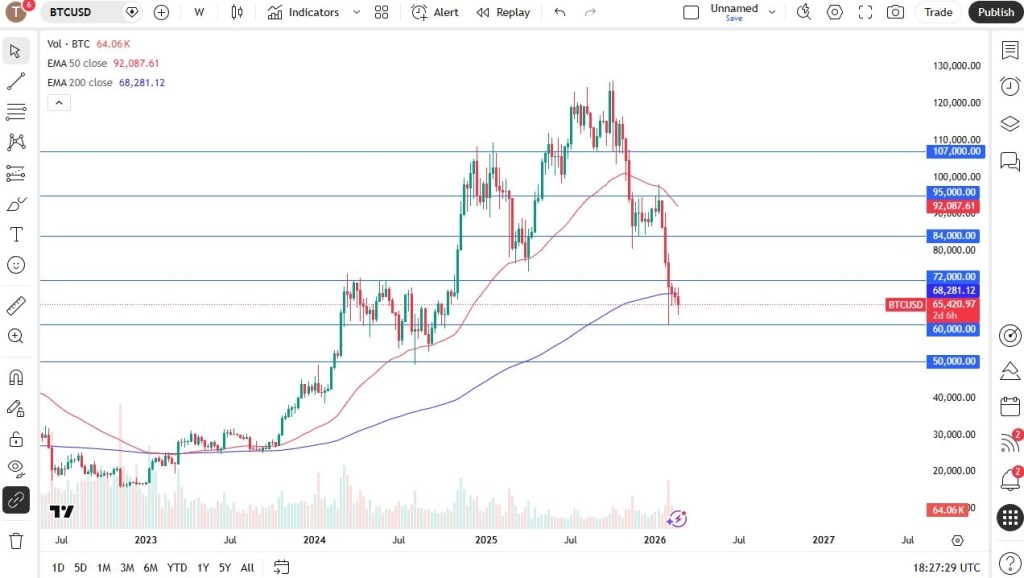
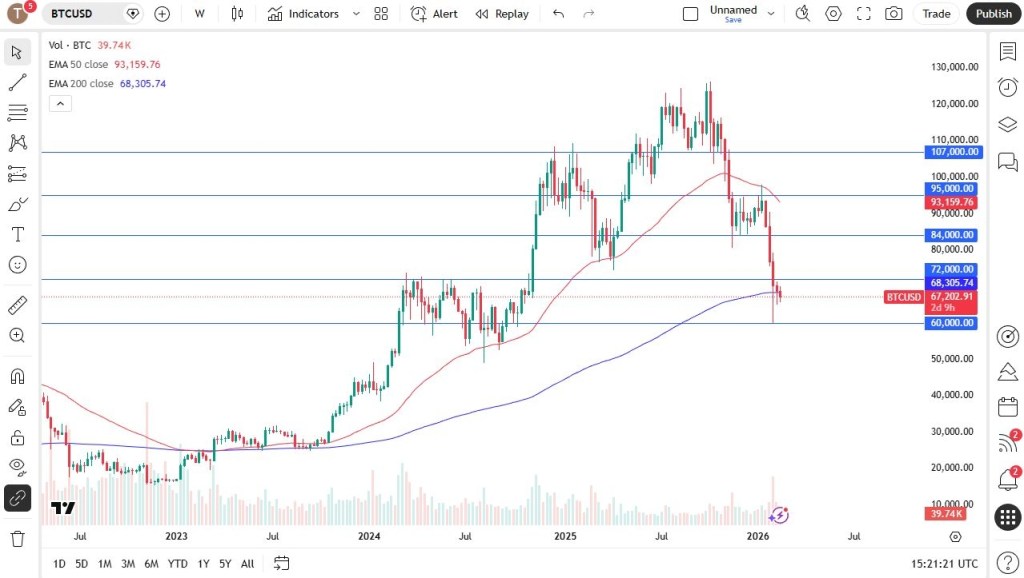
Bitcoin has been highly volatile throughout the week, with price action continuing to revolve around the $60,000 level. This area is drawing significant attention, as a decisive break below it could pave the way for a swift move toward the $50,000 region.
A break above the $72,000 level would open the door for a potential rally toward $84,000. However, at this stage, the more likely scenario appears to be continued sideways consolidation. In fact, the longer Bitcoin trades within a range and builds a base, the healthier the overall structure becomes, potentially setting the stage for a more sustainable move higher later on.
USD/JPY
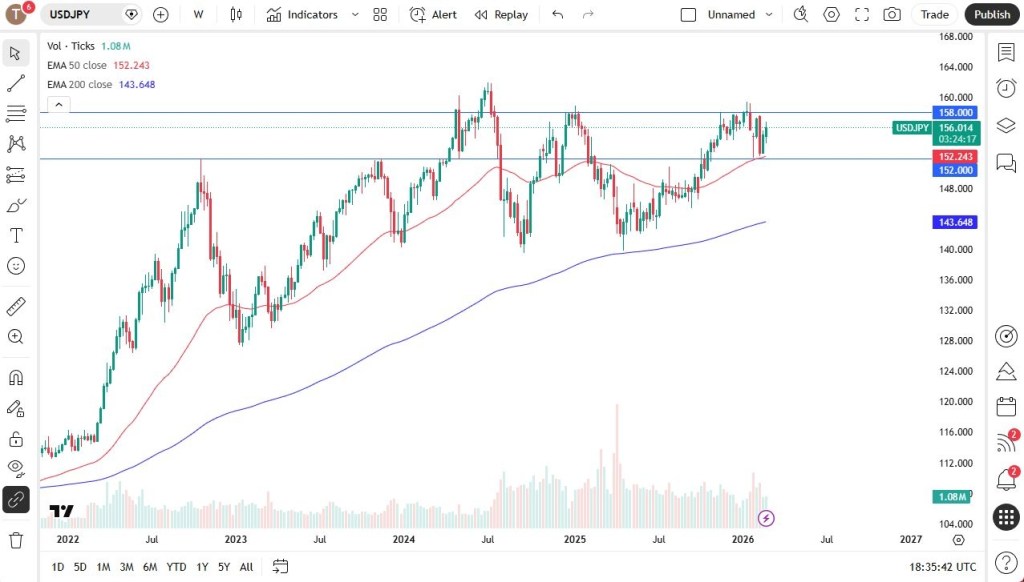
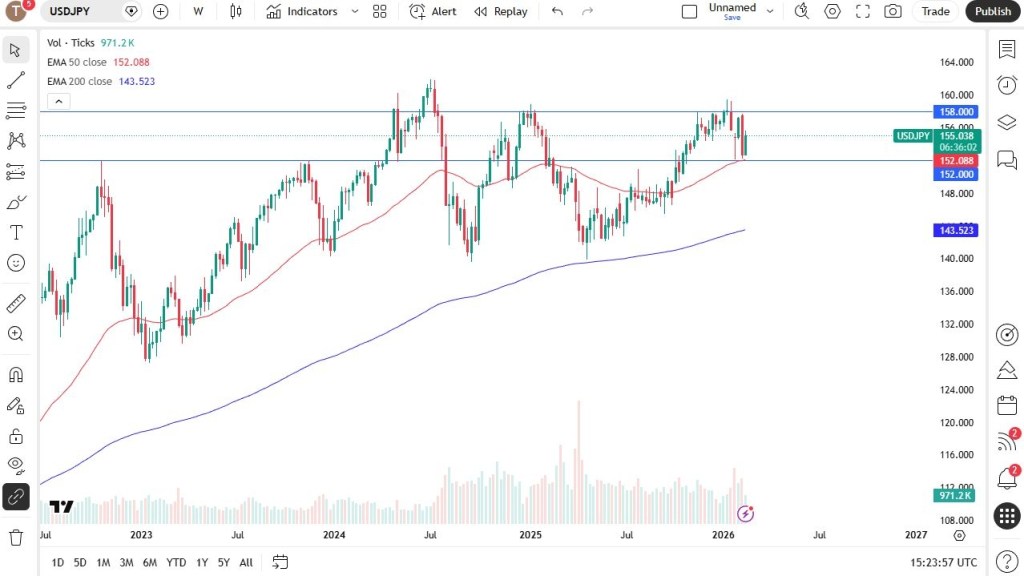
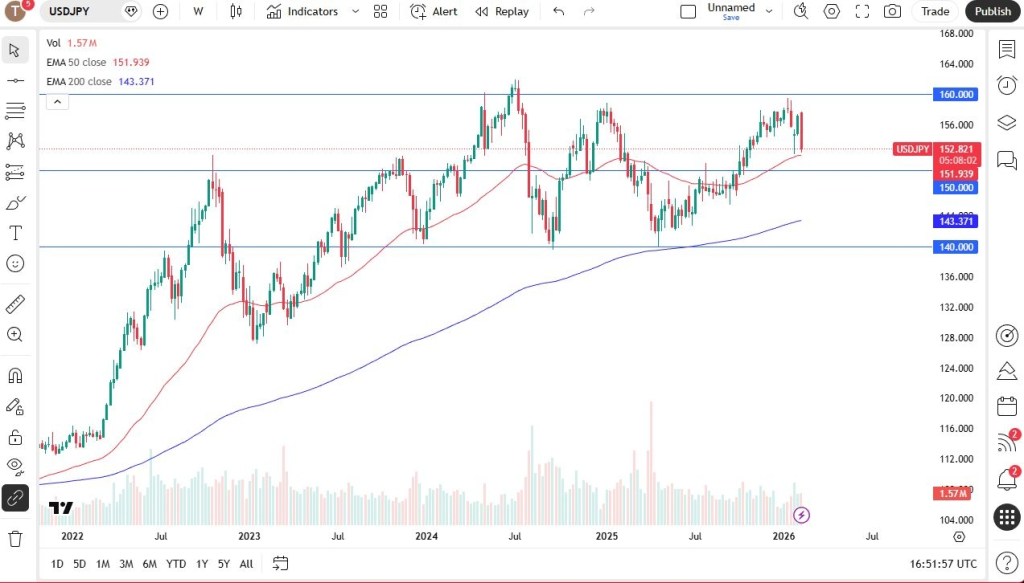
The U.S. dollar edged higher against the Japanese yen over the week, though the ¥158 level continues to act as resistance. At this point, traders seem to be searching for a catalyst strong enough to push the pair beyond the key ¥160 threshold.
A sustained move above ¥160 could trigger a significant rally, as that area marks the major swing high dating back to 1990. In the meantime, short-term pullbacks are likely to be viewed as buying opportunities, supported by the wide interest rate differential and Japan’s heavy debt burden, which limits the scope for materially higher domestic rates.
DAX
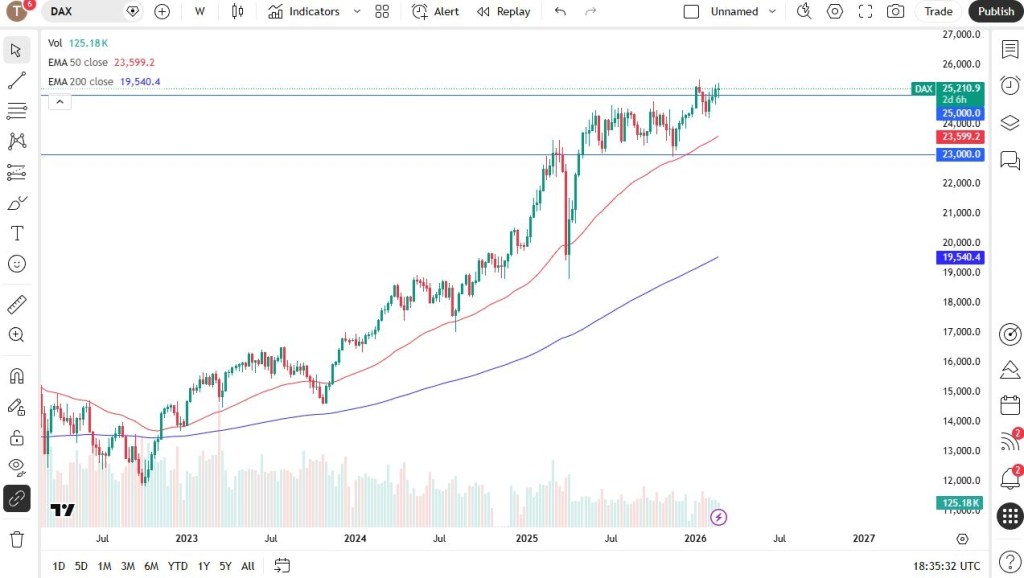
The German equity market has been somewhat erratic, with the DAX moving back and forth, though overall activity has been relatively subdued. The 25,000-euro level remains a key focus, as it represents a major round number with strong psychological significance. In the near term, minor pullbacks are likely to be viewed as buying opportunities.
There is also the potential for a push above the 25,400 level. A decisive breakout there could pave the way for a move toward the 27,000-euro region. At this stage, I have no interest in shorting the DAX, as the German economy appears to be supported by substantial government stimulus measures.
NASDAQ 100
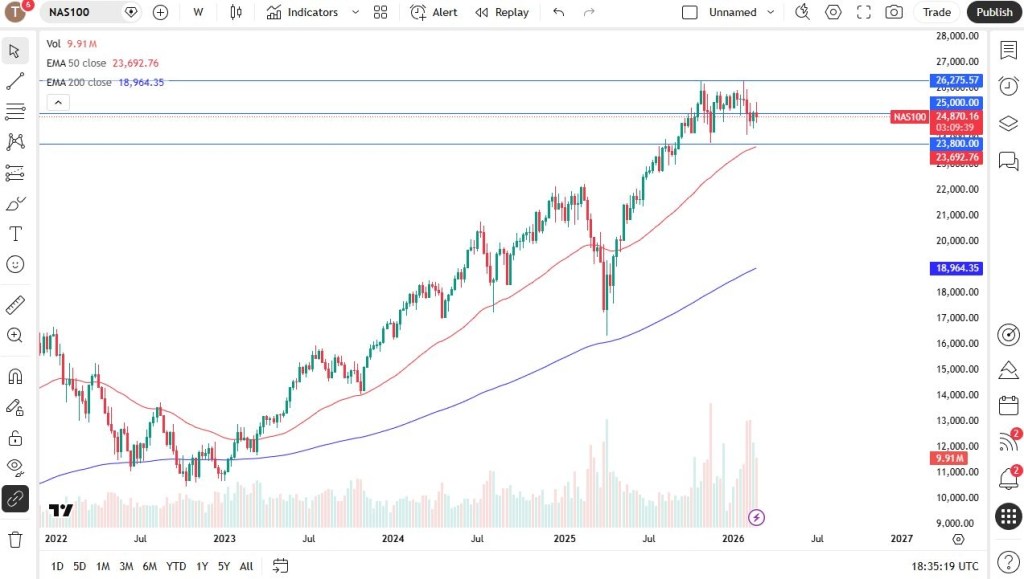
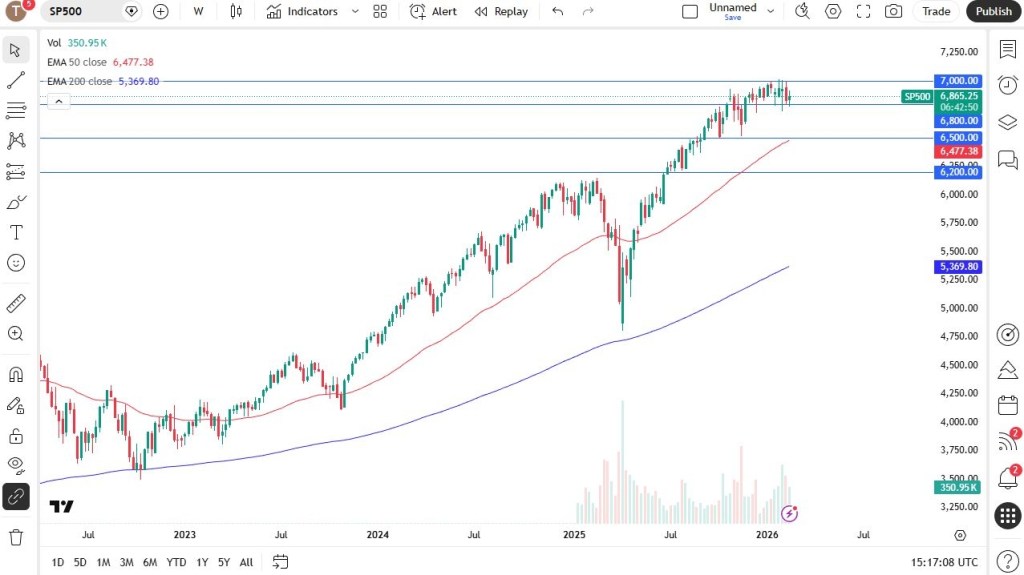
The Nasdaq 100 has experienced significant volatility throughout the week. Despite ongoing challenges and heavy selling pressure in major stocks such as Nvidia, the index is set to close the week in relatively steady shape. The 25,000 level remains a key focus, as it represents a major psychological milestone.
A decisive move above 25,000 could open the door to the 25,500 area, which may act as the next resistance barrier. Overall, the broader outlook remains constructive, with short-term pullbacks likely presenting buying opportunities.
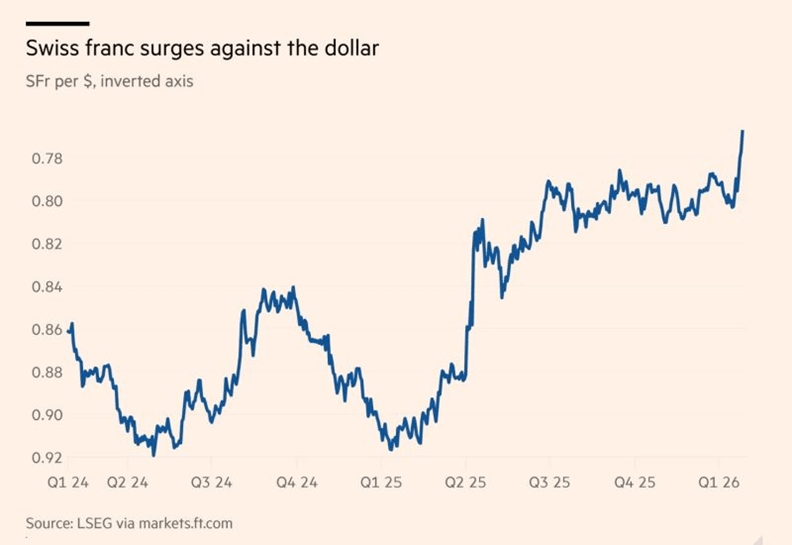
Meanwhile, the U.S. dollar has continued to weaken against the Swiss franc over the past week, making this currency pair one to monitor closely.
USD/CHF
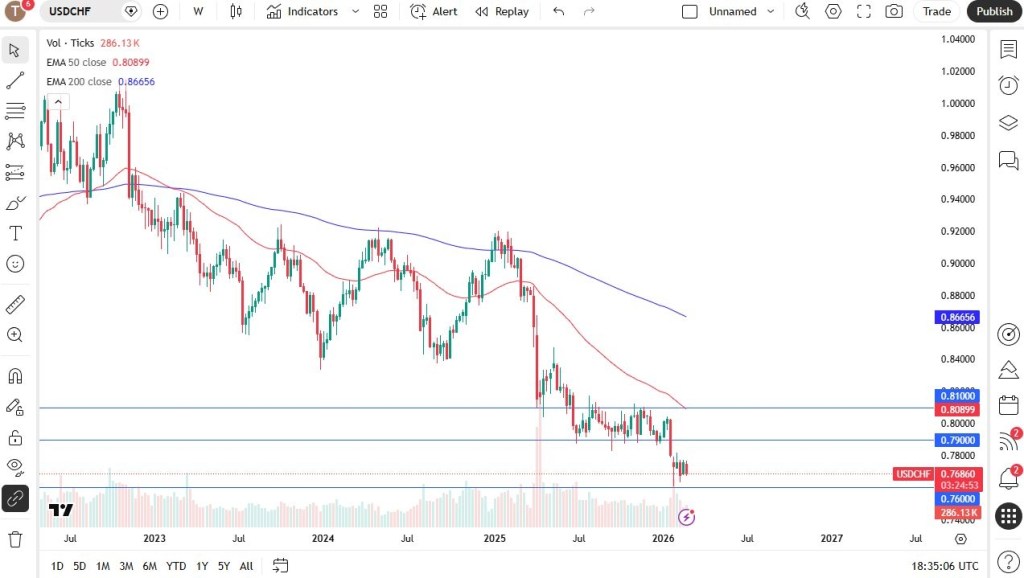
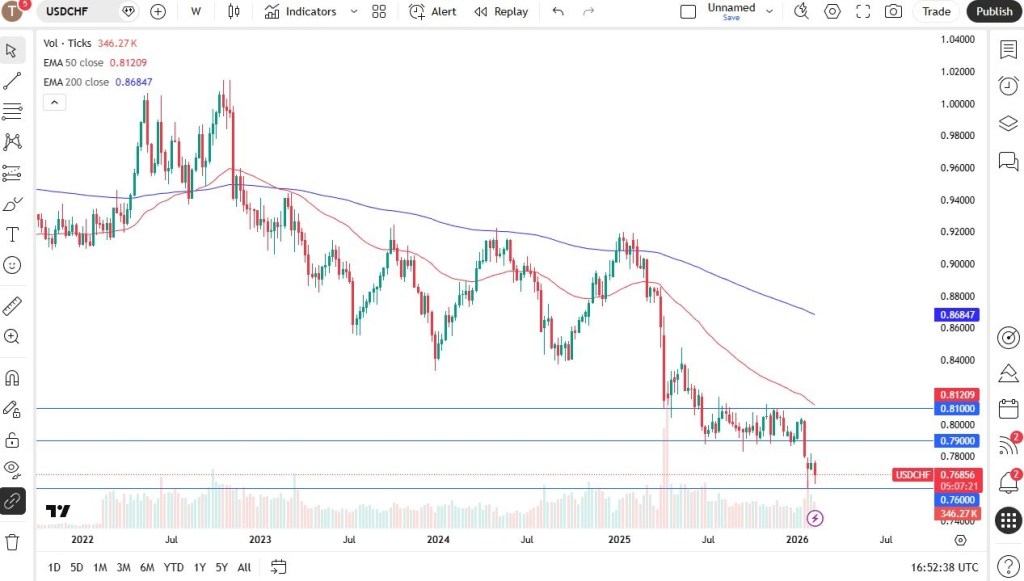
The U.S. dollar has edged lower against the Swiss franc over the past week, making the pair particularly important to monitor. Swiss officials have expressed concern about the franc’s strength, which adds another layer of sensitivity to current price movements.
The 0.76 level appears to be providing near-term support, and the market will be watching closely to see whether it holds. A breakdown below that area could open the way toward the 0.75 level. Over the longer term, there is a strong possibility that the Swiss National Bank may step in to curb further franc appreciation, though any intervention would more likely begin in the euro–Swiss franc pair rather than in USD/CHF itself.
Sources: Lewis