Tag: business

  • 3 Dividend Stocks That Could Fly Under the Radar in Volatile 2026 Markets

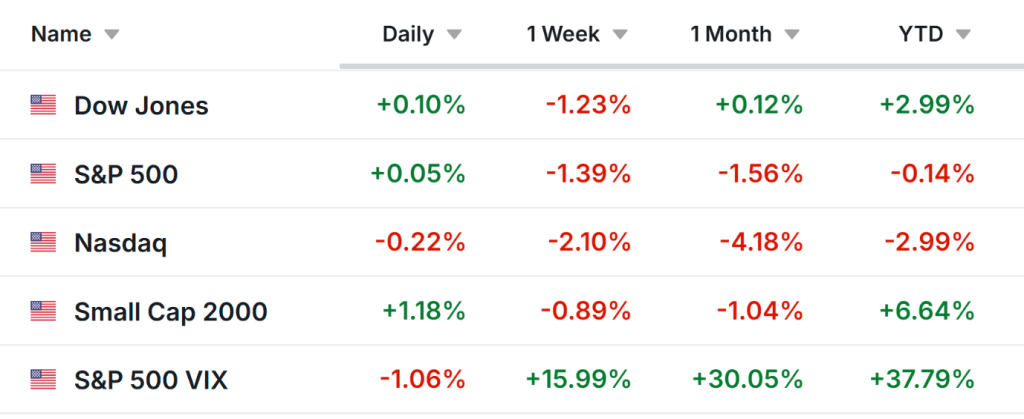
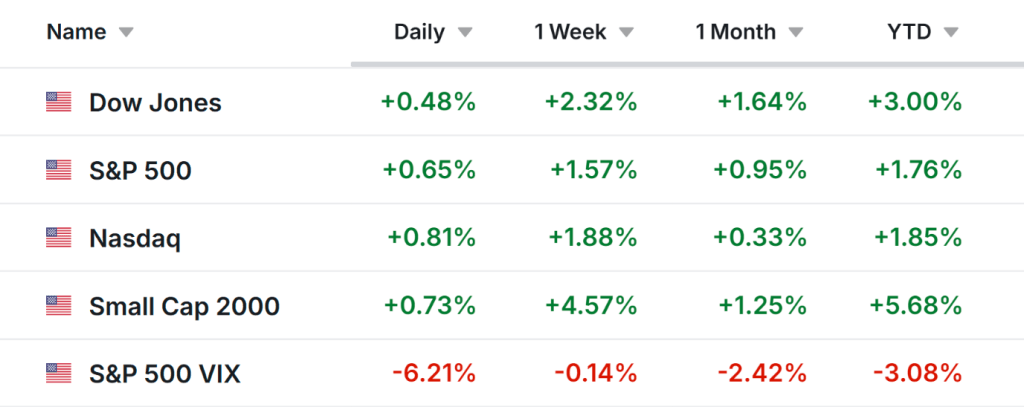
    Volatility in the S&P 500 has led to repeated swings without the steady upward momentum that characterized much of late 2025. With concerns about a potential correction—such as the bursting of an AI-driven bubble—investors may look toward more defensive options like dividend-paying stocks.

    That said, dividend investing spans a wide spectrum. While many gravitate toward globally recognized, ultra-stable companies favored by figures like Warren Buffett, lesser-known firms can sometimes offer both dependable income and greater growth potential. Three under-the-radar dividend payers worth noting are Hancock Whitney Corp., NewMarket Corp., and Horace Mann Educators Corp..

    A Well-Capitalized Southern Bank Gaining Momentum

    Hancock Whitney Corp. is a bank holding company best known in the Gulf South. Through Hancock Whitney Bank, it provides commercial and retail banking along with wealth management services.

    The company offers a solid 2.53% dividend yield and maintains a conservative payout ratio of 31.7%. In Q4 2025, earnings per share narrowly exceeded expectations by one cent, though revenue fell short.

    Looking ahead to 2026, several factors strengthen its outlook. The company recently completed a bond portfolio restructuring expected to lift net interest margin by about 7 basis points and boost annual EPS by roughly $0.23. Loan growth is improving, and a strong capital position supported share buybacks totaling about 3% of outstanding shares in Q4 alone. That same capital base reinforces dividend sustainability, making it appealing for risk-conscious investors.

    NewMarket: Resilient Income Despite Market Pressures

    NewMarket Corp., a specialty chemicals company focused on lubricants and petroleum additives, has seen its shares decline roughly 14% year to date following its latest earnings release.

    Lower net income and EPS in 2025—largely due to a higher effective tax rate—pressured results, while fourth-quarter petroleum additive shipments fell about 6% year over year amid softer demand.

    However, its specialty materials division has performed strongly, bolstered by the October acquisition of aerospace propellant firm Calca. The company plans to invest $1 billion to expand this segment further in 2026.

    Despite a Wall Street “Hold” rating, NewMarket continues generating strong cash flow. Last quarter alone, it returned $183 million to shareholders through dividends and buybacks. The stock yields 2.01%, carries a payout ratio just over 27%, and has consistently raised its dividend over multiple years.

    Horace Mann’s Broad Strength Supports Its Dividend

    Horace Mann Educators Corp., which provides retirement, property, and casualty insurance products tailored to U.S. school employees, has posted several strong quarters.

    Its latest results included a 3-cent EPS beat and record full-year EPS of $4.71. Forecasts for 2026 align with the company’s 10% compound annual growth target.

    Much of this improvement stems from its property and casualty segment, where both the combined ratio and core earnings improved significantly—more than doubling last year. Growth in individual supplemental and group sales has further diversified the business.

    An early retirement initiative is expected to generate $10 million in annual savings, helping the company reduce its expense ratio by 100–150 basis points over the next three years. This should enhance cash flow for additional buybacks—after $21 million in repurchases in 2025—and continued dividend support. The stock currently offers a 3.25% yield with a 35.9% payout ratio.

    In a market environment marked by uneven performance, these lesser-known dividend stocks combine income stability with strategic growth initiatives, making them compelling options for investors navigating potential turbulence in 2026.

    Sources: Nathan Reiff

  • Top Pick and Stock to Avoid This Week: Analog Devices and Walmart

    The upcoming holiday-shortened trading week will spotlight the Federal Reserve’s FOMC minutes and Walmart’s earnings report.

    Analog Devices enters its earnings release with Wall Street projecting a strong 41% increase in EPS alongside 28% revenue growth. Meanwhile, Walmart may face downside risk, as expectations appear stretched and the stock looks “priced for perfection” ahead of results.

    On Friday, U.S. equities finished largely flat as investors digested softer-than-expected inflation data, reinforcing expectations that the Federal Reserve remains on course to cut interest rates this year.

    Despite the muted close, major indexes posted weekly losses. Concerns over AI-driven disruption extended beyond technology shares, weighing on brokerages, commercial real estate companies, and logistics firms.

    The S&P 500 declined 1.4%, marking its second straight weekly drop. The Dow Jones Industrial Average lost 1.2%, while the Nasdaq Composite slid 2.1%, notching its fifth consecutive weekly loss — its longest downturn since May 2022.

    The week ahead is shaping up to be active as investors continue evaluating the outlook for growth, inflation, and monetary policy. U.S. markets will be closed Monday in observance of Presidents Day.

    With limited economic data on the calendar, attention will center on the minutes from the Fed’s January FOMC meeting, which could provide further clues on the interest-rate trajectory. Friday will also bring the release of the latest core PCE price index, a key inflation gauge.

    As of Sunday morning, markets are pricing in two 25-basis-point rate cuts by the end of 2026, with about a 50% probability of an additional reduction, according to Investing.com’s Fed Monitor Tool.

    On the corporate front, Walmart’s earnings will headline the final stretch of reporting season. Other notable reports due include Deere, Palo Alto Networks, and Toll Brothers.

    Investors are also awaiting a U.S. Supreme Court decision expected Friday regarding the legality of President Donald Trump’s global tariffs.

    Regardless of market direction, below are one stock that could attract buying interest and another that may face renewed selling pressure in the week of Monday, February 16 through Friday, February 20.

    Stock to Buy: Analog Devices

    Analog Devices (NASDAQ: ADI) remains well-positioned at the center of the industrial semiconductor recovery. The company is set to release its fiscal first-quarter results on Wednesday at 7:00 a.m. ET, with analysts forecasting a 41% jump in earnings per share and 28% revenue growth, driven by accelerating demand in robotics, automation, and AI-related infrastructure.

    Sentiment heading into the report has been increasingly upbeat. InvestingPro data shows that 23 of the past 25 EPS revisions have been upward, reflecting rising confidence in the company’s growth trajectory. In the options market, traders are pricing in a potential post-earnings swing of approximately ±4.2%.

    Analog Devices continues to benefit from long-term structural themes, including electrification, factory automation, and data-center expansion. Following prior inventory adjustments, recent quarters have demonstrated a solid rebound, supported by strong free cash flow generation that underpins dividends and share repurchases.

    Technically, ADI has maintained a firm uptrend, recently reaching highs near $344 before experiencing a modest pullback. The stock remains comfortably above key moving averages and is showing relative strength versus the broader market. Immediate support lies in the $325–$330 range, while resistance stands near its record high around $344.

    Across multiple timeframes, indicators point to strong bullish momentum. If earnings meet or exceed expectations, the technical setup suggests the potential for a breakout move.

    Trade Setup:

    • Entry: Near current levels (~$337)
    • Target: $350–$360 (approximately 4%–7% upside)
    • Stop-Loss: $325 (around 3.5% downside risk)

    Stock to Sell: Walmart

    Walmart (NASDAQ: WMT) has just crossed the historic $1 trillion market cap milestone and is set to release earnings Thursday at 7:00 AM ET. Fundamentally, the company remains strong: it’s expanding grocery market share, scaling its high-margin advertising segment, and leveraging AI to improve efficiency.

    However, valuation is the key concern. With a forward P/E of 50.6x, the stock appears priced for flawless execution. That leaves minimal margin for disappointment. Even a slight miss in forward guidance could spark a notable pullback as expectations reset. Options markets are implying a post-earnings swing of just over 8 points in either direction.

    Wall Street expects EPS of $0.73 (around 10% year-over-year growth) on roughly $190 billion in revenue. This will be the first earnings report under new CEO John Furner, adding another layer of scrutiny. Analyst sentiment has turned more cautious recently, with more than half of the latest estimate revisions skewing lower.

    Oppenheimer anticipates solid results but cautions that guidance may underwhelm—similar to last year’s Q4 report, when the stock dropped about 8%. Jefferies notes that Walmart benefits from price normalization and tighter consumer spending, but much of that optimism seems fully reflected in the share price.

    After a sharp rally to fresh record highs in the $134–$135 range, momentum appears stretched. Short-term technical indicators, including RSI, signal overbought conditions. Buying volume has begun to fade, and a negative surprise could push shares back toward support near $125.

    Trade Idea

    • Entry: Around $133–$134
    • Target: $125–$128 (approximately 7% downside)
    • Stop-Loss: $136 (around 2.5% risk)

    Sources: Jesse Cohen

  • U.S. stock futures edged up as investors awaited the postponed employment report.

    U.S. equity futures moved slightly higher Tuesday night following a modest decline in the regular trading session, as investors assessed softer retail sales figures and looked ahead to a series of postponed U.S. economic reports due later in the week.

    By 20:11 ET (01:11 GMT), S&P 500 futures rose 0.2% to 6,978.25, Nasdaq 100 futures advanced 0.3% to 25,291.75, and Dow Jones futures added 0.2% to 50,385.0.

    Wall Street declined ahead of the upcoming jobs report, while the Dow posted a fresh record closing high.

    During Tuesday’s regular session, the S&P 500 declined 0.3% and the Nasdaq Composite dropped 0.6%, pressured by losses in technology and other growth-oriented stocks.

    In contrast, the Dow Jones Industrial Average managed a slight advance, closing above the 50,000 mark at a new record high for the third consecutive session.

    Earlier, investors reacted to U.S. retail sales figures showing flat monthly consumer spending, missing expectations. The softer data fueled worries that elevated borrowing costs may be starting to curb household demand, despite broader signs of economic resilience. This strengthened expectations that the Federal Reserve could move toward rate cuts later this year if growth continues to ease.

    Attention now shifts to the delayed monthly employment report, set for release Wednesday following the recent government shutdown. The data will offer the first detailed snapshot of labor market conditions in weeks, as policymakers monitor for indications of cooling.

    Markets are also awaiting the postponed U.S. consumer price index report on Friday, which could play a pivotal role in shaping near-term market sentiment.

    Robinhood and Lyft slide in after-hours trading.

    In company-specific developments, Robinhood Markets (NASDAQ: HOOD) fell 7.5% in after-hours trading after posting earnings that came in below expectations, as weaker-than-anticipated revenue and user figures pressured the stock.

    Shares of Lyft (NASDAQ: LYFT) plunged more than 17% in extended trading after the ride-hailing firm reported results that missed forecasts, further weighing on consumer-focused tech stocks.

    Meanwhile, Ford Motor Company (NYSE: F) delivered quarterly earnings that fell short of Wall Street estimates, citing costs related to its electric vehicle operations and ongoing supply chain challenges. Despite the miss, the automaker projected improved earnings in 2026. Ford shares rose 0.5% in after-hours trading.

    Sources: Ayushman Ojha

  • Asian stocks rallied, with the Nikkei surging past 57,000 after Takaichi’s election victory.

    Most Asian markets climbed sharply on Monday, tracking Wall Street’s tech-led rebound, while Japanese shares jumped to record highs after Prime Minister Sanae Takaichi’s coalition won a decisive lower-house victory. Risk sentiment improved across the region following Friday’s strong U.S. rebound from AI-driven losses, with U.S. stock futures also edging higher in Asian trade.

    Nikkei tops 57,000 following Takaichi’s election victory

    Japan’s Nikkei 225 jumped as much as 5.6% to a new record of 57,337.07, supported by improved political certainty after Prime Minister Sanae Takaichi’s coalition won a commanding majority in Sunday’s lower-house election. The broader TOPIX index also surged 3.4% to an all-time high of 3,825.67.

    Analysts said the decisive victory gives Takaichi greater latitude to push through policy initiatives, with markets anticipating higher public spending, tax incentives, and measures to lift wages and corporate investment, alongside continued backing for key sectors such as technology, defense, and energy. While the outcome is seen as positive for Japanese equities, it is expected to pressure government bonds and the yen.

    Asian tech stocks jump, with South Korea’s KOSPI surging nearly 5%

    Asian tech stocks rallied at the start of the week, supported by gains in U.S. chipmakers and AI-linked shares. South Korea’s KOSPI surged nearly 5%, rebounding from sharp losses, as Samsung Electronics jumped more than 5% on reports it will begin mass production of HBM4 chips later this month, while SK Hynix also climbed over 5%.

    Elsewhere, Hong Kong’s Hang Seng rose 2% with the tech subindex up 1.5%, while China’s CSI 300 and Shanghai Composite gained 1.3% each. Australia’s ASX 200 advanced 2%, Singapore’s STI added 1%, and India’s Nifty 50 futures edged higher. Despite the rebound, investors remain cautious amid recent volatility in tech stocks and ahead of key U.S. jobs and inflation data due later this week.

    Sources: Ayushman Ojha

  • Qualcomm Returns to Its 2020 Price Levels — Red Flag or Buying Chance?

    After posting disappointing earnings after the market closed on February 4, Qualcomm (NASDAQ: QCOM) left investors questioning what has gone wrong. The stock has since fallen below $140, down from $185 just a month ago—a sharp decline in a short time, capped by a steep selloff following Thursday morning’s earnings reaction.

    Most notably, Qualcomm has now erased all the gains it painstakingly built over the past two years. The stock has fallen back to its 2020 levels—an unsettling spot for a company that has consistently positioned itself as a semiconductor player well placed to benefit from the AI boom.

    Heading into earnings with already fragile sentiment, Qualcomm’s Q1 results did little to reinforce confidence in its long-term story. (Qualcomm’s fiscal year runs ahead of the calendar year.) While the headline figures stopped short of a major miss, management’s downbeat forward guidance was enough to spark another sharp deterioration in investor sentiment. That said, does this selloff present an opportunity for risk-tolerant investors, or was the pessimistic outlook a warning that’s simply too loud to dismiss? Let’s dig in.

    Why Long-Term Investors Should Take This as a Red Flag

    The key concern raised by the latest report is what it reveals about Qualcomm’s underlying structural headwinds. Management cited continued industry pressures stemming from memory supply limitations and weaker handset demand. While these challenges are not exclusive to Qualcomm, they carry greater weight given the company’s ongoing reliance on smartphones, despite its efforts to diversify. Automotive, Internet of Things (IoT), and licensing are still presented as growth drivers, but so far they have not been sufficient to counterbalance downturns in the core business when market conditions weaken.

    This is significant because Qualcomm has a history of failing to sustain upside momentum. Each time enthusiasm builds around a rally or its diversification story, the stock has ultimately reversed course, and the latest selloff aligns uncomfortably well with that pattern. As a result, the market is once again justified in questioning whether Qualcomm can generate lasting growth rather than short-lived recoveries.

    Analyst sentiment has also clearly deteriorated. In response to the earnings release, several firms reiterated neutral ratings or downgraded their outlooks. In some instances, the commentary turned explicitly bearish, with HSBC noting that it may be “difficult to forecast a potential bottom.”

    The consequence is a meaningful erosion of credibility. Long-term shareholders who endured multiple cycles are now faced with a stock that has delivered little progress over the past five years, despite repeated assurances of strategic transformation. Viewed through that lens, this earnings report appears less like a reset and more like a clear warning sign.

    Where Short-Term Traders May Spot an Opportunity

    That said, while the long-term outlook appears impaired, the near-term technical picture may be telling a different story. The speed and severity of the selloff have driven Qualcomm into deeply oversold territory, with momentum indicators reaching extremes rarely seen over the past decade. While this does not guarantee a sustained recovery, it does raise the likelihood of a sharp relief bounce, particularly as selling pressure begins to fade.

    There are already tentative signs of this process taking shape. After opening sharply lower in the session following earnings, the stock began to find support by the afternoon. How this behavior develops in the days ahead will be worth watching.

    Even among analysts who have adopted a more cautious stance, many updated price targets still sit well above current levels. Bank of America, for instance, maintains a $155 target, while Cantor Fitzgerald sees value up to $160. Rosenblatt went a step further, reiterating its Buy rating with a $190 price target.

    Whether those targets are ultimately justified over the coming year remains open to debate, but in the near term, they support the notion that bearish sentiment may have become stretched.

    How to Approach the Current Setup

    The crucial point is to clearly distinguish between investing and trading. From a long-term investment perspective, this report surfaces some uncomfortable issues. Until Qualcomm demonstrates an ability to deliver consistent growth and maintain its gains, a cautious and patient approach is justified.

    For short-term traders, however, the setup looks different. Deeply oversold conditions, sharp price swings, and widespread pessimism can create conditions where relief rallies are swift and potentially lucrative—provided risk is managed carefully.

    Sources: Sam Quirke

  • Growing Tensions Rock the Software Industry

    The brief sense of relief following the easing selloff in metals quickly faded after news emerged that Anthropic—an AI startup backed by Amazon and Google—had launched a new AI tool capable of performing legal and research tasks traditionally handled via paid databases. The announcement rattled markets, sparking fears that AI-driven disruption is accelerating and threatening the core business models of software firms that provide data analytics and decision-support tools to law firms, banks, and corporations.

    The result was a renewed bout of panic selling, particularly across software stocks. In Europe, RELX and London Stock Exchange Group plunged 14% and 12% respectively, while Thomson Reuters dropped 15%. Experian, Pearson, and Sage were also caught in the downdraft. In the US, shares of FactSet, Salesforce, and Adobe fell sharply, with Adobe sliding to its lowest level in nearly six years as concerns mounted that AI competition could severely undermine parts of its core business. Even tech heavyweights were not spared: Microsoft declined 2.87% and is now roughly 25% below its November peak.

    Broader technology markets also weakened. VanEck’s Semiconductor ETF fell 2.5%, while Google—despite being one of the leading AI beneficiaries—slipped 1.22% after recently hitting a record high. The selloff spilled into Asia as well, with Tencent down around 3%. South Korea’s Kospi, however, largely avoided the turmoil, supported by continued strength in Samsung Electronics and SK Hynix amid tight memory supply and strong pricing power.

    On the earnings front, AMD reported a solid beat, posting revenue above $10 billion and adjusted EPS of $1.53, both exceeding expectations. Growth was driven by robust demand for data-center and AI products, alongside solid performance in PCs and gaming. Despite impressive figures—including 39% growth in data-center revenue and 34% growth in PCs—and an upbeat message from CEO Lisa Su, the company’s outlook failed to meet elevated market expectations. AMD shares fell roughly 8% in after-hours trading.

    Nasdaq futures are modestly lower at the time of writing, suggesting no immediate intensification of the software-led selloff. Still, recent earnings reactions highlight a broader issue: even companies delivering strong results are being punished, as investors demand ever-higher performance to justify stretched valuations.

    Attention now turns to upcoming earnings from Google and Qualcomm later today, with Amazon reporting after Thursday’s close. By week’s end, markets may have a clearer picture of where the AI trade is headed. So far, enthusiasm has been muted—Meta, for instance, failed to sustain its post-earnings rally despite AI-driven revenue growth.

    It increasingly appears that the AI rally is being unwound, largely irrespective of earnings strength.

    Elsewhere, geopolitical tensions between the US and Iran escalated after reports that the US Navy shot down an Iranian drone approaching a US aircraft carrier in the Arabian Sea. That development pushed US crude prices up about 2.4%, with prices now consolidating just below $64 per barrel. While geopolitically driven spikes can offer short-term trading opportunities, risks remain skewed to the upside given the fragile situation.

    Zooming out, gold has climbed back above $5,000 per ounce. In the past, this might have signaled a classic flight to safety amid equity volatility and geopolitical stress. Today, however, it is less clear whether this reflects genuine risk aversion or a rapid rotation from one crowded trade—AI—into another—metals.

    Safe-haven options appear increasingly constrained. Gold remains volatile, US 10-year yields are elevated amid debt concerns and potential further Fed balance-sheet tightening, and the Japanese yen continues to struggle. USDJPY is testing its 50-day moving average near 156.30 and could push higher ahead of the weekend’s snap election. That leaves the Swiss franc, with USDCHF encountering resistance near 0.78. Meanwhile, EURUSD is gradually recovering after holding support near 1.1780, while sterling is consolidating above 1.37.

    Both moves are largely driven by dollar dynamics. The dollar index has come under renewed pressure ahead of US labor data, though the Bureau of Labor Statistics has announced it will not release payroll figures this Friday due to a partial government shutdown. As a result, today’s ADP report takes on added significance and is expected to show roughly 46,000 private-sector job gains—a weak figure that would reinforce the view that US economic strength remains narrowly concentrated in AI-related investment rather than broad-based growth. This two-speed economy complicates the Fed’s policy outlook.

    Soft labor data would likely support a more dovish Federal Reserve stance, which—absent policy shifts from the ECB or the Bank of England—could further bolster the euro and sterling against the dollar. I continue to expect EURUSD to move back toward, and ultimately above, the 1.20 level.

    Sources: Ipek Ozkardeskaya

  • Australian dollar steady after China services PMI release

    • The Australian dollar strengthened after the Composite PMI surged to 55.7 in January, marking the fastest pace of expansion in nearly four years.
    • The Aussie also benefited as markets priced in an 80% probability of an interest rate hike in May, along with around 40 basis points of additional policy tightening.
    • Meanwhile, the U.S. dollar remained subdued for a second straight session.

    The Australian dollar strengthened against the U.S. dollar on Wednesday, extending gains of more than 1% from the previous session. The AUD/USD pair held firm after China’s Services Purchasing Managers’ Index (PMI) rose to 52.3 in January from 52.0 in December, beating market expectations of 51.8. As China is Australia’s largest trading partner, improvements in Chinese economic activity tend to support the Aussie.

    The AUD also drew support from upbeat domestic PMI data. Seasonally adjusted figures from S&P Global showed Australia’s Composite PMI climbed to 55.7 in January from 51.0 in December, marking the strongest expansion in 45 months. The Services PMI jumped to 56.3 from 51.1, its highest reading since February 2022, exceeding the flash estimate of 56.0 and remaining well above the 50.0 threshold. This extended the run of expansion in services activity to two years.

    The Reserve Bank of Australia raised its Official Cash Rate by 25 basis points to 3.85% on Tuesday, pointing to stronger-than-expected economic growth and persistently elevated inflation. As the tightening cycle gathers momentum, markets have increased the odds of another rate hike in May to around 80% and are now pricing in roughly 40 basis points of additional tightening through the rest of the year.

    Speaking at the post-meeting press conference, RBA Governor Michele Bullock said inflationary pressures remain uncomfortably high, warning that a return to the target range will take longer than previously expected and is no longer acceptable. She emphasized that the board will remain data-dependent and avoid providing forward guidance.

    U.S. dollar little changed after recent losses

    The U.S. Dollar Index (DXY), which tracks the greenback against six major currencies, remained subdued for a second straight session, trading near 97.40 at the time of writing.

    Data released on Monday showed an unexpected rebound in U.S. manufacturing activity, underscoring economic resilience. The ISM Manufacturing PMI rose to 52.6 in January from 47.9 in December, comfortably beating expectations of 48.5.

    Markets have also been assessing President Donald Trump’s nomination of Kevin Warsh as the next Federal Reserve chair, a move widely interpreted as signaling a more disciplined and cautious approach to monetary easing. The dollar found some support earlier as risk sentiment improved after the U.S. Senate reached an agreement to advance a government funding package, averting a shutdown, according to Politico.

    Producer-side inflation in the U.S. remained firm, reinforcing the Fed’s policy stance. Headline PPI held steady at 3.0% year-over-year in December, unchanged from November and above expectations for a slowdown to 2.7%. Core PPI, which excludes food and energy, accelerated to 3.3% from 3.0%, defying forecasts for a decline to 2.9% and highlighting persistent upstream price pressures.

    Fed officials struck a cautious tone. St. Louis Fed President Alberto Musalem said additional rate cuts are not warranted at this stage, describing the current 3.50%–3.75% policy rate range as broadly neutral. Atlanta Fed President Raphael Bostic echoed this view, urging patience and arguing that policy should remain modestly restrictive.

    In Australia, inflation data showed mixed signals. The RBA’s trimmed mean inflation rose 0.2% month-over-month and 3.3% year-over-year, while the monthly CPI jumped 1.0% in December, exceeding forecasts of 0.7%. Export prices climbed 3.2% quarter-on-quarter in Q4 2025—the first increase in three quarters and the strongest gain in a year—while import prices rose 0.9%, beating expectations for a decline.

    China’s RatingDog Manufacturing PMI edged up to 50.3 in January from 50.1 in December, in line with expectations and marking the fastest pace of factory expansion since October.

    Additional Australian indicators pointed to easing inflation momentum and improving labor demand. The TD-MI Inflation Gauge rose 3.6% year-over-year in January, while monthly inflation increased just 0.2%, the weakest pace since August. Meanwhile, ANZ Job Advertisements surged 4.4% month-over-month in December, posting the strongest increase since February 2022 and signaling renewed momentum in hiring toward year-end.

    Australian dollar rebounds toward three-year highs near 0.7100

    The AUD/USD pair was trading near 0.7030 on Wednesday. Analysis of the daily chart shows the pair remains within an ascending channel, pointing to a sustained bullish bias. The 14-day Relative Strength Index (RSI) stands at 73.30, signaling strong upward momentum, though conditions appear increasingly stretched.

    AUD/USD recently rebounded toward 0.7094, its highest level since February 2023, reached on January 29. A decisive break above this resistance could open the way for a move toward the upper boundary of the ascending channel around 0.7210. On the downside, initial support is seen at the nine-day Exponential Moving Average (EMA) near 0.6964, which coincides with the channel’s lower boundary. A deeper pullback could bring the 50-day EMA at 0.6759 into focus.

    AUD/USD: Daily Chart

    Sources: Akhtar Faruqui

  • One Stock to Buy and One to Sell This Week: Alphabet and Strategy

    The U.S. jobs report, ISM PMI data, and another round of AI-driven tech earnings will be in the spotlight this week. Alphabet is poised to deliver robust results and upbeat guidance, making it an attractive buy. Meanwhile, Strategy heads into a difficult week as Bitcoin volatility and concerns over its BTC holdings weigh on the stock.

    Wall Street stocks closed lower on Friday after President Donald Trump nominated former Federal Reserve Governor Kevin Warsh as the next Fed chair. Sharp sell-offs in gold and silver prices further unsettled markets.

    Despite Friday’s pullback, the major U.S. stock indexes ended the month higher. The Dow Jones Industrial Average and the S&P 500 posted January gains of 1.1% and 1.2%, respectively, while the Nasdaq Composite rose 1%. Small caps outperformed, with the Russell 2000 climbing more than 4% for the month.

    Volatility may pick up in the days ahead as investors weigh the outlook for economic growth, inflation, interest rates, and corporate earnings.

    The key economic release will be Friday’s January U.S. jobs report, which is expected to show payroll growth of 67,000, with the unemployment rate unchanged at 4.4%. Ahead of that, the ISM manufacturing and services PMI readings will also be in focus.

    A busy earnings calendar is also on tap, featuring reports from several major companies. These include “Magnificent Seven” members Alphabet and Amazon (NASDAQ: AMZN), along with AI-focused leaders Palantir Technologies (NASDAQ: PLTR) and Advanced Micro Devices (NASDAQ: AMD). Other high-profile reporters include Eli Lilly, Novo Nordisk, Pfizer, PepsiCo, Walt Disney, PayPal, Uber, Reddit, Roblox, Snap, Qualcomm, and Super Micro Computer.

    Meanwhile, the federal government entered another shutdown on Saturday, though it is expected to be resolved by Monday.

    No matter how markets move, I outline below one stock that could attract buying interest and another that may face renewed downside pressure. Keep in mind that this outlook applies only to the week ahead, from Monday, February 2, through Friday, February 6.

    Buy Call: Alphabet

    Alphabet goes into its quarterly earnings release with expectations for an upside surprise on both profit and revenue, driven by two key growth engines: a rebound in advertising and rising AI-driven contributions across Search, YouTube, and Google Cloud.

    The company is set to report fourth-quarter results after the market closes on Wednesday at 4:00 p.m. ET. Options markets are pricing in a potential move of about ±6.4%, with positioning tilted to the upside as roughly 80% of whisper estimates point to a beat.

    Earnings forecasts have been raised 29 times in recent weeks, compared with just five downward revisions, underscoring increasing confidence in Alphabet’s earnings outlook.

    Wall Street expects Alphabet to deliver earnings of $2.64 per share, up 21.8% from a year earlier, while revenue is projected to rise 15.7% year over year to $111.1 billion. Cloud remains a standout performer, with Google Cloud Platform revenue forecast to grow more than 37% annually, driven by robust demand for AI infrastructure and enterprise offerings.

    A meaningful earnings beat, paired with upbeat forward guidance, could propel the stock to fresh record highs as the search giant continues to unlock monetization from its expanding suite of AI initiatives and builds on accelerating cloud momentum.

    GOOGL shares are trading near their 52-week high of $342.29 and remain above the 50-day moving average at $317.97. The stock is up about 8% year to date and has gained 66.3% over the past 12 months. From a technical perspective, the shares have held up well, consolidating above key support near $325 and setting up for a potential breakout above $350 if earnings exceed expectations.

    Trade Setup:

    • Entry: $338–$340 (ahead of earnings)
    • Target: $350–$355 (approximately 5% upside)
    • Stop-Loss: $330 (around 2.4% downside risk)

    Sell Call: Strategy

    Strategy heads into its earnings release under markedly different conditions. The Michael Saylor–led company, which has transformed itself into the world’s largest corporate holder of Bitcoin, is facing mounting pressure as cryptocurrency markets turn volatile.

    The firm holds roughly 712,647 Bitcoin, accumulated at an average cost of about $76,037 per coin, representing more than $54 billion at recent market prices. Over the weekend, however, Bitcoin fell below Strategy’s average purchase price for the first time since October 2023, pushing the company’s holdings into an unrealized loss position and heightening investor concerns.

    Strategy is scheduled to report its fourth-quarter earnings after the market closes on Thursday at 4:20 p.m. ET.

    Wall Street is forecasting a loss of $0.08 per share on revenue of $118.8 million, though investors’ attention will center less on the core figures and more on the company’s Bitcoin treasury and any related impairment charges.

    In the third quarter of 2025, the company booked a massive $17.44 billion in unrealized losses tied to cryptocurrency price declines, and the prospect of similar write-downs could pressure fourth-quarter results as well.

    Even with the stock trading at an estimated 0.7x the value of its Bitcoin holdings, Strategy’s elevated beta of 3.4 magnifies downside exposure in a risk-off market environment.

    MSTR shares have plunged 55.3% over the past year and are currently trading around $149.71, just above their 52-week low of $139.36. From a technical standpoint, the stock has fallen below both its 50-day and 200-day moving averages, while momentum indicators point to oversold conditions without signaling a decisive reversal.

    Elevated short interest and negative sentiment leave the shares vulnerable to additional downside, particularly if the earnings report points to slower Bitcoin accumulation or greater dilution from further capital-raising efforts.

    Trade Setup:

    • Entry: $149.71
    • Target: $130 (approximately 12.7% downside potential)
    • Stop-Loss: $155 (around 4% upside risk)

    Sources: Jesse Cohen

  • When will the German and Eurozone Q4 GDP figures be released, and what impact could they have on EUR/USD?

    Overview of German and Eurozone Q4 GDP

    Germany’s Federal Statistics Office will publish preliminary fourth-quarter GDP figures at 09:00 GMT on Friday, followed by Eurostat’s release of flash Eurozone GDP data at 10:00 GMT for the same period.

    Germany’s economy is expected to expand by 0.2% quarter-over-quarter in Q4, rebounding from stagnation in the previous quarter, while annual growth is forecast to remain unchanged at 0.3%. At the Eurozone level, seasonally adjusted GDP is projected to grow by 0.2% QoQ in the fourth quarter, down from 0.3% previously, with year-over-year growth seen moderating to 1.2% from 1.4%.

    How might Germany and the Eurozone’s Q4 GDP data influence the EUR/USD exchange rate?

    The EUR/USD pair may face downside pressure if Germany and Eurozone GDP figures come in line with forecasts. Investors will also closely monitor December unemployment data from both regions, as well as Germany’s Consumer Price Index (CPI for January).

    ECB policymaker Martin Kocher cautioned that additional strength in the Euro could lead the central bank to restart interest-rate cuts. After his remarks, market expectations for a summer rate reduction edged higher, with the implied probability of a July cut increasing to roughly 25% from around 15%. The ECB is set to meet next week and is broadly expected to leave interest rates unchanged.

    Meanwhile, EUR/USD is under strain as the US Dollar gains traction amid speculation that US President Donald Trump may nominate former Federal Reserve Governor Kevin Warsh as the next Fed Chair. Trump indicated late Thursday that he would reveal his decision on Friday morning, with markets leaning toward Warsh, who is perceived as relatively hawkish.

    From a technical perspective, EUR/USD is hovering near 1.1920 at the time of writing. Daily chart analysis continues to point to a bullish bias, with the pair holding within an ascending channel. A move toward the upper channel boundary near 1.2050 is possible, followed by 1.2082, the highest level since June 2021. On the downside, initial support is seen at the nine-day Exponential Moving Average (EMA) around 1.1870, with further support near the lower boundary of the channel at approximately 1.1840.

    Sources: Fxstreet

  • Economic Behavior

    Economic behavior refers to the way individuals, households, businesses, or organizations make decisions and take actions related to the production, distribution, exchange, and consumption of economic resources such as money, time, labor, and natural resources.

    Simply put, it is how people choose when resources are limited but needs are unlimited.

    Key characteristics of economic behavior

    1. Based on choice

    Because resources are scarce, people must choose one option over another.

    2. Benefit-oriented

    Decisions usually aim to maximize benefits (profit, satisfaction) and minimize costs.

    3. Influenced by many factors

    • Income and prices
    • Information and expectations
    • Psychology, habits, and culture
    • Government policies and the social environment

    4. Not always perfectly rational

    Behavioral economics shows that people often make decisions influenced by emotions, cognitive biases, or personal beliefs.

    Examples of economic behavior

    • Consumers compare prices and quality before buying tea
    • Businesses expand production when demand increases
    • Investors choose gold as a safe-haven asset during market volatility
    • People save more when they fear an economic downturn

    Types of economic behavior

    Consumption behavior

    Consumption behavior refers to how individuals or households decide what goods and services to buy, how much to buy, and when to buy in order to satisfy their needs and wants.

    Key decision factors

    • Income level and disposable income
    • Prices of goods and services
    • Preferences, tastes, and lifestyle
    • Psychological factors (brand perception, emotions, habits)
    • Social and cultural influences
    • Expectations about future income or prices

    Examples

    • A consumer choosing between premium tea and mass-market tea based on budget and perceived quality
    • Buying more during promotions or discounts
    • Reducing spending when economic uncertainty increases

    Economic significance

    Consumption drives demand, which in turn influences production, employment, and economic growth.

    Production behavior

    Production behavior describes how firms or producers decide what to produce, how much to produce, and which production methods to use.

    Key decision factors

    • Market demand and consumer preferences
    • Production costs (labor, raw materials, energy)
    • Technology and efficiency
    • Competition and market structure
    • Government regulations and taxes
    • Expected profits

    Examples

    • A tea company deciding to produce organic tea instead of conventional tea
    • Investing in automation to reduce labor costs
    • Cutting production when demand declines

    Economic significance

    Production behavior determines supply, pricing, productivity, and the efficient allocation of resources.

    Investment behavior

    Investment behavior refers to decisions made by individuals or organizations regarding how and where to allocate capital to generate future returns.

    Key decision factors

    • Expected rate of return
    • Risk tolerance and uncertainty
    • Interest rates and inflation
    • Market conditions and economic outlook
    • Time horizon (short-term vs long-term)

    Examples

    • Investors buying stocks, bonds, gold, or real estate
    • A business expanding factories or investing in R&D
    • Choosing safe-haven assets during financial instability

    Economic significance

    Investment fuels capital formation, innovation, and long-term economic growth.

    Saving behavior

    Saving behavior involves decisions about how much income to set aside for future use rather than current consumption.

    Key decision factors

    • Income stability and employment security
    • Interest rates and returns on savings
    • Life cycle stage (youth, working age, retirement)
    • Precautionary motives (emergency funds)
    • Cultural attitudes toward saving

    Examples

    • Households increasing savings during a recession
    • Individuals saving for education, housing, or retirement
    • Businesses retaining earnings instead of distributing dividends

    Economic significance

    Savings provide funds for investment and help stabilize financial systems.

    Exchange (Market) Behavior

    Exchange behavior refers to how economic agents buy, sell, and negotiate in markets.

    Key decision factors

    • Market prices and transaction costs
    • Bargaining power and competition
    • Information availability and transparency
    • Trust and contractual enforcement

    Examples

    • Negotiating wholesale tea prices with suppliers
    • Online trading of financial assets
    • Choosing platforms based on fees and convenience

    Economic significance

    Exchange behavior ensures the circulation of goods, services, and capital in the economy.

    Labor (Work) Behavior

    Labor behavior focuses on decisions related to working, hiring, wage setting, and skill development.

    Key decision factors

    • Wage levels and benefits
    • Working conditions and job security
    • Education and skill requirements
    • Work-life balance preferences
    • Labor market regulations

    Examples

    • Workers choosing between higher pay or better working conditions
    • Firms hiring skilled labor to improve productivity
    • Employees investing in training to increase income potential

    Economic significance

    Labor behavior directly affects productivity, income distribution, and employment levels.

    Behavioral (Psychological) Economic Behavior

    This type highlights how psychological biases and emotions influence economic decisions, often leading to outcomes that deviate from rational models.

    Key influences

    • Loss aversion
    • Overconfidence
    • Herd behavior
    • Anchoring and framing effects

    Examples

    • Panic selling during market crashes
    • Consumers overpaying due to brand loyalty
    • Investors following market trends without analysis

    Economic significance

    Understanding behavioral factors helps explain real-world market anomalies and improves policy and business strategies.

  • UK retail sales rise 0.4% MoM in December, beating -0.1% forecast

    UK retail sales increased by 0.4% month-on-month in December, rebounding from a 0.1% decline in November, according to data released Friday by the Office for National Statistics.

    Markets had expected retail sales to fall by 0.1% during the month. Core retail sales, which exclude auto fuel, rose 0.3% month-on-month in December, reversing a revised 0.4% decline previously reported. The reading exceeded market expectations for a 0.2% fall.

    On an annual basis, UK retail sales increased 2.5% in December, up from a revised 1.8% previously and above the consensus forecast of 1.0%. Annual core retail sales also strengthened, climbing 3.1% compared with a revised 2.6% gain earlier, outperforming expectations of a 1.4% rise.

    Market response to the UK Retail Sales data

    The positive UK Retail Sales report has failed to lift the Pound Sterling, with GBP/USD down 0.06% on the day, trading at 1.3488 at the time of writing.

    The following section was published on January 23 at 5:11 GMT as a preview of the UK Retail Sales report.

    Overview of UK Retail Sales

    The UK calendar features the release of the December Retail Sales figures from the Office for National Statistics (ONS) on Friday at 07:00 GMT.

    Retail Sales are forecast to edge down by 0.1% month-on-month in December, following an identical 0.1% decline in November. On a yearly basis, sales are expected to increase by 1%, slightly higher than the previous 0.6% rise.

    Core Retail Sales, which exclude motor fuel, are also projected to slip by 0.2% MoM, in line with the prior reading, while annual growth is anticipated to improve to 1.4% from 1.2% in November.

    How might UK retail sales influence the GBP/USD exchange rate?

    The GBP/USD pair could show little reaction even if UK Retail Sales for December exceed expectations, as markets largely anticipate the Bank of England to maintain a cautious, gradual easing stance despite stronger price pressures seen in December. Attention is likely to shift instead to the preliminary January S&P Global PMI readings from both the UK and the US, scheduled for release later in the day.

    Sterling may find support if the US Dollar weakens amid rising risk aversion linked to geopolitical tensions. Earlier, US President Donald Trump threatened tariffs on European nations opposing his Greenland initiative, but later eased his stance after reaching a NATO framework agreement that opened the door to a potential deal.

    From a technical perspective, GBP/USD is holding firm after climbing more than 0.5% in the previous session, hovering near the 1.3500 level at the time of writing. The pair could aim for the three-month peak at 1.3562 as the next resistance. On the downside, initial support is seen at the nine-day EMA around 1.3451, followed by the 50-day EMA near 1.3398.

    Sources: Fxstreet

  • Passive Income

    Passive income is a form of income that is generated repeatedly and relatively steadily after an initial investment of time, effort, or capital to build a system, asset, or operating model. Unlike active income, which requires a direct exchange of time for money, passive income leverages capital, technology, intellectual property, or branding to create long-term value. While it does not mean “earning money without doing anything,” passive income reduces dependence on daily labor and provides a more sustainable and resilient financial foundation over time.

    The Benefits of Passive Income

    Financial stability and diversification

    Passive income creates a more secure financial position by ensuring that earnings continue even when active work is reduced or interrupted. This stability helps individuals and businesses better manage expenses and plan for the future.

    Relying on multiple income streams lowers overall financial risk. If one source underperforms or stops, others can continue to provide cash flow, reducing vulnerability to economic or industry-specific shocks.

    Time freedom and long-term wealth creation

    Because passive income is not directly tied to hours worked, it allows individuals to reclaim time. This time can be invested in personal growth, strategic thinking, or higher-value activities.

    Many passive income streams grow over time through reinvestment and compounding. Assets such as investments, digital products, or intellectual property can generate increasing returns without proportional effort.

    Scalability and flexibility

    Passive income models can expand without significantly increasing workload. Once systems are in place, income can grow through broader distribution, automation, or market expansion.

    With steady passive income, individuals have more freedom to change careers, start new ventures, or pursue opportunities that may not offer immediate active income.

    Financial resilience and leverage of assets

    It allows people to maximize the value of existing assets—such as capital, expertise, content, or technology—by turning them into ongoing income-generating resources.

    Reduced stress and strategic focus

    Having reliable income streams beyond active work lowers financial pressure, leading to greater peace of mind and improved decision-making.

    By reducing the need for constant operational involvement, passive income enables a shift toward long-term strategy, innovation, and sustainable growth.

    How to Create Passive Income

    Before participating in trading or investing in economic or financial markets, acquiring knowledge is essential for preparing for sustainable long-term growth, helping investors develop discipline, risk management skills, and a clear strategic mindset to navigate market volatility.

    How Can We Generate Passive Income?

    What is Stocks and Bonds?

    Stocks and bonds are two common types of investments. Stocks represent ownership in a company, meaning you benefit when the company grows through rising share prices and sometimes dividends, but you also face higher risk because prices can fluctuate. Bonds, on the other hand, are loans you give to a government or company; in return, you receive regular interest payments and get your original money back at maturity, making them generally more stable but with lower returns than stocks.

    What is high-risk investments?

    High-risk investments are investments where the chance of losing money is significant, but they offer the potential for very high returns. Their value can change rapidly due to market volatility, economic events, or speculation, and outcomes are less predictable than traditional investments. Examples include cryptocurrencies, early-stage startups, speculative stocks, leveraged trading, and some derivatives. These investments are usually suitable only for investors who can tolerate large fluctuations and afford to lose part or all of their invested capital.

  • Morgan Stanley and Capital One Financial Highlighted as This Week’s Top Buy and Sell Picks

    • This week, market attention will be on CPI inflation figures, retail sales data, and the kickoff of the Q4 earnings season.
    • Morgan Stanley is expected to see gains driven by robust quarterly results.
    • Meanwhile, Capital One Financial is likely to face challenges due to a proposed cap on credit card interest rates.

    The stock market closed the first complete trading week of 2026 with the Dow Jones Industrial Average and S&P 500 reaching record levels, buoyed by the latest employment report.

    Wall Street’s major indexes enjoyed a strong week, with the Dow Jones Industrial Average rising 2.3%, the S&P 500 gaining 1.6%, the tech-focused Nasdaq Composite climbing 1.9%, and the small-cap Russell 2000 soaring 4.6%.

    Looking ahead, the upcoming week promises significant market activity as investors assess economic prospects and interest rate trends.

    Key events on the economic calendar include Tuesday’s U.S. consumer price inflation report for December, which could trigger market volatility if the data exceeds expectations. This report will be released alongside producer price figures, offering a broader view of inflation, as well as the December retail sales numbers.

    Additionally, the Q4 earnings season is about to begin, featuring major companies such as JPMorgan Chase, Bank of America, Wells Fargo, Citigroup, Goldman Sachs, Morgan Stanley, BlackRock, Delta Air Lines, and Taiwan Semiconductor set to report their results.

    Additionally, the Supreme Court may deliver a ruling on the Trump tariffs this week, after not doing so last Friday.

    No matter how the market moves, below I identify one stock expected to attract buying interest and another that might face renewed selling pressure. Keep in mind, my outlook covers just the upcoming week, from Monday, January 12 to Friday, January 16.

    Morgan Stanley: Top Stock Pick to Buy

    Morgan Stanley is set to deliver one of the strongest earnings reports in the financial sector this quarter, fueled by a notable rebound in mergers and acquisitions, a thriving IPO underwriting business, and strong results across its core investment banking divisions.

    The company will release its Q4 results before the market opens on Thursday at 7:30 AM ET. Investors anticipate significant volatility in MS shares following the announcement, with options markets pricing in a potential move of about ±4.2% post-earnings.

    Analysts hold a positive outlook, with all nine recent earnings revisions reflecting upward adjustments, highlighting Morgan Stanley’s strong presence in high-growth sectors such as AI-related financing and capital markets.

    Morgan Stanley is projected to earn $2.41 per share, an 8.5% increase compared to last year, while revenue is expected to rise 9.4% year-over-year to $17.72 billion. This growth is anticipated to be driven by a rebound in global mergers and acquisitions, alongside robust performance in IPO underwriting and trading revenues.

    In recent quarters, Morgan Stanley has effectively increased its market share in high-margin advisory services while sustaining its leading role in equity and debt underwriting, both of which contribute significant fee income when market conditions are favorable.

    Technically, Morgan Stanley’s shares closed near $186.50 on Friday, trading above key moving averages and displaying bullish momentum ahead of the earnings report. Should the company deliver strong results with an optimistic outlook, the stock could push toward $200 shortly, making it an appealing buy for investors confident in the financial sector’s continued strength.

    InvestingPro’s AI-driven quantitative model assigns Morgan Stanley a ‘GOOD’ Financial Health Score of 2.65, indicating solid capital reserves, strong liquidity, and a long history of dependable dividends.

    Capital One Financial: Recommended Sell

    On the other hand, Capital One Financial, a leading credit card lender, is expected to face considerable selling pressure this week following President Trump’s announcement of a temporary 10% cap on credit card interest rates. This policy, designed to alleviate consumer financial strain, poses a direct threat to the profitability of lenders that depend heavily on interest income from credit cards.

    Given its large consumer credit card portfolio, Capital One is particularly exposed. With average credit card interest rates typically between 20-30%, a 10% cap would wipe out most of the company’s net interest income, which forms the backbone of its overall profits.

    The proposed interest rate cap poses an urgent and substantial challenge to Capital One’s financial results, forcing the company to either accept sharply lower profits or withdraw from large segments of the credit card market that would no longer be financially viable.

    Even prior to this announcement, Capital One Financial was struggling with increasing charge-offs and slowing loan growth, leaving the stock susceptible to further declines.

    Shares closed around $250 on Friday, but if upcoming earnings (due January 22) reveal worsening credit quality or management signals concerns about future profitability, the stock could drop to $229 or below—a decline of 8-10% from current levels.

    Whether you’re a beginner investor or an experienced trader, using InvestingPro can help you discover investment opportunities while managing risks in today’s challenging market environment.

    Sources: Investing

  • Frequently Asked Questions (FAQ) From Business Owners

    How can we best assist you?

    Our knowledge, news, and analysis can help you forecast the future economy, enabling you to make better business decisions for your growth. We also connect business owners and investors who can support your business development in the future. Through our services, you can become a confident speculator and investor, with access to free advice.

    What is the benefits of knowledge section?

    This section helps you learn and understand various ways to grow your revenue and optimize your profit. Many investors are ready to invest in your business, but you might not be aware of them—and usually, no one offers help without charging a fee and without guaranteeing results.

    What is the benefits of news and analysis?

    1. Stay Informed: Keeps you updated on market events, trends, and economic changes.
    2. Better Decision-Making: Helps you understand market sentiment and potential impacts on assets.
    3. Identify Opportunities: Spot emerging trends or risks early through expert insights.
    4. Diversify Perspectives: Gain different viewpoints to avoid biased decisions.
    5. Improve Timing: News and analysis can guide when to enter or exit positions.

    Why can the economic calendar and financial markets influence your business?

    They can help you understand why your business is performing well or poorly at a given time. They also provide insights on how to raise funds and improve your business performance with potential equity-sharing investors. By keeping track of economic policies and market trends, you can better prepare your business plans for future changes.

    What more can I know?

    One way to build wealth is by including investments and speculation in your own portfolio. With our help, you can earn more than others while taking on much lower risk.

    If I have many other questions, requests, or issues that need to be addressed, what should I do?

    You can contact us anytime to resolve your issues. Our advice and consulting services are free of charge. Please don’t hesitate to reach out.