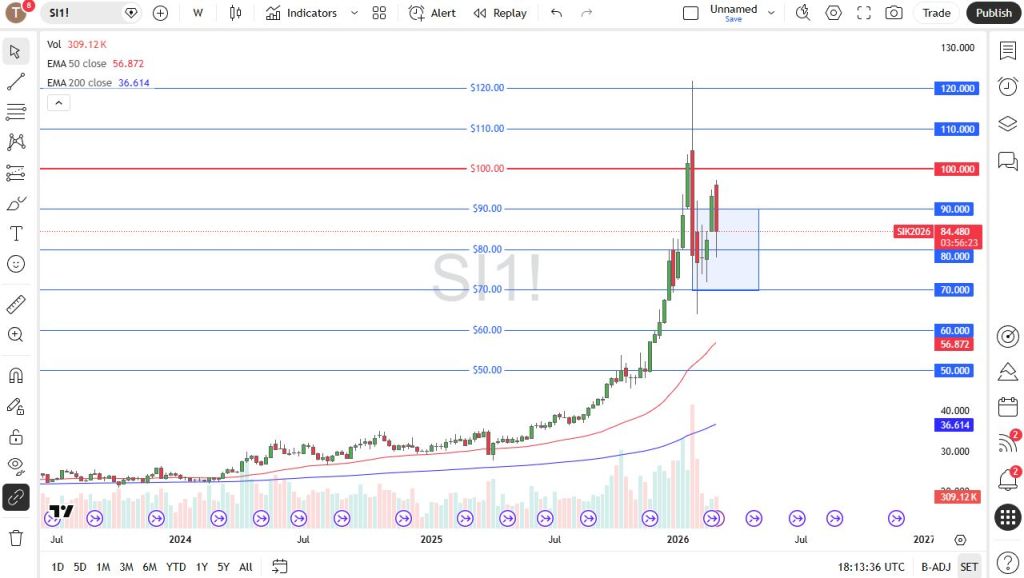
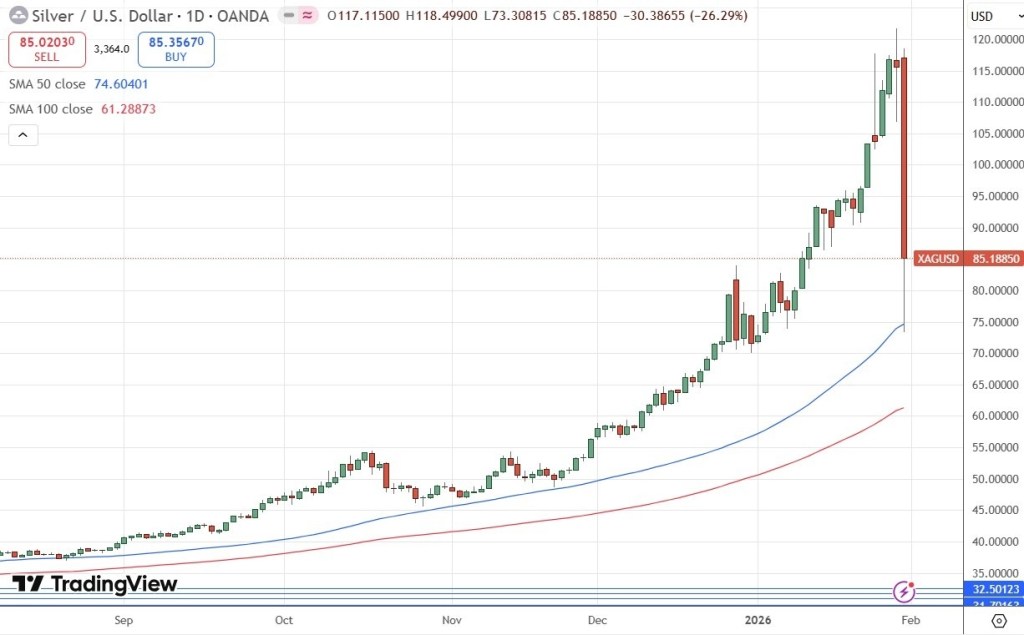
Silver faced a difficult week as the U.S. dollar strengthened for much of the period, though it’s important to remember that its recent collapse wiped out many retail trading accounts.
That said, this is a market worth monitoring closely because the $80 level represents an important support area and sits near the center of the broader consolidation range.
If the price breaks below this week’s candlestick, it could open the door for silver to decline toward the $70 level, where I also expect support to emerge.
Overall, the market has been quite volatile and choppy, and that pattern is likely to persist. Because of this, careful position sizing will be essential.
S&P 500
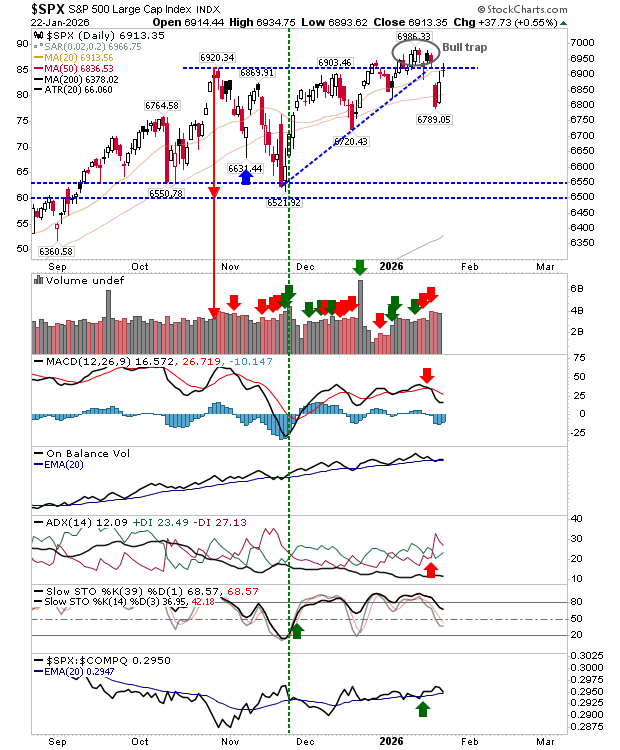
The S&P market declined quite sharply over the week, testing the 5,000 level. This level is a major round number with strong psychological importance, so it’s an area many investors are watching closely.
If the market breaks below 5,000, it could pave the way for a drop toward 4,800, with the possibility of quickly moving further down to around 4,600.
From a longer-term perspective, the 5,000 level may continue to act as a price magnet for the market.
If that remains the case, we could see extended sideways movement around this zone, although my broader outlook still leans bullish over the long run.
USD/CAD
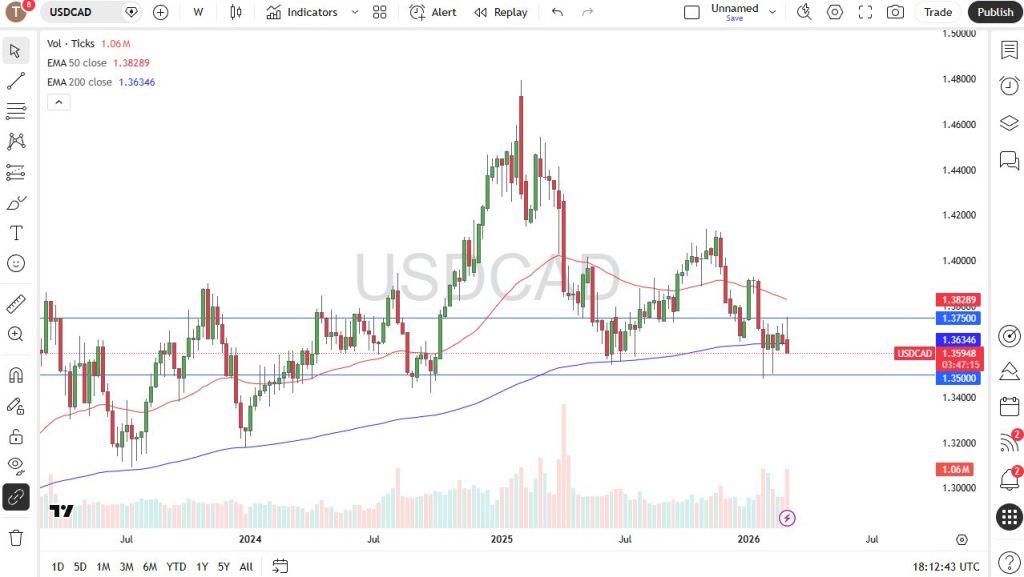
The US dollar first strengthened against the Canadian dollar, rising to test the 1.3750 level, but then reversed and began showing signs of weakness. Meanwhile, the 1.35 level below stands as an important support area that many market participants are closely monitoring.
It is also worth noting that the Canadian dollar has been gaining some strength on the back of rising oil prices. Whether that trend will continue is uncertain, but if oil fails to maintain its momentum, a reversal could follow.
For now, the market remains within the same consolidation range that it has revisited repeatedly.
USD/MXN
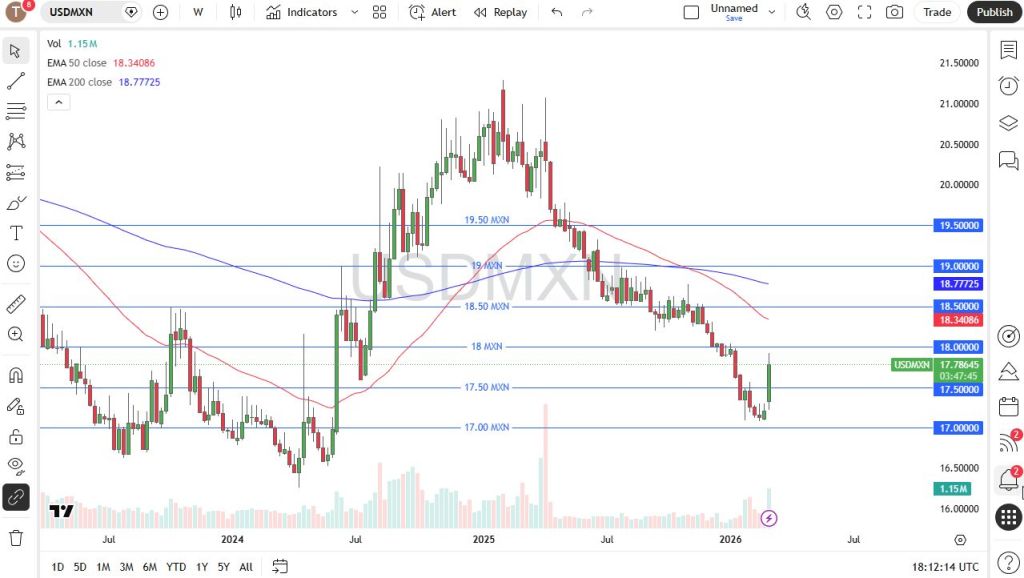
The US dollar surged sharply against the Mexican peso during the week, but in reality a pullback had been due. The key question now is whether the 18-peso level will act as strong enough resistance to reverse the move.
If it does, it could present a solid opportunity to take short positions. However, if the market manages a daily close above the 18-peso level, it may signal that the recent trend is coming to an end.
All things considered, this is a market where traders may look for signs of exhaustion to sell into, as the interest rate differential still generally favors Mexico.
Bitcoin
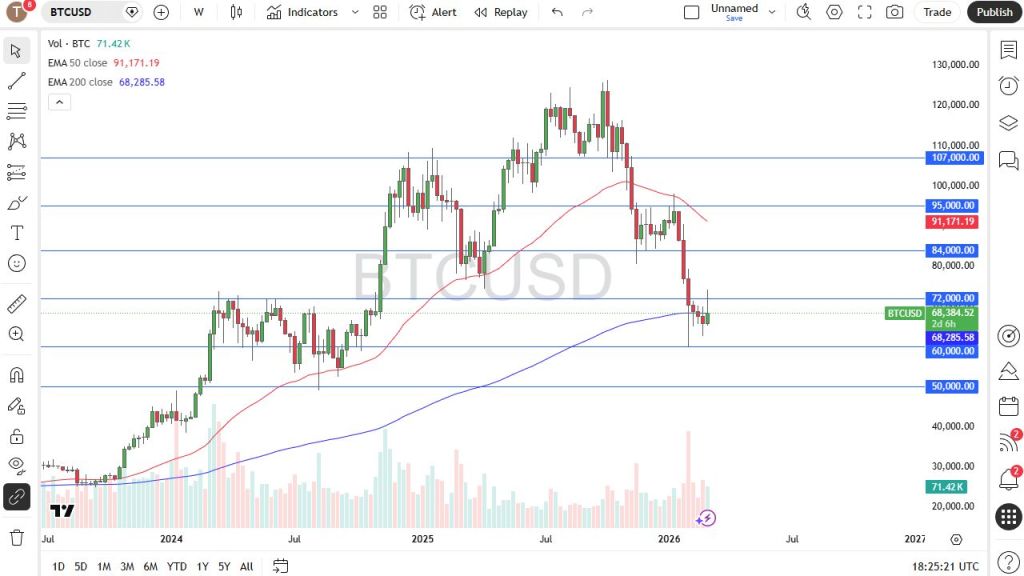
The Bitcoin market has been quite volatile during the week, but it did manage to break above the $72,000 level. This is notable given the overwhelmingly negative headlines around the world at the moment, and it’s a market I’ll be monitoring very closely.
If the market can close above the weekly high and continue moving higher, Bitcoin could begin to rally strongly. There may still be debate about what Bitcoin truly represents, but one thing seems clear—it appears to be heavily oversold.
The key question now is whether buyers will step back in. On the other hand, if the price drops below the $60,000 level, it could trigger a sharp and widespread sell-off.
Nasdaq 100
The Nasdaq 100 has been volatile but has continued to show resilience. This is a pattern that appears repeatedly in the US stock market, even when there have been plenty of reasons for it to break down. In itself, that persistence likely says a lot about the underlying strength of the market.
What I think it tells you is that given enough time, the US stock market, and in this case the Nasdaq 100, will find buyers on any pullback and selling just does not seem to be working out.
EUR/USD
The euro weakened significantly during the week. Much of this appears to be driven by expectations that energy costs in the European Union will rise sharply, which could heavily influence the options available to the European Central Bank.
Keep a close eye on the 1.15 level. If the market breaks below that point, the euro could decline sharply.
For now, the market remains within the same consolidation range it has been trading in for some time. I do not expect significant movement at the moment, but the 1.15 level will be important to watch.
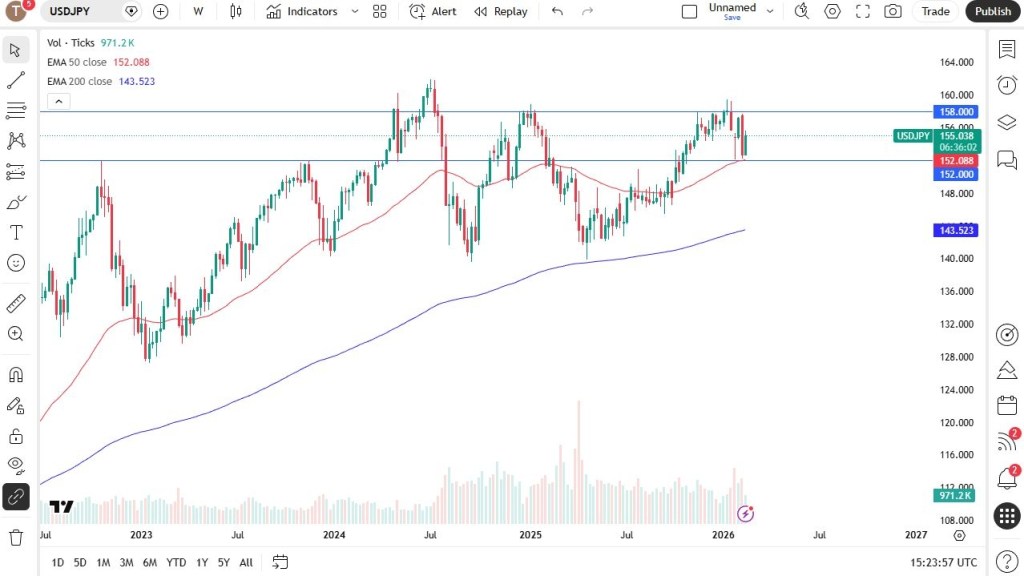
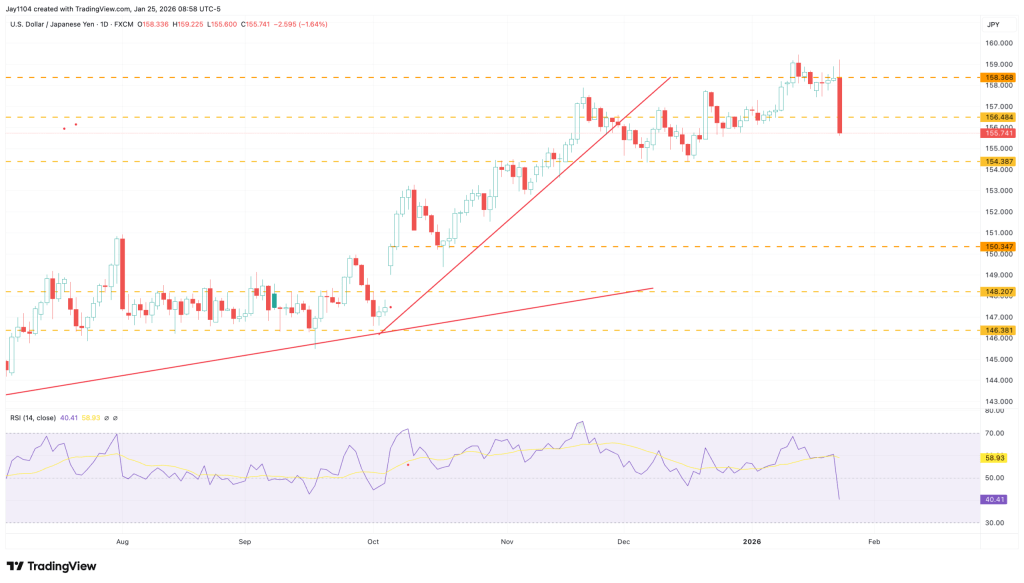
USD/JPY
The US dollar continues to signal the possibility of a major breakout against the Japanese yen, although it has not achieved it yet. The ¥158 level marks the start of a strong resistance zone that extends up to the ¥160 level.
If the market manages to break above that area, it is likely to move significantly higher. In the short term, pullbacks could present buying opportunities as traders look to pick up the dollar at lower prices.
Over the longer term, I expect an eventual breakout to the upside. However, the current situation makes it challenging to short the market, while buying directly at this resistance zone is also difficult. It may be best to wait for better value and take advantage of opportunities when they appear.
Bitcoin edged higher on Thursday, stabilizing after a wave of regulatory optimism and improving market sentiment fueled recent gains in the world’s largest cryptocurrency, though concerns linked to the Iran conflict continued to weigh on markets. The digital asset rose 1.5% to $72,620 by 09:37 ET (14:37 GMT), after reaching a one-month peak of $73,243 on Wednesday.
However, some gains were pared back as U.S. stock index futures turned negative Thursday morning, with ongoing tensions between the U.S., Israel, and Iran keeping investors cautious. Rising oil prices also intensified worries about the conflict’s potential inflationary effects.
Bitcoin had surged on Wednesday, extending earlier weekly gains as a strong performance on Wall Street boosted risk appetite. Bargain buying also contributed to the rally following the cryptocurrency’s sharp losses in February. The market was further supported after U.S. President Donald Trump urged lawmakers to quickly pass a long-delayed crypto market framework bill and criticized major U.S. banking groups for opposing yield payments on stablecoins.
His remarks fueled expectations that the industry could receive more favorable regulation in the U.S., although progress on the CLARITY Act—designed to establish a clear market structure for crypto—remains limited. Earlier optimism was also driven by reports suggesting Iran was seeking talks with Washington, raising hopes for de-escalation. However, Iran denied those reports and launched missile strikes on Israel early Thursday, dampening risk sentiment.
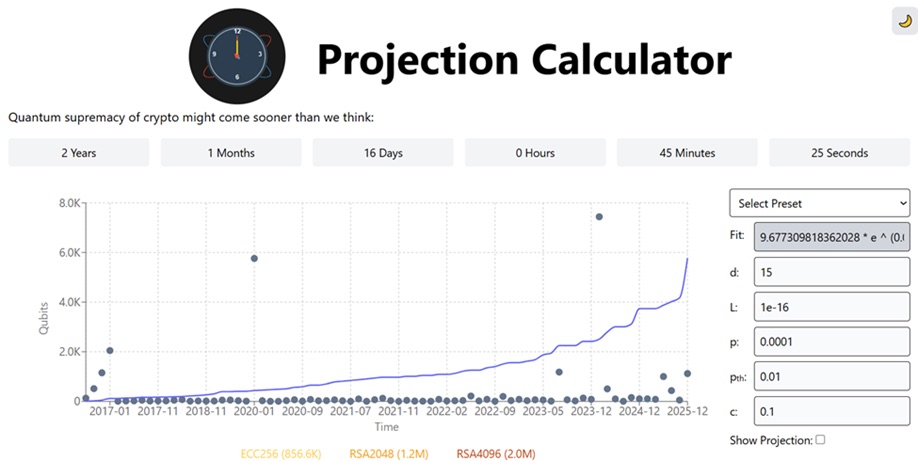
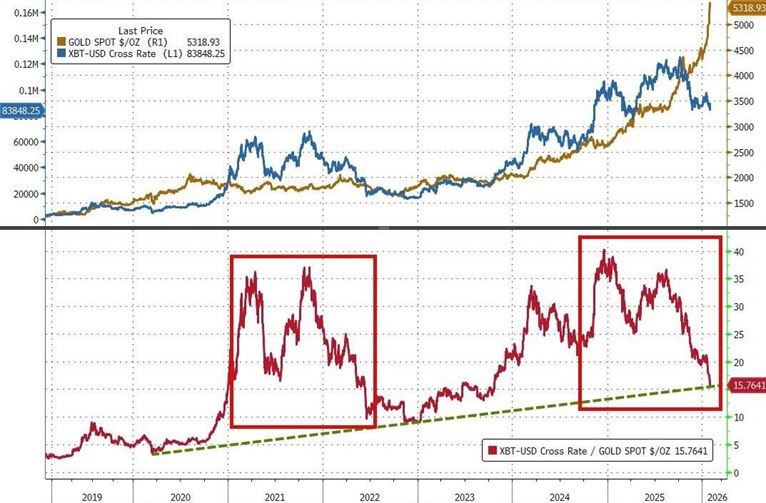
Meanwhile, billionaire hedge fund manager Ray Dalio renewed his criticism of Bitcoin, arguing it should not be compared with gold because it lacks central bank backing, offers limited privacy, and could be vulnerable to advances in quantum computing. Speaking on a podcast, the Bridgewater Associates founder said Bitcoin remains small relative to gold as a monetary asset and questioned its reliability as a safe haven.
Despite his skepticism, Dalio noted in 2025 that he maintains a 1% allocation to Bitcoin in his portfolio and previously suggested investors consider holding around 15% in either Bitcoin or gold amid concerns about the U.S. debt situation.
In corporate news, Intercontinental Exchange—the owner of the New York Stock Exchange—acquired a minority stake in crypto exchange OKX in a deal valuing the platform at roughly $25 billion. As part of the agreement, ICE will license OKX’s spot crypto pricing data and intends to launch U.S.-regulated futures contracts tied to those prices.
Subject to regulatory approval, ICE’s U.S. futures products and tokenized NYSE-listed equities could also become available on OKX’s platform. Financial terms of the investment were not disclosed, though ICE will receive a seat on OKX’s board.
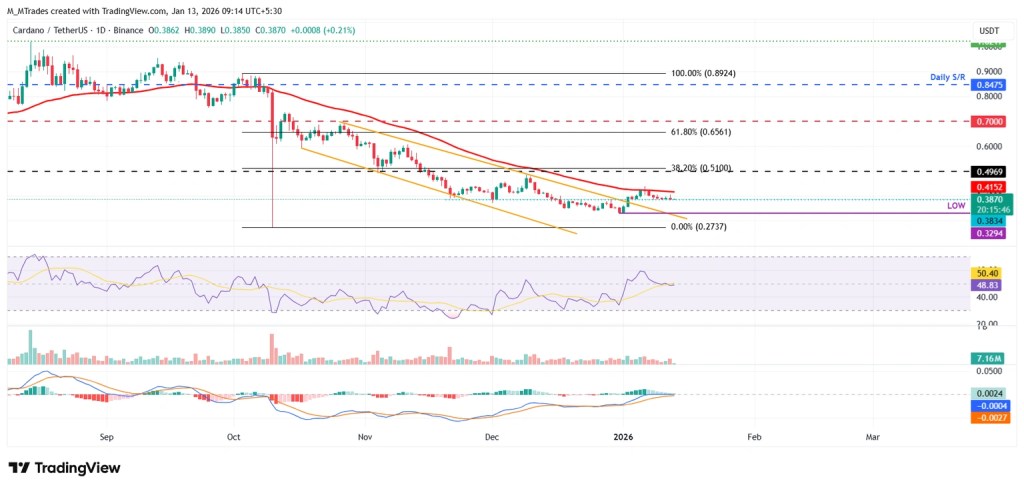
Across the broader crypto market, prices moved slightly higher on Thursday, following Bitcoin’s gains as the sector recovered part of last month’s losses. Ether rose about 2% to $2,123.34, while XRP gained more than 1% to $1.43. Solana, Cardano, and BNB also recorded modest increases. Among memecoins, Dogecoin traded flat, while the $TRUMP token declined around 2%.
Bitcoin was little changed on Wednesday, drawing modest support after Donald Trump called for stronger regulatory backing of the crypto sector.
Still, lingering concerns over the escalating U.S.-Iran conflict—and its potential inflationary fallout—kept broader digital asset markets under pressure, capping what had been a brief rebound earlier in the week.
Bitcoin was flat at $68,147.8 as of 01:30 ET (06:30 GMT). The token had briefly climbed back toward $69,000 earlier this week before surrendering part of those gains.
Trump targets banks over crypto legislation
In a Tuesday evening social media post, Trump accused major U.S. banks of attempting to weaken the GENIUS Act—legislation regulating stablecoins—by delaying progress on the CLARITY Act in the Senate. The latter bill aims to establish a broader regulatory framework for crypto markets.
Trump argued that record bank profits should not come at the expense of the administration’s crypto agenda, warning that failure to pass the CLARITY Act could drive innovation overseas. He urged banks to support, rather than obstruct, efforts to formalize rules for the industry.
According to reports, Trump met privately with Brian Armstrong, CEO of Coinbase, shortly before issuing his remarks. Armstrong has opposed a full ban on yield payments for stablecoins.
The GENIUS Act, passed in June 2025, prohibits issuers such as Tether from directly paying yields to holders. However, third-party platforms like exchanges may still offer such returns—an arrangement banking groups argue creates a regulatory loophole.
The CLARITY Act, approved by the House in July but still awaiting Senate passage, has faced delays largely due to disagreements over whether stablecoin yield payments should be regulated similarly to bank interest payments.
Altcoins muted amid geopolitical strain
Broader crypto markets traded within a narrow range on Wednesday. While optimism over potential U.S. regulatory clarity provided some support, investor sentiment remained constrained by ongoing tensions in the Middle East.
With the U.S., Israel, and Iran conflict entering its fifth day, fears of supply disruptions—particularly in global oil markets—have fueled inflation concerns. Persistent price pressures could prompt major central banks to maintain a hawkish stance, dampening appetite for risk assets, including cryptocurrencies.
Among major tokens, Ethereum fell 1% to $1,979.99, while XRP slipped 0.2% to $1.3594. Solana and BNB were little changed, while Cardano declined 3%. In the meme coin segment, Dogecoin dropped 2.6%, and TRUMP slid 3.4%.
Bitcoin rebounded on Monday, recovering from losses triggered by U.S. strikes on Iran over the weekend. The cryptocurrency’s advance mirrored a broader recovery in equity markets.
The world’s largest digital asset was up 5.7% at $69,428.4 as of 16:40 ET (21:40 GMT).
Bitcoin rebounds after weekend selloff
Bitcoin had dropped sharply after coordinated U.S. and Israeli military operations in Iran reportedly resulted in the death of Supreme Leader Ayatollah Ali Khamenei, marking one of the most severe regional escalations in recent years.
Iran responded with several waves of missile attacks targeting Israeli and U.S. military facilities.
Following the initial strikes, Bitcoin tumbled to around $63,000 before stabilizing and beginning to recover.
According to Dessislava Ianeva, analyst at Nexo Dispatch, Bitcoin held relatively steady as markets evaluated the evolving U.S.–Iran situation. While prediction markets remain split on the likelihood of further escalation, the limited price reaction indicates investors currently see the conflict as a contained, short-term risk rather than the beginning of a sustained downturn.
President Donald Trump stated Monday that the military operation had four key goals: dismantling Iran’s missile capabilities, destroying its navy, preventing the country from acquiring nuclear weapons, and stopping Tehran from supporting and directing terrorist activities.
“We’re already well ahead of schedule, but whatever time is required, that’s fine. We’ll do whatever it takes,” Trump said, adding that although initial projections suggested four to five weeks, the U.S. has the capacity to extend operations significantly if necessary.
Strategy adds $204 million in Bitcoin
Michael Saylor’s company Strategy expanded its Bitcoin holdings last week, purchasing 3,015 BTC valued at approximately $204.1 million, at an average price of about $67,700 per coin.
Following the acquisition, Strategy’s total Bitcoin holdings increased to 720,737 BTC, accumulated at a total cost of roughly $54.77 billion — averaging about $75,985 per Bitcoin.
Strategy remains the largest publicly traded corporate holder of Bitcoin, having steadily built one of the most substantial corporate crypto treasuries.
Altcoins track Bitcoin higher
Most major altcoins also moved higher alongside Bitcoin.
Ethereum, the second-largest cryptocurrency, climbed 6% to $2,045.01. XRP gained 2.9% to $1.3936, while Solana and Cardano rose 5.7% and 2.2%, respectively.
The U.S. dollar initially strengthened against the Canadian dollar over the course of the week, but has since pulled back and is now showing signs of indecision. This isn’t particularly surprising, given that the pair has been fluctuating within the same range for the past five weeks. Notably, the 1.3550 level continues to serve as solid support, while the 1.3750 area above remains a key resistance zone.
For longer-term traders, the prudent approach is likely to wait for a decisive breakout in either direction. In the meantime, short-term participants may keep trading the range, especially as the interest rate differential between the two currencies continues to narrow, encouraging back-and-forth price action.
EUR/USD
The euro has traded in a choppy, sideways manner throughout the week, much like the U.S. dollar against the Canadian dollar. The interest rate differential between the euro and the dollar is relatively modest, with the European Central Bank expected to hold rates steady while the Federal Reserve may move toward cutting them.
In this kind of environment, traders are searching for a catalyst to drive price in either direction. At the moment, the 1.18 level appears to be acting as a magnet, drawing price back toward it as the market struggles to establish a clear trend.
USD/MXN
The U.S. dollar moved higher against the Mexican peso over the week, which isn’t particularly surprising given how sharply it had declined beforehand. If the pair continues to rebound, the 17.50 level is likely to attract selling pressure, making it a potential area to consider short positions.
A sustained break above 18.00 would be needed before entertaining the idea of a broader trend reversal. For now, the interest rate differential continues to favor the downside, so the pair is often used to collect positive swap. I rarely look to buy this market, though sharp upside moves can occur and prove highly profitable—typically driven by strong momentum or bouts of risk aversion, which tend to override the yield advantage.
BTC/USD
Bitcoin has been highly volatile throughout the week, with price action continuing to revolve around the $60,000 level. This area is drawing significant attention, as a decisive break below it could pave the way for a swift move toward the $50,000 region.
A break above the $72,000 level would open the door for a potential rally toward $84,000. However, at this stage, the more likely scenario appears to be continued sideways consolidation. In fact, the longer Bitcoin trades within a range and builds a base, the healthier the overall structure becomes, potentially setting the stage for a more sustainable move higher later on.
USD/JPY
The U.S. dollar edged higher against the Japanese yen over the week, though the ¥158 level continues to act as resistance. At this point, traders seem to be searching for a catalyst strong enough to push the pair beyond the key ¥160 threshold.
A sustained move above ¥160 could trigger a significant rally, as that area marks the major swing high dating back to 1990. In the meantime, short-term pullbacks are likely to be viewed as buying opportunities, supported by the wide interest rate differential and Japan’s heavy debt burden, which limits the scope for materially higher domestic rates.
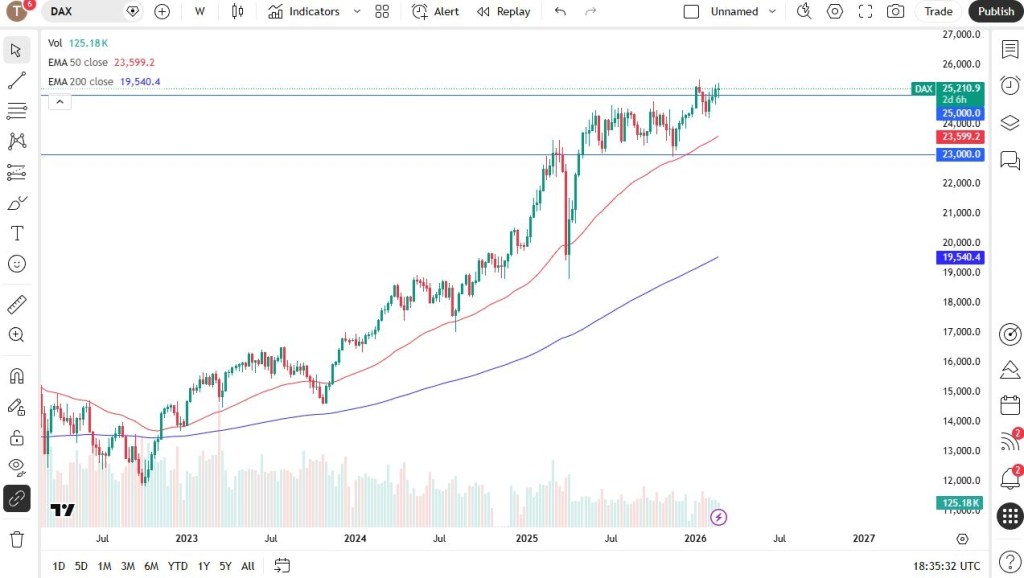
DAX
The German equity market has been somewhat erratic, with the DAX moving back and forth, though overall activity has been relatively subdued. The 25,000-euro level remains a key focus, as it represents a major round number with strong psychological significance. In the near term, minor pullbacks are likely to be viewed as buying opportunities.
There is also the potential for a push above the 25,400 level. A decisive breakout there could pave the way for a move toward the 27,000-euro region. At this stage, I have no interest in shorting the DAX, as the German economy appears to be supported by substantial government stimulus measures.
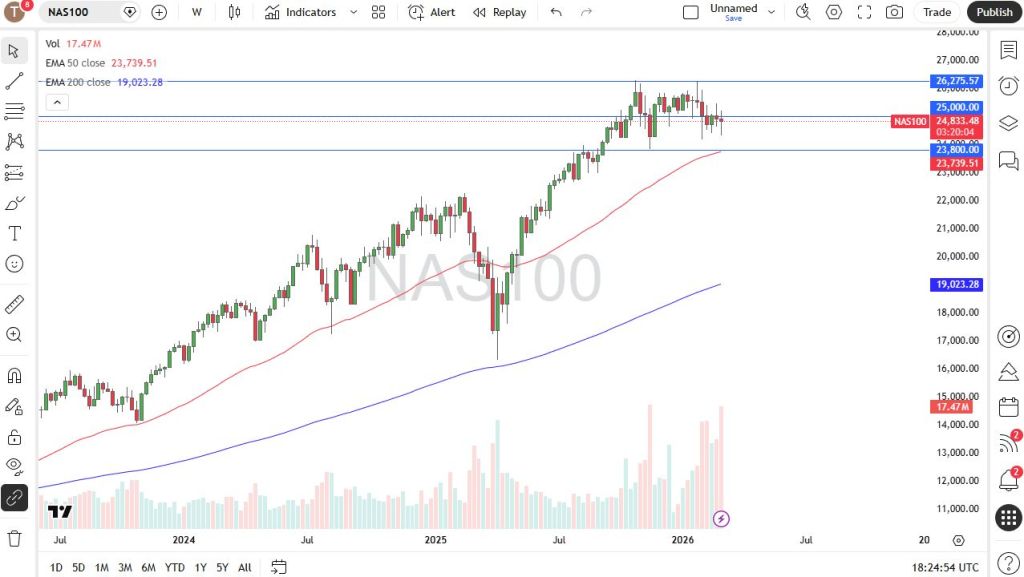
NASDAQ 100
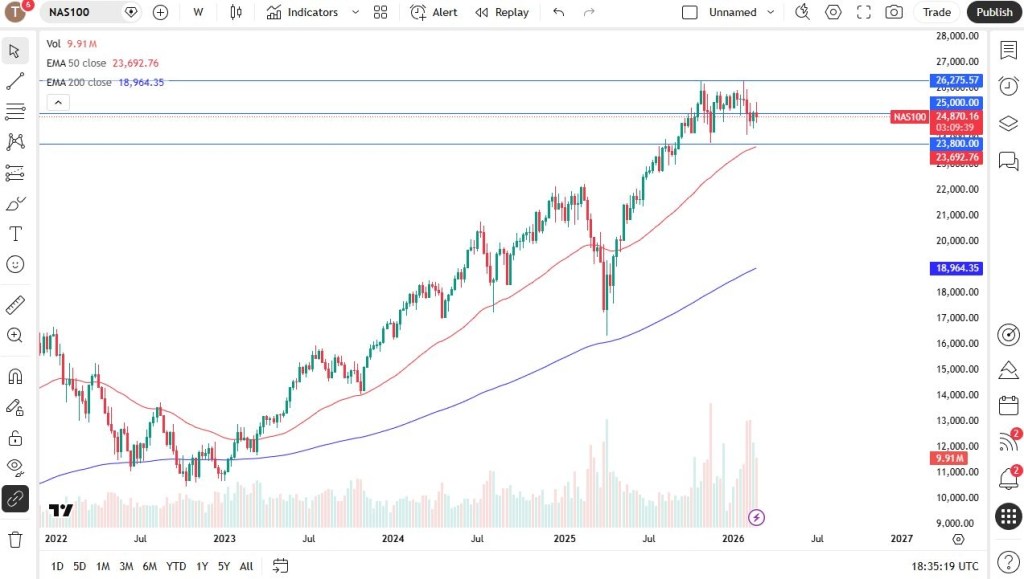
The Nasdaq 100 has experienced significant volatility throughout the week. Despite ongoing challenges and heavy selling pressure in major stocks such as Nvidia, the index is set to close the week in relatively steady shape. The 25,000 level remains a key focus, as it represents a major psychological milestone.
A decisive move above 25,000 could open the door to the 25,500 area, which may act as the next resistance barrier. Overall, the broader outlook remains constructive, with short-term pullbacks likely presenting buying opportunities.
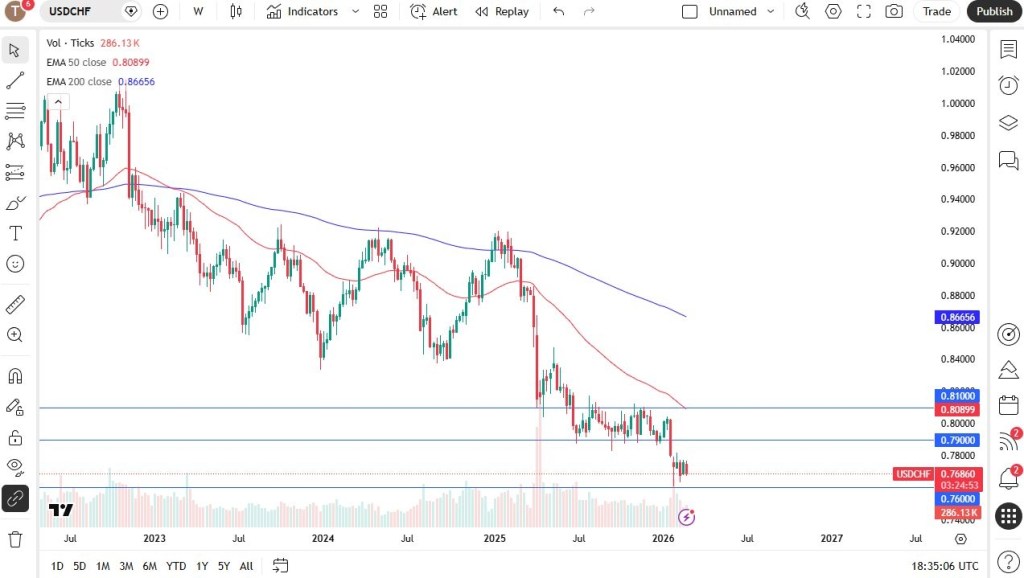
Meanwhile, the U.S. dollar has continued to weaken against the Swiss franc over the past week, making this currency pair one to monitor closely.
USD/CHF
The U.S. dollar has edged lower against the Swiss franc over the past week, making the pair particularly important to monitor. Swiss officials have expressed concern about the franc’s strength, which adds another layer of sensitivity to current price movements.
The 0.76 level appears to be providing near-term support, and the market will be watching closely to see whether it holds. A breakdown below that area could open the way toward the 0.75 level. Over the longer term, there is a strong possibility that the Swiss National Bank may step in to curb further franc appreciation, though any intervention would more likely begin in the euro–Swiss franc pair rather than in USD/CHF itself.
Bitcoin (BitfinexUSD) is rebounding from its weekend slide, trading above the $67,000 mark as investors process a dramatic shift in Middle Eastern geopolitics.
The bounce comes after intense volatility sparked by coordinated U.S. and Israeli strikes on Iran. President Donald Trump stated that the operation led to the death of Supreme Leader Ayatollah Ali Khamenei. Although Tehran initially rejected the reports, Iranian state media later confirmed his death, triggering sharp reactions across global financial markets.
As highlighted in Saturday’s analysis, Bitcoin has a consistent pattern of sharply dropping on unexpected geopolitical shocks before stabilizing. That pattern appears to be unfolding again. After falling to nearly $63,000 yesterday, the cryptocurrency has gradually attracted renewed capital flows as the initial wave of panic selling eases.
Ethereum and XRP are also participating in the broader recovery. ETH/USD has moved back toward the $2,000 level, while XRP is trading near $1.40, with investors anticipating a key March 1 deadline that could bring greater regulatory clarity in the United States.
Regime change dynamics and shifting sentiment
Khamenei’s death was a decisive and largely unforeseen development. The swift return of buyers into Bitcoin reflects a growing belief among traders that the most severe phase of military escalation may have already passed.
At the same time, optimism is tempered by uncertainty surrounding the power vacuum in Tehran. As Iran’s highest authority for decades, Khamenei’s absence leaves open questions about the country’s leadership transition and broader regional stability.
President Trump’s remarks encouraging Iranians to “reclaim their country” indicate that Washington may be aiming for structural regime change. For crypto investors, the coming days represent a critical period of observation. If Iran manages a controlled leadership transition without broadening the conflict, Bitcoin’s rebound could remain intact. However, a drawn-out internal or regional confrontation could quickly pressure the $67,000 support level once more.
Escalation risks and Bitcoin’s “safe haven” debate
Despite the recovery, the possibility of a wider regional conflict persists. Iran’s Revolutionary Guards have reportedly carried out strikes against neighboring states hosting U.S. forces, and casualties have been reported following retaliatory action involving Israel. This ongoing cycle of retaliation continues to unsettle institutional crypto participants.
The central issue now is whether Bitcoin can genuinely function as a “digital gold” hedge during geopolitical crises — or whether it will keep behaving like a high-beta technology asset that reacts sharply to shifts in global risk sentiment.
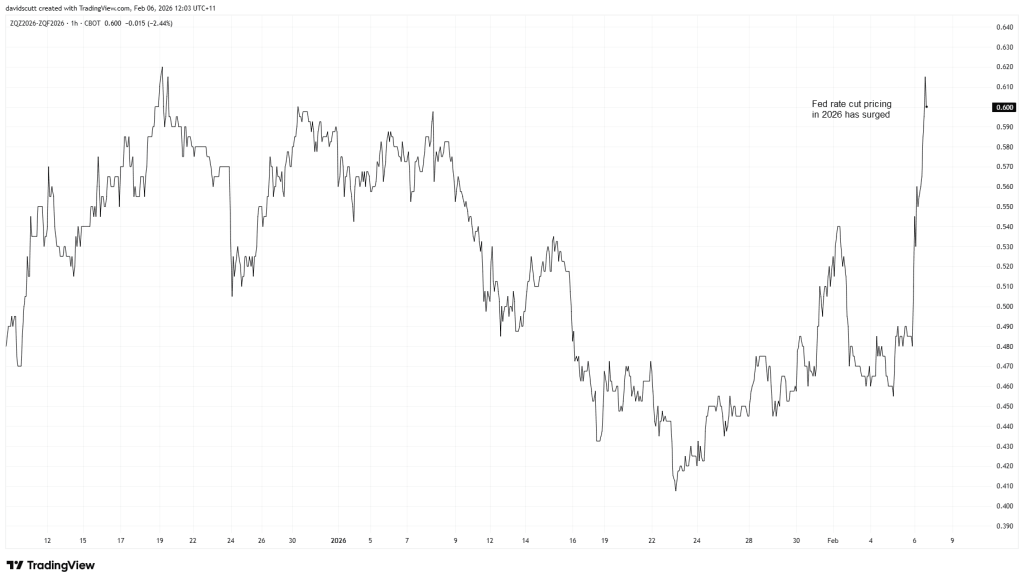
Indices: Tech Drags as Futures Edge Lower Before PPI
U.S. equity futures slip slightly after a weak session led by semiconductor losses. The tech-heavy Nasdaq 100 (-1.2% to 25,034) paced declines, followed by the S&P 500 (-0.5% to 6,908), while the Dow 30 (flat at 49,499) avoided closing in the red. Treasury yields eased across the curve, with the 10-year hovering near the 4% threshold, as investors await January PPI data. CME FedWatch pricing still points to rate cuts in July and October as the base case.
Stocks: Chip Selloff; Media Takeover Saga Nears Conclusion
Nvidia (-5.5%) slid despite beating earnings and revenue expectations, dragging the broader semiconductor space lower, including AMD (-3.4%), Intel (-3%), and ASML (-4.1%).
The contest for Warner Bros Discovery (-1.7% AH) appears to be wrapping up, with Netflix (+8.5% extended) stepping aside after Paramount Skydance (+10% close; +6.2% AH) presented a stronger bid.
Block (+23.6%) surged in extended trading after earnings and announcing plans to cut over 4,000 jobs.
IonQ (+21.7%) rallied on upbeat revenue guidance, with Morgan Stanley lifting its price target.
Meta (-0.7% AH) dipped after reports its in-house chip project faced hurdles and that it struck a deal to lease Google TPUs for AI development.
PayPal (-3.7%) declined after denying talks of a potential sale.
Meme stock movers included Beyond Meat (+2.9%), GoPro (+3.3%), Krispy Kreme (+27.8%), Opendoor (+8.6%), and BlackBerry (+2.6%).
Earnings Highlights:
Dell Technologies beat on both earnings and revenue; shares rose 11.6% after hours.
Zscaler missed on deferred revenue and billings; shares fell 9.5% AH.
Synopsys disappointed with full-year guidance; shares dropped 5.2%.
Rolls-Royce beat expectations, raised its profit outlook, and announced £2.5bn in buybacks; shares closed up 5.2%.
Baidu missed revenue forecasts; shares slid 5.7%.
Commodities:
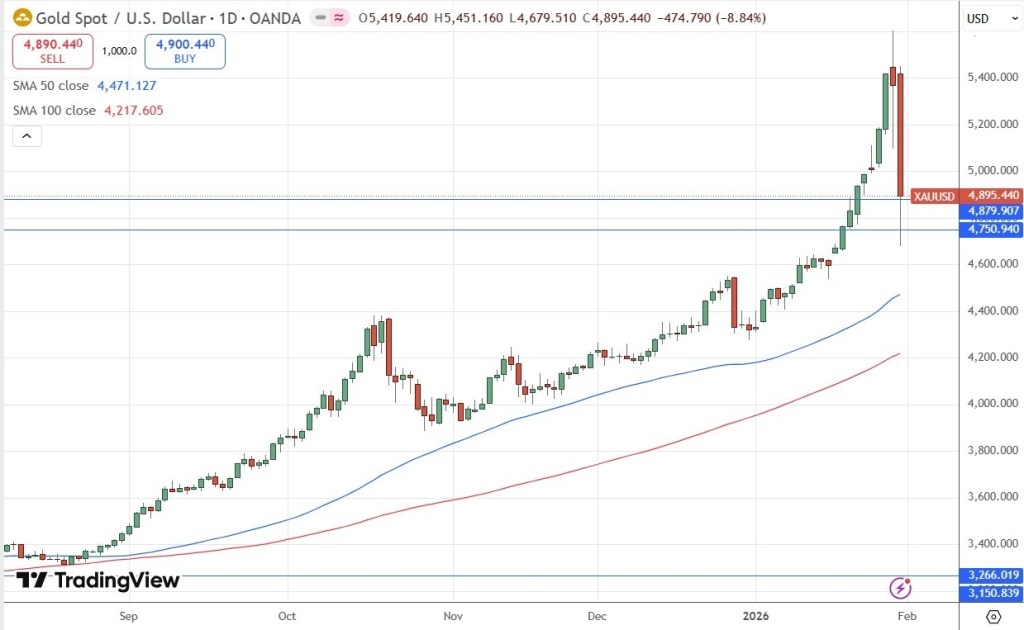
Gold volatility eased as prices hovered near $5,200 but failed to sustain gains above that level, amid geopolitical uncertainty and a firmer dollar. Silver reclaimed $90, narrowing the gold/silver ratio below 58. The World Gold Council flagged stretched valuations.
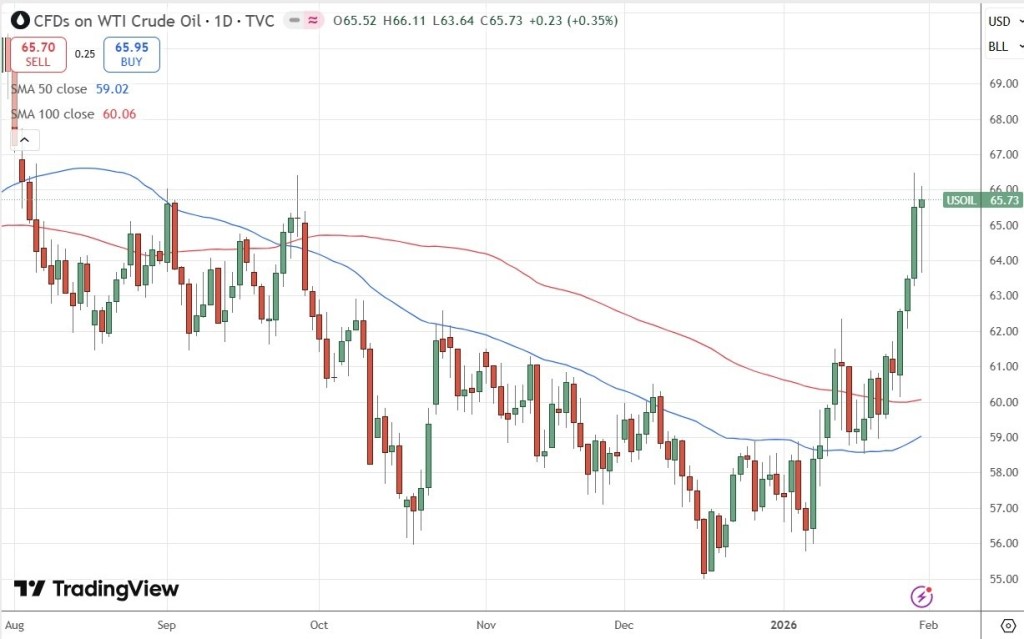
WTI crude steadied around $65 after elevated intraday swings, with attention on Geneva talks and lingering U.S. military rhetoric. Traders are also focused on Sunday’s OPEC+ meeting amid speculation of a possible April output increase.
FX / Central Banks / Crypto:
Bitcoin retreated toward $68K, while Ether remained above $2K.
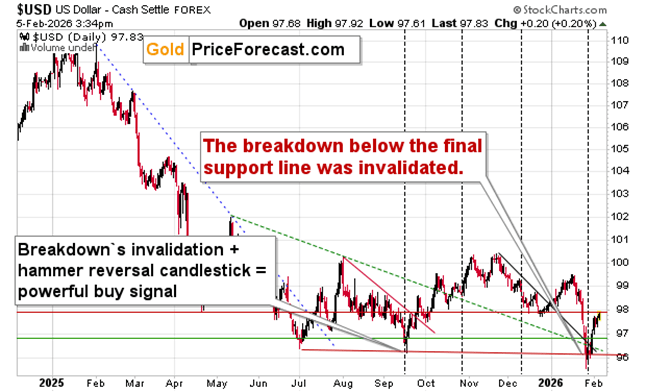
The U.S. Dollar Index firmed back into the 97 area, reversing prior losses on stronger labor data and reduced expectations for near-term Fed easing.
Fed officials offered mixed signals: Miran backed four quarter-point cuts this year, while Goolsbee cautioned against easing too quickly before inflation cools.
ECB President Lagarde reiterated inflation is expected to return to the 2% target over the medium term, emphasizing a data-dependent approach and monitoring — not targeting — FX markets.
Data: Stronger-Than-Expected Labor Figures
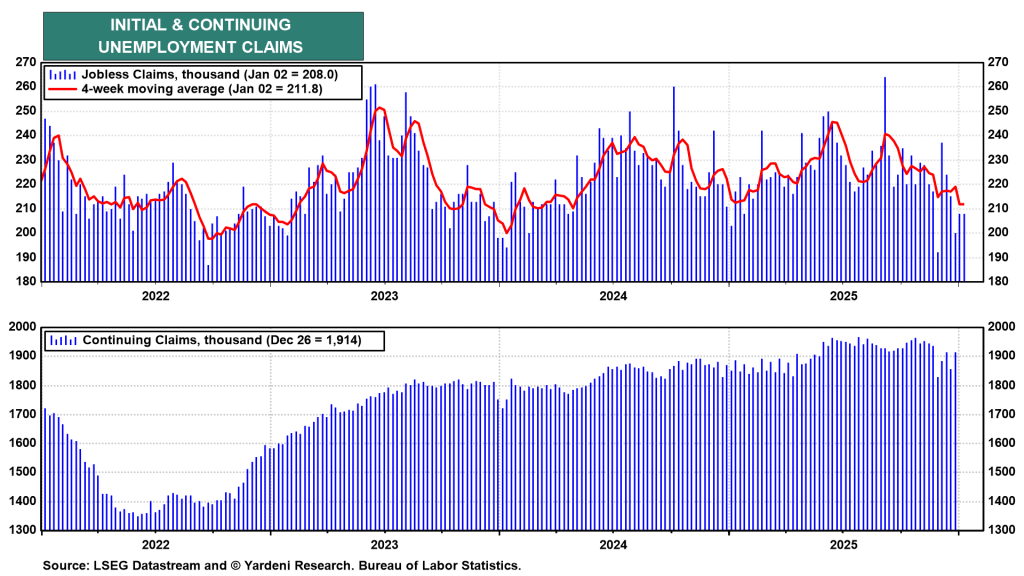
U.S. initial jobless claims came in at 212K (vs. 217K forecast), with continuing claims falling to 1.833m. Kansas Fed manufacturing improved sharply to 10 from -2.
Tokyo headline CPI rose to 1.6% y/y, though core measures eased. Retail sales rebounded 1.8% y/y, while industrial production disappointed at 2.2% growth (vs. 5.3% expected).
Ahead:
U.S. PPI, Chicago PMI, and Baker Hughes rig count data due later today.
In Europe, German preliminary CPI, import prices, and labor data.
Saturday: Earnings from Berkshire Hathaway.
Sunday: OPEC+ meeting to determine April output levels.
Bitcoin declined on Friday, halting a recovery from its midweek lows as investor risk appetite stayed weak. The world’s largest cryptocurrency is now on track for a fifth straight month of significant losses.
The broader crypto market moved largely in line with Bitcoin and is also poised for steep losses in February, as both retail and institutional investors continued to avoid the sector.
By 00:48 ET (05:48 GMT), Bitcoin was down nearly 1% at $67,788.0.
Bitcoin on track for fifth straight monthly decline
Bitcoin was down nearly 14% in February, as the risk-off sentiment in the crypto market showed little sign of easing throughout the month.
Rising geopolitical tensions worldwide, uncertainty surrounding major global economies, and concerns over further disruptions from U.S. trade tariffs kept investors cautious and away from speculative assets like cryptocurrencies.
The digital asset dropped as much as 50% from its October record high earlier this month, though it has since staged a modest recovery from those lows.
Bitcoin has remained in a sustained downtrend since October, with purchases by major corporate holder Strategy doing little to stem the losses.
Strategy has also reportedly slowed its pace of Bitcoin acquisitions in recent months, amid mounting concerns that continued price declines could force the company to sell part of its holdings to service its debt.
MARA Holdings jumps as AI deal eclipses weak Q4 results
Shares of MARA Holdings — previously known as Marathon Digital (NASDAQ: MARA) — surged Thursday evening after the Bitcoin mining company revealed a partnership with Starwood Capital to repurpose several of its mining facilities into artificial intelligence data centers. The stock climbed as much as 17% in after-hours trading.
The announcement helped eclipse a steep $1.7 billion loss in the fourth quarter, driven by an extended slump in Bitcoin prices that severely pressured the firm’s mining profitability. Revenue also came in below expectations.
Amid continued weakness in Bitcoin and growing investor enthusiasm around AI, MARA has recently been shifting strategy, aiming to redeploy its computing infrastructure toward AI data center operations rather than focusing solely on cryptocurrency mining.
Crypto prices today: Altcoin recovery fades, February losses loom
Crypto markets retreated on Friday, giving back much of this week’s brief rebound, with most tokens on track to post steep declines for February.
The world’s second-largest cryptocurrency, Ethereum, slipped 1.2% to $2,038.21 and was heading for a monthly drop of nearly 17%. The token faced additional pressure after co-founder Vitalik Buterin sold more of his holdings, reinforcing cautious sentiment across the market.
XRP fell 2.3% and was poised to lose around 15% in February, while BNB held steady on Friday but remained down close to 20% for the month.
Solana was also nursing losses of roughly 17% in February, whereas Cardano traded largely unchanged. In the meme coin segment, Dogecoin declined 5.4% for the month, while Official Trump tumbled about 20% over the same period.
Bitcoin’s latest decline is unfolding amid mounting macroeconomic headwinds and crypto-specific pressures, fueling fears that the downtrend could deepen, with some analysts eyeing a potential floor near $45,000.
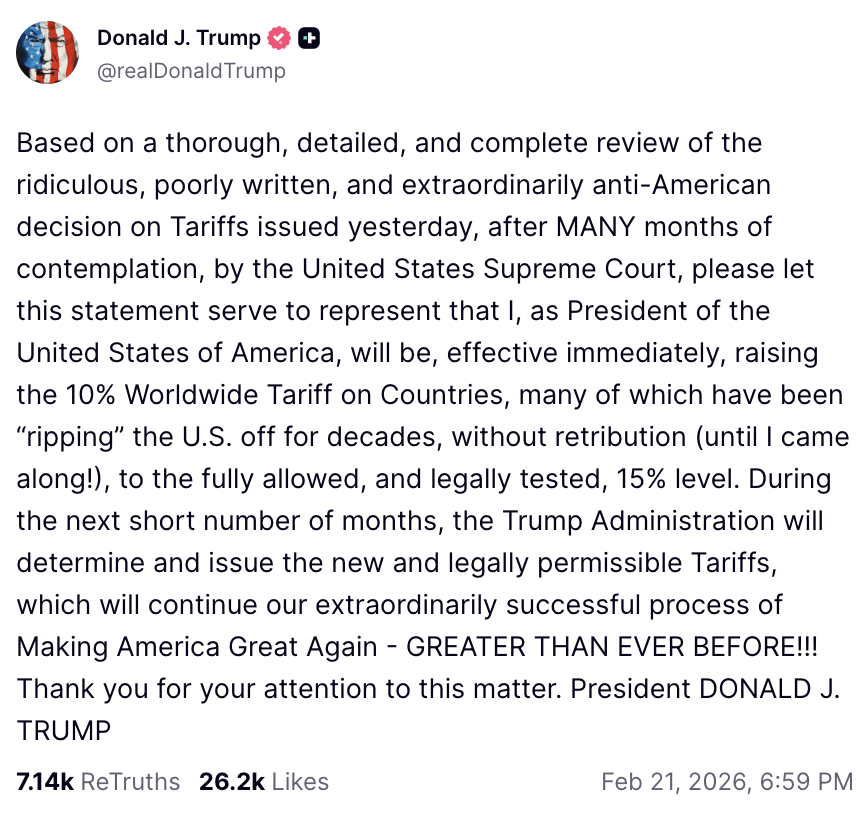
Trump’s 15% Global Tariff Weighs on BTC
On Saturday, February 21, US President Donald Trump unveiled a 15% blanket tariff on imports, jolting global financial markets — cryptocurrencies included. The move followed a decision by the US Supreme Court to overturn his earlier sweeping tariff measures. The revised levy, initially proposed at 10% before being lifted to 15%, officially comes into force today, February 24, 2026.
Activated under Section 122 of the Trade Act of 1974, the new tariff covers the majority of imported goods for an initial 150-day period, with any extension subject to congressional approval. Although intended to narrow trade imbalances, the measure has heightened economic uncertainty, triggering a widespread retreat from risk-sensitive assets.
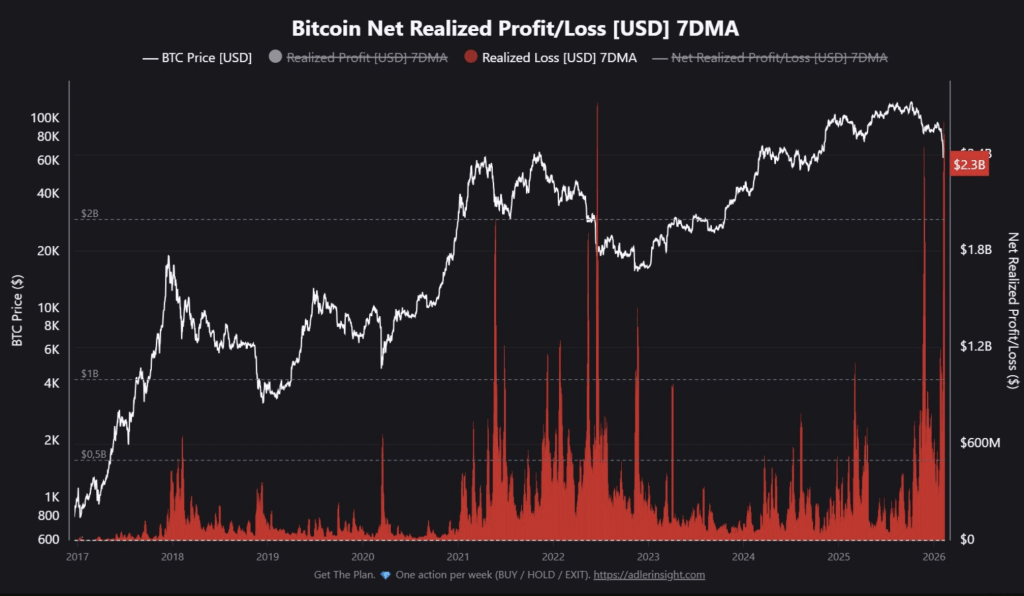
Within the crypto market, the development has reinforced a risk-off mood, as investors rotate out of volatile positions into safer havens. Bitcoin holders are increasingly realizing losses, with on-chain figures indicating more than $2.3 billion in realized losses over the past week.
Crypto analyst IT Tech described the move as one of the most significant capitulation phases in Bitcoin’s history, comparing it to the 2021 market crash, the 2022 Luna/FTX collapse, and the mid-2024 correction. In a post on X, he noted that the scale of losses ranks among the top three to five worst drawdowns ever recorded, adding that only a few moments in Bitcoin’s history have witnessed such intense capitulation.
The reaction reflects mounting concerns that higher import costs could reignite inflationary pressures, potentially forcing the Federal Reserve to delay rate cuts and keeping financial conditions tighter for longer.
Markets sold off swiftly following the announcement, with Bitcoin sliding intraday to below the $63,000 mark.
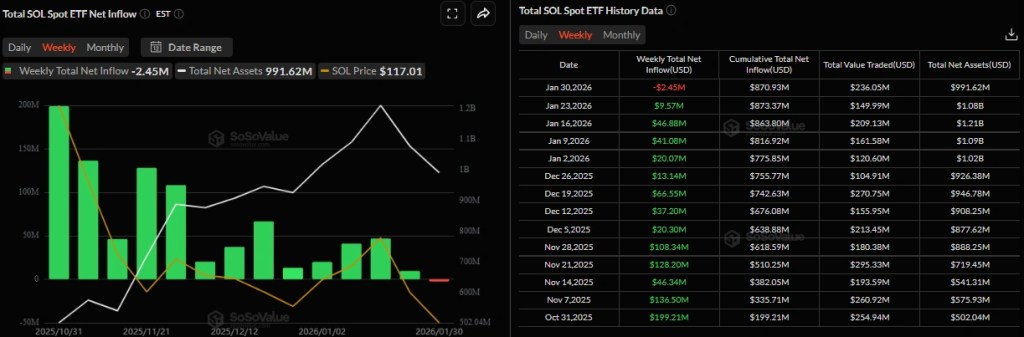
Spot Bitcoin ETFs Extend Outflow Streak to Five Weeks
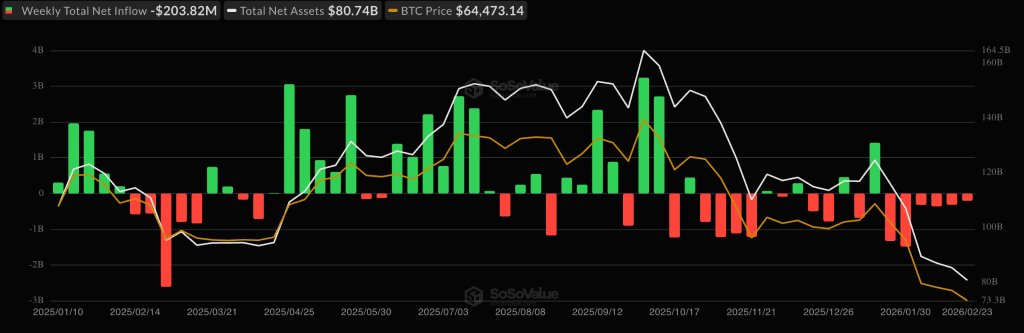
Adding to the tariff-driven volatility, U.S.-listed spot Bitcoin ETFs have now recorded five consecutive weeks of net outflows — the longest stretch of withdrawals since February 2025.
Data from SoSoValue shows that nearly $3.8 billion has exited these funds over the five-week period, including $316 million in redemptions last week alone.
BlackRock’s iShares Bitcoin Trust (IBIT) accounted for the largest share of the withdrawals, losing roughly $2.1 billion during the streak. Fidelity Investments’ Fidelity Wise Origin Bitcoin Fund (FBTC) and several other products also saw notable outflows.
The sharp reversal from the strong inflows seen in late 2024 highlights a cooling in institutional appetite, as portfolio managers trim crypto exposure amid heightened macro uncertainty and broader market turbulence.
The persistent ETF withdrawals are intensifying sell-side pressure on Bitcoin, as fund managers are forced to offload underlying BTC holdings to satisfy investor redemptions.
With total net outflows reaching $4.5 billion so far in 2026, much of the earlier inflow momentum has been erased. Analysts describe the environment as a “risk-off stress test,” where macro headwinds — including tariffs and geopolitical tensions — are discouraging fresh allocations into crypto.
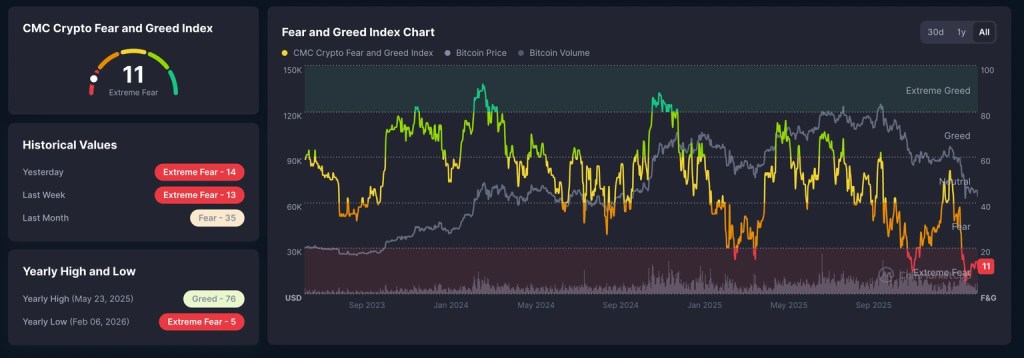
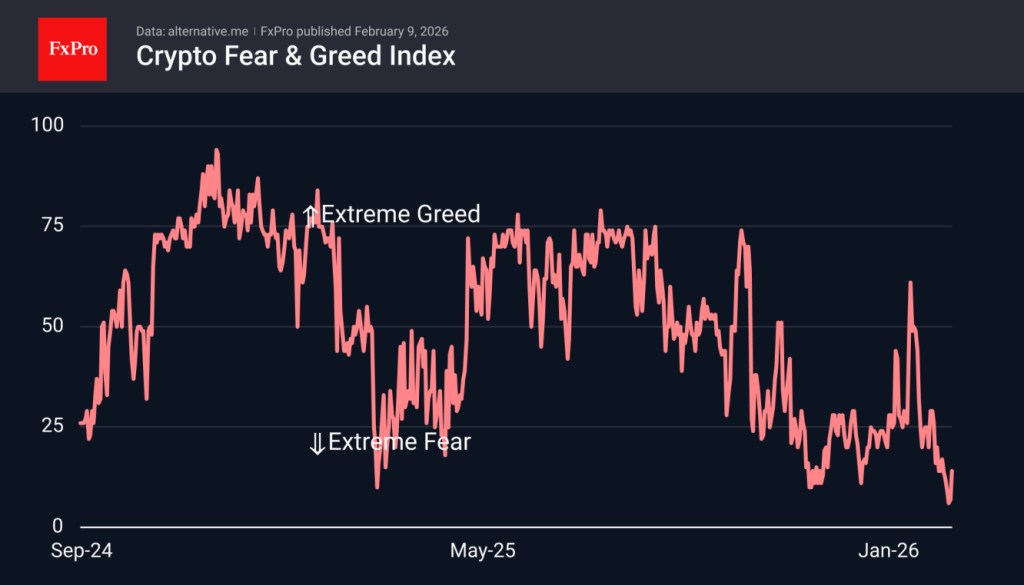
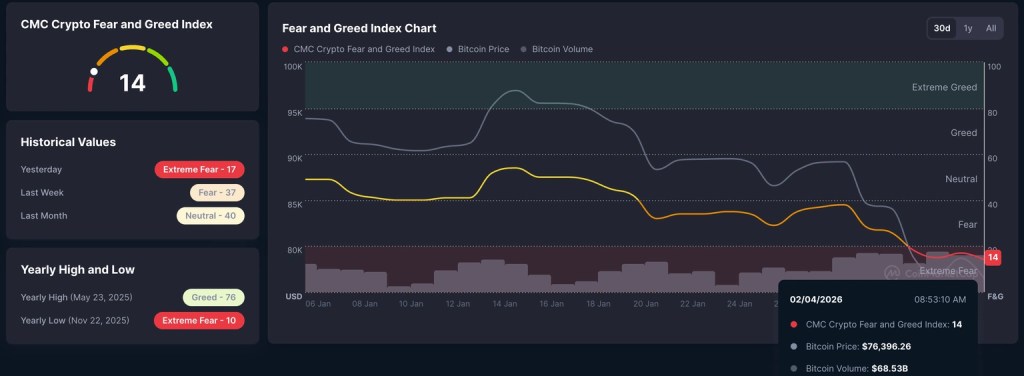
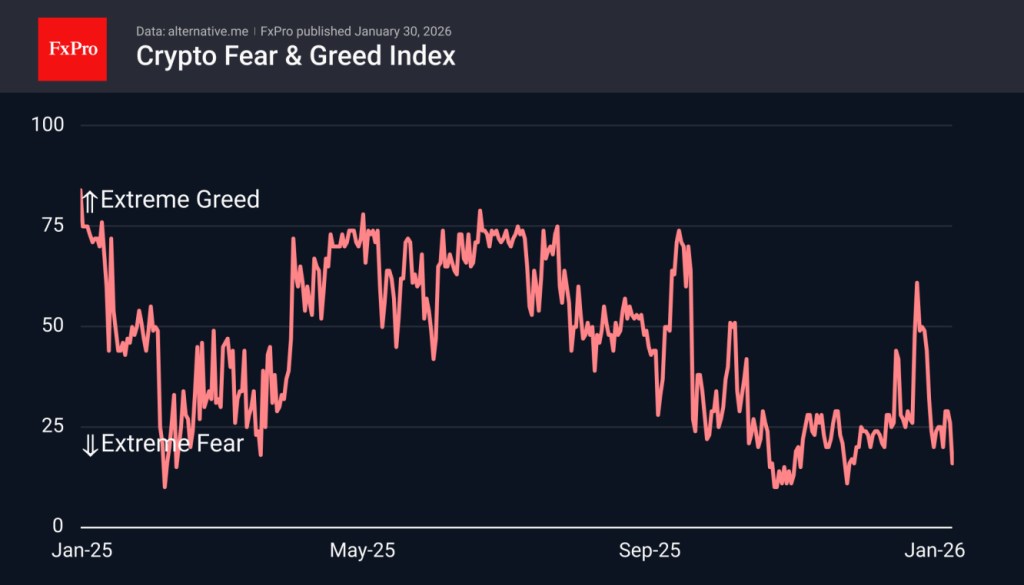
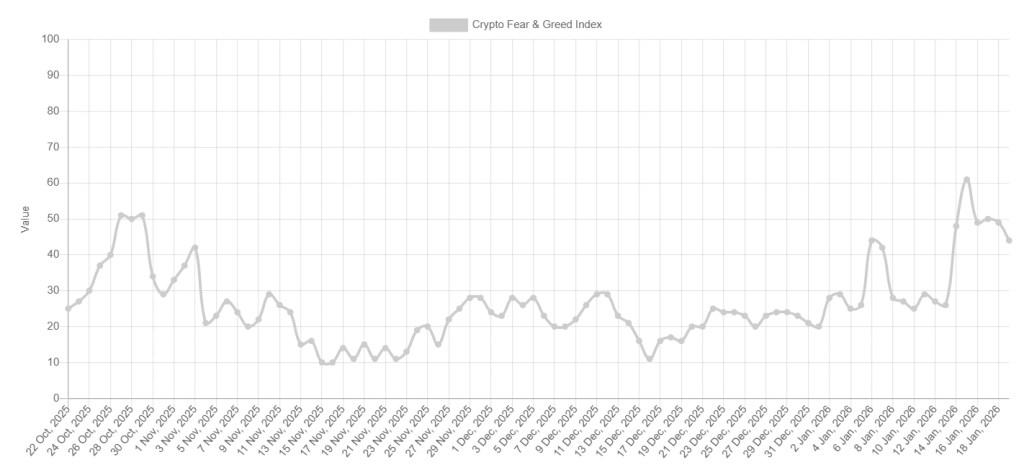
Sentiment indicators reflect the strain. The Crypto Fear & Greed Index has plunged to one of its most extreme fear readings on record, reinforcing the ongoing wave of liquidation. Unless ETF flows stabilize or reverse, downside momentum may continue, particularly if institutional distribution remains dominant.
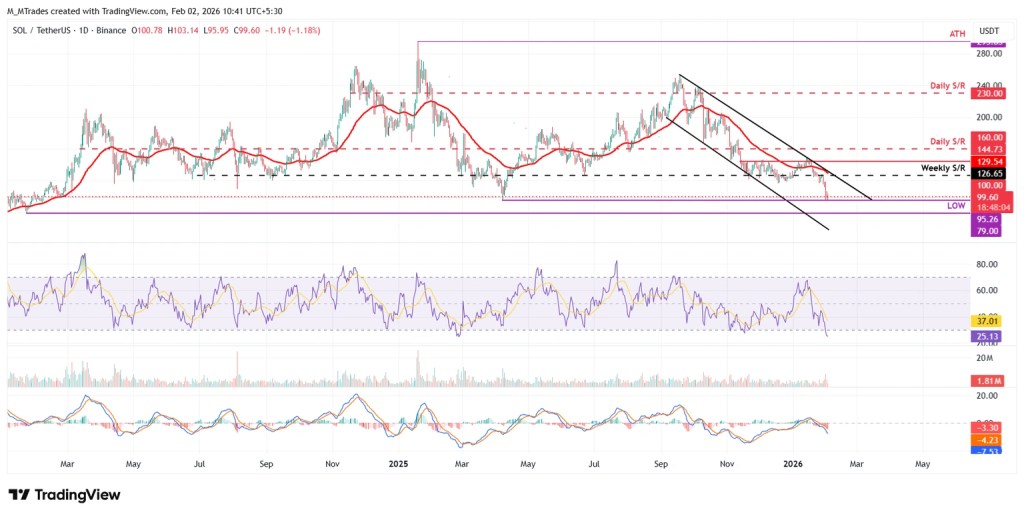
Bear Pennant Signals $45K Target for Bitcoin
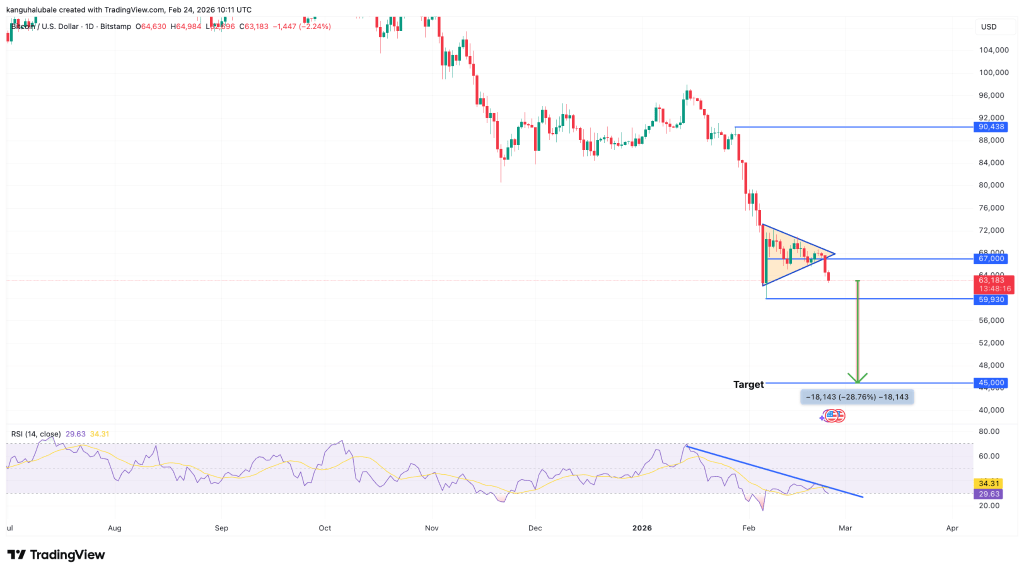
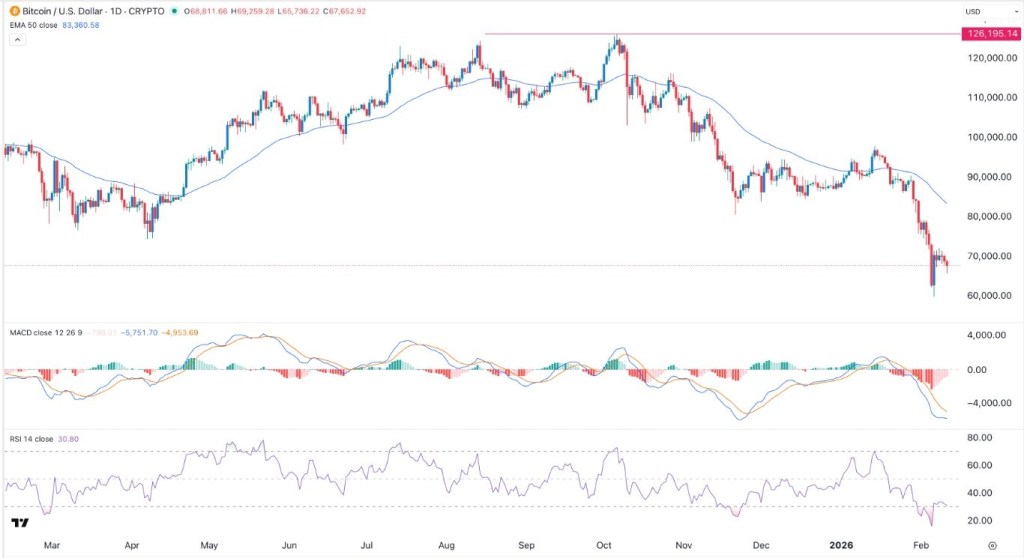
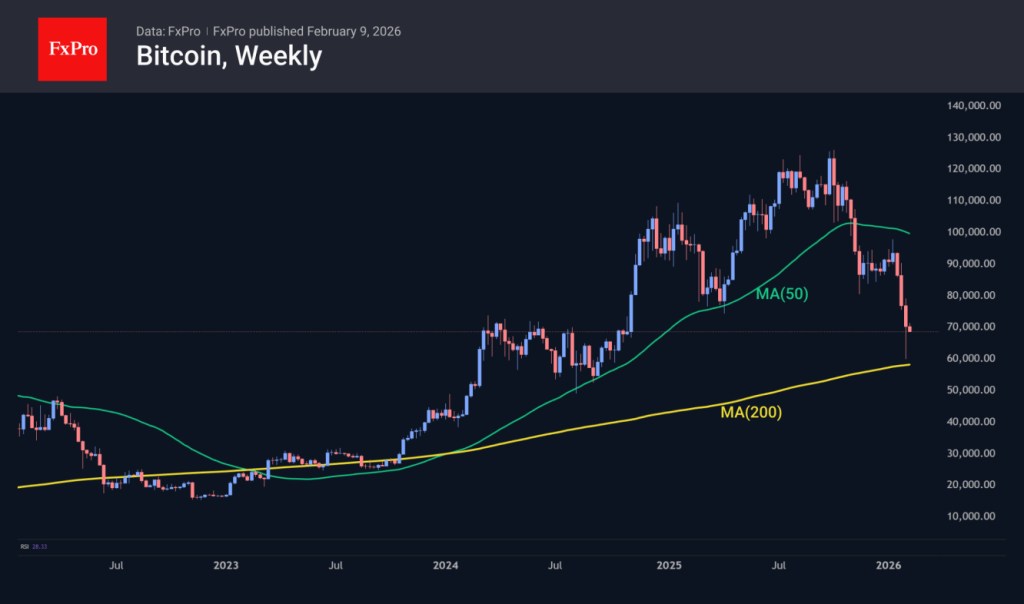
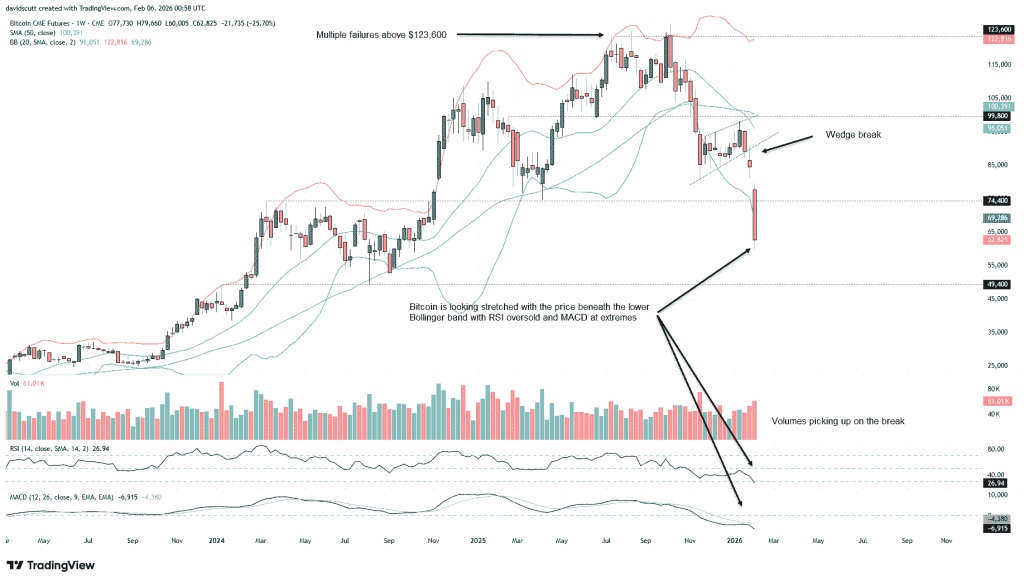
From a technical perspective, Bitcoin’s chart structure remains bearish, with a well-defined bear pennant forming on the daily timeframe.
A bear pennant is a continuation pattern that follows a steep decline (the flagpole), then consolidates within a tightening symmetrical triangle before typically breaking lower.
The BTC/USD pair fell below a major support level at $80,117 — its November 2025 low — and slid to $60,000 on February 6, forming the flagpole. A rebound toward $72,000 followed, before price retreated again to around $63,100.
The pattern confirmed on Monday when Bitcoin broke beneath the pennant’s lower trendline near $67,000. Based on the measured-move technique — projecting the height of the flagpole from the breakout point — the downside target falls in the $45,000–$50,000 range.
A drop toward $45,000 would imply roughly a 28% decline from current levels, underscoring the risk of further capitulation if macro and flow dynamics fail to improve.
The bearish outlook is reinforced by strengthening downside momentum, with the RSI sliding from overbought territory near 70 on January 15 to around 29 currently — signaling growing selling pressure and near-oversold conditions.
Bitcoin continues to trade below key moving averages, keeping the broader technical structure fragile. A decisive break beneath the $60,000 threshold could intensify losses, opening the door toward the $52,450 realized price level — a historically significant support area.
On the other hand, a sustained move above $72,700 would invalidate the bear pennant setup and could shift momentum back in favor of the bulls, paving the way for a broader recovery.
Bitcoin fell again on Tuesday, deepening its recent slide and now trading roughly 50% below its October record high, as uncertainty surrounding U.S. tariff policy dampened risk appetite for digital assets.
The world’s largest cryptocurrency slipped 0.9% to $64,169.6 by 17:35 ET (22:35 GMT), after touching an intraday low of $62,650.1.
Broader crypto markets also remained under pressure, with both institutional and retail investors continuing to reduce exposure. Escalating geopolitical tensions involving Iran, along with an AI-driven selloff on Wall Street, further weighed on sentiment.
Bitcoin down 50% from peak
With Tuesday’s losses, Bitcoin is now trading about half below its early-October all-time high of $126,186.
The cryptocurrency has been in a sustained downturn since that peak, as fresh U.S. regulatory measures and ongoing purchases by major corporate holder Strategy failed to meaningfully support prices.
On Monday, Strategy revealed it had acquired an additional 592 Bitcoin. However, the firm is currently facing significant unrealized losses, as Bitcoin trades below its reported average purchase price of $76,020.
On-chain data from CryptoQuant and Coinglass indicated that large holders—commonly known as “whales”—continued transferring substantial amounts of Bitcoin to exchanges, suggesting further selling pressure.
Meanwhile, major buyers appear scarce. Data from Glassnode showed institutional investors recorded a fifth straight week of net outflows from U.S. spot Bitcoin ETFs as of Monday.
Iliya Kalchev of Nexo Dispatch noted that U.S. spot Bitcoin ETFs saw around $203 million in net outflows on Monday alone. At the same time, derivatives markets still show demand for downside hedging, while long-term holders have not signaled broad capitulation—leaving Bitcoin in what he described as a fragile balance between visible pressure and underlying structural conviction.
He highlighted the $60,000–$72,000 range as the key near-term zone. If ETF flows stabilize and macro volatility subsides, the range could form a base. But if outflows continue, focus may shift toward the realized price area near $55,000 as the next major reference point.
Tariff uncertainty adds pressure
Bitcoin’s latest weakness was largely driven by renewed uncertainty over U.S. trade policy after the Supreme Court struck down much of President Donald Trump’s tariff framework.
In response, Trump announced new universal tariffs of 15% under a different legal authority, though the initial rate implemented at midnight Tuesday was 10%. The president now faces additional legal hurdles in expanding tariffs but has shown little intention of retreating from his trade agenda, even warning that countries seeking to renegotiate trade deals could face higher duties.
Although cryptocurrencies are not directly tied to trade flows, they are highly sensitive to shifts in global risk sentiment. The uncertainty surrounding U.S. tariffs has triggered broader risk aversion across financial markets, spilling over into digital assets.
Altcoins follow Bitcoin lower
Most altcoins tracked Bitcoin’s decline, with the broader market showing little sign of relief from the ongoing downturn.
Ethereum slipped 0.1% to $1,857.78, hovering near early-February lows. XRP and BNB fell 0.2% and 1.9%, respectively, while Cardano declined 1.4%. Solana bucked the trend, rising 0.9%.
Among meme tokens, Dogecoin dropped 1.1%, while TRUMP gained 1.3%.
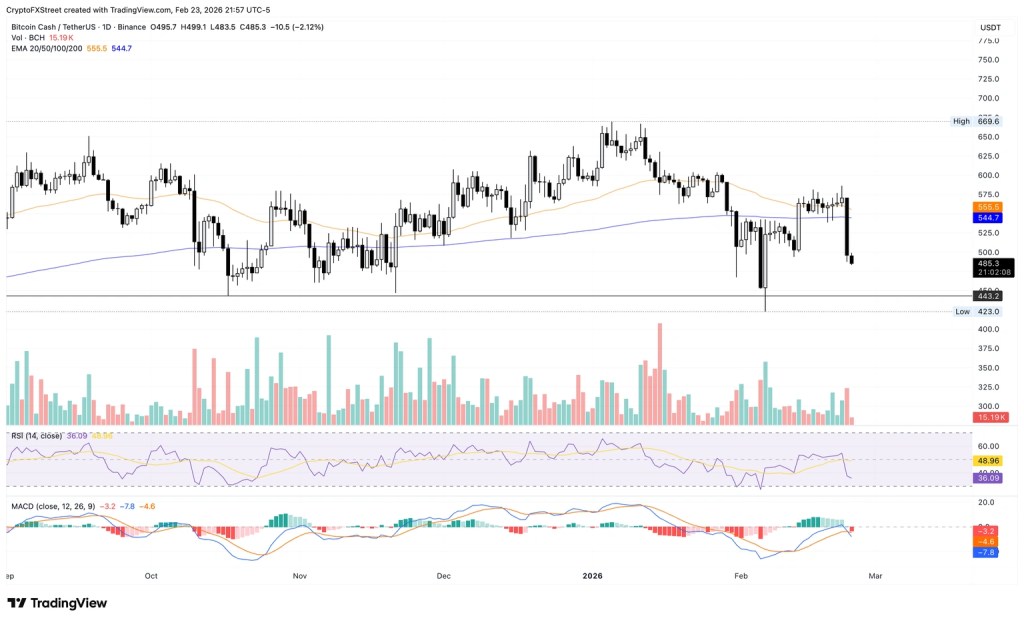
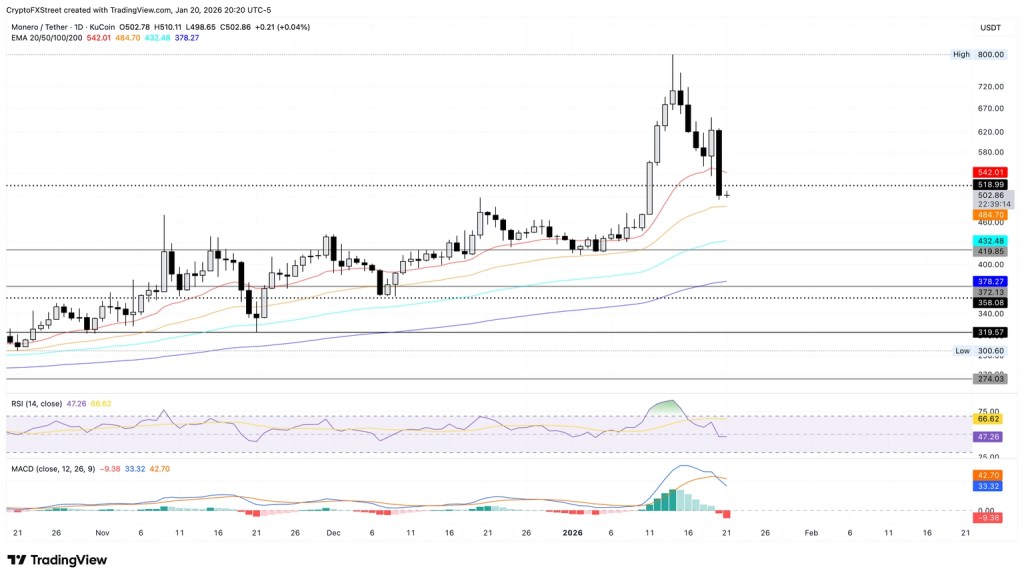
Bitcoin Cash slipped below the $500 mark on Tuesday, extending losses after plunging 13% in the previous session.
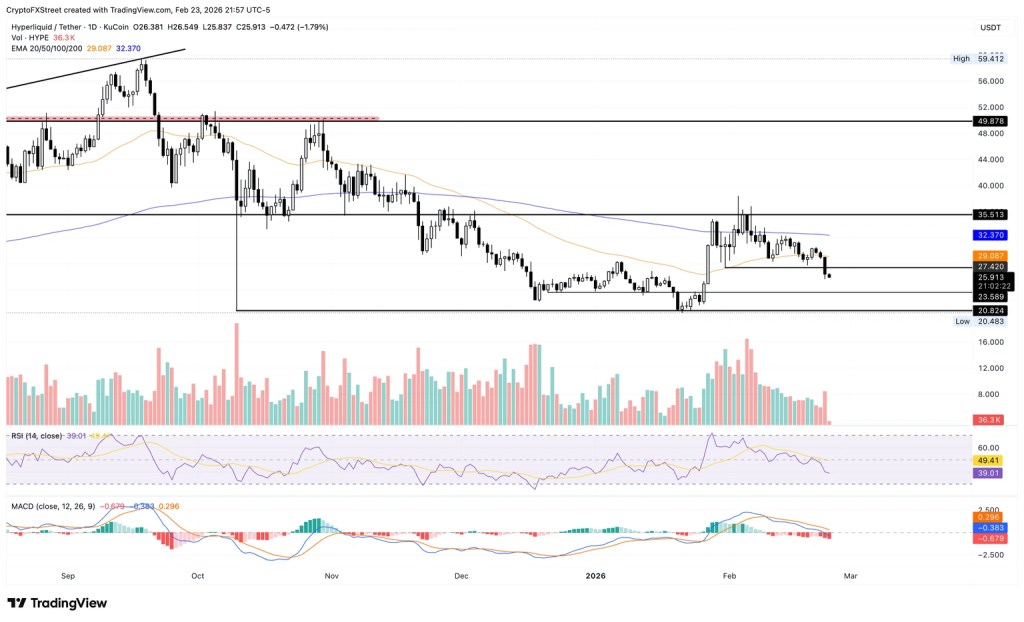
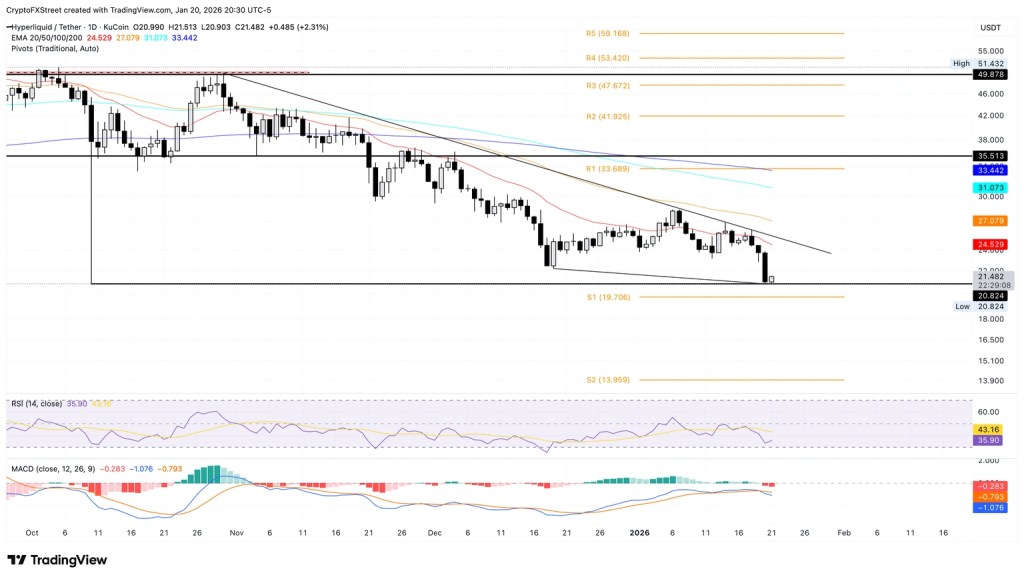
Hyperliquid fell another 1% on Tuesday, marking its fourth straight day of declines following Monday’s sharp 9% drop.
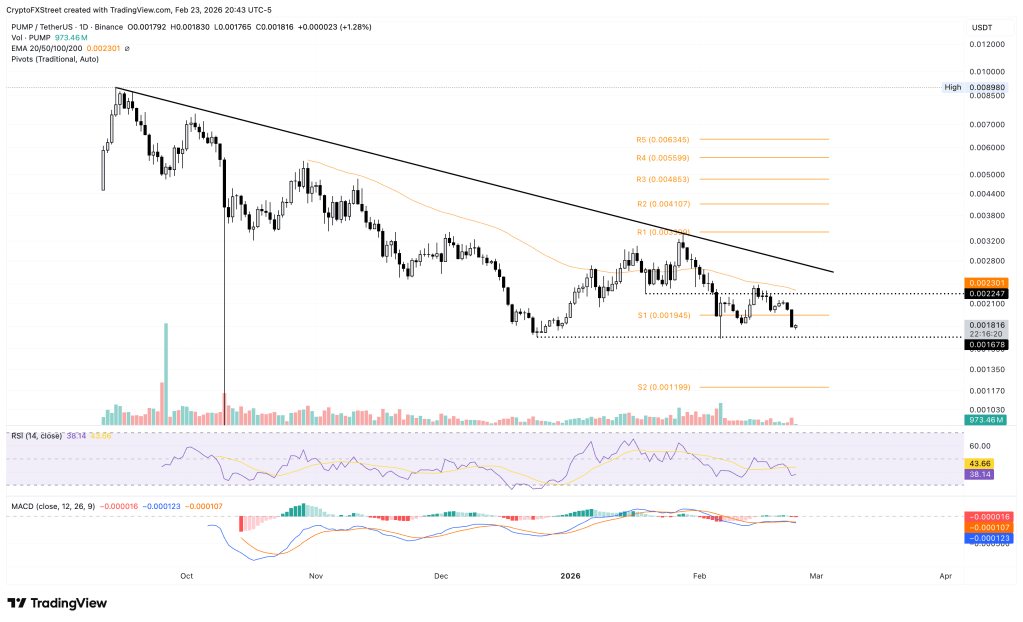
Pump.fun also came under pressure, sliding beneath a key psychological support level after tumbling 11% on Monday.
Altcoins such as Bitcoin Cash (BCH), Hyperliquid (HYPE), and Pump.fun (PUMP) have led declines over the past 24 hours as Bitcoin slipped below the $64,000 level on Tuesday. Technical indicators for BCH, HYPE, and PUMP point to further downside risks amid broad-based market selling.
The wider cryptocurrency market remains under strain as Donald Trump explores new legal avenues, citing national security concerns, to introduce additional tariffs. Meanwhile, U.S. equities ended Monday’s session in negative territory, adding to the cautious tone across risk assets.
CoinMarketCap’s Fear and Greed Index has dropped to 11, signaling extreme fear in the market and underscoring that sellers remain firmly in control.
Bitcoin Cash slips beneath the $500 mark
Bitcoin Cash was trading below the $500 level on Tuesday, extending losses after plunging 13% in the prior session. The altcoin has slipped beneath its 200-day Exponential Moving Average (EMA) at $544, while the 50-day EMA — now trending lower at $555 — is approaching a potential death cross formation.
Technically, the path of least resistance appears tilted to the downside, with the next key support seen around $443, corresponding to the October 17 low.
Daily chart indicators reinforce the bearish momentum shift. The Relative Strength Index (RSI) has dropped to 36, edging closer to oversold territory as selling pressure intensifies. Meanwhile, the Moving Average Convergence Divergence (MACD) has crossed below its signal line, signaling a bearish crossover.
BCH/USDT
If Bitcoin Cash reclaims the $500 psychological barrier with a strong daily close above it, selling pressure could begin to fade, potentially paving the way for a rebound toward the 200-day EMA near $544.
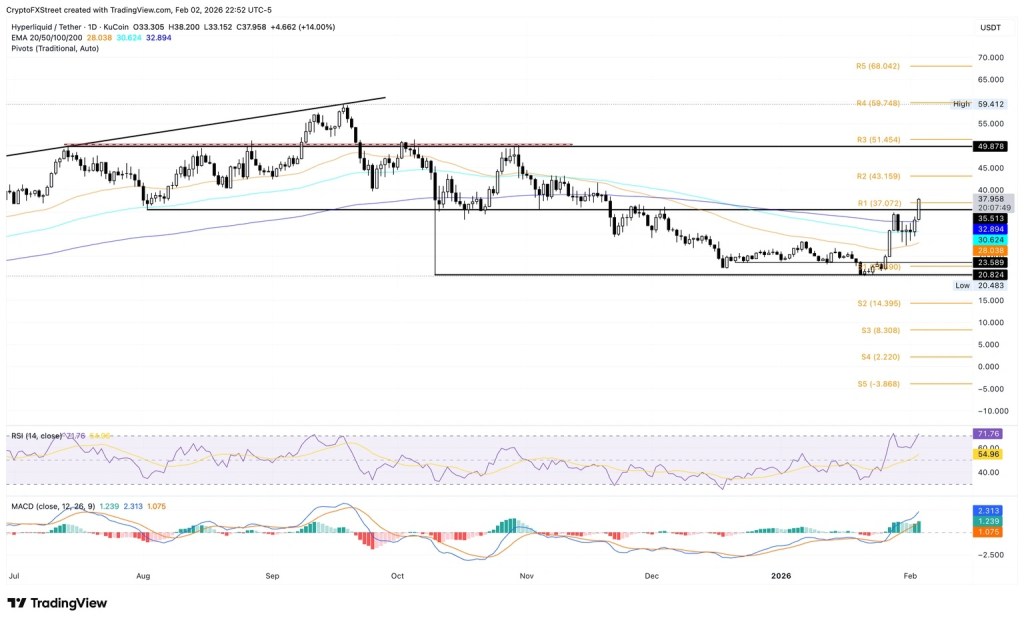
Hyperliquid was trading below $26 on Tuesday, extending losses after falling 9% in the previous session. The HYPE token has now declined for a fourth straight day and remains well under both its 50-day EMA at $29.08 and 200-day EMA at $32.37, reinforcing a bearish outlook.
On the daily chart, the Relative Strength Index (RSI) stands at 38 and continues to trend lower, with further room before entering oversold territory. Meanwhile, the Moving Average Convergence Divergence (MACD) and its signal line are steadily declining, with widening bearish histogram bars signaling strengthening downside momentum.
Immediate support levels are seen at $23.58, marking the December 21 low, followed by $20.82, the October 10 low.
HYPE/USDT
On the upside, Hyperliquid would need to break back above its 50-day EMA at $29.08 to revive short-term bullish momentum and signal the start of a potential recovery.
Pump.fun slides toward all-time low amid heavy selling
Pump.fun was trading around $0.001800 at the time of writing on Tuesday, after tumbling 11% in the previous session. The meme-coin launchpad token has continued its broader downtrend since late September and is now eyeing support at $0.001678 — a level that previously sparked a rebound on February 6.
A firm break and close below this support could open the door to further losses toward the S2 pivot at $0.001199.
Momentum indicators point to mounting downside pressure. The Relative Strength Index (RSI) sits at 37, hovering just above oversold territory and reflecting persistent selling interest. Meanwhile, the Moving Average Convergence Divergence (MACD) and its signal line have resumed a downward trajectory following a bearish crossover on Monday, indicating renewed negative momentum.
PUMP/USDT
If Pump.fun climbs back above the S1 pivot at $0.001945, it may pave the way for a move toward the 50-day EMA near $0.002300, potentially easing near-term bearish pressure.
Bitcoin falls beneath the lower boundary of its consolidation range on Monday, and a decisive close below this level could open the door to a more pronounced correction.
Ethereum drops under $1,900, marking a continuation of its six-week decline.
XRP dips below $1.40, unable to hold support at the lower edge of its trendline channel.
Bitcoin (BTC), Ethereum (ETH), and Ripple (XRP) continue to weaken on Monday after posting modest losses last week. BTC has slipped beneath the $65,000 consolidation floor, while ETH has fallen under $1,900, both marking a sixth consecutive week of declines. Meanwhile, XRP drops below $1.40, failing to hold support at its lower trendline — collectively signaling the risk of a deeper correction across the top three cryptocurrencies.
Bitcoin breaks below consolidation support
Bitcoin had been trading within a sideways range between $65,729 and $71,746 since February 7. On Monday, BTC moved below the lower boundary of this range, changing hands near $64,700.
A confirmed daily close beneath $65,729 would strengthen the bearish case and could open the path toward the next major support around $60,000.
On the daily chart, the RSI stands at 31, hovering close to oversold territory and reflecting strong downside momentum. Meanwhile, the MACD lines are tightening, suggesting growing indecision in the market.
BTC/USDT
However, if BTC manages to reclaim and hold above the $65,729 level, a rebound toward the upper boundary of the range at $71,746 remains possible.
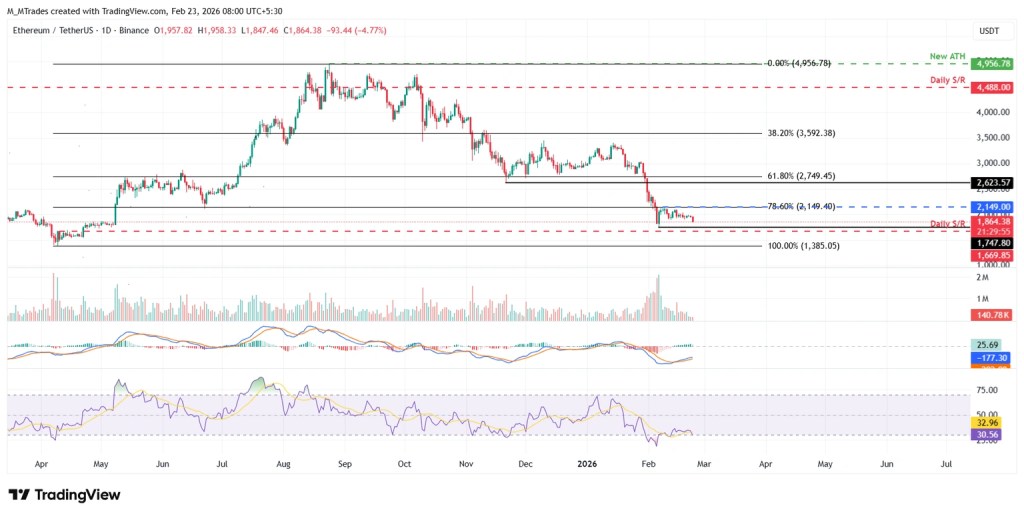
Ethereum extends its correction
Ethereum continued to edge lower last week, prolonging its slide that began in mid-January. As of Monday, ETH is down 4.77%, trading around $1,864.
A daily close beneath the lower consolidation boundary at $1,747 would reinforce the bearish outlook and could drive prices toward the next key support at $1,669.
Similar to Bitcoin, Ethereum’s RSI points to strengthening downside momentum, while the MACD lines are narrowing, reflecting growing uncertainty among market participants.
ETH/USDT
On the flip side, a recovery from current levels could see ETH rebound toward the upper end of its consolidation range near $2,149.
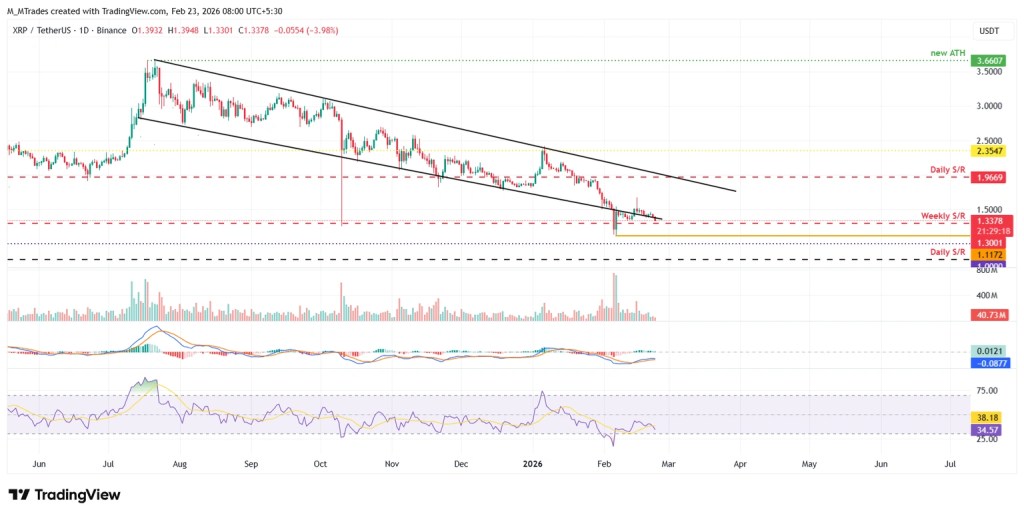
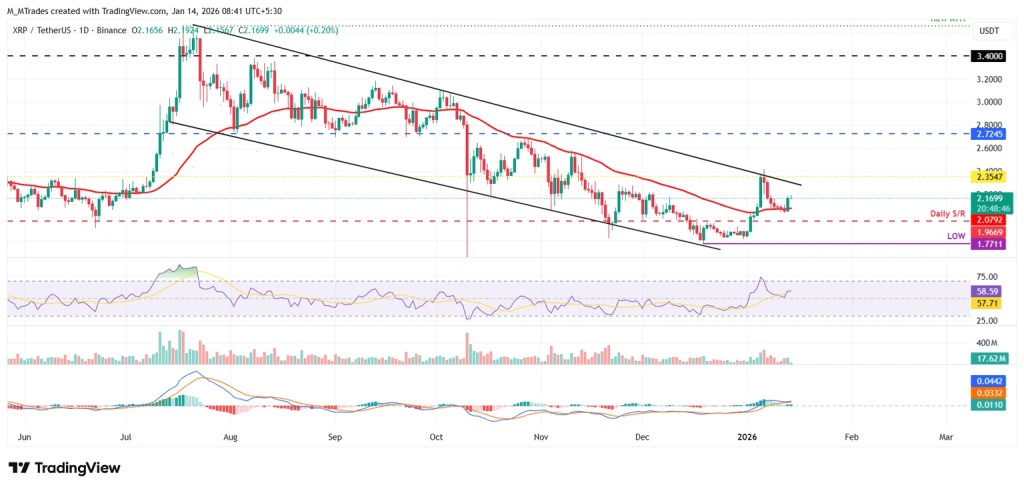
XRP deepens its pullback after breaking below key lower trendline support.
XRP is hovering below $1.40 on Monday after slipping beneath the lower boundary of a falling wedge pattern.
Should the pullback persist, the token may slide further toward the weekly support around $1.30.
Similar to Bitcoin and Ethereum, XRP’s RSI points to building bearish pressure, while the MACD lines are tightening, signaling trader uncertainty.
XRP/USDT
On the other hand, if price manages to reclaim and hold the lower trendline as support, a rebound toward the psychological $1.50 level could follow.
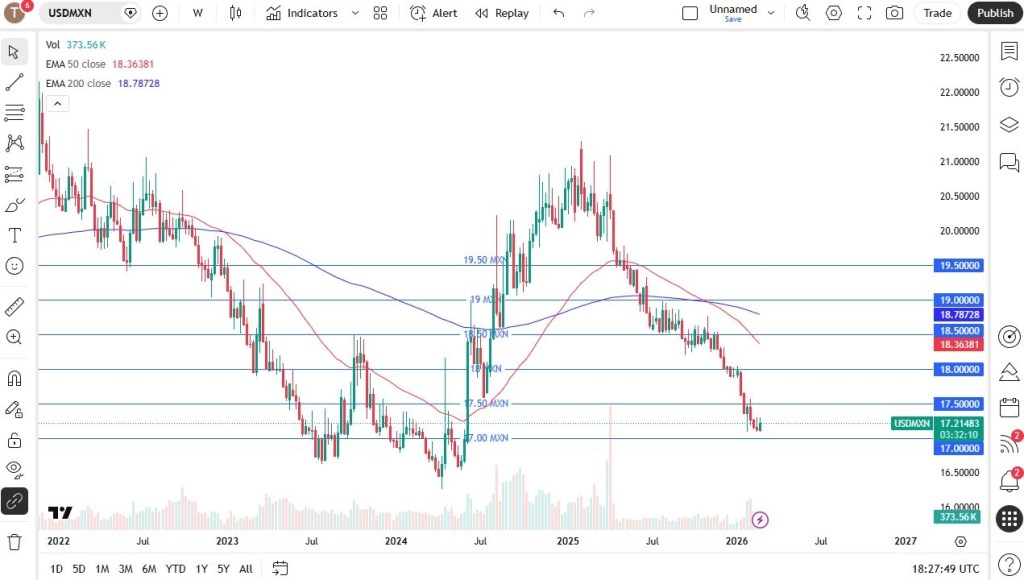
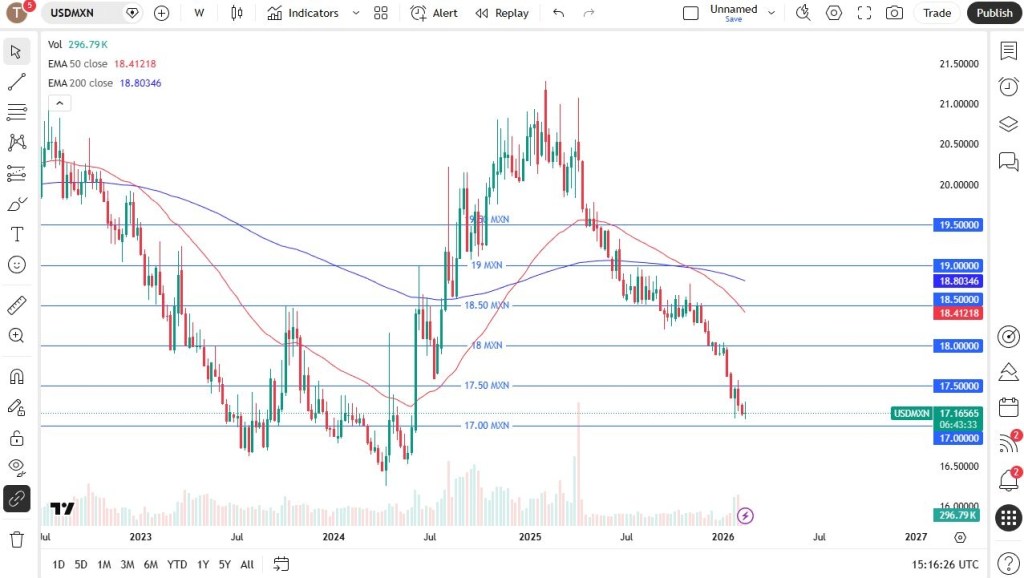
The US dollar at one stage surged sharply against the Mexican peso, but by week’s end it had given back some of those gains. The 17.00 area below continues to act as a key support zone, and a decisive break beneath it could open the door for a move toward 16.50.
While short-term bounces are possible, the broader setup suggests selling into strength. The 17.50 region remains a significant resistance barrier, and the wide interest rate differential still strongly favors the Mexican peso.
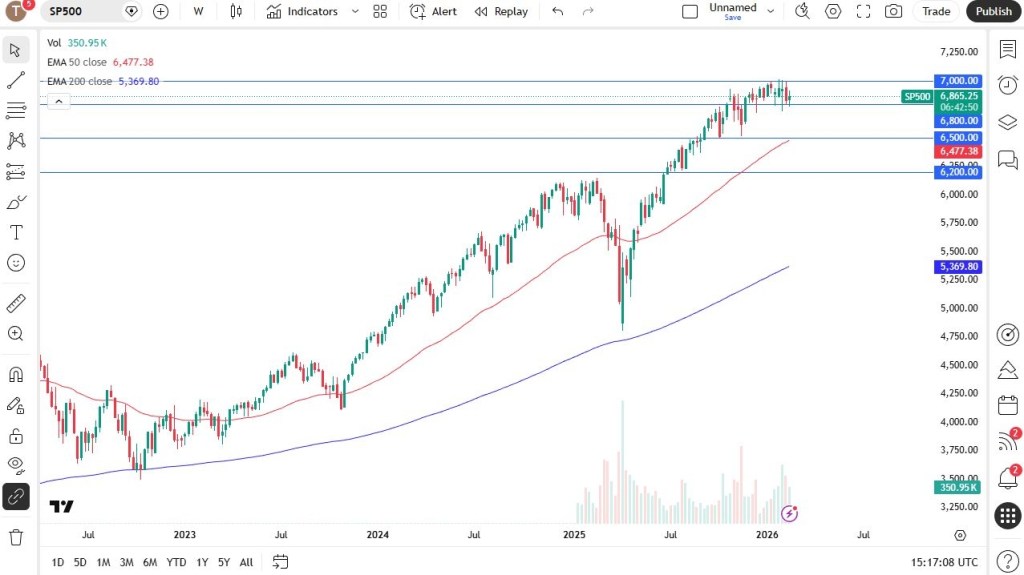
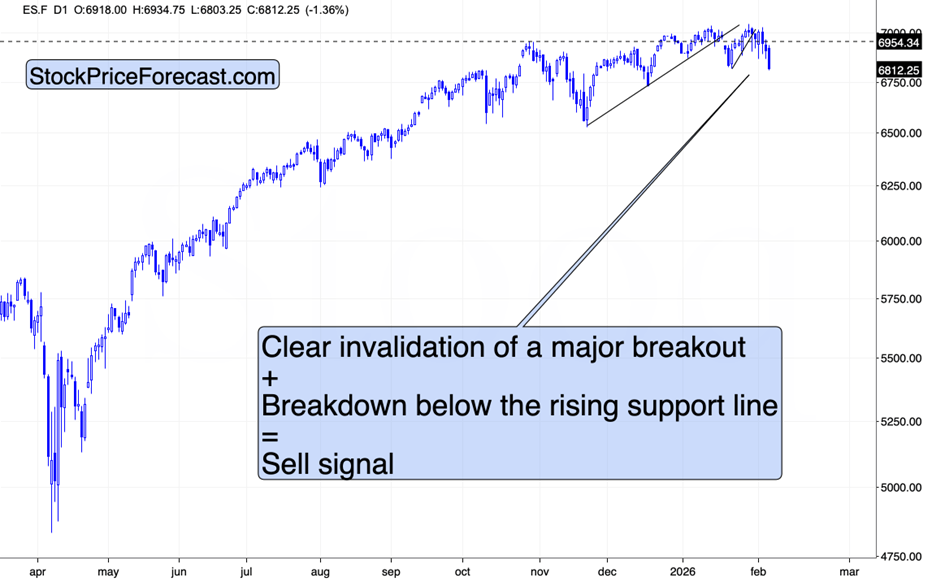
S&P 500
The S&P 500 pulled back early in the week but appears to be stabilizing as it continues to trade within a broader consolidation range. Since early December, price action has been confined between 6,800 and 7,000, suggesting a market building momentum for its next major move.
The bias still leans to the upside. A decisive daily close above 7,000 could trigger a stronger breakout and accelerate gains. On the other hand, a breakdown below 6,800 would signal a shift in tone and mark a more bearish development.
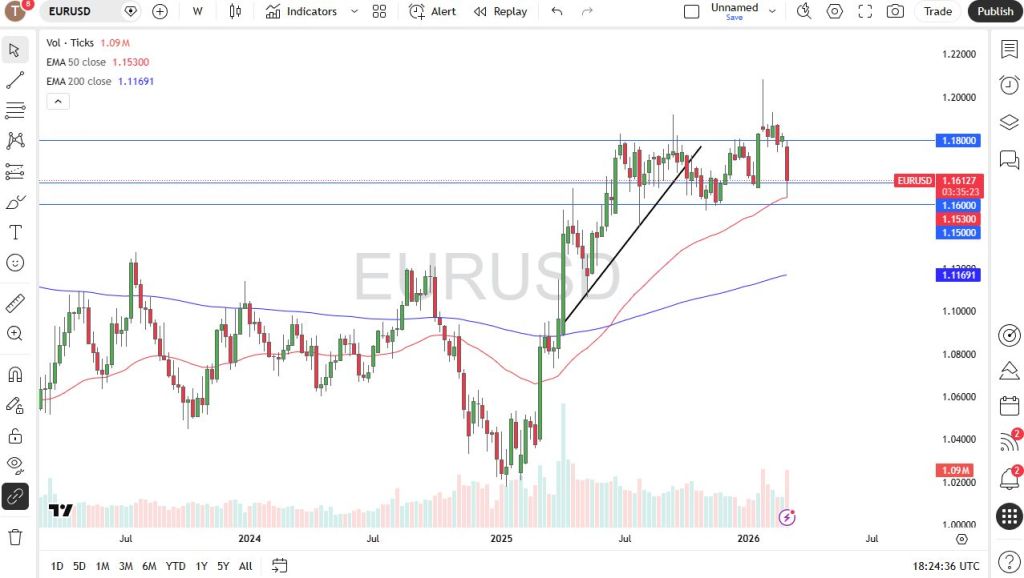
EUR/USD
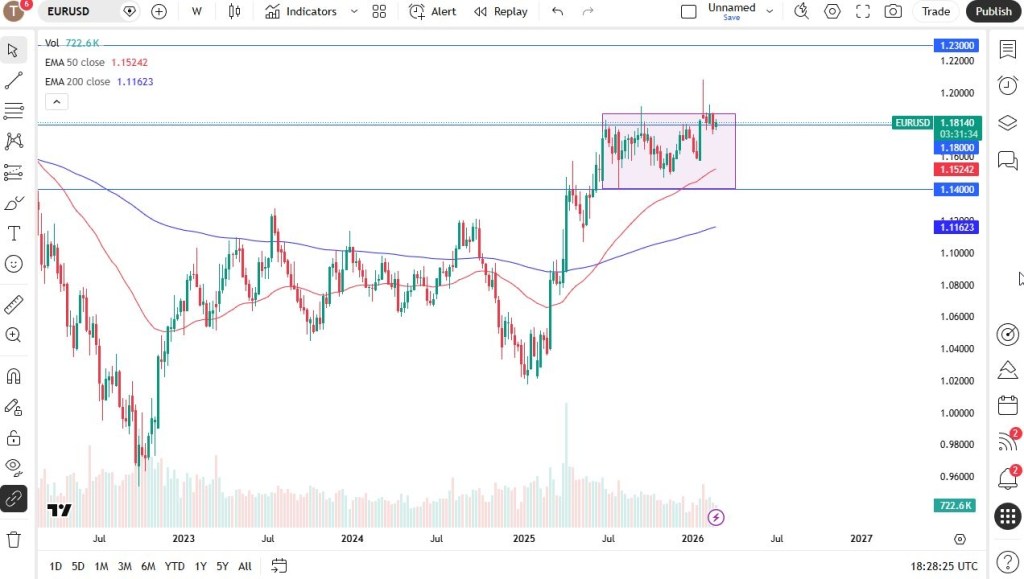
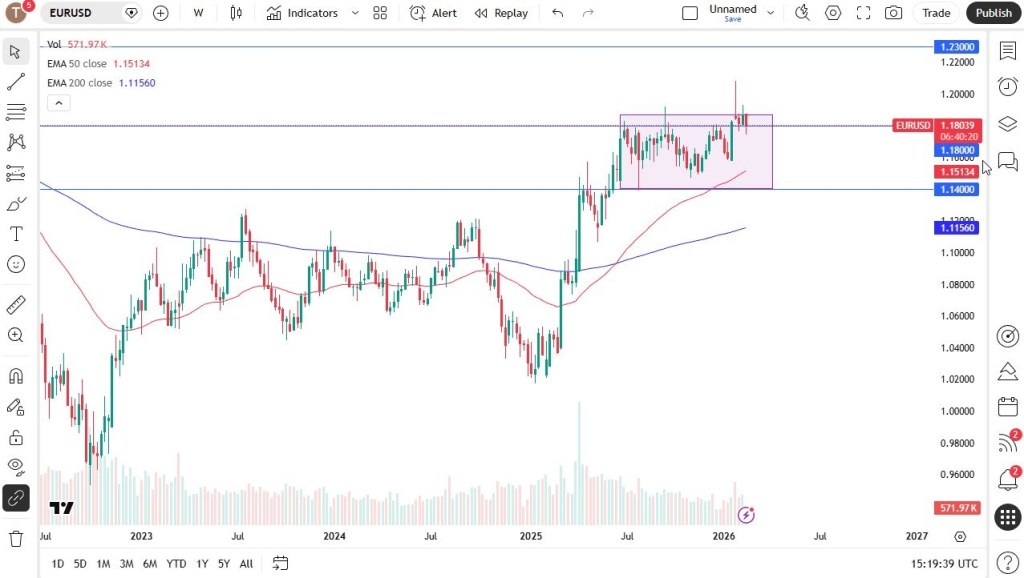
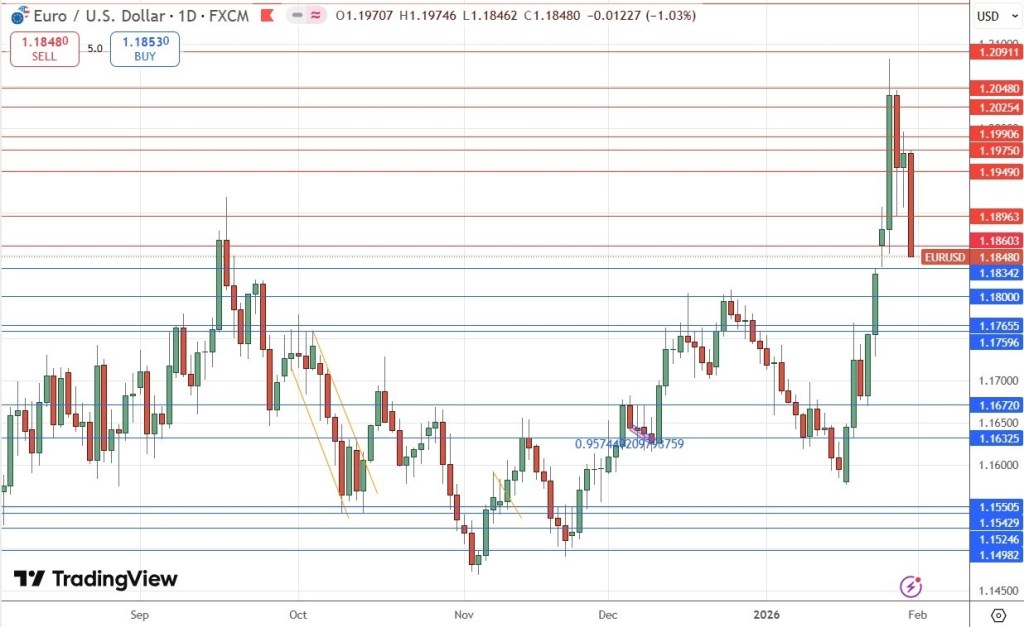
The euro declined notably over the course of the week, but it continues to find buyers near the 1.18 level, making that area especially important to watch. Given the current structure, caution is warranted when trading this pair.
Price action appears largely range-bound, with 1.18 acting as a central pivot or magnet. Resistance stands near 1.1850, while solid support can be found around 1.1750, reinforcing the broader sideways pattern.
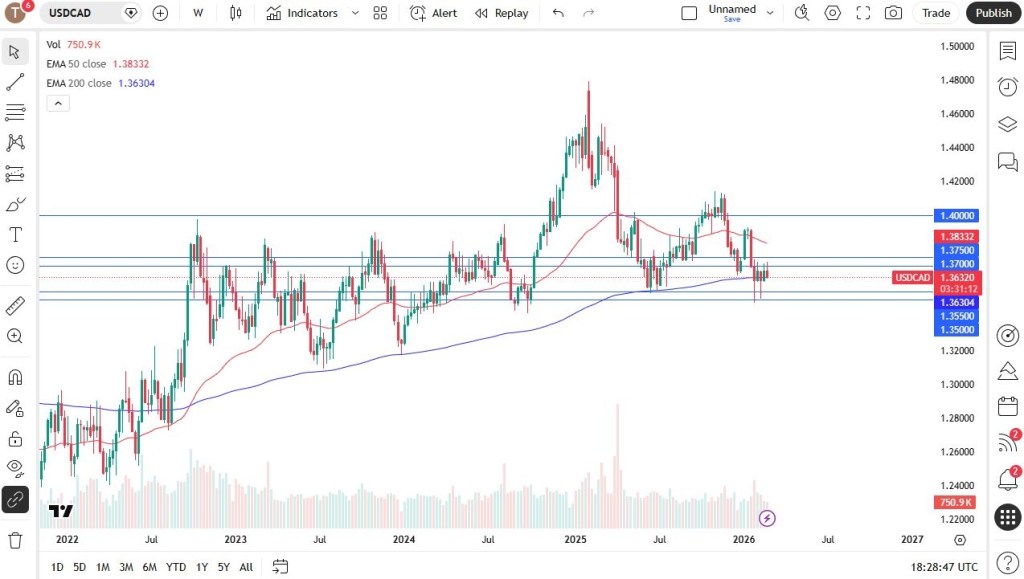
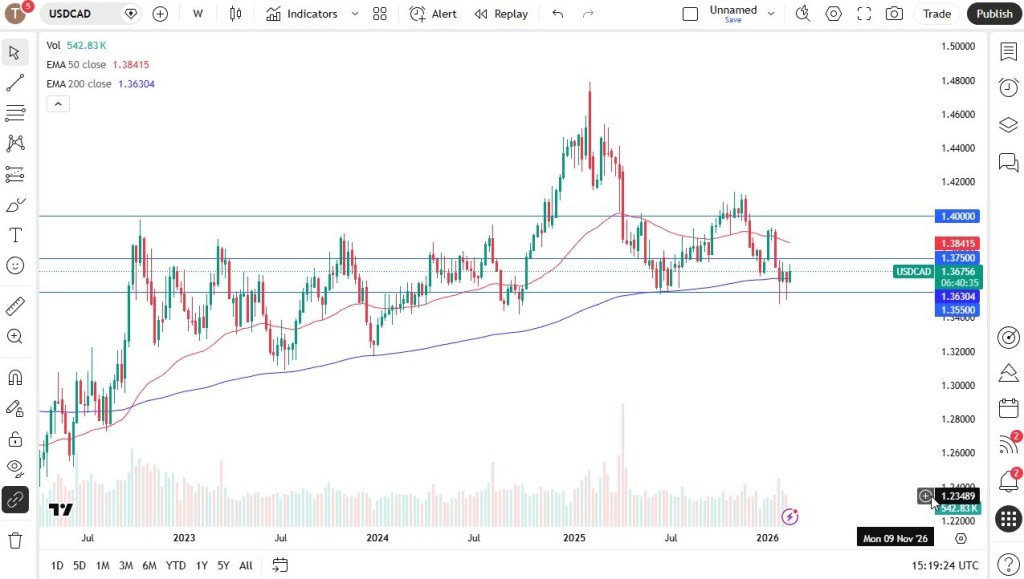
USD/CAD
The US dollar has advanced against the Canadian dollar, but price action remains choppy around the 1.3750 zone — an area that has repeatedly proven significant. The pair appears to be oscillating as traders assess whether momentum can build for a sustained move higher.
A decisive push and hold above 1.3750 would signal renewed strength for the US dollar. Conversely, a breakdown below 1.35 would represent a notably bearish shift in sentiment.
Major Technical Support and Resistance Levels
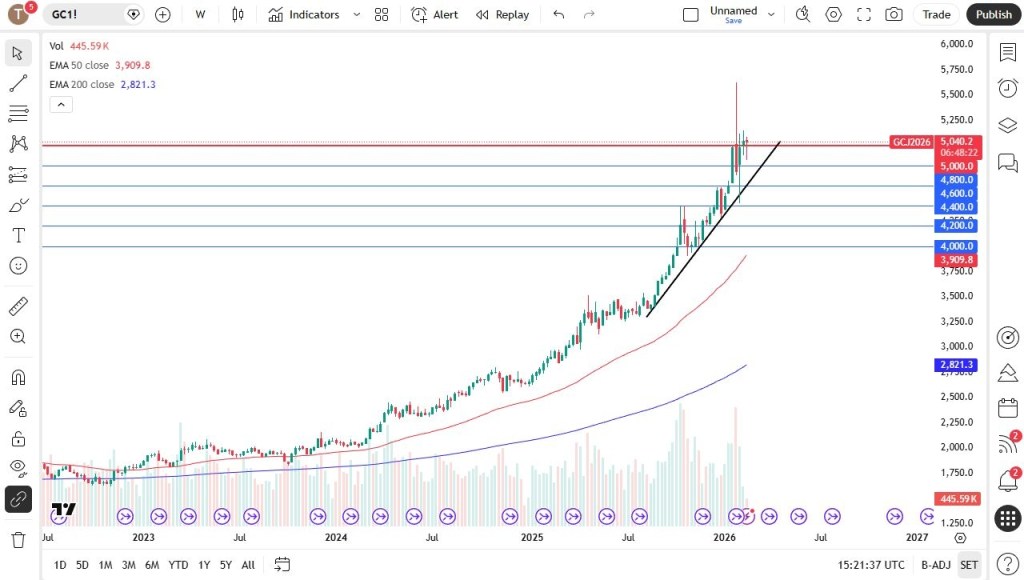
Gold (XAU/USD)
Gold remains choppy, initially easing back during the week, yet buyers continue to emerge on dips, stepping in whenever prices soften. The 4,800 level appears to be firm support, while the 5,000 mark is likely to act as a psychological magnet for price action.
The broader bias still favors buying pullbacks, with the expectation of an eventual move higher. However, volatility may persist after the sharp turbulence seen in recent weeks, following what had previously been a near one-way surge. Over the longer term, a retest of the highs seems plausible, though it will likely require patience amid ongoing fluctuations.
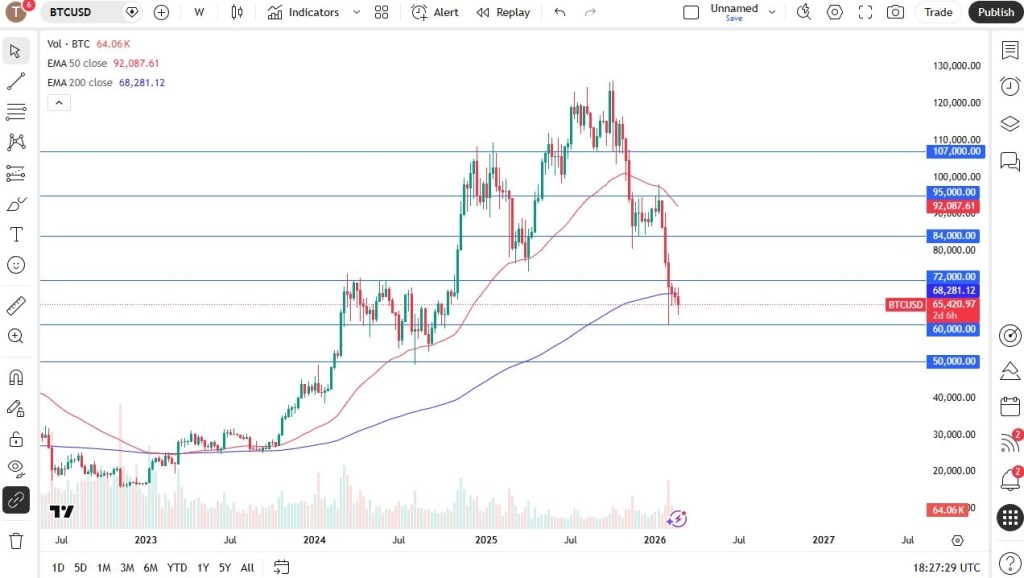
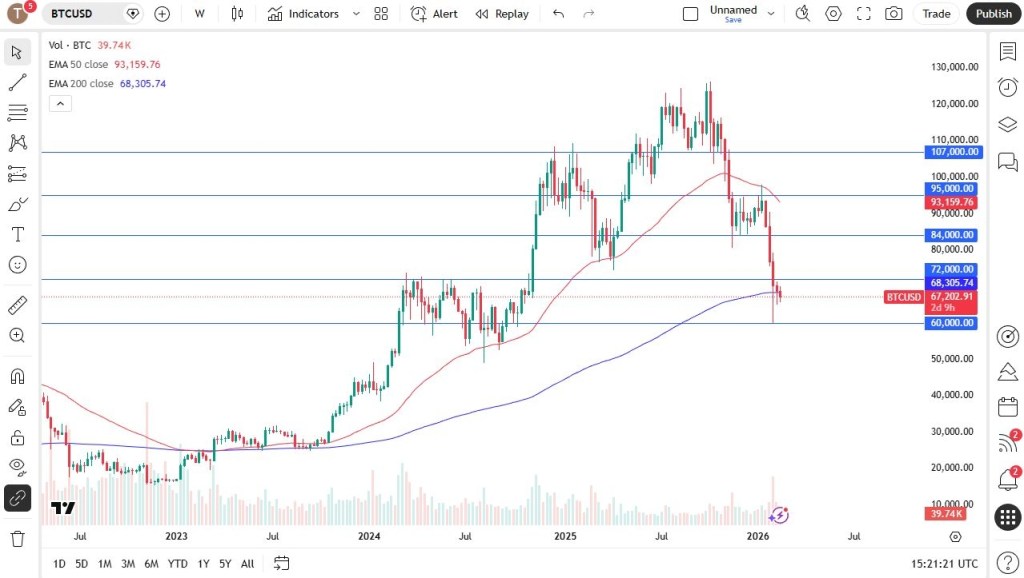
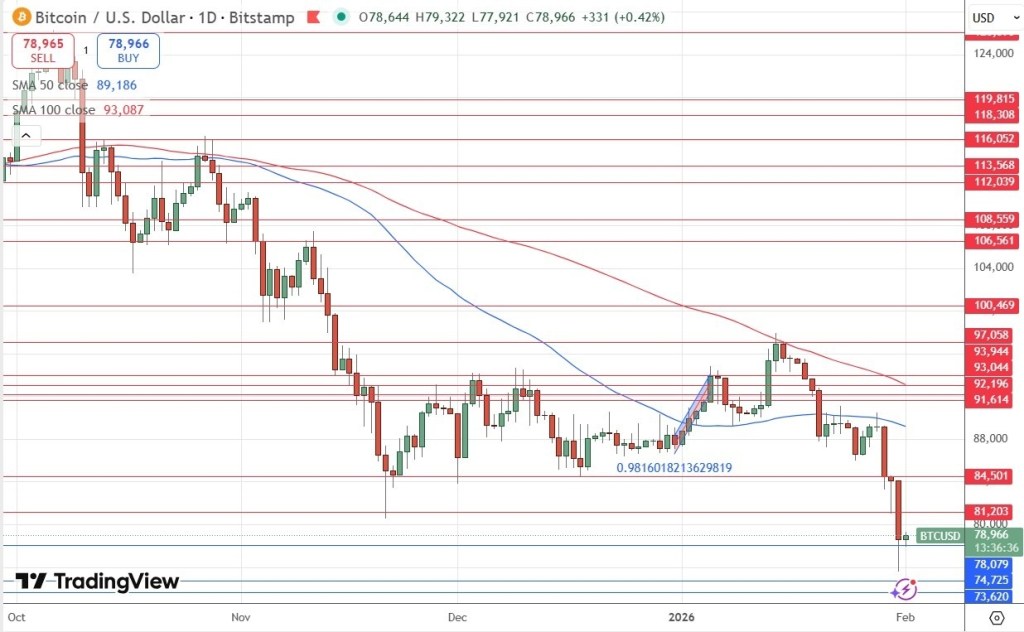
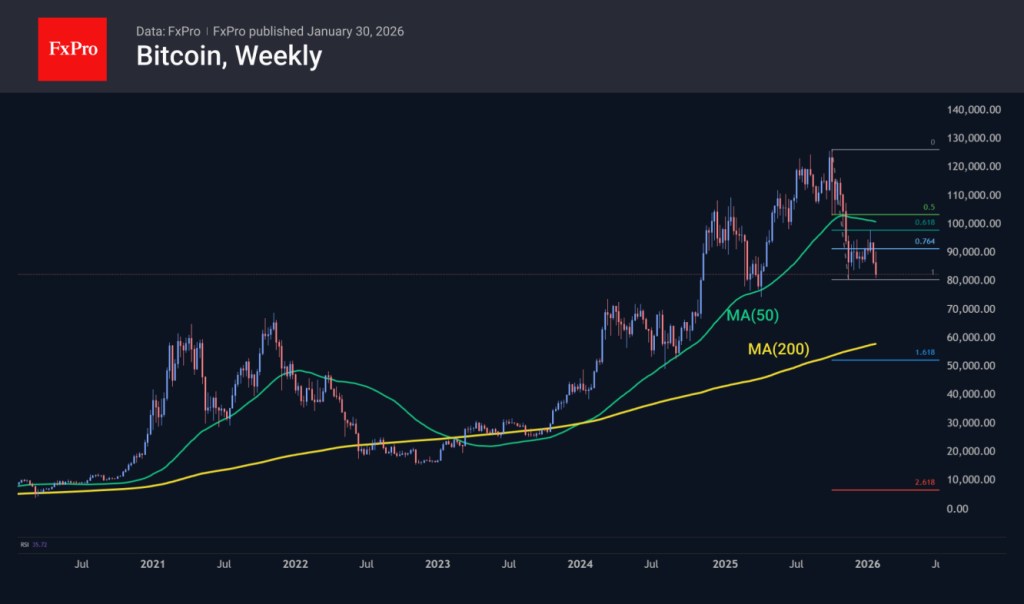
Bitcoin (BTC)
The Bitcoin market is still searching for renewed upside momentum, but the encouraging development is that price action has at least stabilized. Given the prolonged weakness seen in recent periods, simple stability is a constructive step forward for the market.
The $60,000 level remains a crucial support zone and a major psychological benchmark. Holding above this area is essential if Bitcoin is to maintain any realistic prospect of a sustained recovery.
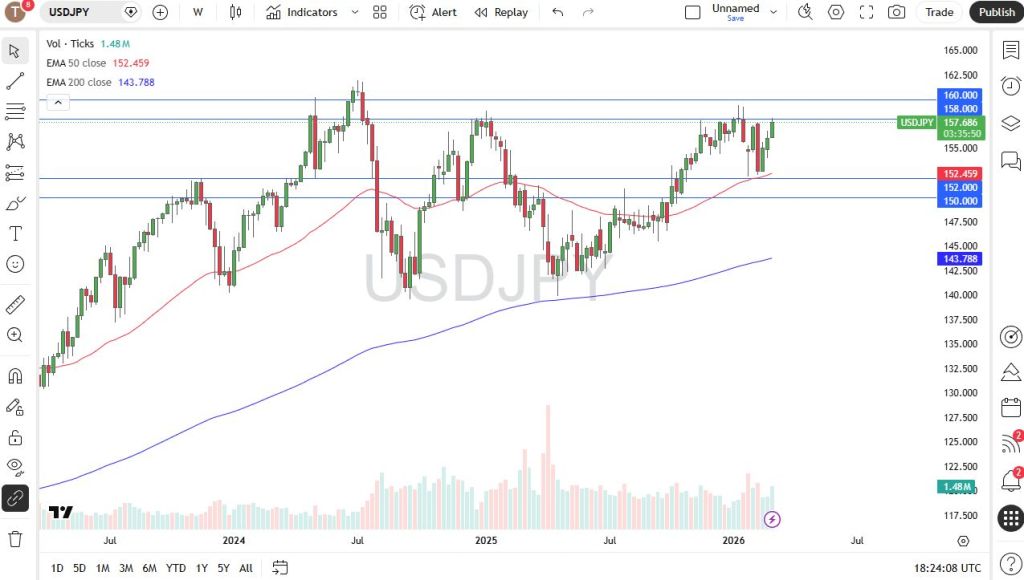
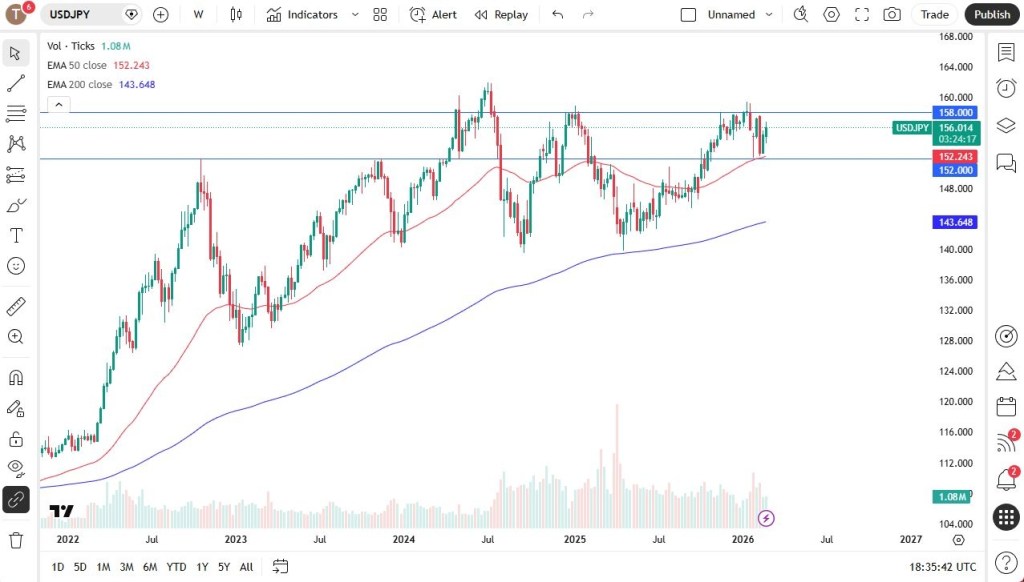
USD/JPY
The US dollar posted solid gains against the Japanese yen over the week, with the ¥152 level continuing to provide strong support. The 50-week EMA is positioned just beneath that area, reinforcing the floor and encouraging dip-buying as the interest rate differential remains in favor of the US dollar.
With the Bank of Japan maintaining its current policy stance, there appears to be little immediate catalyst for a structural shift. As a result, the pair may be entering a consolidation range between ¥152 on the downside and ¥158 on the upside. A decisive move above ¥160 would represent a significant breakout, clearing a resistance zone that has been in place since 1990.
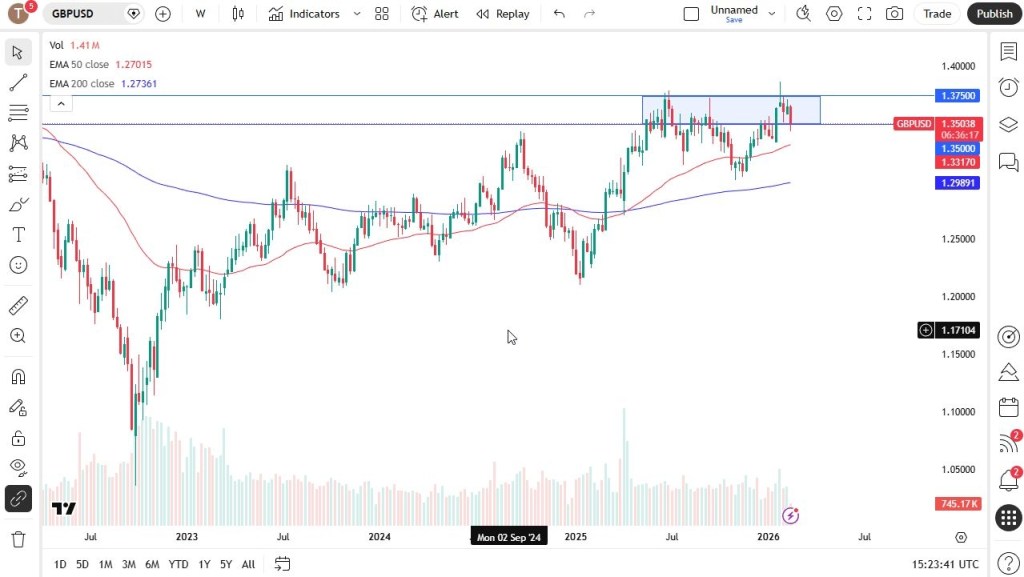
GBP/USD
The British pound declined sharply during the week, dropping to test the 1.35 level — a large, round psychological threshold that has proven important on multiple occasions. The fact that buyers are attempting to defend this area is at least a constructive short-term signal.
However, recent UK economic data has been somewhat underwhelming. As a result, sterling may currently be one of the weaker major currencies against the US dollar. This pair deserves close monitoring, as broader dollar strength could translate into pronounced downside pressure here, potentially making GBP/USD particularly vulnerable.
Cryptocurrency markets moved within a tight range late in the week as traders remained cautious ahead of important U.S. inflation and growth releases. According to Nexo analyst Iliya Kalchev, broader macro uncertainty continues to guide investor sentiment.
Bitcoin held just above the $68,000 mark, while Ethereum struggled to push past $2,000, signaling selective positioning rather than a broad return to risk appetite. A more guarded macro tone has emerged in recent days, with hawkish cues from the Federal Reserve’s January meeting minutes pressuring risk assets and strengthening the view that interest rate cuts may come later than previously anticipated.
Geopolitical concerns have further shaped market behavior. Heightened tensions involving the U.S. and Iran have driven demand for traditional safe havens such as the U.S. dollar and gold, while capping gains in liquidity-driven assets like cryptocurrencies.
Kalchev highlighted that U.S.-listed Bitcoin ETFs posted around $165 million in net outflows, and Ethereum ETFs saw roughly $130 million withdrawn. These flows reflect a broader sense of institutional caution as investors recalibrate exposure amid persistent macro volatility.
Bitcoin remains in a consolidation phase following its early-February pullback, even as underlying network metrics improve. Mining difficulty has risen notably, and hashrate levels have recovered, pointing to structural strength despite muted price action. Still, analysts note that the asset remains highly responsive to macro signals—particularly inflation data that could influence Federal Reserve policy expectations.
Outside of crypto, financial markets have displayed uneven risk appetite. Gold is trading near record highs, and the dollar is on course for a strong weekly advance as investors hedge against geopolitical instability and interest rate uncertainty.
Looking ahead, market participants are closely watching upcoming U.S. Core PCE inflation data and GDP figures. These releases could determine whether digital assets break out of their current consolidation range or continue moving sideways. While regulatory progress on stablecoin legislation may serve as a longer-term structural driver, Kalchev emphasized that near-term price movements will likely remain tied to macro developments and investor positioning.
Bitcoin edged higher on Friday, drawing some support from dip-buying after recent losses, though overall sentiment toward cryptocurrencies remained weighed down by uncertainty over U.S. interest rates and rising geopolitical tensions.
The world’s largest digital asset was still on track for a weekly decline, as a short-lived rebound from last week quickly lost momentum. Bitcoin has also fallen roughly 25% so far in 2026.
Bitcoin climbed to $67,843.1 by 01:21 ET (06:21 GMT). Despite the modest uptick, it was down 2.8% for the week and poised to register losses in five of the past seven weeks.
Rate uncertainty intensifies ahead of PCE, GDP data
Bitcoin and the broader crypto market extended declines this week as demand for speculative assets weakened amid growing doubts about the U.S. rate outlook.
Concerns escalated after minutes from the Federal Reserve’s January meeting revealed that several policymakers supported keeping the door open to further rate hikes to counter inflation risks — a backdrop that typically pressures high-risk assets.
A string of mixed inflation and labor market reports has further clouded expectations for monetary policy. Cryptocurrencies are particularly sensitive to higher interest rates, as they tend to perform better in environments flush with liquidity.
Investors are now awaiting December’s Personal Consumption Expenditures (PCE) price index — the Fed’s preferred inflation measure — due later Friday, along with fourth-quarter gross domestic product data, both of which could shape longer-term rate expectations.
Iran tensions dent risk appetite
Risk sentiment was also dampened by escalating geopolitical strains between the U.S. and Iran. President Donald Trump reiterated threats of military action if Tehran fails to agree to a nuclear deal, while multiple reports indicated Washington is weighing several military options and has increased its regional presence.
The heightened tensions curbed appetite for riskier assets such as Bitcoin, prompting some traders to favor traditional safe havens including the U.S. dollar and gold.
Altcoins head for weekly losses
Broader crypto markets traded in a narrow range on Friday, with most major altcoins also facing another week of declines.
The second-largest cryptocurrency, Ethereum, slipped 1.5% to $1,954.09 and was set for a 6.2% weekly drop.
XRP and BNB were down around 6% and 3% for the week, respectively, while Cardano and Solana were on track for losses of roughly 5% to 7%.
Among meme tokens, Dogecoin was headed for an 11% weekly decline.
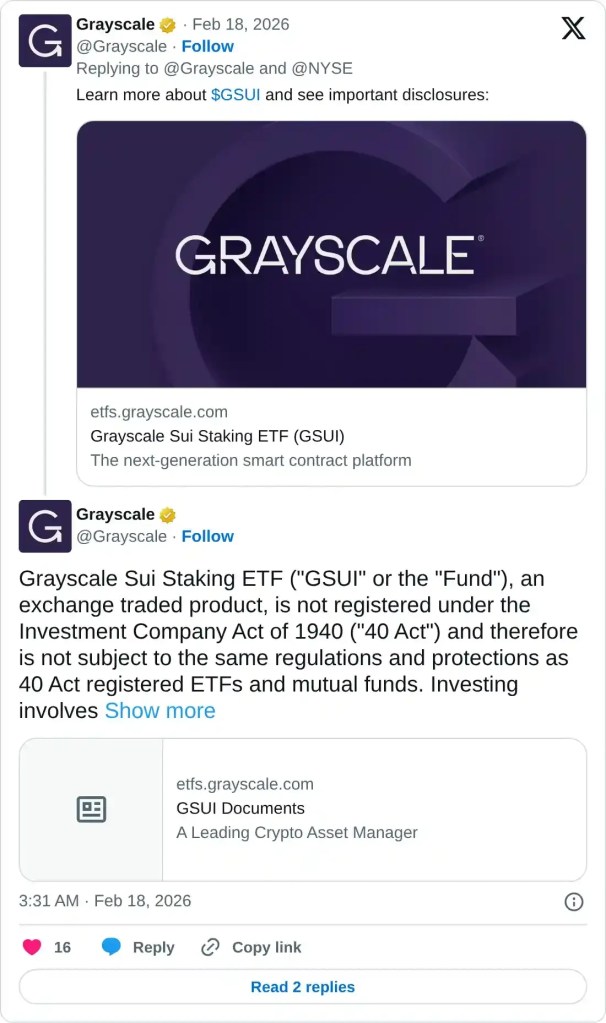
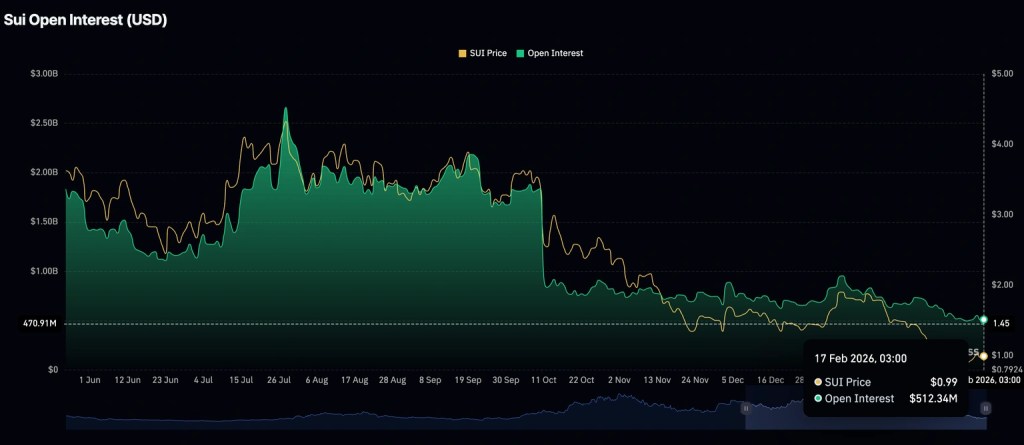
Sui remains under pressure near $0.96 as its technical outlook continues to weaken. The upcoming launch of the Grayscale Sui Staking ETF on Wednesday will give investors exposure to the Sui Network’s native token. However, subdued retail participation — with futures Open Interest hovering just above $500 million — could restrain any meaningful breakout attempt.
Sui (SUI) has extended its decline for a second straight session, trading around $0.95 at the time of writing on Wednesday. The Layer-1 token has dropped more than 16% in February and is down roughly 34% year-to-date, mirroring the broader bearish tone across the crypto market.
Technically, Sui risks prolonging its downtrend amid weak retail engagement. While support at $0.87 remains intact for now, a decisive break below this level could open the door for a pullback toward the $0.79 demand zone.
Grayscale’s Sui Staking ETF begins trading
Grayscale Investments has confirmed the launch of its Sui Staking Exchange-Traded Fund (ETF), set to start trading Wednesday. The fund is listed on NYSE Arca under the ticker GSUI, following the conversion of the former Grayscale Sui Trust. The ETF is expected to hold SUI tokens and incorporate staking.
According to Grayscale, while purchasing shares does not constitute direct ownership of SUI, the product is structured to offer a cost-efficient and accessible way for investors to gain exposure to the token.
The Bank of New York Mellon will act as the trust’s transfer agent and administrator. Coinbase, Inc. will serve as prime broker, while Coinbase Custody Trust Company will function as custodian.
Investors can purchase shares only in creation blocks of 10,000 units or more.
Despite the ETF debut, retail demand for Sui remains muted. Futures Open Interest has slipped to $512 million on Wednesday from $554 million on Sunday, signaling limited appetite for new positions. The stagnation suggests traders remain unconvinced about the token’s ability to sustain a meaningful recovery, opting instead to scale back exposure.
Technical outlook: Sui’s downtrend remains intact
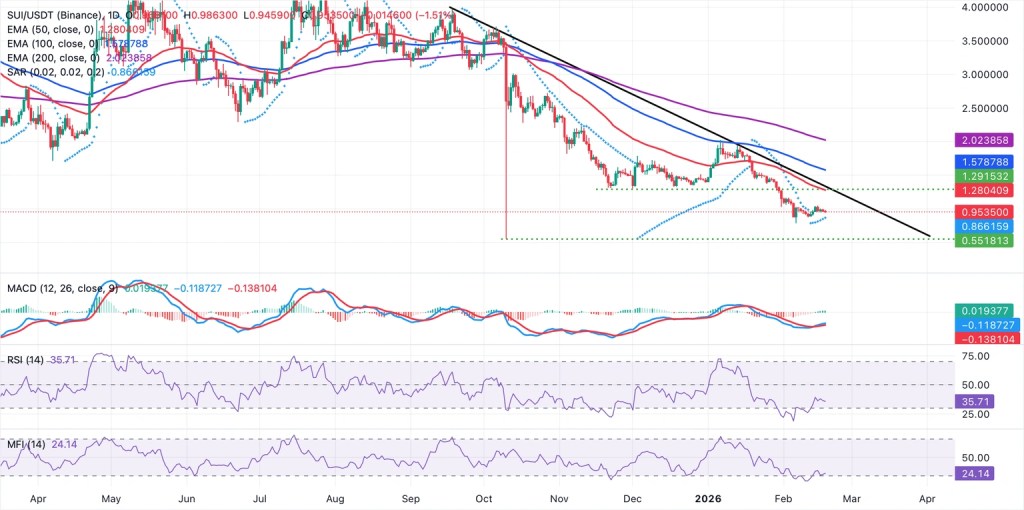
Sui is trading around $0.95, still capped below the declining 50-day Exponential Moving Average (EMA) at $1.28, maintaining a bearish medium-term outlook. The 100-day EMA at $1.58 and the 200-day EMA at $2.02 are also trending lower, continuing to limit recovery attempts.
On the daily chart, the Relative Strength Index (RSI) sits at 36, below the neutral 50 level, signaling persistent weakness. A sustained pickup in buying pressure could help improve momentum. However, if the RSI drifts further into oversold territory, the decline may accelerate toward support near $0.78 — in line with the February 6 low.
A decisive break above descending trendline resistance would create scope for a move toward the 100-day EMA at $1.58. Conversely, failure to extend any rebound would leave the broader downtrend firmly in control.
Meanwhile, the Moving Average Convergence Divergence (MACD) histogram has turned positive and is gradually expanding, showing the MACD line above the signal line near the zero threshold — an early sign of strengthening momentum. The Parabolic SAR, positioned at $0.86 below the current price, also suggests a tentative stabilization attempt.
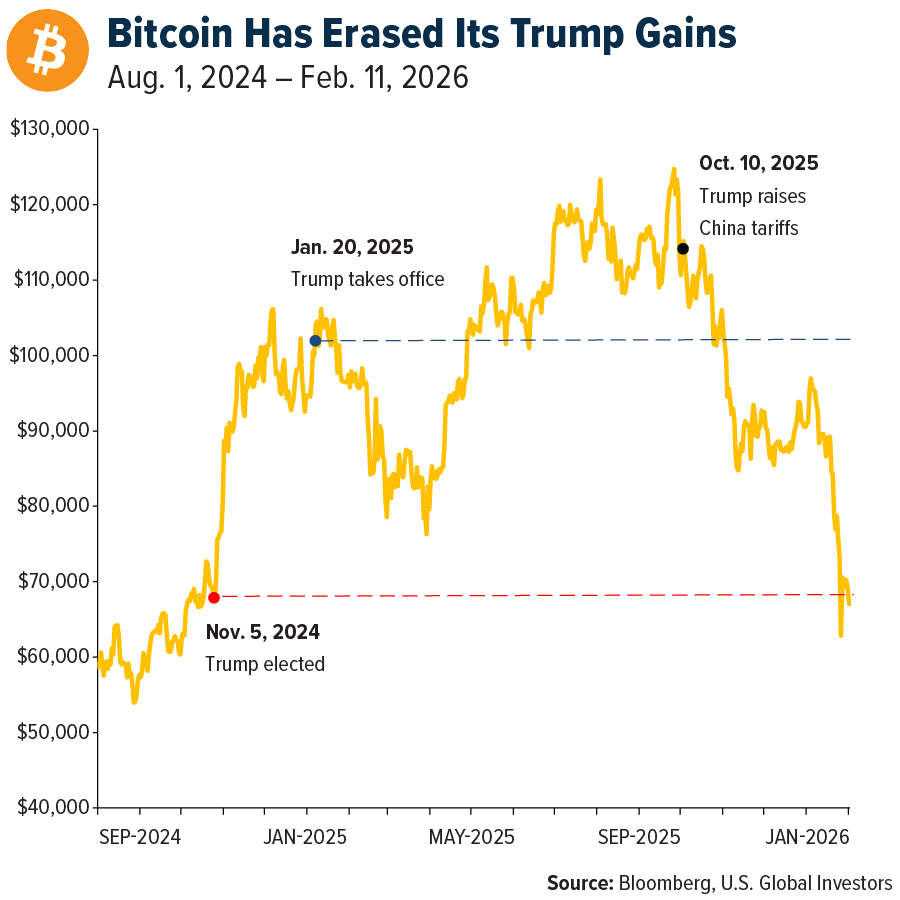
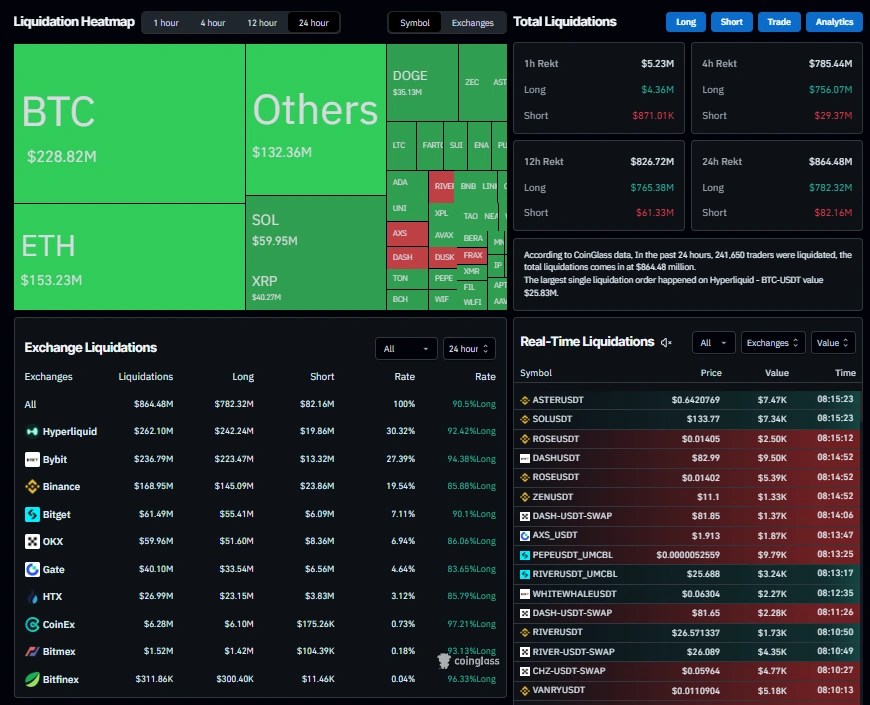
Four months ago, the digital asset market experienced what I consider its most significant liquidation event to date. On October 10, 2025, more than $19 billion in leveraged positions were erased within a matter of hours. Bitcoin tumbled from around $122,000 to $105,000, and over 1.6 million trader accounts were forced into liquidation.
The so-called “10/10” crypto crash did more than shake prices—it reshaped the psychological backdrop of crypto investing.
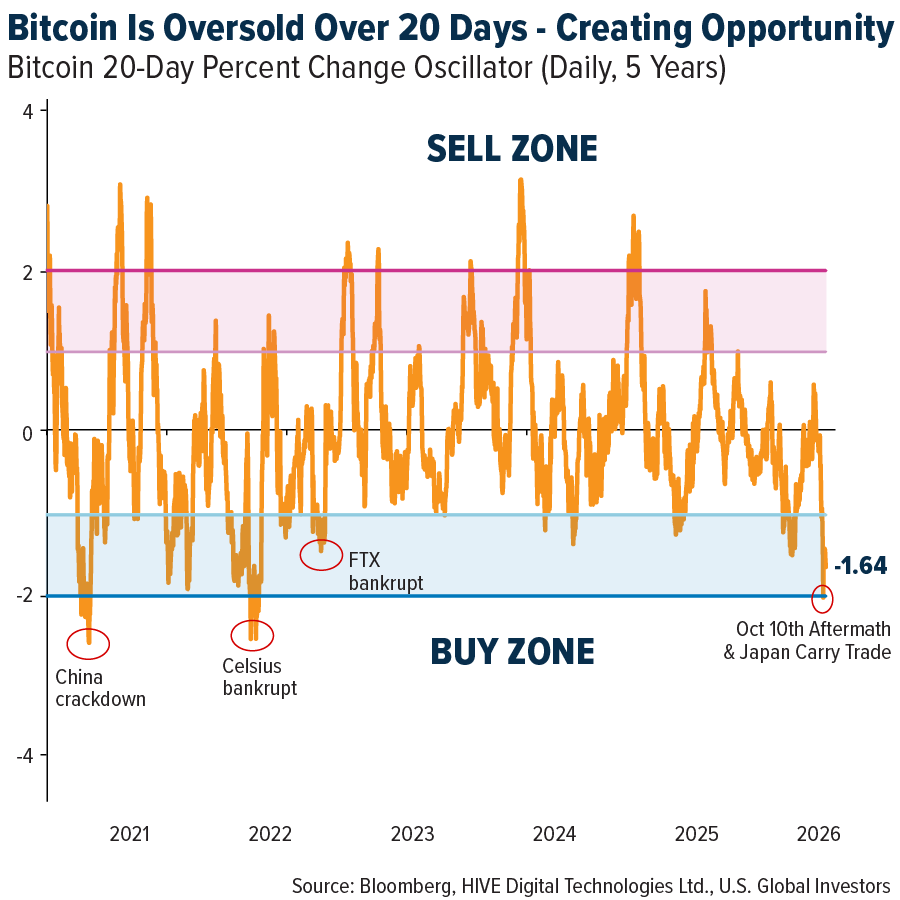
As I mentioned on PreMarket Prep last week, from a technical perspective Bitcoin is currently trading about two standard deviations below its 20-day average—a condition that has appeared only three times in the past five years. Historically, such stretched readings have tended to precede short-term rebounds over the following 20 trading sessions.
The unwinding of the Japanese carry trade—estimated at roughly $500 billion—likely added to the weakness seen in January and again this month. Still, I believe much of that pressure has now run its course.
With Bitcoin still trading below $70,000—about 45% off its all-time high—some investors may be asking whether the events of October 10 are the reason the downturn has lingered.
The short answer is yes. But the deeper explanation is more complex—and, in my view, more relevant for portfolio positioning going forward.
What Really Happened
To put it in context, the 10/10 crash surpassed the FTX collapse in absolute dollar losses. It effectively overshadowed the failure of what had been the world’s second-largest crypto exchange. Binance alone reportedly drew $188 million from its insurance fund to cover bad debt, while several other trading platforms faced comparable strains.
As for the catalyst, many point to President Donald Trump’s announcement of a 100% tariff on Chinese imports, layered on top of an existing 30% levy.
That geopolitical jolt rattled global markets. But in crypto—where leverage is deeply embedded in the system—it transformed what might have been a routine correction into a cascading liquidation event.
The crash laid bare deep structural flaws in how exchanges were managing risk, with one platform in particular drawing scrutiny.
The Binance Factor
Star Xu, founder and CEO of OKX, recently posted a detailed breakdown on X outlining his view of how the 10/10 meltdown unfolded.
According to Xu, Binance rolled out an aggressive user acquisition push offering 12% APY on USDe, a synthetic dollar built on Ethereum. At the same time, the exchange permitted USDe to be posted as collateral under the same terms as established stablecoins such as Tether (USDT) and USD Coin (USDC).
Xu argues this created a distorted incentive structure. Users were enticed to swap USDT and USDC for USDe in pursuit of higher yields, often without fully appreciating the added risk profile.
A leverage loop soon followed. Traders converted USDT into USDe, pledged USDe as collateral to borrow more USDT, then recycled the borrowed funds back into USDe—repeating the process. Xu claims this dynamic drove advertised yields as high as 24%, 36%, and even above 70%.
When volatility surged, USDe quickly lost its peg, unleashing cascading liquidations. The market entered a classic doom loop: forced selling triggered margin calls, which in turn sparked further forced selling.
For its part, Binance has denied responsibility. Speaking at a crypto conference last week, co-CEO Richard Teng attributed the turmoil entirely to President Donald Trump’s tariff announcement. Still, allowing heavily leveraged positions in a market where stop-losses can be gamed and safeguards are thin creates systemic fragility. In such an environment, even a minor shock can ignite a chain reaction.
The Psychological Fallout
October 10 erased more than leveraged trades—it shattered investor confidence. The event coincided with Bitcoin peaking near $126,000 and sparked a wave of fear that continues to weigh on sentiment.
In the weeks that followed, ETFs saw meaningful outflows. Retail traders—many of whom had piled into futures and margin positions as Bitcoin hit record highs—were hit hardest. More than 1.6 million accounts were liquidated, a large share belonging to smaller participants.
This month’s follow-on decline, which marked Bitcoin’s largest realized loss on record as prices slid from $70,000 to $60,000, was described by one analyst as a “textbook capitulation.” The drop was swift, volume-heavy, and flushed out holders with the weakest conviction.
Why I’m Still Constructive
Despite persistent volatility, I remain long-term bullish because the underlying fundamentals remain intact.
Institutional participation continues to expand. Corporate Bitcoin treasuries—often referred to as Digital Asset Treasury (DAT) firms—now collectively control more than 1.1 million BTC, about 5.7% of total supply, valued near $90 billion. MicroStrategy (now operating as Strategy) alone holds roughly 3.5% of Bitcoin’s circulating supply.
Notably, institutions added around 43,000 BTC in January, even amid adverse price conditions—suggesting that long-term capital remains engaged despite the market’s recent turbulence.
The U.S. Strategic Bitcoin Reserve now reportedly holds more than 325,000 BTC—about 1.6% of total supply—making it the largest sovereign holder globally. At the same time, other nation-states are building positions, much as they do with gold, and major corporations continue to add to their allocations.
The Bottom Line
I’ve long described Bitcoin as “digital gold,” but I don’t believe it has fully evolved into a true safe-haven asset. For now, institutions largely categorize it as a risk-on asset rather than risk-off. That suggests it is still carving out its place within diversified portfolios.
Was October 10 the root cause of Bitcoin’s prolonged weakness? In my view, yes. The event delivered a structural shock that obliterated leveraged positions and forced a sweeping—if painful—deleveraging across the digital asset ecosystem.
Did aggressive marketing and flawed incentive structures at certain platforms worsen the fallout? Again, I would argue yes. Encouraging investors to treat what was effectively a tokenized hedge strategy as if it were a stablecoin—while layering on substantial leverage—inevitably magnified systemic risk.
As severe as the collapse was, it may ultimately prove constructive. Excess leverage often needs to be purged before a sustainable advance can resume. My sense is that we are nearing the final phase of that cleansing process.
Bitcoin declined on Monday, deepening its downturn after crypto markets posted four consecutive weeks of heavy losses, as interest-rate uncertainty continued to dampen appetite for riskier assets.
The largest cryptocurrency briefly touched $70,000 over the weekend before retreating. By 00:58 ET (05:58 GMT), Bitcoin was down 2.7% at $68,409.7.
Strategy says liquidation unlikely unless Bitcoin drops to $8,000
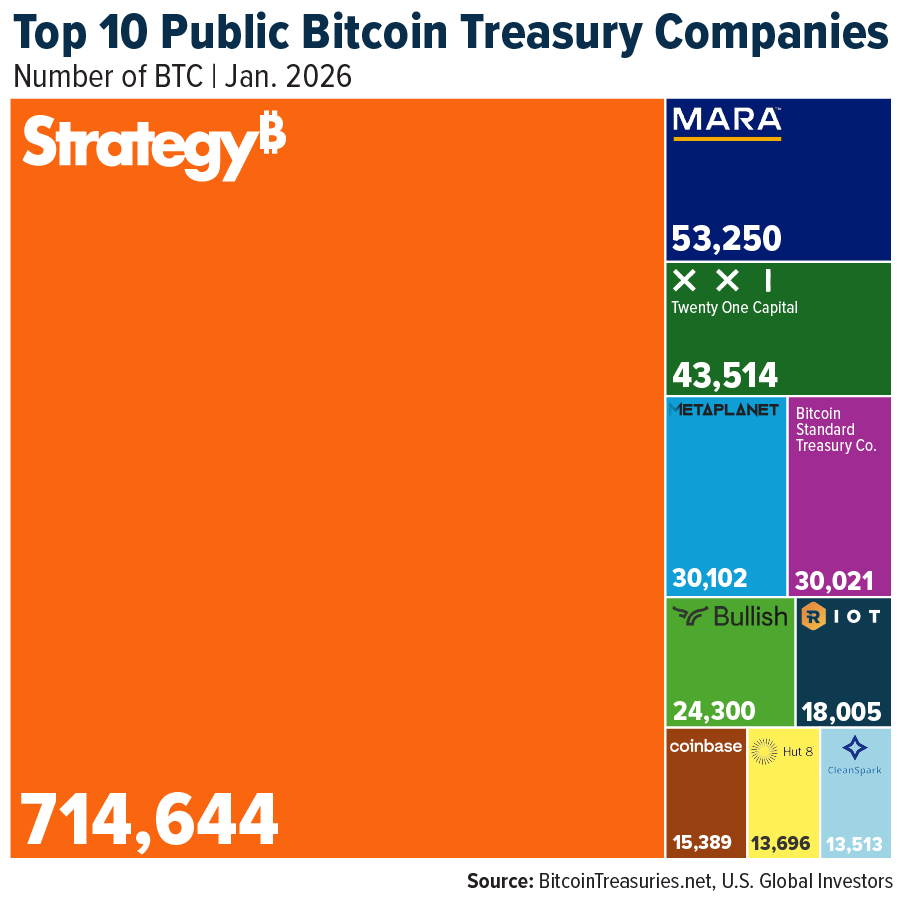
Strategy Inc (NASDAQ:MSTR), the biggest corporate holder of Bitcoin, said Sunday it can meet its debt obligations even if Bitcoin tumbles to $8,000. In a social media update, the company stated it could “withstand a drawdown in $BTC price to $8K and still have sufficient assets to fully cover our debt.”
The firm owns 714,644 Bitcoins, financed through a combination of equity issuance and long-term borrowing. Led by prominent Bitcoin advocate Michael Saylor, Strategy has continued accumulating coins in recent weeks despite the broader market slide.
Bitcoin has now erased about half its value since peaking near $126,000 in October, leading declines across speculative assets as traders grew cautious amid U.S. rate uncertainty.
Extended losses had fueled speculation that Strategy might be forced to sell part of its holdings to service debt, though Saylor has repeatedly downplayed such concerns. Earlier this month, the company reported a $12.4 billion loss for the December quarter, compared with a $670.8 million loss a year earlier. Aside from its substantial Bitcoin position, Strategy generates relatively limited operating revenue.
Broader digital assets also moved lower Monday in line with Bitcoin’s sustained slump. Ethereum fell 6.1% to $1,958.63, while XRP dropped 7.7% to $1.4575.
BNB declined about 4%, with Solana and Cardano sliding 5.4% and 6.2%, respectively.
Among meme tokens, Dogecoin tumbled 11.4%, while TRUMP slipped 2.4%.
Crypto sentiment has remained fragile since October, as both retail and institutional inflows slowed sharply. Meanwhile, a surge in gold prices amid speculative enthusiasm in precious metals has drawn attention away from Bitcoin, with investors favoring tangible assets.
Bitcoin snapped a four-session slide on Friday, climbing nearly 4%, though it remained on course for its first four-week losing streak since November 2025. The leading cryptocurrency was up 3.7% at $68,776.1 by 17:15 ET (22:15 GMT), after dropping close to $65,000 in the prior session.
Bitcoin pressured by tech slump as U.S. inflation eases.
While Friday’s rebound trimmed some weekly losses, Bitcoin was still headed for a roughly 0.6% decline, struggling to build lasting upside momentum after bouncing from earlier lows and drifting back toward last week’s $60,000 support zone.
Risk appetite has been fragile amid a prolonged selloff in technology stocks, driven by renewed concerns that artificial intelligence could disrupt traditional software and office-service business models. Those fears resurfaced on Thursday as investors questioned how automation and emerging AI tools might erode established revenue streams.
At the same time, fresh U.S. inflation data showed price pressures eased more than anticipated in January. According to the U.S. Bureau of Labor Statistics, headline CPI rose 2.4% year-over-year, down from 2.7% in December, while core CPI increased 2.5%, matching forecasts.
On a monthly basis, headline CPI gained 0.2% and core CPI 0.3%, with the softer headline figure boosting expectations that the Federal Reserve could move toward policy easing. However, strong labor market data earlier in the week—highlighting solid payroll growth and a lower unemployment rate—had dampened hopes for near-term rate cuts.
Dessislava Ianeva of Nexo Dispatch noted that crypto markets appear to be stabilizing after the softer CPI reading, even as ETF outflows continue, with positioning data suggesting lower leverage and consolidation rather than a fresh directional breakout.
Crypto leaders appointed to CFTC Innovation Advisory Committee.
Separately, the U.S. Commodity Futures Trading Commission appointed several prominent crypto executives to its new Innovation Advisory Committee, including Brian Armstrong of Coinbase, Brad Garlinghouse of Ripple, Vladimir Tenev of Robinhood, and Hayden Adams of Uniswap Labs.
The committee will advise on emerging technologies such as blockchain and AI in derivatives and crypto markets, as regulators clarify oversight of digital assets, with the CFTC expected to take a leading role.
Elsewhere in the market, altcoins also advanced. Ethereum jumped 5.4% to $2,049.07, XRP rose 2.8% to $1.40, Solana surged 8.3%, Cardano gained 4.1%, and Dogecoin added 4.7%.
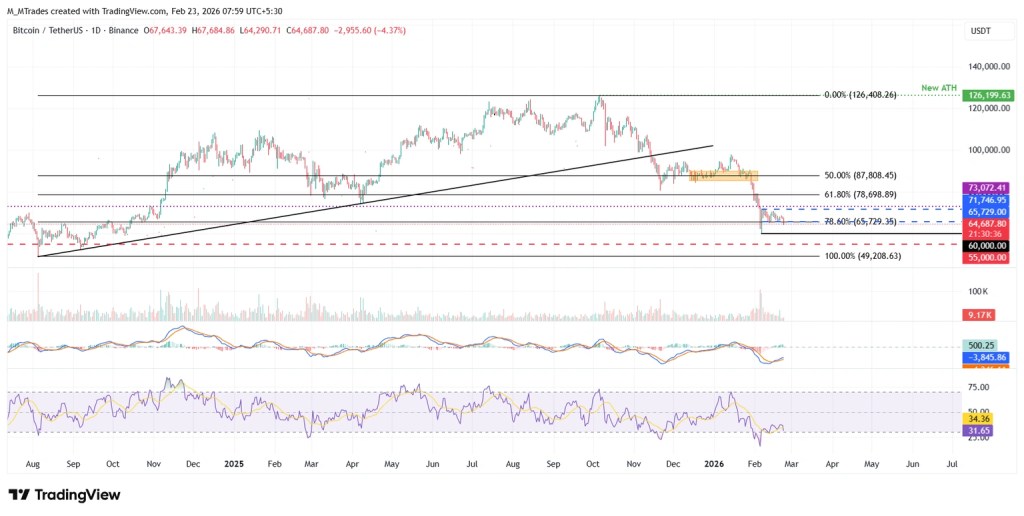
Bitcoin has fallen roughly 50% from its October 2025 peak near $126,000 and is now trading around $65,000, marking a far deeper retracement than a routine correction. This downturn reflects not just price volatility but a broader shift in the macro backdrop and crypto’s structural dynamics.
Macro Pressures Reshape the Cycle
As institutional participation has increased, Bitcoin has become more tightly linked to global financial conditions. Rather than acting as “digital gold,” it has moved in closer correlation with U.S. equities—especially technology stocks. Ongoing uncertainty about the pace of disinflation, combined with renewed tariff measures from the Trump Administration targeting Europe and Asia, has strengthened the U.S. dollar and dampened overall risk appetite. Concerns that the artificial intelligence boom may be maturing have further pressured growth assets, including crypto.
Miner Stress and Institutional Retreat
On-chain and industry data reveal mounting supply-side pressure. With the estimated average mining cost around $87,000, many miners are operating below breakeven at current price levels. To stay solvent, some have been liquidating reserves, adding persistent sell-side pressure to the market.
Institutional flows tell a similar story. Roughly $5 billion has exited Bitcoin ETFs in recent weeks, signaling a rotation into safer assets. Meanwhile, reports of operational pauses at certain established crypto platforms have revived memories of the 2022 bankruptcy wave, further unsettling sentiment.
The Crypto Fear and Greed Index remains entrenched in the 5–8 range—classified as “extreme fear”—highlighting the depth of caution across the market.
The Technical Road Ahead
For sentiment to meaningfully reset, Bitcoin must reclaim the $70,000–$78,000 zone, which now represents a critical resistance band. A sustained move above that range would signal renewed confidence and potentially mark the beginning of a recovery phase. Until then, macro headwinds, miner capitulation risks, and fragile investor psychology are likely to continue defining the tone of this cycle.
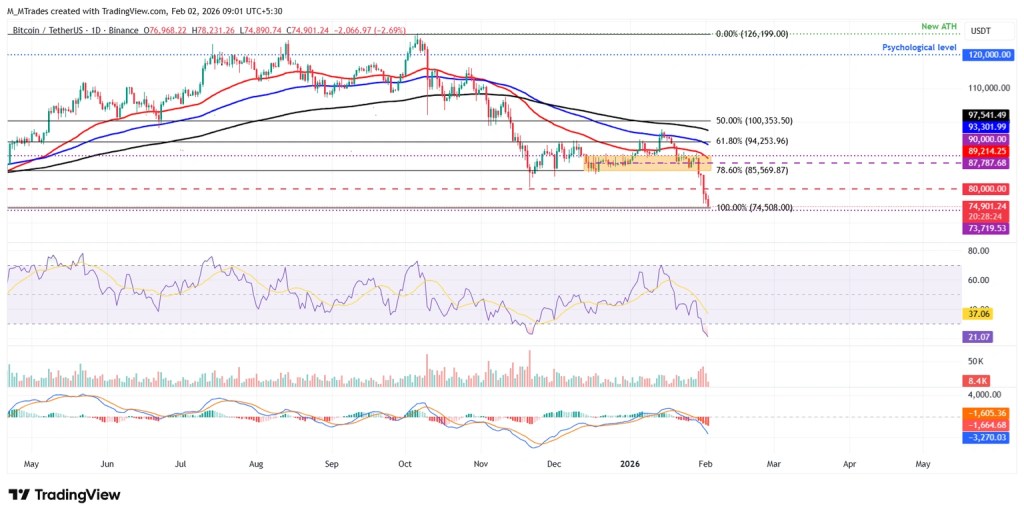
Bitcoin Technical Outlook
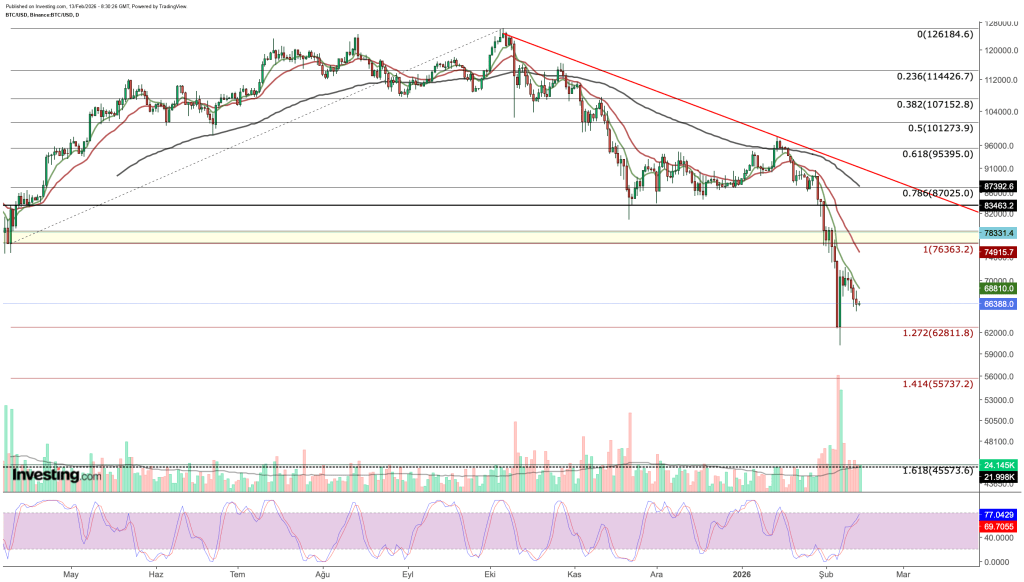
On the daily chart, Bitcoin is attempting to stabilize in a critical technical zone. After sliding to roughly $60,000 last week, price rebounded, but the recovery stalled near $70,000 as sellers re-emerged. Over the past week, Bitcoin has remained below its 8-day EMA, signaling short-term weakness and keeping the broader technical bias cautious.
The $62,800 area—aligned with the Fibonacci 1.272 extension—now stands out as key support. The earlier bounce from $60,000 suggests buyers are active in this region and view it as a potential base. However, a daily close below that level could accelerate downside pressure, exposing the next major support near $55,000, around the Fibonacci 1.414 extension.
One constructive signal comes from momentum indicators. On the daily timeframe, the Stochastic RSI is showing positive divergence: while price has continued to drift lower, the indicator has turned upward from oversold territory. This often signals waning downside momentum and can precede sharp countertrend rallies, including short squeezes or bear traps. Still, for a rebound to evolve into a durable recovery, Bitcoin must reclaim key resistance levels and short-term moving averages. Until then, the market remains delicately balanced between support and renewed selling.
Critical Resistance Levels for a Trend Reversal
A sustained recovery would first require a decisive break above the psychological $70,000 level, ideally accompanied by strong trading volume. Without volume confirmation, upside moves may lack conviction.
A more robust trend reversal signal would come from breaking the descending trendline and reclaiming the Fibonacci 1.0 level near $76,350. The broader $76,000–$78,000 band represents a major technical barrier. Unless Bitcoin can firmly establish itself above this zone, rallies are likely to remain corrective within a broader medium-term downtrend.
Is a Short Squeeze Setup Building?
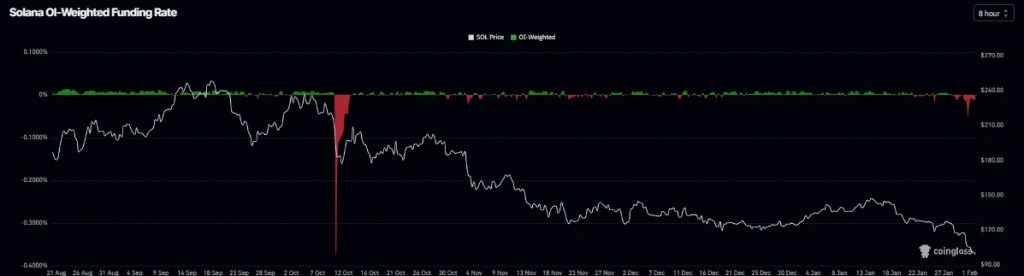
Bitcoin futures funding rates are hovering around -0.006%, indicating short positioning dominates. When leverage becomes skewed heavily to one side, sharp counter-moves often follow as liquidity is cleared. Combined with the positive Stochastic RSI divergence, this creates the potential for a swift spike toward $70,000.
Zooming out, Bitcoin appears to be navigating a capitulation phase marked by ETF outflows, miner pressure, and macro uncertainty. At the same time, some technical signals hint at a cleansing process that could reset positioning.
A conservative stance would wait for weekly closes above $78,000 before declaring a structural recovery. More tactical traders may view the Stoch RSI divergence as an opportunity for a move toward $70,000, with $62,800 serving as a clear risk threshold.
As the crypto sector enters what looks like a period of corporate restructuring in early 2026, the $55,000 region could eventually be seen as a longer-term base—if stabilization holds. Until stronger confirmation emerges, disciplined risk management remains critical: reduced leverage, smaller position sizing, and strict stop-loss levels are essential in this highly volatile environment.
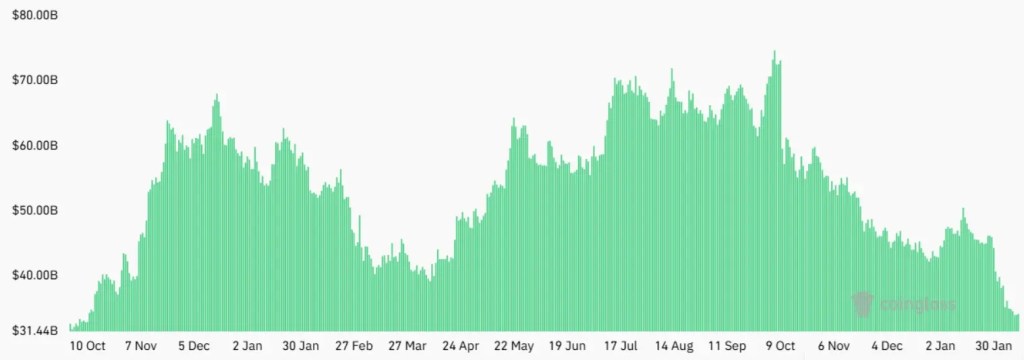
Total Bitcoin futures open interest has fallen to $34 billion as of Thursday, marking a 28% drop over the past month. However, this decline appears largely driven by price effects rather than a reduction in leverage. When measured in Bitcoin terms, open interest remains broadly unchanged at 502,450 BTC, indicating that underlying demand for leveraged exposure is still intact.
Over the past two weeks, forced liquidations have reached $5.2 billion, contributing significantly to the contraction in nominal dollar terms. Meanwhile, options markets show a 22% bearish skew, and funding rates continue to stay below the 12% threshold, suggesting that sentiment remains cautious but not excessively overheated.
Bitcoin Diverges from Traditional Markets
Bitcoin has declined 28% over the past month, even as gold surged back above the $5,000 psychological threshold and the S&P 500 remains just 1% shy of its record high. This growing divergence has prompted investors to question what is driving crypto’s relative weakness. One possible explanation lies in softer US labor data, with the economy adding only 181,000 jobs in 2025—falling short of expectations.
In derivatives markets, sentiment remains cautious. The annualized funding rate on Bitcoin futures has stayed below the neutral 12% benchmark for four straight months, reflecting persistent risk aversion. Options markets show even stronger defensive positioning, as the delta skew on Deribit climbed to 22%. This suggests traders are paying a notable premium for protective put options. Under typical conditions, the skew fluctuates between -6% and +6%, signaling more balanced sentiment.
Despite the bearish tone in derivatives, institutional participation appears steady. US-listed Bitcoin ETFs are recording average daily trading volumes of $5.4 billion, challenging narratives of fading institutional interest. Ultimately, Bitcoin’s near-term rebound may hinge on clearer signals about the direction of the US labor market and broader macroeconomic stability.
Bitcoin remained under pressure on Thursday as investors stayed cautious and its divergence from the rallying stock market widened. The BTC/USD pair slipped below 68,000, a sharp decline from its year-to-date peak of 126,300.
The pullback came even as US equities extended their strong advance, with the Dow Jones reaching a record high. The decline followed the release of solid US labor market data. According to the Bureau of Labor Statistics, the economy added more than 130,000 jobs, while the unemployment rate eased to 4.3%. However, some analysts cautioned that the figures could be revised lower, as has happened previously.
Indeed, revisions to last year’s employment data revealed that job growth averaged 15,000 per month, significantly below the initially reported 49,000 average.
Bitcoin also weakened amid a continued drop in futures open interest, which has fallen to $45 billion from last year’s peak of over $95 billion—an indication that market participation and demand have cooled.
Additional pressure followed warnings from the Congressional Budget Office (CBO) about the US government’s unsustainable fiscal trajectory. The deficit is projected to rise by $4.7 trillion over the next decade. Increased immigration-related spending, estimated at more than $500 billion, is cited as one contributing factor, while Trump’s tariffs are expected to generate approximately $3 trillion in revenue.
BTC/USD Technical Analysis
On the daily chart, BTC/USD remains in a pronounced downtrend, sliding from its October high of 126,300 to around 67,665. The decline persists despite continued accumulation by large holders.
Technically, Bitcoin is trading below both the 50-day and 100-day Exponential Moving Averages, as well as the Supertrend indicator, reinforcing the bearish bias. The MACD has crossed below the zero line, while the Relative Strength Index hovers near 30, suggesting weak momentum and near-oversold conditions.
The most probable scenario is a continued decline toward the key support level at 60,000. Conversely, a break above the major resistance at 72,000 would negate the bearish outlook and signal the potential for renewed upside momentum.
Bitcoin hovered around $67,000 during Thursday’s Asian session, showing little movement as investors weighed stronger-than-expected U.S. jobs data that reduced hopes for an imminent Federal Reserve rate cut. The leading cryptocurrency edged up 0.4% to $67,102.8 but remained below the crucial $70,000 threshold, with trading subdued amid thinner liquidity conditions.
After bouncing back from a steep drop toward $60,000 earlier this month, Bitcoin has struggled to rebuild bullish momentum.
Robust U.S. jobs data tempers rate-cut expectations; CPI in focus
Figures released Wednesday showed U.S. nonfarm payrolls rose more than anticipated in January, highlighting ongoing strength in the labor market. The unemployment rate stayed near multi-month lows, and wage growth remained solid—reinforcing expectations that the Fed may keep interest rates elevated for longer.
In response, traders scaled back bets on a near-term rate cut, with market pricing now suggesting lower chances of easing before June. Prolonged higher rates tend to pressure risk-sensitive assets like cryptocurrencies.
Market participants are now looking ahead to weekly jobless claims data due later Thursday for additional insight into labor conditions. Friday’s U.S. Consumer Price Index (CPI) report will also be closely watched for signals on inflation and the Fed’s policy path.
Bitcoin’s continued failure to break above $70,000 underscores cautious sentiment and lingering volatility following its recent decline, keeping prices largely range-bound.
Crypto liquidity provider BlockFills has reportedly paused client withdrawals amid a sharp downturn in digital asset prices, according to multiple media outlets on Wednesday.
The Financial Times and other sources said the suspension, which began last week, aims to safeguard both clients and the company during turbulent market conditions while restoring liquidity on the platform.
Clients are reportedly still able to trade spot and derivatives under certain restrictions.
BlockFills serves over 2,000 institutional clients and processed more than $60 billion in trading volume in 2025, the FT noted. The move echoes similar steps taken by crypto firms during previous market slumps.
Crypto prices today: Altcoins edge higher in sideways trade
Most major altcoins posted modest gains Thursday amid range-bound trading.
Ethereum, the second-largest cryptocurrency, rose 1.1% to $1,972.92, while XRP gained 1.6% to $1.38. Solana traded flat, whereas Cardano and Polygon each climbed 2.5%. Among meme coins, Dogecoin advanced 2.2%.
The total cryptocurrency market capitalization has fallen about 10% over the past week to roughly $2.36 trillion. Paradoxically, this also marks a 10% rebound from Friday’s lows. Despite that uptick, near-term prospects remain uncertain, as the recovery stalled over the weekend and met selling pressure around the $2.4 trillion level. This suggests the move may have been a temporary bounce within a broader decline that has yet to fully run its course.
The sentiment index dropped to 6 over the weekend, matching the lows seen on June 18–19, 2022, and only falling lower once before, on August 22, 2019. By Monday, it had rebounded to 14 in line with market prices, but this remains an extremely depressed level and does not yet support confident buying.
Bitcoin recovered steadily on Friday after an early sharp sell-off, but from Saturday onward it encountered strong resistance around the $71,000 level. Significant supply remains in the market from investors looking to exit on rebounds, suggesting persistent selling pressure. Under these conditions, the possibility of a fresh test of the 200-week moving average in the near term should not be ruled out.
The decline in Bitcoin prices has been accompanied by shrinking liquidity, heightened volatility, weaker risk appetite, and a stronger correlation with equity markets. CryptoQuant suggests BTC could drop to around $54,600, a level at which the market may shift from capitulation toward accumulation.
Amid the broader crypto sell-off, Strategy reported a net loss of $12.6 billion for the fourth quarter, with operating losses totaling $17.4 billion. CEO Fong Le said the company would only face debt-servicing risks in the event of an extreme Bitcoin collapse to about $8,000.
Cardano founder Charles Hoskinson disclosed unrealized losses exceeding $3 billion, while emphasizing that he has no plans to liquidate his holdings even if market conditions deteriorate further.
Bitcoin miners are increasingly shutting down operations as losses mount. Mining profitability has fallen to record lows due to declining crypto prices and higher electricity costs, with JPMorgan estimating the average cost of mining at roughly $87,000 per BTC.
Following the latest adjustment, Bitcoin’s mining difficulty dropped 11.16% to 125.86 trillion, marking the steepest decline since 2021, when China banned cryptocurrency mining.
Despite the prevailing pessimism, JPMorgan remains constructive on Bitcoin’s long-term outlook, forecasting that it could eventually reach $266,000. The bank has also recently lifted its long-term gold price forecast to $8,000–8,500.
Bitcoin hovered above the $70,000 mark on Monday, stabilizing after a sharp rebound late last week from lows near $60,000, as investors reassessed risk appetite following widespread liquidations and shifted focus to key U.S. economic data due later in the week.
The world’s largest cryptocurrency was last up about 1.5% at $70,402.5 by 01:25 ET (06:25 GMT), moving further away from a roughly 16-month low of around $60,187 reached earlier in the week.
On Friday, Bitcoin surged back above $70,000, jumping more than 12% in a single session as rallies in technology stocks and precious metals lifted risk assets more broadly. The rebound was supported by bargain hunting after the steep selloff, alongside signs of stabilisation across global markets.
Bitcoin’s sharp decline last week reflected a broader risk-off environment, driven by a selloff in U.S. technology shares — especially AI-related stocks — and forced liquidations in crypto futures markets, which intensified downward pressure.
Ongoing outflows from Bitcoin spot ETFs and a pullback from leveraged positions were also seen as key contributors to the heightened volatility.
Japan election reinforces the shift in risk sentiment
Japanese Prime Minister Sanae Takaichi’s decisive election victory on Sunday reinforced her mandate to push ahead with fiscal stimulus and tax reductions. The landslide result lifted regional equities and was linked to a renewed appetite for risk across some global markets.
Although the yen initially weakened ahead of the vote, it later steadied alongside equity gains, helping to support broader market sentiment.
Attention is now turning to a series of important U.S. economic releases later this week, including delayed employment data due on Wednesday and the consumer price index report on Friday.
These figures are expected to shape expectations for the Federal Reserve’s policy path, with markets currently factoring in potential rate cuts later in 2026 should inflation cool and labour market momentum slow.
Crypto prices today: altcoins remain subdued after rebounding from recent lows
Most major altcoins moved within narrow ranges on Monday, showing limited follow-through after their recent rebound.
Ethereum, the world’s second-largest cryptocurrency, traded largely unchanged at $2,076.41. XRP, ranked third, edged 1.1% higher to $1.43.
Solana slipped marginally, while Cardano and Polygon were little changed on the day.
In the meme-token space, Dogecoin underperformed, falling about 2%.
Over the past year, market attention has largely centered on bitcoin’s price volatility and shifting investor sentiment. Headlines were dominated by discussions around regulation, adoption, and inflation. Meanwhile, a more subtle but potentially significant risk has been developing in the background: advances in quantum computing. Bitcoin has recently come under pressure as investors begin to factor in these concerns, prompting renewed debate over the cryptocurrency’s long-term security and durability.
Introduction
Rapid progress in quantum computing is raising fresh questions about the future security of blockchain-based systems. Bitcoin’s network depends on cryptographic algorithms to protect transactions and verify ownership, and researchers are increasingly examining whether sufficiently powerful quantum computers could one day compromise these safeguards.
These worries are no longer confined to academic circles. Christopher Wood, Jefferies’ global head of equity strategy, recently removed bitcoin from his model portfolio, citing the risk that breakthroughs in quantum computing could erode the cryptographic foundations underpinning the asset. He cautioned that any successful attack would call into question bitcoin’s credibility as a long-term store of value.
The Quantum Computing Threat
Quantum computing is widely viewed as the next major leap in computational technology. Traditional computers process information using binary bits—either a 0 or a 1. Quantum computers, by contrast, rely on quantum bits, or qubits, which can exist in multiple states simultaneously due to a phenomenon known as superposition. When combined with other quantum effects such as entanglement and interference, this capability allows quantum systems to solve certain classes of problems far more efficiently than classical machines.
Timothy Hollebeek, Industry Standards Strategist at DigiCert, offers a helpful analogy: classical computing is like navigating a maze by testing one route at a time, while a quantum computer can explore all possible paths simultaneously. This parallelism is what makes quantum computers especially powerful for tasks involving complex mathematics, including factoring large numbers and uncovering patterns within massive datasets.
Recent breakthroughs highlight the promise of quantum technology. Google’s quantum processor, Willow, reportedly completed a specialized computation in under five minutes—an exercise that would take classical supercomputers an impractically long time to finish. The chip is estimated to be roughly 13,000 times faster than the world’s most powerful traditional systems for that task. Achievements like this help explain why quantum computing is drawing growing interest across sectors such as healthcare, logistics, and materials research.
Still, despite the enthusiasm, quantum computing remains in its early developmental phase. Current systems face significant technical limitations. Qubits are highly fragile, must operate at temperatures close to absolute zero, and are extremely sensitive to environmental noise, which can introduce errors. Even in tightly controlled settings, sustaining a stable quantum state for more than a short duration remains challenging. For instance, Google’s Willow chip uses 105 qubits, whereas practical, fault-tolerant quantum computers would likely require thousands of reliably connected and stable qubits.
The rapid progress of quantum computing has prompted renewed scrutiny of the long-term security of cryptography-dependent digital systems, including cryptocurrencies. Because bitcoin’s architecture rests on assumptions about the limits of computational power, any transformative advance in computing naturally warrants closer evaluation.
The Real Threats That Could Undermine Bitcoin’s Value
“Quantum computers are not a matter of if, but when,” said Timothy Hollebeek, Industry Standards Strategist at DigiCert—a sentiment that helps explain why quantum advancements are increasingly viewed as a potential long-term risk to bitcoin’s security and valuation.
The most significant risk centers on Shor’s algorithm, a quantum method capable of compromising the elliptic curve digital signature algorithm (ECDSA) that bitcoin relies on to verify ownership of funds. Under today’s classical computing constraints, deriving a private key from a public key is computationally infeasible. However, in a future with sufficiently powerful quantum computers, this assumption may no longer hold. In theory, an attacker could extract a private key from its corresponding public key in a relatively short period, enabling unauthorized transfers of funds.
The quantum risk is not evenly spread across the bitcoin network. Roughly 25% of all bitcoins—more than 5 million BTC—are held in so-called “vulnerable” addresses, including early P2PK addresses and reused P2PKH addresses. This category also encompasses the estimated 1.1 million BTC attributed to Satoshi Nakamoto. These holdings are more exposed because their public keys are already visible on the blockchain, making them potential targets for quantum-enabled attacks. If even a fraction of these coins were moved by a quantum adversary, the resulting supply shock could be severe, shaking confidence in bitcoin’s ownership framework and placing significant downward pressure on prices.
Even newer address formats are not entirely risk-free under extreme assumptions. One commonly cited theoretical vulnerability involves transactions sitting in the mempool—the queue of unconfirmed transactions shared across network nodes. In this scenario, a sufficiently advanced quantum computer could detect a transaction before it is confirmed, derive the corresponding private key in real time, and submit a competing transaction that redirects the funds. Although highly speculative, this example illustrates how execution speed could become as critical as raw computational power.
Beyond outright theft, quantum computing could also erode trust in bitcoin’s neutrality and privacy. Through Grover’s algorithm, quantum-capable miners could gain a disproportionate advantage in proof-of-work mining, increasing the risk of mining centralization. If a single entity accumulated enough influence, it could censor transactions or reorganize blocks, undermining bitcoin’s decentralised ethos.
Another frequently cited risk is the concept of “harvest now, decrypt later,” where encrypted blockchain data is collected today with the expectation that future quantum computers could decrypt it. While this would not alter historical transactions, it could reveal identities behind pseudonymous wallets or expose past activity, weakening perceived privacy guarantees.
These technical risks are increasingly showing up in market behavior. By early 2026, quantum-related concerns had moved beyond abstract theory and begun to affect investor positioning. Bitcoin, for instance, lagged gold by roughly 6.5% year-to-date, while gold advanced about 55% over the same period. As a result, the bitcoin-to-gold ratio fell to around 19 BTC per ounce, signaling a more cautious stance toward bitcoin among investors.
Bitcoin Relative to Gold
How Bitcoin Could Be Compromised—and Why It Remains Resilient
At present, Bitcoin depends on elliptic curve cryptography (ECC)—specifically the secp256k1 curve—to generate public and private keys. Transactions are authenticated using ECDSA signatures, a system that is secure against classical computers but could be vulnerable to sufficiently advanced quantum machines. If that were to happen, both fund ownership and transaction integrity could be at risk.
One practical solution is the adoption of post-quantum cryptography (PQC), which is designed to withstand quantum attacks. Rather than requiring a complete overhaul of the network, PQC could be introduced incrementally, allowing vulnerable cryptographic components to be replaced over time.
Under a PQC framework, security would be reinforced through a three-layer defense. Kyber would protect communications between nodes and wallets, preventing interception or eavesdropping. Dilithium would handle transaction verification and safeguard private keys against quantum-enabled attacks. SPHINCS+ would ensure the integrity of transaction records, effectively giving each transaction a unique, tamper-resistant cryptographic fingerprint.
Bitcoin is not a static system. In January 2026, the first “Bitcoin Quantum” testnets began experimenting with post-quantum cryptography using NIST-standardised algorithms such as ML-DSA (formerly Dilithium). These trials demonstrated that quantum-resistant upgrades can be tested safely before any network-wide rollout. Such technologies strengthen transaction validation, data transmission, and record integrity, helping ensure bitcoin’s durability in a future shaped by quantum computing. Previous upgrades—including SegWit and Taproot—illustrate that bitcoin can evolve without disrupting network operations.
Resilience is not purely technical; it is also economic and social. A visible quantum-related attack would pose an immediate threat to bitcoin’s value, creating strong incentives for miners, developers, exchanges, and large holders to coordinate a rapid response. Historically, the network has shown an ability to converge quickly on practical solutions when facing systemic risks. Moreover, quantum computing is advancing incrementally, giving bitcoin ample time to prepare, test, and deploy defensive measures before the threat becomes acute. In this context, resilience is about managing technological change carefully rather than attempting to stop it outright.
Bitcoin’s robustness is rooted in both its architecture and its incentives. The network has no central authority, physical headquarters, or kill switch. Its ledger is maintained by thousands of independent nodes globally, eliminating single points of failure. A fixed supply cap of 21 million coins guards against monetary inflation, while the proof-of-work mechanism—secured by vast computational resources—makes large-scale attacks prohibitively expensive.
Widespread adoption further reinforces this resilience. By 2024, an estimated 500 million people held bitcoin or other cryptocurrencies, while institutional participation expanded through ETFs, hedge funds, pension funds, and even sovereign entities. As bitcoin becomes increasingly embedded in the global financial system, the economic and political costs of attempting to disrupt it continue to rise. Major stakeholders now have strong incentives to preserve long-term stability rather than undermine it.
Some observers, including Michael Saylor, have argued that a shift to quantum-resistant addresses could materially affect bitcoin’s market dynamics. If the network were to establish a migration deadline, coins held in legacy addresses—whose owners have lost access or passed away—could become permanently inaccessible. This would effectively remove millions of bitcoins from circulation, tightening supply and increasing scarcity. While the timing and market response remain uncertain, such a transition underscores the intricate relationship between technological evolution and bitcoin’s economic framework.
Conclusion
Quantum computing poses challenges that extend well beyond bitcoin, as many digital platforms and internet communications depend on the same public-key cryptographic systems that could eventually be vulnerable to quantum attacks. Nvidia CEO Jensen Huang has suggested that truly practical quantum computers may still be 15 to 30 years away, providing a meaningful window for industries to prepare and adapt.
In the meantime, leading technology firms are already moving to address these risks. Microsoft, for instance, is incorporating post-quantum cryptography (PQC) into its core software libraries and working alongside global standards organizations to develop quantum-resistant protocols for secure communications.
Together, these initiatives indicate that both the broader technology sector and the cryptocurrency ecosystem are actively planning for a post-quantum future, testing and deploying safeguards well ahead of the arrival of commercially viable quantum computers.
Bitcoin may be extended and capable of sharp countertrend bounces, but the broader signal is clearly weakening. When market leaders begin to roll over and assets start moving in lockstep, liquidity is usually the underlying issue.
When risk assets move together, it’s rarely intentional. Dispersion has collapsed, leadership is breaking down, and liquidity is retreating to the sidelines. Volatility is no longer being absorbed—it’s being amplified.
The extent of the damage matters. The very assets that led the risk rally are now suffering the most, not because the narrative has shifted, but because capital is being withdrawn rather than reallocated. That’s how selloffs become disorderly.
Signs of stress are already emerging in rates markets. Expectations for Federal Reserve easing this year have surged from 41 basis points to 61 basis points in just a few days—nearly a full rate cut being priced in within a week. Markets don’t make that kind of adjustment unless financial conditions are tightening rapidly.
Bitcoin is deeply stretched and prone to sharp countertrend rallies, but being oversold does not mean the downside is finished. This feels like the phase where correlations converge, risk assets move as one, and capital preservation takes precedence.
BTC/USD Price Action Deteriorates Sharply
My long-held view is that bitcoin’s price is ultimately driven by its own price action. Whatever the underlying catalysts, the market repeatedly failed to break above the $123,600 level in the second half of last year, with four separate weekly rejections at that resistance. That ceiling capped the advance and set the stage for a pullback toward the $99,800 support area, before price eventually slipped below the 50-week moving average—a level that had consistently provided support throughout last year’s uptrend.
From there, downside momentum intensified. Bitcoin broke decisively through the $99,800 support and then consolidated within a rising wedge, a bearish continuation pattern, before breaking down last week on a clear surge in volume. The move below $74,400 triggered a sharp acceleration lower, pointing to forced liquidations of long positions rather than orderly selling.
So far, price has rebounded from around $60,000, which is not surprising given how stretched conditions have become. Bitcoin remains well below the lower Bollinger Band, RSI is deeply oversold, and MACD is at extreme levels by historical standards. A rebound toward $74,400 is therefore quite possible, but unless that level is decisively reclaimed, any rally is likely to be sold into.
On the downside, there is limited meaningful support below $60,000 until roughly $49,400—a level that served as both support and resistance during parts of 2024.
Gold, silver, and mining stocks did initially move higher, but the rally was short-lived. Prices reversed intraday and then pushed lower, with the declines continuing today—benefiting all of our open trading positions. Hopefully, you followed the recommendation to short bitcoin, as previously emphasized.
The key question now is whether the corrective rebound has already run its course. In today’s analysis, the focus is on bitcoin and the equity market, as both remain closely linked to the performance of precious metals.
At this point, the odds appear evenly balanced. I’d put the chances at roughly 50/50, largely due to the factors driving the current pullback, at least over the near term.
Looking Beyond the U.S. Dollar
The U.S. Dollar Index has rallied recently, and while it was one of the drivers behind last week’s decline in precious metals, it does not account for this week’s weakness, as the USDX has been relatively subdued.
So what drove the sharp selloff in silver and mining stocks? What triggered the move—aside from the fact that both markets were extremely overbought from a technical standpoint?
The key driver was the sharp drop in equities. While the S&P 500’s decline may not appear dramatic on the surface, it is notable given the unusually low volatility that had prevailed in recent months.
That situation is likely to shift. Some traders may even consider exposure to VIX-related instruments or call options, though shorting bitcoin arguably offers greater leverage.
Equities have moved back toward their recent lows, and silver and mining stocks followed suit. This type of synchronized behavior is typical—and closely mirrors the market dynamics observed in 2008.
And this is where the situation turns especially grim
The stock market is now in a position similar to where it stood last year. After multiple attempts, it failed to hold a breakout above the prior year’s highs, effectively invalidating that move. The market also peaked shortly after reaching the vertex formed by earlier support and resistance lines.
If this pattern plays out again, the S&P 500 could fall toward the 6,300 area in the near term, stage a corrective rebound, and then slide further toward roughly 5,500.
Could it really drop that far?
Yes.
And in fact, a move to 5,500 may not mark the end of the market’s broader decline.
The AI Bubble Is Bursting
If the AI bubble does burst—and the sharp selloff in bitcoin suggests that risk appetite may already be cracking—the broader stock market could face a severe downturn. Much of the market’s prior strength was driven by aggressive buying in tech and AI-related names in the first place.
On the topic of bitcoin, here’s what I noted in yesterday’s Gold Trading Alert when discussing its recent “rebound”:
And while we’re on the subject of rebound magnitude, this is bitcoin’s rebound that barely qualifies as one. While prices did tick higher briefly, the move is almost imperceptible when viewed against the scale of the prior decline, visible only on very short-term charts.
This further underscores bitcoin’s underlying weakness and reinforces the case that gains on our short positions were likely to expand in the near term.
And that is precisely what unfolded.
The encouraging takeaway is that bitcoin still appears to have further downside ahead, suggesting our profits are likely to continue growing. The next meaningful support sits just below $60,000, though a brief drop toward the $50,000 level—a key round number and prior low—remains possible.
Such a move could, but does not necessarily have to, spark a rebound similar to the consolidation seen in 2024. If that scenario unfolds, it would likely form the right shoulder of a head-and-shoulders pattern, which could ultimately point to a much deeper decline toward the $30,000–$35,000 range.
So what does all of this mean for the precious metals market?
It suggests that a 2008-style crisis could indeed unfold again in the coming months.
This is a critical point. Although there is limited data to confirm it conclusively, silver and mining stocks have so far shown a strong correlation with the broader equity market’s performance.
Bitcoin plunged on Thursday to its lowest level since mid-October 2024, as thinning liquidity and a broad selloff in global technology stocks renewed pressure on risk assets. The world’s largest cryptocurrency was last down 12.4% at $63,539.4 by 17:28 ET (22:28 GMT).
The token has fallen in seven of the past eight sessions and is now down nearly 50% from its record high of around $126,000 reached in October 2025. Interactive Brokers chief strategist Steve Sosnick said the scale of the decline suggests the crypto market has moved beyond a normal cycle, describing it as a full-blown bear market given drawdowns of 40% to 50% or more.
Tailwinds that once boosted crypto now turning into headwinds
Bitcoin’s sharp selloff has intensified in recent days amid a broader rout in technology stocks, as investors rotate out of high-risk assets. According to Interactive Brokers strategist Steve Sosnick, several of the forces that fueled bitcoin and other cryptocurrencies’ rapid ascent in 2025 have now turned into headwinds.
Strong inflows following the launch of bitcoin ETFs in January 2024, the Trump administration’s supportive stance toward digital assets, and substantial purchases by crypto-focused treasury firms all helped drive prices higher, Sosnick said. He added that crypto also benefited during the rally from minimal margin constraints, as many exchanges and dealers offered extremely high leverage. Unlike stocks and ETFs, which are limited by Regulation T and similar rules, this leverage allowed investors to amplify gains—an effect that is now accelerating losses as prices fall.
After bitcoin surged to a record high above $126,000 on October 6, the broader cryptocurrency market experienced a sharp selloff just four days later. Analysts later described the move as a “flash crash,” attributing it to heavily leveraged dealers being forced to unwind positions amid margin-related losses.
Interactive Brokers strategist Steve Sosnick said that as market momentum shifted, several of the factors that had previously supported cryptocurrencies began to turn into headwinds. He noted that while leverage can significantly amplify gains during rallies, it can also sharply magnify losses during downturns. Sosnick added that progress on anticipated crypto regulation stalled in Congress, while equity-focused investors rotated toward other opportunities as momentum faded. He also pointed out that although exchange-traded funds made it easy for investors to gain crypto exposure, they also enabled swift exits when sentiment turned.
According to Sosnick, what began as a routine correction ultimately snowballed into a full-blown rout, mirroring selloffs seen in other assets that had posted outsized gains, including software stocks and precious metals.
Dwindling liquidity
Reports indicated that market liquidity was particularly thin, magnifying price swings and triggering a wave of forced liquidations as bitcoin fell through closely watched technical levels. The selloff was intensified by aggressive unwinding of leveraged positions—especially in derivatives markets—after bitcoin’s slide below $75,000 activated a series of stop-loss orders. Data from crypto analytics firm CoinGlass showed that nearly $770 million worth of cryptocurrency positions were liquidated over the past 24 hours.
Most major altcoins also moved sharply lower on Thursday. Ethereum, the world’s second-largest cryptocurrency, fell 11.5% to $1,878.11, while XRP, the third-largest token, plunged 21% to $1.19. Solana and Cardano recorded steep losses as well, sliding 11.9% and 11.1%, respectively. Meme coins were also hit hard, with Dogecoin down 12.1% and the $TRUMP token sinking more than 14%.
In our Ethereum (ETHUSD) update from three weeks ago, we noted that ETH had been forming an ascending triangle since 2020—characterized by higher lows and relatively equal highs—signaling that the long-term uptrend remained intact. We also highlighted that a pullback toward the ~$2,200 support area, followed by a breakout, could open the door for a move toward ~$6,190.
Today, Ethereum is trading near that trend line at around $2,150. At the same time, the daily RSI(30) has declined to 32. Historically, aside from the 2018 bear market, this zone has provided attractive low-risk, high-reward opportunities for investors with a long-term horizon or those employing a dollar-cost averaging (DCA) strategy (see Figure 1).
Figure 1: Ethereum’s daily price action since 2015.
More on the RSI is discussed below. In the meantime, what would be the downside risk if the trend line fails to hold, allowing for some short-term whipsaw action? That scenario is illustrated below using the Elliott Wave Principle (EW). Under this framework, ETH’s price action suggests it may be unfolding within a larger, higher-degree fourth wave—labeled as the black Wave 4. See Figure 2.
Figure 2: Ethereum’s monthly price action since 2015.
In this scenario, Ethereum would gravitate toward the lower black dotted trend line, which has acted as key downside support since 2021 and is currently near $1,450. From that level, the second-largest cryptocurrency by market capitalization could still resume its advance, unfolding a (black) fifth wave that ideally targets around $6,200 (4,865 − 1,08? + 1,450). This aligns closely with the breakout objective from our original analysis, where we noted: “If Ethereum drops to ~$2,200 support first and then breaks out, we can expect ~$6,190.”
Lastly, it is worth noting that the monthly RSI(5) has now fallen below 30. Similar to the daily RSI(30), historical data shows that this level has typically provided low-risk, high-reward opportunities for investors with a long-term horizon and/or those employing a dollar-cost averaging (DCA) approach.
The slide followed heavy losses in Asian and U.S. technology stocks, as fears that AI investment may be peaking—alongside stretched valuations and slowing earnings growth—pushed investors away from risk assets.
What to know:
Bitcoin dropped as much as 7.5% during Asian trading on Thursday, falling below $71,000 as a global tech-led selloff spilled over into crypto markets.
The move came after sharp declines in Asian and U.S. tech shares, driven by concerns over cooling AI spending, elevated valuations, and weakening earnings momentum.
Bitcoin’s latest fall, alongside steep losses in silver and gold, highlights its behavior as a high-beta risk asset. Thin liquidity and rising macro uncertainty have amplified price swings, pointing to fragile investor conviction rather than a definitive trend reversal.
Bitcoin fell below the $71,000 threshold during Asian trading on Thursday as a renewed global selloff in technology stocks spilled over into crypto markets, dampening hopes of a sustained recovery after last week’s sharp volatility.
The world’s largest cryptocurrency dropped as much as 7.5% over the past 24 hours, briefly touching lows near $70,700 before trimming some losses, according to CoinDesk data.
The decline followed steep losses across Asian equity markets, where rising concerns about slowing artificial intelligence spending, elevated valuations, and weakening earnings momentum pushed investors further away from risk assets. MSCI’s Asia technology index fell for the fifth time in six sessions, led by a roughly 4% drop in South Korea’s Kospi as AI-linked heavyweight stocks came under pressure.
Weakness in Asia followed a selloff in U.S. markets, where the Nasdaq slid after underwhelming earnings from companies including Alphabet, Qualcomm, and Arm reinforced fears that the AI investment cycle may be peaking sooner than expected.
Bitcoin has increasingly behaved like a high-beta risk asset during equity-driven downturns, particularly when liquidity is thin and macroeconomic uncertainty intensifies.
The latest slide comes after choppy price action earlier in the week, when bitcoin dropped toward $73,000 before rebounding above $76,000—moves that signaled fragile investor conviction rather than a decisive trend reversal.
Pressure was exacerbated by sharp moves in commodities. Silver plunged as much as 17%, while gold fell more than 3%, extending a severe unwind that has already triggered significant liquidations in tokenized metals products across crypto trading platforms.
Stellar continued its corrective move on Thursday after failing to reclaim a previously broken trendline. Derivatives data points to mounting weakness, with short positions increasing even as open interest declines. The technical picture remains bearish, suggesting sellers retain control and could push the price into a deeper correction.
Stellar (XLM) continued its corrective decline on Thursday, trading below $0.167 at the time of writing after facing rejection at a key resistance level. Derivatives indicators signal growing weakness, with short positions increasing even as open interest declines. From a technical perspective, bearish momentum remains dominant, leaving XLM vulnerable to further downside and potential new lows.
Derivatives data signals downside bias for XLM
CoinGlass data shows XLM’s long-to-short ratio at 0.85 on Thursday, close to its lowest level in a month. A reading below one indicates a bearish skew in market positioning, with a greater share of traders betting on further price declines.
Stellar’s futures open interest fell to $95 million on Thursday, marking its lowest level since November 2024 and continuing a steady decline seen since the start of the year. The reduction in open interest signals diminishing trader participation and reinforces the broader bearish outlook for XLM.
Stellar Price Forecast: XLM deepens correction after slipping below key support
Stellar fell more than 13% last week, closing below the lower boundary of a falling wedge pattern on Saturday. Since then, XLM has repeatedly faced rejection near the broken trendline through Wednesday, extending losses by more than 5%. As of Thursday, the token is trading around $0.169.
If the corrective move continues, XLM could slide further toward its 2025 yearly low at $0.160, recorded on October 10.
Momentum indicators continue to point lower. The daily Relative Strength Index (RSI) stands at 26, signaling oversold conditions and strong bearish pressure. Meanwhile, the Moving Average Convergence Divergence (MACD) has remained in a bearish crossover since mid-January, with expanding red histogram bars below the zero line reinforcing the negative technical bias.
Alternatively, a recovery in XLM could see prices push higher toward the lower boundary of the trendline, near the $0.180 level.
Bitcoin fell to a 15-month low on Wednesday, sliding toward the $72,000 level amid a broad-based selloff across global financial markets.
The world’s largest cryptocurrency dropped as much as 5.4% to $72,047, its weakest level since Nov. 6, 2024—the day after Donald Trump’s U.S. presidential election victory. Bitcoin has now shed more than 40% from its record high reached in October 2025.
While earlier declines this week were largely driven by crypto-specific liquidations, Wednesday’s losses appeared to be part of a wider risk-off move. Global markets saw coordinated selling pressure, with the Nasdaq 100 falling more than 2% as software stocks, semiconductor names, and other interest rate–sensitive sectors came under pressure.
Bitcoin on Tuesday wiped out all of the gains it had made since President Donald Trump’s election victory in early November 2024. Selling pressure continued into Wednesday, briefly dragging the world’s largest cryptocurrency below the $72,000 level.
The digital asset has now plunged roughly 42% from its record high above $126,000 reached last October, firmly placing it in bear-market territory.
Bitcoin surged through 2025 on expectations of a more crypto-friendly regulatory environment under the Trump administration, strong inflows into spot exchange-traded funds, and growing institutional adoption. Since peaking, however, prices have fallen sharply, with losses accelerating in 2026.
Citi Research analyst Alex Saunders said downside sensitivity to equity markets, heightened geopolitical risks, and long-position liquidations have weighed heavily on bitcoin and the broader crypto market.
Saunders also noted a clear slowdown in inflows to U.S. spot bitcoin ETFs since Oct. 10 last year, which he views as a key source of incremental demand. The drop in new money has coincided with increased caution among long-term holders, who have grown more concerned about cyclical weakness in bitcoin.
Nearing critical levels
Bitcoin slid as much as 5% on Wednesday to an intraday low of $71,913.4, marking its weakest level since early November 2024.
Citi Research analyst Alex Saunders said bitcoin is now nearing critical price thresholds. He noted that prices have fallen below Citi’s estimated average U.S. spot ETF entry level of $81,600 and are approaching the roughly $70,000 level that prevailed ahead of the U.S. presidential election.
Saunders pointed to U.S. legislation passed by the House in July 2025—currently stalled in the Senate—as a potential catalyst for renewed investor interest. He said there has been some progress early this year, with the Senate Finance Committee releasing a draft bill intended to be reconciled with the House-approved CLARITY Act, although the proposal has yet to gain broad support and a committee vote has been delayed. The Senate Agriculture Committee has also advanced its own version of the legislation.
According to Saunders, positive developments on the regulatory front could provide a meaningful boost to market sentiment and capital inflows, citing past examples such as stronger ETF demand following the U.S. election and the passage of the GENIUS Act in July 2025.
No signs of structural stress in crypto markets
Analysts say bitcoin’s latest selloff does not signal deeper structural problems, but rather reflects the normal ebb and flow of bull and bear cycles.
“Recent price movements in bitcoin don’t suggest that anything has broken in the crypto market—they simply mirror the current stage of the broader macroeconomic cycle,” said Gil Rosen, co-founder of the Blockchain Builders fund, in comments to Investing.com. He noted that earlier gains had overshot reality, with markets pricing in an unrealistically smooth rally. The subsequent decline, Rosen added, was not driven by crypto-specific factors, but by external pressures including geopolitics, tariffs, and policy uncertainty. As institutional investors now play a larger role, bitcoin increasingly trades like a risk asset, making it more vulnerable when macro conditions deteriorate.
Nicholas Motz, CIO of Soil.co and CEO of ORQO.digital, echoed this view, arguing that the sharp unwinding of precious metals positions late last week triggered a broader risk-off move across asset classes.
“When investors face pressure in traditional safe havens, they often sell their most liquid and profitable holdings—such as bitcoin—to offset losses elsewhere,” Motz said. He characterized the recent decline as a forced deleveraging episode rather than a fundamental change in long-term crypto adoption.
Bitcoin hovered just above 15-month lows on Wednesday after a sharp sell-off drove the world’s largest cryptocurrency down toward the $73,000 level amid a wave of liquidations and heightened risk aversion. The token was last trading 2.8% lower at $76,509.1 as of 01:56 ET (06:56 GMT), having earlier touched $73,004.3—its weakest level since November 2024.
Following the weekend’s slump, Bitcoin fell nearly 12% last week, building on a roughly 10% decline in the prior week. The latest drop marks its lowest point since Donald Trump’s U.S. election victory, wiping out gains that had previously been supported by optimism around potential regulatory easing for the cryptocurrency sector.
Bitcoin sinks to a 15-month low as mass liquidations accelerate
The downturn was accompanied by widespread liquidations of leveraged long positions. According to data from crypto analytics firm CoinGlass, nearly $740 million in bullish bets were erased over the past 24 hours, as falling prices triggered margin calls and forced traders to close positions.
Bitcoin’s latest weakness represents a sharp reversal from the strong rally seen late last year, when prices surged in the wake of Donald Trump’s election victory. At that time, investors poured into cryptocurrencies on expectations that a new U.S. administration would adopt a more supportive regulatory approach to digital assets. Additional tailwinds came from Federal Reserve rate cuts starting in December 2024, which helped fuel demand for higher-risk assets.
Gold and other traditional safe-haven assets rebounded on Wednesday as geopolitical tensions between the United States and Iran intensified.
At the same time, cryptocurrency markets remain under pressure amid uncertainty surrounding U.S. monetary policy following President Trump’s nomination of former Federal Reserve Governor Kevin Warsh as the next Fed chair. Warsh is widely regarded as a policy hawk, raising concerns over tighter liquidity conditions.
Most altcoins remained under pressure on Thursday, posting steeper losses than Bitcoin. Ethereum, the world’s second-largest cryptocurrency, slipped 2.3% to $2,268.92, while XRP, ranked third, edged 1.1% lower to $1.59.
Solana dropped 6%, while Cardano also moved lower and Polygon declined 3.5%. Among meme tokens, Dogecoin was marginally weaker, down 0.2%.
Solana remains below the $100 level on Wednesday after shedding more than 6% in the previous session.
Weakening retail sentiment alongside subdued institutional interest points to a growing bearish bias.
From a technical perspective, rising selling pressure suggests further downside toward the $85 region.
Solana (SOL) remains below the $100 mark at press time on Wednesday, following a decline of more than 6% in the prior session amid broader weakness across the cryptocurrency market. Both institutional and retail interest in Solana continue to fade, even as on-chain metrics recorded a record 150 million daily transactions on Tuesday. From a technical standpoint, strengthening bearish momentum points to the risk of a further slide toward the $85 level.
Solana continues to see robust on-chain user activity, with daily transaction volume reaching a record high on Tuesday. According to Blockworks data, the network processed over 150 million transactions during the day, averaging approximately 1,743 transactions per second.
Despite resilient on-chain activity, institutional inflows have stayed muted over the past three weeks, averaging no more than $9 million per day since January and including three sessions of net outflows. Data from Sosovalue shows that U.S. Solana-focused exchange-traded funds (ETFs) posted inflows of $1.24 million on Tuesday, following a $5.58 million inflow recorded on Monday.
Meanwhile, signals from the derivatives market point to a bearish tilt in Solana sentiment, accompanied by capital outflows. CoinGlass data shows that SOL open interest fell by 1.24% over the past 24 hours to $6.37 billion, suggesting capital exited the market through position closures or reduced leverage.
Liquidation data further highlights the bearish bias, with long liquidations totaling $22.31 million during the period—more than five times the $4.39 million in short liquidations.
In addition, Solana’s OI-weighted funding rate has slipped to -0.0238%, underscoring increasingly negative sentiment as traders holding or initiating short positions are willing to pay a premium to maintain them.
The waning bullish appetite for Solana mirrors the broader market downturn, which has seen total liquidations of around $735 million over the past 24 hours, including approximately $529 million from long positions.
Moreover, the broader cryptocurrency market remains under pressure, with the Fear and Greed Index falling to 14 on Wednesday—pointing to extreme risk-averse sentiment among investors. Without a meaningful improvement in market mood, Solana may face additional downside.
Technical Outlook: Is Solana headed toward $85?
Solana continues to trade below its 50-, 100-, and 200-day Exponential Moving Averages at $127, $139, and $153, respectively, keeping the broader trend firmly under pressure. The shorter-term EMAs remain positioned beneath the longer-term averages, forming a bearish alignment that has capped recent rebound attempts.
A sustained move below the $95 level would leave the S1 Pivot Point at $85 as the next downside target.
Momentum indicators remain decisively negative, with the MACD and signal line both trending lower and extending further into bearish territory on the daily chart. Meanwhile, the Relative Strength Index stands at 28 and is consolidating within oversold territory, a setup that could still allow for additional downside despite stretched conditions.
On the upside, a recovery back above the $100 level could shift focus toward the 50-day EMA near $127 as the initial upside objective.
WisdomTree CEO Jonathan Steinberg said the firm’s push into tokenization is approaching profitability, underscoring a shift in which crypto has evolved from a small-scale experiment into a core pillar of the company’s strategy.
The asset manager has rapidly expanded its digital-asset business, growing tokenized assets under management from roughly $30 million to about $750 million, while extending its offerings across additional blockchains, including Solana.
Steinberg described crypto as a foundation for modernizing financial infrastructure, pointing to initiatives such as tokenized investment products, the WisdomTree Connect platform, and a deliberate focus on compliance-oriented tokenization technology as central to the firm’s long-term growth plans.
New York — WisdomTree’s crypto business has moved beyond the experimental phase and is now central to the firm’s long-term strategy, with profitability coming into view, CEO Jonathan Steinberg said during a fireside chat at the Ondo Summit in New York on Tuesday.
“We want to continue to scale,” Steinberg said, noting that the firm’s digital-asset business expanded from roughly $30 million to about $750 million in assets last year. While WisdomTree does not yet generate profits from its crypto operations, Steinberg said the company is now “within line of sight of taking this to a profitable business.”
The $150 billion asset manager has been investing heavily in blockchain infrastructure, rolling out tokenized investment products and expanding to additional blockchains, including Solana. Steinberg emphasized that the push reflects long-term conviction rather than short-term experimentation. “It’s still early days, but it’s not an experiment now,” he said. “We have conviction, and we believe that eventually everything will move on-chain.”
WisdomTree’s growing commitment to digital assets was also highlighted in its latest earnings presentation, which showed total tokenized assets under management rising to $770 million—an increase of roughly 25 times from 2024 levels.
WisdomTree has emerged as an early and aggressive leader among traditional asset managers in the digital-asset space, rolling out a range of tokenized funds and recently broadening distribution through WisdomTree Connect, a platform that allows these assets to move seamlessly across self-custodied wallets and institutional systems.
The firm has also made a strategic push into blockchain infrastructure, most notably through its acquisition of Securrency, a compliance-focused tokenization company that was later sold to the DTCC. Steinberg said the deal laid the groundwork for “compliance-aware tokens” and programmable finance, forming the backbone of WisdomTree’s long-term, interoperable digital-asset strategy.
For Steinberg, crypto represents far more than a new product line—it signals a transformation of the financial system itself. “This is bigger than asset management; it’s really about financial services,” he said. He noted that many financial institutions are built on layers of legacy infrastructure accumulated over centuries, underscoring the need for modernization.
The steep sell-off in cryptocurrencies eased on Tuesday after the U.S. House narrowly approved a funding package, sending the legislation to President Donald Trump’s desk and effectively ending the partial government shutdown.
The House passed the bill by a slim 217–214 margin, clearing the way for the government to reopen once the president signs it. While lawmakers will continue negotiations over funding for the Department of Homeland Security in the coming days, most major federal agencies will remain funded.
The development helped pause a panic-driven rout in crypto markets earlier in the session. Bitcoin briefly slid to around $72,800—its lowest level since before Trump’s election victory in November 2024—before stabilizing. At roughly $74,800, bitcoin was still down about 4.5% over the past 24 hours.
Ether traded near $2,181, down 7% on the day and roughly 26% over the past week. Other major tokens, including XRP and Solana, recorded similar losses.
U.S. equities also rebounded from their intraday lows but remained sharply lower overall, with the Nasdaq down around 2% and the S&P 500 lower by about 1.3%.
Bitcoin fell sharply on Tuesday, giving up all gains made since President Donald Trump’s election victory, as selling pressure remained intense following heavy liquidations over the weekend. Ongoing uncertainty surrounding U.S. monetary policy further weighed on sentiment.
The world’s largest cryptocurrency was last down 4.2% at $74,699.9 by 15:12 ET (20:12 GMT), marking its lowest level since early November 2024. Prices touched an intraday low of $73,004.3, leaving Bitcoin down roughly 59% from its record high and firmly entrenched in bear market territory.
Menno Martens, a crypto specialist and product manager at VanEck, said the market is simply entering another familiar phase of the cycle.
“There’s no question that this is a bear market,” Martens told Investing.com, noting that the current downturn differs from previous ones due to growing geopolitical and macroeconomic influences, particularly developments in the United States.
He explained that the path of this cycle does not mirror past bull and bear markets exactly, largely because of these new external factors. However, Martens emphasized that the broader outlook remains unchanged, adding that VanEck continues to maintain a long-term perspective despite the current bearish conditions.
Bitcoin weighed down by heavy liquidations and Trump’s Fed pick
The sharp sell-off in cryptocurrencies over the weekend was fueled by widespread liquidations of leveraged positions, underscoring the heavy speculative buildup that had accumulated during last year’s rally. Data from derivatives tracking firms showed that crypto positions worth several billion dollars were wiped out in a short span, with long trades accounting for most of the forced closures.
Thin market liquidity further amplified volatility, allowing relatively modest price moves to trigger cascading liquidations.
Investor sentiment has also been dampened by broader macroeconomic uncertainty. Markets are weighing the implications of Kevin Warsh’s nomination as the next chair of the U.S. Federal Reserve, prompting a reassessment of the outlook for interest rates.
Warsh is broadly perceived as leaning toward a more hawkish policy stance, stoking concerns that tighter financial conditions could persist for longer.
Separately, the release of January’s closely watched U.S. employment report—originally scheduled for Friday—has been delayed due to a partial government shutdown, according to the Bureau of Labor Statistics.
White House crypto meeting ends without agreement on stablecoin yields
The cryptocurrency industry and major U.S. banks remain divided over how to regulate stablecoin yields following a White House meeting, underscoring ongoing hurdles to advancing long-delayed crypto legislation, according to media reports.
Executives from crypto companies, representatives from large banks, and government officials gathered in Washington to discuss market-structure rules, but made little headway on the key question of whether stablecoin issuers should be permitted to offer yield-like returns.
Banks have warned that yield-bearing stablecoins could accelerate deposit outflows and threaten financial stability, while crypto firms argue that such features are essential for innovation, growth, and maintaining competitiveness.
Crypto prices today: altcoins rebound as Polygon surges 10%
Most altcoins also moved lower on Tuesday.
Ethereum, the world’s second-largest cryptocurrency, fell 4.9% to $2,242.43, while third-ranked XRP declined 3.6% to $1.58.
Solana dropped 4.1%, and Cardano eased 1.8%.
Among meme tokens, Dogecoin slipped 2.1%, while the $TRUMP token fell 1.4%.
Stablecoin issuer Tether said its newly launched MiningOS is a modular, self-hosted software stack designed to support mining operations ranging from small home rigs to large, multi-site industrial facilities.
What to know:
Tether has introduced MiningOS, an open-source, modular operating system for Bitcoin mining designed to streamline infrastructure management and lessen reliance on proprietary vendor software.
The self-hosted platform uses a peer-to-peer architecture, allowing miners to manage operations without centralized services and scale seamlessly from home rigs to multi-site industrial facilities.
Released under the Apache 2.0 license and built on Holepunch peer-to-peer protocols, MiningOS is hardware-agnostic and positions Tether alongside other advocates of open-source mining solutions, including Jack Dorsey’s Block.
Tether has unveiled an open-source operating system for Bitcoin mining, positioning it as a tool to simplify infrastructure management while cutting dependence on closed, vendor-controlled software. On Monday, the stablecoin issuer announced the launch of MiningOS (MOS), a modular and scalable mining platform built to serve everyone from individual hobbyists to large institutional operators.
The software aims to eliminate the “black box” nature of many existing mining setups, where hardware and monitoring systems are tightly locked into proprietary ecosystems. According to Tether, MiningOS prioritizes transparency, openness, and collaboration, and is designed with no vendor lock-in.
MOS operates on a self-hosted architecture and uses an integrated peer-to-peer network to communicate with connected devices, enabling miners to manage operations without centralized services. Operators can tailor settings via a companion interface based on their scale and production needs. Tether CEO Paolo Ardoino described MOS as a “complete operational platform” capable of scaling from a single home rig to industrial-grade mining sites spread across multiple locations.
Tether first outlined plans for an open-source mining operating system in June last year, saying new miners should be able to compete without relying on costly third-party software and management providers. The launch puts Tether alongside other crypto companies advocating open-source mining infrastructure, including Jack Dorsey’s Block.
MiningOS is released under the Apache 2.0 license and is built on Holepunch peer-to-peer protocols, a design choice intended to keep the software stack independent of external third-party dependencies.
Bernstein notes that the ongoing pullback in the crypto market may be short-lived, with Bitcoin potentially starting a recovery in the first half of the year.
The firm’s analysts point to rising institutional inflows and shifting US policy dynamics as factors that could underpin what they describe as Bitcoin’s “most consequential cycle.”
Other market participants anticipate capital rotation away from “overcrowded” precious metals and into Bitcoin.
Bitcoin may find a price floor near its previous cycle peak in the $60,000 area before staging a potential recovery in the first half of the year, according to analysts at Bernstein.
Led by Gautam Chhugani, the analysts noted that the recent pullback in crypto prices follows a period of strong outperformance by gold relative to Bitcoin over the past year. They added that Bitcoin’s market capitalization compared to that of gold is nearing a two-year low, as central banks have significantly increased their gold purchases over the past year.
Bernstein added that the recent market softness may represent a short-lived correction rather than the start of a prolonged bearish cycle, driven by several underlying factors.
New catalysts help Bitcoin remain resilient despite price weakness
The firm argued that robust institutional inflows into Bitcoin ETFs — which now hold roughly $165 billion in assets — alongside growing allocations from corporate treasuries, have helped the market move beyond the traditional boom-and-bust cycle.
Bernstein also pointed to the lack of miner-led capitulation, a feature commonly seen in past market downturns. Instead, miners have increasingly diversified their revenue by expanding into AI-focused data center operations, reducing their reliance on Bitcoin price fluctuations.
US policy developments were cited as another potential upside catalyst. Bernstein highlighted the creation of a Strategic Bitcoin Reserve funded by seized government BTC holdings, while potential changes in Federal Reserve leadership under nominee Kevin Warsh could further enhance Bitcoin’s standing. The analysts suggested that broader political alignment with the crypto sector could pave the way for Bitcoin to be viewed as a sovereign or reserve-like asset.
“We do not expect a passive response from the U.S. government if digital asset markets continue to decline,” the analysts wrote.
The latest assessment follows Bernstein’s projection last month that Bitcoin had bottomed near $80,000. At the time of publication, the world’s largest cryptocurrency was trading around $78,000, up 1.8% over the past few hours.
Hyperliquid rises 8% above its 200-day EMA on Tuesday, extending Monday’s nearly 9% advance.
The project unveiled plans to support outcome trading through the HIP-4 proposal.
Retail participation picks up as HYPE futures Open Interest posts double-digit gains to around $1.85 billion.
Hyperliquid (HYPE) continued its recovery on Tuesday, rising 8% at the time of writing, fueled by optimism surrounding the HIP-4 proposal aimed at introducing outcome trading, including prediction markets and bounded options contracts. Growing retail engagement with the decentralized exchange and its native token is reflected in a more than 25% jump in HYPE futures Open Interest, signaling strong capital inflows. From a technical perspective, HYPE maintains a bullish bias, with strengthening buying pressure and improving trend momentum.
Hyperliquid rekindles retail interest with prediction market plans
Hyperliquid unveiled the HIP-4 proposal on Monday during early US trading, outlining plans to introduce prediction markets and fixed-range options contracts in an effort to compete with established platforms such as Polymarket and Kalshi. Retail participation in prediction markets has surged amid heightened volatility across global financial markets and geopolitical developments.
The latest initiative marks an expansion of the Hyperliquid exchange beyond commodity trading, which was introduced under the HIP-3 proposal, and underscores the platform’s ongoing development aimed at better meeting trader demand.
CoinGlass data shows that HYPE futures Open Interest (OI) jumped 27% over the last 24 hours to $1.84 billion, indicating significant inflows. Typically, such a large capital inflow in futures markets during an uptrend indicates an upside bias among traders.
A massive wipeout of short sellers over the last 24 hours, evidenced by short liquidations of $31.69 million outpacing long liquidations of $1.58 million, corroborates the upside bias in HYPE futures. Additionally, the funding rate of 0.0046% signals a bullish interest among traders.
Technical outlook on Hyperliquid: Can HYPE reach the $50 level?
Hyperliquid rebounded from the 100-day Exponential Moving Average (EMA) at $30.61, posting gains of around 24% so far this week. At the time of writing on Tuesday, HYPE is up 14% on the day and has reclaimed the 200-day EMA at $32.89. The next upside hurdles are seen at $35.51 — aligned with the August 2 low — and the R1 Pivot Point at $37.07.
The broader technical structure reinforces a strong recovery bias, with longer-term EMAs trending higher above shorter-term averages on the daily chart. A sustained close above $37.07 could pave the way toward the R2 Pivot Point at $43.15, followed by a key resistance zone near the $50.00 psychological mark.
Momentum indicators also favor further upside. The Moving Average Convergence Divergence (MACD) continues to strengthen, with histogram bars expanding above the zero line, signaling accelerating bullish momentum. Meanwhile, the Relative Strength Index (RSI) stands at 71, entering overbought territory and reflecting strong buying pressure.
On the downside, a failure to sustain a move above the 200-day EMA at $32.89 would undermine the bullish outlook and could trigger a pullback toward the 100-day and 50-day EMAs, located at $30.62 and $28.03, respectively.
U.S. stock index futures edge lower as a sharp selloff in gold and silver weighs on investor sentiment ahead of a packed week of major corporate earnings and key economic releases. Bitcoin continues to slide after dropping below $80,000 over the weekend. Elsewhere, Oracle signals plans for fresh fundraising, while speculation over potential executive changes at Walt Disney grows ahead of its upcoming quarterly results.
Futures edge lower
U.S. equity index futures moved lower on Monday, pointing to a continuation of last session’s losses at the start of the new trading week.
As of 03:11 ET (08:11 GMT), Dow futures were down 323 points, or 0.7%, S&P 500 futures had declined 62 points, or 0.9%, and Nasdaq 100 futures were lower by 291 points, or 1.1%.
Market participants are closely watching a heavy slate of upcoming corporate earnings alongside a new monthly jobs report. Together, these releases could shed light on the health of the U.S. economy and test the resilience of a stock market rally now in its fourth year.
Beyond ongoing questions over the durability of the artificial intelligence-driven rally, investors are also weighing the implications of President Donald Trump’s nomination of Kevin Warsh as the next Federal Reserve Chair. If confirmed by the Senate, Warsh would bring his long-held calls for a shift in the monetary policy framework to the world’s most influential central bank.
Gold and silver extend their selloff
A sharp decline in both gold and silver, continuing the historic drop seen on Friday, weighed heavily on market sentiment—especially in Asia, where equities broadly fell.
Following a nearly 10% plunge late last week, spot gold fell another 4.9% to $4,626.80 per ounce by 03:27 ET, slipping well below the $5,000 mark it had just recently surpassed. Silver, which had benefited from speculative interest and industrial demand, also faced selling pressure but had somewhat stabilized around $79 an ounce as of 03:30 ET.
Analysts attribute the metals’ losses to a stronger U.S. dollar and widespread profit-taking after their significant rally in recent months.
Investors also showed concern about Kevin Warsh’s potentially hawkish stance in the long term. Although Warsh—formerly a Federal Reserve governor—has supported President Trump’s calls for sharply lower interest rates, he has been critical of the Fed’s asset purchase programs.
“Warsh is viewed as the most inflation-focused candidate for the Fed chair, reducing the chances of aggressive monetary easing. This sparked a wave of selling, with gold enduring its steepest decline in four decades,” ANZ analysts noted.
Bitcoin continues to decline
The risk-averse mood extended to cryptocurrencies, with Bitcoin dropping over 2% to $76,892.4. On Saturday, the leading digital currency fell below the $80,000 mark, continuing its decline from Friday. Some investors worried that Kevin Warsh might support shrinking the Federal Reserve’s balance sheet, which could reduce liquidity in the financial system.
Larger Fed balance sheets have historically supported cryptocurrencies by injecting cash into money markets, providing backing for riskier assets.
This latest slide marks another downturn for Bitcoin since reaching its all-time high last October. Once buoyed by optimism over increased cash flows and a friendlier regulatory environment under Trump, the token has now lost about one-third of its value.
With turmoil spreading across stocks, commodities, and crypto, Jonas Goltermann, Deputy Chief Markets Economist at Capital Economics, described the past few days as “unusually hectic […] for financial markets” in a recent note.
Oracle announces plans for new fundraising
On Sunday evening, Oracle Corporation announced plans to raise new capital in 2026 to support the expansion of its AI and cloud infrastructure amid rising demand for computing power.
The company aims to generate between $45 billion and $50 billion in gross proceeds during 2026, utilizing a mix of debt and equity financing.
About half of the funds will come from a combination of equity derivatives and common stock, according to a company statement.
Oracle plans to raise its debt funding through a single, one-time issuance of investment-grade senior unsecured bonds in early 2026, with no additional debt expected afterward.
Analysts at Vital Knowledge highlighted that roughly half of the total funding will come from equity-linked securities, including a $20 billion at-the-market (ATM) common equity program.
They noted, “Oracle’s $20 billion ATM offering is the first time a major tech company has been compelled to raise equity since the AI boom began. If this signals a shift toward greater fiscal caution in the industry, it could lead to a slower overall pace of spending.”
Disney set to release earnings
Walt Disney is set to release its earnings before the opening bell on Monday.
While the company’s continued focus on its streaming services, alongside its vital parks and studios divisions, will be closely watched, much of the attention may center on leadership succession.
According to the Wall Street Journal, Disney CEO Bob Iger has informed colleagues that he intends to step down and reduce his day-to-day involvement before his contract expires on December 31.
Board members are expected to convene soon to decide on Iger’s successor, with several media outlets naming Experiences division head Josh D’Amaro as the likely frontrunner.
Solana extended its sell-off on Monday after posting a decline of more than 15% in the previous week.
Derivatives data continues to reinforce the bearish move, with short positioning increasing and funding rates turning negative.
From a technical standpoint, a decisive close below $100 would likely open the door to a deeper correction.
Solana (SOL) extended its correction on Monday, trading below $100 after shedding more than 15% the previous week. The bearish price action is reinforced by derivatives indicators, which show increasing short positions and negative funding rates. From a technical perspective, a daily close below $100 could pave the way for a deeper correction in SOL.
Derivatives data points to a deeper correction
Derivatives data for Solana continues to support a bearish outlook. Coinglass OI-weighted funding rate data indicates that traders positioning for further downside in SOL now outnumber those expecting a rebound.
The metric turned negative on Saturday and stands at -0.0080% as of Monday, meaning short positions are paying longs—a clear signal of bearish sentiment toward Solana.
Additionally, Coinglass’s long-to-short ratio for SOL stood at 0.97 on Monday. A reading below 1.0 indicates bearish market sentiment, reflecting that a greater number of traders are positioned for further downside in Solana’s price.
Weakening institutional demand
Institutional demand for Solana softened last week. Data from SoSoValue shows that spot Solana ETFs recorded $2.45 million in net outflows, marking the first weekly withdrawals since their launch. If these outflows persist or accelerate, SOL may face additional downside pressure.
Solana Price Outlook: SOL falls below $100
Solana was rejected at weekly resistance near $126.65 on Wednesday and went on to fall more than 15% through Sunday, breaking below the key $100 psychological level. As of Monday, SOL is trading around $99.60.
A daily close below $100 could extend the decline toward the April 7 low at $95.26. A sustained move below that level may open the door to further losses toward the January 23, 2024 low near $79.
On the momentum front, the Relative Strength Index (RSI) on the daily chart is at 25, signaling deeply oversold conditions and strong bearish momentum. Meanwhile, the MACD remains bearish after a crossover on January 19, with expanding red histogram bars below the zero line, reinforcing the negative technical outlook.
Conversely, a recovery could see SOL move back toward the weekly resistance at $126.65.
Months after the October 10 liquidation cascade, crypto market depth has yet to fully recover, while debate continues over Binance’s role as Bitcoin’s sell-off persists.
Key points to know:
Liquidity across major crypto markets remains thin and fragmented following the Oct. 10 crash. Wider bid-ask spreads and weakened order books are being cited as key factors behind Bitcoin’s decline from around $125,000.
Binance has denied allegations that an internal malfunction triggered the crash. However, critics argue that the exchange’s limited transparency has contributed to growing distrust and fueled speculation and conspiracy theories.
Market makers and industry leaders say the episode highlighted deeper structural vulnerabilities in crypto markets, particularly shallow liquidity and heavy dependence on leverage. Many stress that the issue extends beyond any single platform and may justify regulatory-style oversight of market structure.
At first glance, the $19 billion liquidity wipeout on October 10 appeared to be a familiar event: a rapid cascade of liquidations across major crypto exchanges as Bitcoin, the world’s largest cryptocurrency, plunged sharply.
What followed—and the continued lack of transparency surrounding the day’s events—has made the episode far more consequential. The sell-off became the largest single-day liquidation by dollar value in crypto history, leaving traders frustrated and fundamentally reshaping how crypto markets are viewed. At the center of the controversy is one name: Binance.
For many market participants, the world’s largest crypto exchange has become the symbol of the crash, which saw Bitcoin drop by as much as 12.5%, its steepest decline in 14 months. The move triggered widespread forced closures of leveraged positions as margin levels were breached across exchanges.
Whether due to Binance’s sheer size, its dominance in derivatives trading, or the limited clarity around what exactly transpired, the exchange has faced persistent accusations on social media, with many claiming it played a central role in the Oct. 10 event—now widely referred to as “10/10.” Binance continues to deny responsibility, maintaining that the liquidations were not caused by an internal failure. The company did not respond to a request for comment from CoinDesk for this article.
In the absence of a clearly established narrative, it is unsurprising that traders remain unsettled.
In the months since the crash, market liquidity has remained noticeably impaired. Order books have not fully recovered, market depth remains uneven, and bid-ask spreads have widened. Many traders argue that this weakened market structure accelerated Bitcoin’s decline from around $124,800 to $80,000 and further eroded confidence across the market.
Adding to the debate, Ark Invest CEO Cathie Wood has publicly weighed in, attributing Bitcoin’s continued weakness to what she described as a “Binance software glitch.”
Why Binance has re-emerged at the center of the debate
Wood said in a late-January appearance on Fox Business that the alleged glitch triggered approximately $28 billion in deleveraging.
In response, Binance co-founder He Yi pushed back online, emphasizing that Binance does not serve U.S. customers, though the post was later removed.
Rival platforms were quick to capitalize on the moment. Star Xu, founder of competing exchange OXK, said the October 10 event caused “real and lasting damage to the industry.” While he did not name Binance directly, the remarks were widely viewed as an implicit criticism of the exchange’s role in the episode.
At the same time, challengers such as the decentralized exchange Hyperliquid pointed to rising derivatives volumes and improving liquidity depth, positioning themselves as credible alternatives as Binance continues to grapple with reputational pressure.
Binance has reiterated that the October 10 event was not caused by an internal system failure.
Speaking during a Friday ask-me-anything session, co-founder and former CEO Changpeng “CZ” Zhao dismissed claims that Binance triggered the crash as “far-fetched.”
According to the company, the sell-off was driven by broader market forces, including macroeconomic pressures, excessive leverage, thin liquidity, and congestion on the Ethereum network. Binance said its core systems remained fully operational throughout the episode and that it paid approximately $283 million in compensation to affected users.
“A slap in the face”
For some market participants, Binance’s explanation has fallen short—particularly given the sheer scale of the liquidations. The $19 billion figure has taken on disproportionate symbolic significance, with Binance’s compensation payments often viewed less as meaningful restitution and more as a small fraction of the overall damage.
“This is a f***ing joke,” wrote the pseudonymous Bitcoin Realist on X. “You… liquidated $19 billion on 10/10 alone… This is like spitting in our faces.”
That frustration reflects more than outrage over a single bout of volatility. For many traders, October 10 has come to represent a deeper mistrust of crypto market structure itself.
Still, not everyone believes Binance should bear the blame.
“10/10 was very obviously not a ‘software glitch,’” wrote Evgeny Gaevoy, CEO of market maker Wintermute, on X. “It was a flash crash in a highly leveraged market during an illiquid Friday night, driven by macro news.”
He added: “Finding a scapegoat is comfortable, but pinning this on one exchange is intellectually dishonest.”
The underlying argument is straightforward: crypto markets remain heavily dependent on leverage, and liquidity is often conditional rather than continuous. During periods of stress, market makers widen spreads or withdraw altogether. In such thin conditions, liquidation cascades can quickly accelerate.
While Binance was the largest venue where the crash unfolded, it was not necessarily the origin of the shock itself.
A lack of transparency continues to fuel speculation
What remains absent is a formal public review and an authoritative account of what happened. Critics argue that without a thorough, transparent inquiry, speculation is free to grow unchecked.
Salman Banaei, a former regulator at the U.S. Commodity Futures Trading Commission (CFTC), has suggested that the events of October 10 merit regulatory scrutiny, even without any allegation of wrongdoing.
“Whether you love or hate crypto, there should be a regulatory investigation into Oct. 10, 2025,” Banaei wrote, drawing a comparison to the May 6, 2010 stock market flash crash. “One benefit of regulation is that the mere possibility of such investigations acts as a deterrent to manipulation.”
He emphasized that he was not asserting manipulation took place, but rather highlighting a broader structural issue: crypto markets lack the formal post-event reviews that traditional financial markets routinely conduct after systemic disruptions.
Meanwhile, a trader known as Flood suggested that a major exchange had been steadily selling altcoins since 10/10, a claim that has fueled conspiracy theories around excess inventory.
Whether accurate or not, such narratives tend to gain traction when liquidity dries up and market confidence weakens.
The real problem lies in market depth, not a single exchange
October 10 may ultimately be remembered less for the scale of the liquidations and more for what it exposed about crypto market structure.
In bull markets, order books appear deep, leverage accumulates quietly, and liquidity feels plentiful. Bear markets reveal the opposite reality: liquidity evaporates, market makers pull back, volatility becomes concentrated, and the next shock breaks through far faster than expected.
Reflecting on the comparison with the FTX collapse in 2022, Mike Silagadze, CEO of Ether.fi, wrote on X that “this feels far worse than the post-FTX environment. In some ways, fundamentals are stronger than ever, yet price action has virtually no bids.”
Binance has become the most convenient scapegoat—not necessarily because it caused the crash, but because it is the largest and most visible exchange, making it an obvious target.
The more fundamental problem, however, is structural. Crypto market liquidity remains heavily reliant on leverage, conditional market making, and confidence—all of which have steadily eroded over the past four months.
As Eric Crown, a former options trader at NYSE Arca, put it: “I don’t know if Binance deliberately played a role in wrecking the market in October. I’d lean toward the obvious explanation: excessive leverage, insufficient liquidity, and largely ineffective or unwanted altcoin ‘technologies’ created the conditions for a massacre—and that’s exactly what happened.”
Bitcoin fell below $75,000 on Monday, sliding to its lowest level in nearly ten months.
Momentum indicators continue to weaken, pointing to intensifying bearish pressure and reinforcing the deteriorating technical outlook.
From a technical perspective, price action suggests Bitcoin could retest the $70,000 psychological support if selling pressure persists.
Bitcoin (BTC) slipped below the $75,000 level on Monday after posting an almost 11% decline over the previous week, falling to its lowest level in nearly ten months. Market momentum has decisively turned bearish, with technical indicators signaling the potential for further downside toward the $70,000 support zone.
Bitcoin may retest the $70,000 level if the correction extends
Bitcoin extended its sell-off at the start of the week, falling more than 2% on Monday after a decline of over 11% the previous week. At the time of writing, BTC is trading below $75,000, a level not seen since early April.
If Bitcoin maintains its downward trajectory, the correction could deepen toward the next major psychological support at $70,000.
On the daily chart, the Relative Strength Index (RSI) is hovering near 21, signaling strong bearish momentum and deeply oversold conditions. In addition, the MACD produced a bearish crossover on January 20, which remains in place, with expanding red histogram bars below the zero line—further reinforcing the negative technical outlook.
BTC/USDT daily chart
Conversely, a recovery could see Bitcoin push toward the key psychological level at $80,000.
More than $700 million in liquidations over the past 24 hours
Bitcoin slid to levels not seen since early April, triggering a sharp wave of liquidations across the crypto market. More than $700 million in leveraged positions were wiped out over the past 24 hours, according to Coinglass.
Long positions accounted for 77.39% of the liquidations, highlighting the market’s overly bullish positioning. The single largest liquidation occurred on Hyperliquid, where a BTCUSD position worth $15.46 million was forcibly closed. Ethereum (ETH) also experienced significant pressure, with nearly $270 million liquidated in the last 24 hours.
Traders should remain cautious, as continued price weakness could spark further liquidations, particularly among highly leveraged participants.
Long EUR/USD after a daily close above 1.1866, resulting in a 0.24% loss.
Long Silver, which ended with a loss of 18.62%.
Long Gold after a daily close above $5,000, producing a 2.26% loss.
Taken together, these positions generated a total loss of 21.12%, or 7.04% per asset. While this was a sizable drawdown, the broader performance of my weekly forecasts over recent weeks remains positive, as earlier gains were exceptionally strong and more than offset this setback.
Key market data from last week:
U.S. Federal Reserve policy meeting: No surprises, with interest rates left unchanged.
U.S. Producer Price Index (PPI): The standout data release of the week. Inflation came in far hotter than expected, with headline PPI rising 0.5% month-on-month and core PPI increasing 0.7%, versus forecasts of just 0.2% for both. This reinforced a more hawkish Fed outlook, lifted the U.S. dollar, and accelerated the sharp reversal in Silver (and Gold). As a result, expectations for a second U.S. rate cut in 2026 were pushed back to October.
Bank of Canada policy meeting: No change to interest rates, as anticipated.
Australian CPI: Inflation exceeded expectations, with an annual rate of 3.8% versus 3.5% forecast, strengthening the case for possible RBA rate hikes and supporting the Australian dollar early in the week.
Canadian GDP: Slightly weaker than expected, showing zero month-on-month growth.
U.S. unemployment claims: In line with forecasts.
While PPI and Australian inflation influenced market moves, two broader developments likely had an even greater impact:
Federal Reserve leadership: President Trump announced his nominee for the next Fed Chair, Kevin Warsh. Although regarded as a hawk, Warsh is now thought to favor lower interest rates. The nomination contributed to the collapse of the Silver rally and provided additional support to the U.S. dollar.
Geopolitical tensions: The U.S. continued its military buildup near Iran, raising the risk of a wider regional conflict. Polymarket currently assigns a high probability to a U.S. strike on Iran in March, despite President Trump still referencing the possibility of a diplomatic agreement. These tensions appear to be supporting crude oil prices, with WTI crude reaching a new four-month high last week.
Meanwhile, the S&P 500 briefly pushed to a fresh record above 7,000. Although the index remains resilient, upside momentum is limited. In my view, a clearer resolution to U.S.–Iran tensions is needed before a more decisive directional move can develop.
The Week Ahead: 2nd – 6th February
The most significant data releases for the coming week, ranked by expected market impact, include:
U.S. Average Hourly Earnings and Non-Farm Payrolls
Preliminary University of Michigan Inflation Expectations
European Central Bank main refinancing rate decision and monetary policy statement
Bank of England official bank rate decision, voting breakdown, and monetary policy report
Reserve Bank of Australia cash rate decision, rate statement, and monetary policy statement
U.S. JOLTS job openings
Preliminary University of Michigan consumer sentiment
U.S. ISM services PMI
U.S. ISM manufacturing PMI
U.S. unemployment rate
New Zealand unemployment rate
Canadian unemployment rate
U.S. weekly unemployment claims
This will be a particularly busy and potentially market-moving week, with three major central banks delivering policy decisions. Please note that Friday is a public holiday in New Zealand, which may reduce liquidity in related markets.
Monthly Forecast February 2025
For the month of January 2026, I forecasted that the USD/JPY currency pair would rise in value. Unfortunately, this was a losing trade.
For the month of February, I forecast that the EUR/USD currency pair will rise in value.
Weekly Forecast 2nd February 2026
Last week, three currency crosses experienced unusually high volatility, prompting the following weekly trade forecasts:
Short NZD/JPY, which resulted in a 0.57% loss.
Short AUD/JPY, ending with a 0.32% loss.
Short NZD/CAD, producing a 0.39% loss.
Overall, the Swiss franc and the New Zealand dollar emerged as the strongest major currencies of the week, while the U.S. dollar was the weakest. Market conditions were relatively subdued, with directional volatility dropping sharply—only 11% of major currency pairs and crosses moved by more than 1% over the week.
Technical Analysis
Key Support/Resistance Levels for Popular Pairs
US Dollar Index
Last week, the U.S. Dollar Index formed a notably large bullish pin bar, rejecting a fresh four-year low. On its own, this price action is bullish. However, the broader technical structure remains bearish, with the index still trading below its levels from 13 and 26 weeks ago. As a result, the technical outlook for the U.S. dollar is mixed.
The nomination of Kevin Warsh as Federal Reserve Chair provided some support to the dollar during the week. Nevertheless, the forward outlook remains uncertain, and I believe the most attractive trading opportunities in the near term are likely to be independent of U.S. dollar direction.
EUR/USD
The EUR/USD pair recently staged a strong long-term bullish breakout as the U.S. dollar accelerated lower and printed a new 3.5-year low. However, the move quickly failed, with price retreating sharply and finding minimal follow-through support.
This price action suggests the breakout may have been a temporary spike, although the potential for a sustained bullish trend should not be dismissed, as EUR/USD has historically shown a tendency to trend cleanly once momentum is established.
That said, the appointment of a new Fed Chair and the renewed strength in the U.S. dollar late in the week—driven by hotter inflation data—argue for a more cautious stance.
Accordingly, I would only consider a long position following a daily (New York close) above 1.2039.
WTI Crude Oil
WTI crude oil has surged strongly in recent sessions as the risk of a regional conflict centered on Iran has intensified. Prediction markets are currently assigning a high probability to a U.S. strike on Iran in March, a scenario that could significantly disrupt global crude supply. Against this backdrop, prices pushed to a new four-month high by the end of last week, with a daily close above $66.25 marking a potential six-month high.
However, two important cautions should be noted:
While a daily close above $66.25 would typically attract trend-following buying, the current moving average structure does not confirm a bullish setup. Even in the event of military conflict, the move could prove to be a short-lived spike, especially if a rapid U.S. victory follows, potentially resulting in a failed breakout.
Unlike recent Democratic administrations, the Trump administration is likely to take aggressive steps to suppress crude oil prices, which could cap or reverse upside momentum.
Bitcoin
BTC/USD has finally completed a decisive bearish breakdown below the long-term support zone just above $81,000. Price is now firmly established beneath this level and has pushed to a new nine-month low, a development that is technically significant and clearly bearish.
While equities and precious metals have rallied strongly in recent months, Bitcoin peaked at a record high several months ago and has since trended steadily lower. This divergence highlights a broader downturn across the crypto sector, with Bitcoin now showing clear signs of structural weakness.
Despite early expectations that Bitcoin would fundamentally reshape global finance, real-world adoption remains limited outside parts of Africa. Practical usability is still constrained, and its underlying value proposition remains uncertain.
Although I generally avoid short-selling, Bitcoin appears entrenched in a long-term bearish trend. I would not consider buying at current levels. Short positions may be worth considering, but only with strict risk management, as shorting is best suited to experienced traders.
XAG/USD
Silver experienced an exceptionally volatile week, surging more than 15% to hit a new all-time high and the long-discussed $120 options target, before suffering a dramatic reversal. The sell-off unfolded sharply on Thursday and Friday—particularly Friday—when prices plunged 28% in a single session.
I had previously cautioned that the move was highly vulnerable to a sharp correction, and that while a long position was justified, it should be taken with a reduced position size.
The sheer magnitude of the collapse, even with some bullish undertones and modest resilience in the bounce from the weekly lows, strongly suggests that another record high is unlikely in the near term. This extraordinary rally appears to be finished, and the most probable next phase is a period of erratic consolidation, marked by large swings and gradually diminishing volatility.
XAU/USD
Much of the analysis above regarding Silver also applies to Gold. That said, gold’s volatility was noticeably lower, and its price action showed greater resilience at the lows.
While gold is also likely to enter a period of sideways consolidation, the underlying structure suggests it may recover to the upside more quickly than silver.
Bottom Line
My preferred trade for the coming week is:
Long EUR/USD, contingent on a daily (New York) close above 1.2039.
A large ETH liquidation on Hyperliquid triggered a leverage-driven cascade, sending total crypto liquidations above $2.5 billion in 24 hours.
What to know:
More than $2.5 billion in crypto positions were liquidated over 24 hours, including a single $222.65 million ether position on the Hyperliquid exchange.
Ether led the sell-off, with over $1.15 billion in liquidations as prices dropped by as much as 17%, followed by roughly $788 million in bitcoin and nearly $200 million in Solana.
The liquidation wave was heavily skewed toward long positions and amplified by thin market liquidity, highlighting how leverage can fuel cascading price declines and sudden market reversals.
One trader suffered losses exceeding $220 million on an ether position as a renewed wave of forced liquidations rippled through crypto markets, driving total liquidations over the past 24 hours to nearly $2.6 billion.
The largest individual liquidation took place on decentralized derivatives exchange Hyperliquid, where an ETH-USD position valued at $222.65 million was erased, according to data from CoinGlass.
The sell-off unfolded as ether fell by as much as 17% over the past 24 hours, dragging down bitcoin and other major tokens in a thinly traded market.
In total, 434,945 traders were liquidated during the period, with losses overwhelmingly concentrated in long positions. About $2.42 billion of the $2.58 billion in total liquidations came from bullish bets, while short positions accounted for just $163 million.
Hyperliquid suffered the most severe impact, logging $1.09 billion in liquidations — almost entirely from long positions — representing more than 40% of total losses across exchanges. Bybit followed with $574.8 million, while Binance recorded roughly $258 million in liquidations.
Ether absorbed the bulk of the damage, with more than $1.15 billion in ETH positions wiped out over 24 hours. Bitcoin saw about $788 million in liquidations, and nearly $200 million in Solana positions were erased, according to liquidation heatmap data.
Liquidations happen when leveraged positions are automatically closed after prices move beyond a trader’s margin limits. These forced exits often lock in large losses and can amplify price swings by setting off cascading sell-offs during volatile periods.
Market participants track liquidation data to assess positioning and sentiment. Heavy long liquidations can point to panic-driven bottoms, while large short liquidations may signal the start of a squeeze. Sudden spikes also highlight overcrowded trades and areas where reversals may emerge.
When combined with open interest and funding rate data, liquidation metrics can help identify potential entry and exit points, particularly in overleveraged markets vulnerable to abrupt flushes or sharp rebounds.
Such liquidation-driven moves have become increasingly frequent during low-liquidity conditions, where relatively modest price moves can ripple through derivatives markets and trigger outsized reactions.
Gold and Bitcoin have diverged sharply in recent months, with Yardeni Research arguing that currency movements are becoming a key driver of that split.
In its latest report, the firm revisited the long-standing question of whether Bitcoin can be considered “digital gold,” pointing out that both assets are difficult to value since neither generates interest or dividends. However, Yardeni cautioned that Bitcoin’s purely digital form could make it “potentially vulnerable someday to hacking by quantum-computing algorithms,” whereas gold’s main drawback is the need for physical storage.
Bitcoin’s volatility has persisted. Yardeni noted that the cryptocurrency surged to a record near $125,000 in late 2025 before retreating toward $90,000.
Gold, by contrast, has been in a strong uptrend since it “decisively broke out” in March 2024. Prices have climbed roughly 2.5 times since then, moving above $3,000 an ounce in early 2025. The firm maintains its long-term outlook that gold could reach $10,000 by the end of the decade.
According to Yardeni Research, recent currency shifts are widening the gap between the two assets. The firm said a weaker U.S. dollar tends to hurt Bitcoin because it lowers Bitcoin’s value in other currencies, potentially encouraging foreign investors to sell. Some of those flows, it suggested, may be rotating into gold instead.
In addition, a softer dollar can put upward pressure on U.S. inflation, which would further support gold prices. Yardeni also noted that dollar weakness generally favors U.S. investors in overseas markets, reinforcing its overweight stance on emerging-market equities.
Ethereum was trading at $2,434.30 as of 12:14 local time (17:14 GMT) on Saturday, according to the Investing.com Index, marking a 10.26% daily decline. This represented its steepest one-day percentage drop since October 10, 2025.
The selloff reduced Ethereum’s market capitalization to $298.41 billion, accounting for about 11.08% of the total crypto market. At its peak, Ethereum’s market cap had reached $583.89 billion.
Over the past 24 hours, Ether fluctuated between $2,378.01 and $2,714.59. Weekly performance has also been weak, with Ethereum down 16.31% over the last seven days. Trading volume during the most recent 24-hour period totaled $36.56 billion, representing 25.68% of overall cryptocurrency turnover. Over the past week, prices ranged from $2,378.01 to $3,044.24.
Despite its recent rebound attempts, Ethereum remains 50.88% below its all-time high of $4,955.90, recorded on August 24, 2025.
Elsewhere in crypto markets, Bitcoin was last seen at $79,266.0, down 4.65% on the day. Tether USDt was effectively flat at $0.9990.
Bitcoin’s market capitalization stood at $1.60 trillion, representing 59.35% of the total crypto market, while Tether’s market cap was $185.07 billion, or 6.87% of the overall market value.
Bitcoin, the world’s largest cryptocurrency by market capitalisation, slid 6.53% to $78,719.63 by 12:48 p.m. ET (1748 GMT) on Saturday, extending losses from the previous session.
On Friday, bitcoin touched a low of $81,104 — its weakest level since November 21 — as the U.S. dollar strengthened following the selection of former Federal Reserve Governor Kevin Warsh as the next Fed chair. Investors have voiced concerns that Warsh could pursue tighter liquidity conditions across the financial system.
Warsh has argued for sweeping changes at the central bank and has advocated, among other measures, reducing the size of the Federal Reserve’s balance sheet.
Bitcoin and other digital assets have often benefited from an expanded Fed balance sheet, typically gaining when abundant liquidity supported risk and speculative investments.
Brian Jacobsen, chief economist at Annex Wealth Management in Menomonee Falls, Wisconsin, said the Fed’s “oversized balance sheet, coupled with heavy-handed banking regulation,” had effectively trapped liquidity within Wall Street rather than allowing it to flow to the broader economy, contributing to asset bubbles in areas such as bonds, cryptocurrencies, metals and meme stocks.
Ether also dropped sharply, falling 11.76% to $2,387.77 on Saturday afternoon. Cryptocurrencies have struggled to find clear direction since their sharp decline last year, lagging behind strong rallies in gold and equities.
“Sometimes these price corrections can become self-reinforcing,” Jacobsen said, noting that Friday’s sudden sell-off had served as a reminder of market risk. He added that further selling in the coming days was “possible, if not likely.”
Cryptocurrencies are struggling during what had been expected to be a period of strong inflows and supportive regulation under President Donald Trump. Bitcoin, the market leader, has shed about one-third of its value since hitting record highs last October.
The total cryptocurrency market capitalisation dropped by about 5% to $2.82 trillion over the past 24 hours, briefly touching $2.78 trillion twice—its lowest level since April last year. As anticipated, weakness in commodity and equity markets added further pressure to crypto, triggering a sell-off on elevated volumes as traders tightened stop-loss orders after a prolonged period of consolidation. In our worst-case scenario, market cap could fall into the $1.8–2.0 trillion range, corresponding to a 161.8% extension of the initial downside move seen in October–November.
The Crypto Sentiment Index dropped to 16 by Friday, marking its lowest reading in six weeks and a return to extreme fear—a zone the market managed to escape for only two days this week. While such depressed sentiment is often viewed as a buying opportunity, we continue to stress that a more prudent strategy is to wait for a clear exit from extreme fear, helping to reduce the risk of sudden and sharp downside moves.
Bitcoin has fallen 6% over the past 24 hours, briefly dropping to $81K and revisiting the lows seen in late November. The market is now testing the resilience of a support level that previously absorbed heavy selling pressure last year. About $10K lower lies a zone where prior cycle highs from 2021–2022 and the first half of 2024 converge. If that area fails to hold, Bitcoin could slide toward the $52–60K range.
In the near term, however, attention should remain on BTC’s price action around $80K. This level may prove difficult to break decisively and is viewed by many market participants as an attractive buying zone.
More than 22% of Bitcoin’s circulating supply is now underwater. Glassnode identifies a key support level at $83,400; a break below this could open the door to a drop toward the “true average market price” near $80,700. A deeper decline risks pushing long-term holders into losses, potentially accelerating selling pressure.
According to Wintermute Ventures, speculative excess in crypto is likely to fade this year, with digital assets evolving into the core financial and settlement layer of the internet. In this scenario, stablecoins are expected to emerge as the primary medium of exchange in the digital economy.
Santiment reports that Ethereum balances held on exchanges have fallen for a sixth straight month, driven by strong interest in staking. Since July last year, exchange-held ETH has declined by roughly one-third to about 8.15 million tokens.
TRM Labs estimates that illegal cryptocurrency transaction volumes hit a record $158 billion in 2025, up 145% year on year. During the same period, hackers stole $2.87 billion across nearly 150 separate attacks.
Meanwhile, the USD1 stablecoin issued by World Liberty Financial, a company linked to US President Donald Trump, reached a market capitalisation of $5 billion in under a year, making it the world’s fifth-largest stablecoin.
Bitcoin tumbled sharply on Friday, sliding to its lowest level in more than two months as forced liquidations swept through leveraged positions and investors assessed the potential implications of a change in U.S. Federal Reserve leadership.
The world’s largest cryptocurrency was last down 6.4% at $82,620.3 as of 02:15 ET (07:15 GMT). Prices touched an intraday low of $81,201.5, coming close to breaching the April lows had the selloff extended further.
Crypto Markets See $1.7 Billion in Liquidations
Data from CoinGlass showed that roughly $1.68 billion in leveraged positions were liquidated over the past 24 hours amid the selloff, with about 93% of those losses coming from long positions—traders positioned for higher prices.
Approximately 270,000 traders saw their positions forcibly closed, intensifying the decline across Bitcoin and the broader digital asset market.
Liquidations occur when exchanges automatically shut leveraged positions that fail to meet margin requirements as prices move against traders, a dynamic that often amplifies volatility and accelerates downside moves in risk-on markets.
Traders Watch Trump’s Pick for Fed Chair
Friday’s selloff coincided with rising market unease over U.S. monetary policy leadership. President Donald Trump said he would announce his choice to replace Federal Reserve Chair Jerome Powell on Friday morning, fueling speculation that former Fed Governor Kevin Warsh could be nominated for the role. Reports indicate the White House is preparing to put Warsh forward as the next Fed chair.
Warsh is widely viewed as favoring a tighter approach to the Fed’s balance sheet and overall policy stance, a shift that could drain liquidity that has supported risk assets, including cryptocurrencies.
Markets have responded with broader risk-off positioning, a firmer U.S. dollar, and rising yields, while crypto prices have come under renewed pressure. Central bank policy direction plays a crucial role in shaping interest rates, liquidity, and risk-asset valuations—key drivers for high-beta assets such as Bitcoin.
Altcoins Slide as Ether and XRP Fall 7%
Most altcoins also slumped on Friday as liquidation-driven selling rippled through the market.
Ethereum, the world’s second-largest cryptocurrency, fell more than 7% to $2,749.92, while XRP, the third-largest, also dropped 7% to $1.75.
Elsewhere, Solana slid 6.5%, Cardano plunged 8%, and Polygon retreated by more than 5%.
Among meme tokens, Dogecoin declined 6%, while $TRUMP fell 3.5%.
Bitcoin gave up part of its earlier gains on Wednesday after the Federal Reserve left interest rates unchanged, as widely anticipated, slipping back below the $90,000 level after briefly reclaiming it for the first time since last Friday.
The world’s largest cryptocurrency was last trading 1.3% higher at $89,564.1 as of 14:29 ET (19:29 GMT).
Bitcoin climbs back above $90,000 as dollar rebounds
Bitcoin’s advance this week was underpinned by broad weakness in the U.S. dollar, after President Donald Trump sought to ease concerns over the currency’s recent decline.
The Dollar Index snapped a four-day losing streak, while gold extended its sharp rally to fresh record highs above $5,300 per ounce, further strengthening demand for alternative stores of value.
After several sessions of rangebound trading, bitcoin set its sights once again on the key psychological $90,000 level and reached that mark on Wednesday.
“Bitcoin needs to decisively break back above $90,000 and then hold that level on any pullback to attract new buying interest,” said David Morrison, senior market analyst at Trade Nation. “If that happens, $100,000 would become the next bullish target. But it’s still early, and bitcoin needs to create more distance from key support levels.”
He added that, for now, a move below $85,000 remains a clear possibility. Meanwhile, the Federal Reserve concluded its two-day policy meeting on Wednesday by keeping interest rates unchanged, in line with expectations.
Investors are paying close attention to the Fed’s accompanying statement and comments from Chair Jerome Powell for clues on the timing of potential rate cuts, especially as inflation appears to be cooling while economic growth remains solid.
Lower interest rates generally favor non-yielding assets like bitcoin, as they reduce the opportunity cost of holding them.
Adding to the uncertainty, markets are also closely monitoring developments around President Trump’s expected nomination of a new Federal Reserve chair. Investors are evaluating how increased political influence could alter the central bank’s policy approach and its tolerance for inflation.
Tether increases gold exposure, targets up to 15% portfolio allocation
Tether plans to dedicate a significant share of its investment portfolio to physical gold, expanding on bullion reserves that already underpin some of its products, CEO Paolo Ardoino told Reuters.
The stablecoin issuer currently holds roughly 130 metric tons of physical gold, having added 27 tons in the fourth quarter alone. Ardoino said the company has recently been buying about two tons per week.
“For our own portfolio, it makes sense to allocate around 10% to bitcoin and about 10% to 15% to gold,” Ardoino said, while declining to disclose the total size of Tether’s investment portfolio or the precise portion currently held in bullion.
“It’s difficult to choose which one I prefer,” he added. “It’s almost like having two children and deciding which one is more beautiful.”
Tether will maintain direct ownership of the gold, which is stored in Switzerland, and has not set a fixed target for future purchases. Buying decisions will be reviewed on a quarterly basis. Ardoino noted that the company began accumulating gold in 2020 during the COVID-19 pandemic and has steadily increased exposure as geopolitical risks have risen.
“The world isn’t in a good place right now. Gold is hitting record highs day after day. Why? Because people are afraid,” he said.
Gold prices have surged over the past year, rising 64% in 2025 and continuing their rally into 2026, with gains of 22% so far this year. The metal hit a record high of $5,311 per troy ounce on Wednesday, supported by weakening confidence in the U.S. dollar and concerns about the independence of the Federal Reserve.
Crypto prices today: altcoins post modest gains
Most major altcoins also moved higher on Wednesday, following gains in bitcoin.
Ethereum, the world’s second-largest cryptocurrency, rose 1% to $3,008.75, while third-ranked XRP added 0.4% to trade at $1.91.
Bitcoin hovered near one-month lows on Monday, extending last week’s sharp losses as investors stayed cautious ahead of the Federal Reserve’s policy meeting and amid heavy liquidations in leveraged crypto markets.
The world’s largest cryptocurrency was last down 0.7% at $88,081 as of 09:36 ET (14:36 GMT).
Bitcoin has fallen more than 6% over the past week, pressured by a broader risk-off mood driven by uncertainty over global monetary policy, volatility in US Treasury yields, and sharp swings in foreign exchange markets.
Crypto markets remain under pressure as heavy liquidations and Federal Reserve caution weigh on sentiment.
Last week’s selloff was intensified by forced liquidations in derivatives markets, where highly leveraged positions were rapidly unwound. Market data shows more than $1 billion in leveraged crypto positions were liquidated, with long Bitcoin trades making up most of the losses, amplifying the downward price move.
Bitcoin had surged earlier this year on hopes of easier US monetary policy and steady inflows into spot ETFs, but sentiment has since turned cautious as investors reassess the interest-rate outlook and cut risk exposure amid volatility in currency and bond markets.
Focus now shifts to the Federal Reserve’s two-day policy meeting ending Wednesday. While rates are expected to remain unchanged, markets will watch Chair Jerome Powell’s comments closely for signals on the timing and extent of potential rate cuts later this year.
Investors are also watching signals on liquidity conditions and the Fed’s balance sheet, both key drivers for crypto markets.
Adding to the uncertainty, traders are awaiting US President Donald Trump’s expected announcement of his nominee for the next Federal Reserve chair, an appointment that could shape future monetary policy, especially if the new leadership is viewed as more dovish or closely aligned with the administration’s economic agenda.
Strategy increases its Bitcoin holdings with a $264 million purchase.
Strategy said it bought 2,932 more Bitcoins for about $264 million between Jan. 20 and Jan. 25, paying an average price of $90,061 per coin, according to a regulatory filing released Monday.
The purchase raises the company’s total Bitcoin holdings to 712,647 tokens, valued at roughly $62.5 billion.
Led by Michael Saylor, the firm has accumulated its Bitcoin position at an average cost of $76,037 per coin, bringing total investment to about $54.2 billion, including related expenses.
Crypto price today: Altcoins remain weak
Most altcoins stayed under pressure on Monday, extending losses amid cautious sentiment. Ethereum slipped 0.4% to $2,916.08, while XRP rose 1.5% to $1.91. Solana fell 1.8%, with Cardano and Polygon largely flat. Among meme tokens, Dogecoin edged up 0.3%, while $TRUMP declined 1%.
Wednesday brings the FOMC meeting and Chair Powell’s press conference, and it wouldn’t be surprising if President Trump chose that moment—ideally around 2:30 p.m. ET—to announce his pick for the next Fed chair. Such timing would dominate headlines, catch financial media off guard, and inject maximum uncertainty into markets.
That said, the Fed is not expected to cut rates at this meeting, which should keep the event relatively uneventful. In the bigger picture, what the Fed does between now and May may prove less important, particularly if a new chair is appointed and moves quickly toward easing.
Markets appear to be dialing back expectations for aggressive rate cuts. Current pricing suggests the fed funds rate settles near 3.25% by December, with little additional easing beyond that. To meaningfully shift those expectations, the nominee would likely need to be notably dovish—something markets already anticipate, given the widespread assumption that Trump will select a policy-leaning accommodator.
As a result, the risk of a breakout in the 2-year Treasury yield appears increasingly credible, with initial resistance near 3.62%. Beyond that, a move back toward the 4% level cannot be ruled out. From a technical perspective, the setup supports this view: the 2-year yield has formed multiple bottoms in recent months, and the RSI has begun to turn higher, signaling building upside momentum.
The direction of the 2-year yield may ultimately be more closely linked to oil prices. With inflation still hovering near 3% and crude having fallen to around $60 from highs in the $120s, the message is clear: a rebound in oil prices could quickly reignite inflation pressures. That dynamic likely explains why the price action in oil and the 2-year yield charts has begun to look strikingly similar.
The Bank of Japan once again chose to kick the can down the road, leaving rates unchanged and, in my view, offering little in the way of a clear policy roadmap. The yen’s strength on Friday appeared to be driven solely by reports of a possible “rate check” by the New York Fed on behalf of the U.S. Treasury—widely interpreted as a warning signal that currency intervention could be imminent. Perhaps the strategy is to keep markets stable until after the snap election in February. It’s hard to say, but it should be telling to see how markets react once Japan reopens on Monday.
The Korean won also strengthened notably against the U.S. dollar on Friday. In recent weeks, there has been growing chatter that the KRW had become excessively weak, so it’s likely the currency took the developments around the yen as a warning signal and moved to reprice accordingly.
The Korean won likely matters more than many investors realize, given the sizable exposure South Korean investors have built up in U.S. equities. That dynamic is probably one of the reasons the KRW has weakened so significantly in the first place—buying U.S. stocks requires selling won for dollars.
If the KRW begins to strengthen from here, it could start to put pressure on that trade. For investors who are unhedged on the currency side, a stronger won increases the risk of FX-related losses on their U.S. equity holdings, potentially prompting position adjustments.
Of course, this week also brings major earnings reports from Microsoft, Apple, Tesla, and Meta. From what I can see, all four stocks are currently sitting in positive gamma with positive delta positioning. Implied volatility typically builds into earnings because of the event risk, which sets up a familiar dynamic: unless a company delivers truly blowout results, the reaction can easily turn into a sell-the-news move. Once earnings are released, implied volatility collapses and hedges are unwound as delta decays, potentially putting pressure on the shares.
Markets managed to rebound after Tuesday’s sell-off, but the bounce—despite attracting attention—fell short of fully recouping the earlier losses. More importantly, a significant “bull trap” remains in place for the S&P 500. Technical signals for the index continue to be mixed, with momentum indicators such as stochastics failing to move back into overbought territory—a key condition needed to support a sustained rally.
Bitcoin faces more significant challenges. Yesterday’s rise alone is far from sufficient to undo what was beginning to resemble the formation of a right-hand base. That said, this still appears to be the early stages of building a new base and could represent an attractive buying opportunity for investors willing to hold through what may be a year-long process, potentially targeting a move toward $125K. For now, technical indicators remain net bearish, and a break below $85K would invalidate any bullish outlook.
The Nasdaq has mounted a counter-trend bounce following the breakdown, but the symmetrical triangle pattern has already resolved, meaning attention now shifts to identifying new support and resistance levels. There is still a potential bullish scenario if price action evolves into a bullish ascending triangle.
On the other hand, the Russell 2000 shows the potential to form a bearish “evening star” pattern, though this would require a gap lower today. Setting that possibility aside, the index remains firmly in rally mode and is far from any “bull trap” conditions. Overall, technical indicators are net bullish.
For today, bulls may want to focus on Bitcoin, while bears should monitor the Russell 2000 for signs that a bearish “evening star” pattern could emerge.
Bitcoin declined on Friday, rounding out a weak week as easing tensions between the U.S. and Greenland, along with a major purchase by Strategy, failed to revive demand for cryptocurrencies.
Risk appetite during the Asian session was further constrained by a Bank of Japan meeting and warnings from U.S. President Donald Trump about possible military action against Iran.
Safe-haven assets such as gold and other precious metals surged to record highs amid rising demand for physical stores of value, while Bitcoin largely underperformed compared with bullion. The world’s largest cryptocurrency slipped 0.5% to $89,517.3 by 00:53 ET (05:53 GMT).
Bitcoin on track for 5% weekly drop, ignores positive signals
Although Bitcoin posted modest gains earlier this week after Trump softened his stance on Greenland, the world’s largest cryptocurrency quickly reversed direction, drifting back toward one-month lows.
Bitcoin was on course for a roughly 5% weekly decline, finding little support from Strategy Inc. (NASDAQ:MSTR) despite the company’s disclosure of a $2.1 billion Bitcoin purchase.
In recent months, Strategy has also become a source of concern for the market, as investors questioned the long-term sustainability of its Bitcoin treasury strategy, particularly amid Bitcoin’s continued price underperformance.
Bitcoin and the broader crypto market were further pressured by delays to a long-anticipated crypto regulation bill, after leading U.S. exchange Coinbase Global Inc. (NASDAQ:COIN) opposed the legislation in its current form.
Retail demand for Bitcoin remained subdued, as strong performance in technology stocks—driven by enthusiasm around artificial intelligence—absorbed much of the available investment capital.
The Coinbase Bitcoin Premium Index, which tracks the difference between Bitcoin’s U.S. price on Coinbase and the global average, has shown Bitcoin trading at a near-persistent discount in the U.S. since mid-December, signaling continued weakness in retail interest within the world’s largest crypto market.
Crypto prices today: Altcoins slide, headed for sharp weekly losses
Broader cryptocurrency prices declined alongside Bitcoin and were on track for significantly steeper losses this week.
Ether, the world’s second-largest cryptocurrency, dropped 2.4% to $2,946.35 and was heading for an 11.2% weekly decline. XRP fell 1.5%, while BNB slipped 0.1%, with both tokens set to post weekly losses of around 6% to 8%.
Solana and Cardano each declined 1.5% and were down roughly 10% for the week. Among memecoins, Dogecoin fell 1.3%, while $TRUMP eased 0.9%.
This move would likely complete a broader irregular expanded flat formation, labeled red W-iv, made up of green waves W-a, W-b, and W-c. These waves collectively form a 3-3-5 structure (gray a, b, c – a, b, c – i, ii, iii, iv, v), unfolding near the 50% retracement level of the entire red W-iii. From this zone, red W-v could begin, with upside potential extending to at least $164K, thereby fulfilling the first condition outlined above.
In our previous update, we highlighted three key observations on Bitcoin (BTC), spanning both long-term and short-term perspectives.
Bitcoin posted a negative close in 2025, marking a disappointing year for the asset. Still, historical patterns—albeit based on limited data—show that BTC has never finished lower for two years in a row. With 2024 ending in positive territory, this suggests that the period from 2026, and potentially through 2028, could be bullish.
That said, similar to conditions seen in 2015 and as outlined in earlier analysis, the risk of a deeper pullback cannot be dismissed. Bitcoin may still print a lower low near the upper band of long-term support, around $69K–$73K, before a sustained upside move takes hold.
To confirm renewed bullish momentum, BTC must break above the December 9 high at $94,617, which would open the door to a potential third wave advance. As a result, bullish warning levels have been revised to $91,483, $90,327, $88,410, $86,704, and $84,424. Each successive break below these thresholds raises the probability by roughly 20% that BTC will revisit the low-to-mid $70K range before attempting another rally.
These observations matter because they provide the framework for both current market behavior and likely future developments. Bringing the analysis up to date, Bitcoin broke above the $94,617 level on January 13, but managed to stay above it for only four days before slipping back to around $88,000. This proved to be a false breakout, invalidating the impulsive path we had been monitoring. At the same time, the third warning level has now been breached, raising the probability to 60% that the broader uptrend has ended. As a result, we have promoted our alternative bearish Elliott Wave count to the primary scenario. See Figure 1 for details.
Figure 1. Bitcoin’s intermediate-term Elliott Wave count since June 2025.
The failed breakout strongly points to the January 14 peak at $97,943 as the termination of orange Wave-c within gray W-iv. Notably, Wave-c was nearly equal in length to the same-degree orange Wave-a that topped at $94,617, measuring 13,519 versus 14,055 points—a textbook relationship.
In classical Elliott Wave analysis, a third wave typically extends to the 138.2%–161.8% projection of the first wave, measured from the second wave. On November 21, Bitcoin’s low at $80,562 came close to the 1.618 extension of the gray W-i low from October 17, measured from the gray W-ii high on October 27 at $79,654. Following W-iii, waves W-iv and W-v are expected, with W-iv commonly retracing into the 76.4%–100% extension zone, and W-v subsequently targeting the 176.4%–200.0% extension zone.
The January 14 gray W-iv high occurred almost precisely at the 76.4% level—$97,943 versus a projected $99,068—keeping the structure technically sound. To date, Bitcoin’s price action appears to be unfolding as a downward impulse. In addition, W-ii formed a zigzag while W-iv developed as an expanded flat, satisfying the rule of alternation. Accordingly, provided BTC remains below the January 14 high at $97,943, we anticipate a move toward the 176.4%–200.0% Fibonacci extension area between $76,335 and $70,970 for gray W-v, fulfilling conditions 2) and 3) outlined earlier.
Completion of gray W-v would likely also conclude a broader irregular expanded flat, labeled red W-iv, composed of green waves W-a, W-b, and W-c. Together, these form a 3-3-5 structure (gray a, b, c – a, b, c – i, ii, iii, iv, v), unfolding near the 50% retracement of the entire red W-iii. From that base, red W-v could then begin, with upside potential extending to at least $164K, satisfying condition 1) from the list above.
Monero hovers near the key psychological $500 support after plunging 20% on Tuesday.
Hyperliquid is testing an important support level following a roughly 18% drop over three consecutive days.
Morpho edges toward the $1 mark as an 11% decline on Tuesday reinforces bearish pressure.
Monero (XMR), Hyperliquid (HYPE), and Morpho (MORPHO) are among the worst performers on Wednesday, as the broader cryptocurrency market records more than $1 billion in liquidations over the past 24 hours. From a technical standpoint, all three tokens are pressing key support levels following steep losses logged on Tuesday.
The downturn mirrors the sharp gap lower in US equities on Tuesday, driven by renewed tariff threats, looming court rulings, escalating geopolitical risks, and turbulence in Japan’s bond market.
Monero faces the risk of slipping below the $500 level
Monero is hovering near the $500 mark at the time of writing on Wednesday, with this psychological level limiting further downside after a sharp 20% sell-off the day before. Additional support may emerge at the 50-day Exponential Moving Average (EMA) around $484, followed by the 100-day EMA near $432, levels that would help maintain the broader bullish structure.
On the daily chart, the Moving Average Convergence Divergence (MACD) shows widening negative histograms, as the MACD line has crossed below the signal line and both indicators remain in negative territory, pointing to increasing bearish pressure.
Meanwhile, the Relative Strength Index (RSI) stands at 47.55, indicating a loss of bullish momentum.
XMR/USDT daily logarithmic chart.
On the upside, a sustained close above the 20-day EMA at $542 could extend the XMR rebound, targeting the $600 round figure.
Hyperliquid rebounds from a key support level
Hyperliquid is trading above $21 at the time of writing on Wednesday after suffering an 11% decline on Tuesday. The exchange token is up around 2% on the day, suggesting a short-term rebound following a roughly 18% drop over the past three sessions.
The Moving Average Convergence Divergence (MACD) continues to flash a sell signal triggered by Monday’s bearish crossover, with both signal lines pushing deeper into negative territory and red histograms widening. Meanwhile, the Relative Strength Index (RSI) sits at 35, hovering near oversold levels and underscoring persistent downside pressure.
Should HYPE register a daily close below the October 10 low at $20.82, price action could extend toward the S1 Pivot Point at $19.70, increasing the risk of further losses.
HYPE/USDT daily price chart.
However, a sustained rebound from the $20 level may face immediate resistance at the 20-day EMA near $24.52.
Morpho’s short-term recovery after a bearish slide
Morpho is edging about 2% higher at the time of writing on Wednesday, following a steep decline of roughly 20% over the past six days. The token continues to trade below its 20-, 50-, and 200-day Exponential Moving Averages (EMAs), all of which are trending lower, reinforcing the prevailing bearish bias.
Immediate support is located at the December 28 low near $1.08. A break below this level could accelerate losses beneath the psychological $1 threshold, with the S1 Pivot Point at $0.94 emerging as the next downside target.
In line with Hyperliquid, the Moving Average Convergence Divergence (MACD) indicator has turned bearish, with the MACD line drifting toward zero as the negative histogram expands, pointing to strong downside momentum.
Meanwhile, the Relative Strength Index (RSI) has fallen to 40, slipping decisively below the midline and signalling a sharp shift toward selling pressure, while still leaving room for further downside before oversold conditions are reached.
MORPHO/USDT daily price chart.
A prolonged rebound in MORPHO may encounter resistance at the 20-day EMA near $1.26, which could limit upside potential.
Pi Network rebounded about 1% on Tuesday from a key support level after falling roughly 4% on Monday.
Data from PiScan showed more than 4 million PI tokens were withdrawn over the past 24 hours, signaling retail efforts to hedge against further downside.
From a technical perspective, PI remains under heavy selling pressure, with momentum turning bearish and leaving the token vulnerable to additional losses.
Pi Network (PI) was up about 1% at press time on Tuesday, marking a modest rebound after hitting a new record low of $0.1502 on Monday. Over the past 24 hours, mainnet holders have withdrawn more than 4 million PI tokens from centralized exchanges that support Pi Network. Despite the slight recovery, the technical outlook for PI remains bearish, with momentum indicators pointing to sustained selling pressure.
Retail buying limits further downside
PiScan data shows that centralized exchange reserves fell by 4.24 million PI tokens over the past 24 hours, signaling substantial withdrawals. This points to strong buying interest, which helped cap losses and secure a daily close above $0.1900. A continued decline in exchange reserves could ease supply pressure and raise the chances of a rebound in PI.
Technical outlook: Is PI at risk of further downside?
Pi Network was holding above the $0.1900 level at the time of writing on Tuesday, roughly 30% above Monday’s low of $0.1502. The rebound coincided with sizable exchange withdrawals and helped prevent a breakdown below the $0.1919 support level.
However, the downward-sloping 20-day and 50-day Exponential Moving Averages (EMAs) continue to point to a prevailing downtrend.
Momentum indicators on the daily chart remain decisively bearish. The Moving Average Convergence Divergence (MACD) has turned lower from the zero line, crossing below the signal line with an expanding negative histogram. Meanwhile, the Relative Strength Index (RSI) sits near 30, hovering around oversold territory and reflecting the recent selloff.
A daily close below $0.1919 could deepen the bearish trend, exposing downside targets at the S1 and S2 Pivot Points of $0.1835 and $0.1632, respectively.
PI/USDT daily price chart.
Any rebound in PI is likely to encounter resistance at the falling 20-day and 50-day EMAs, currently at $0.2045 and $0.2116, respectively.
Futures tied to major U.S. stock indexes fell after President Donald Trump raised the prospect of imposing tariffs as part of his push to acquire Greenland. European leaders discussed possible retaliation against the measures, which they described as a form of blackmail. Gold climbed to a fresh record high, while oil prices edged lower as traders assessed Trump’s remarks and the EU’s response. Elsewhere, China’s economic growth slowed in the fourth quarter but still met Beijing’s 2025 target.
U.S. futures and global stocks decline
U.S. stock futures pointed lower on Monday as investors weighed President Donald Trump’s threat to impose tariffs on several European countries until the United States is allowed to acquire Greenland.
By 03:05 ET (08:05 GMT), Dow futures were down 404 points, or 0.8%, S&P 500 futures had fallen 66 points, or 1.0%, and Nasdaq 100 futures were off 336 points, or 1.3%.
With U.S. cash markets closed for the Martin Luther King Jr. Day holiday, the immediate reaction to Trump’s latest tariff threat will be delayed. Risk-off sentiment has spread globally, dragging equities lower across Europe and Asia.
ING analysts said Trump’s comments, following last year’s sweeping global tariffs, have pushed trade tensions into “an entirely new dimension,” driven less by economic considerations and more by political motives. They added that while past experience suggests caution in reacting to dramatic announcements, some of Trump’s threats over the past year have ultimately been carried out.
Focus on Trump’s Greenland tariffs
European leaders agreed on Sunday to intensify efforts to counter President Donald Trump’s tariff threats, with reports suggesting EU officials are considering strong retaliatory measures if the levies are imposed.
On Saturday, Trump said he would introduce 10% tariffs on exports from eight European countries—Denmark, Sweden, France, Germany, the Netherlands, Finland, Norway and the United Kingdom—until the United States is able to acquire Greenland. He added that the tariffs would be raised to 25% if the purchase of the semi-autonomous Danish territory does not go ahead. Trump has framed the move as a national security necessity, a claim European governments have rejected, describing it as blackmail.
Ahead of an emergency EU summit in Brussels on Thursday, member states are expected to debate a range of responses, including a potential €93 billion tariff package on U.S. imports and the possible use of the bloc’s “Anti-Coercion Instrument,” which could restrict U.S. access to investment, banking and services markets. Reuters, citing an EU source, reported that the tariff package currently has broader backing.
Trump’s latest tariff threat has also cast doubt over the future of a U.S.–EU trade agreement reached last year, with EU officials saying they cannot approve the deal while Washington pursues control of Greenland. ING analysts said that while the outcome of the dispute remains uncertain, it underscores the lack of predictability in global trade and tariff policy.
Gold reaches record high
Gold prices climbed to record highs in Asian trade on Monday, nearing $4,700 an ounce, as investors rushed into safe-haven assets following President Trump’s latest tariff threat.
Spot gold rose 1.6% to $4,667.33 an ounce by 02:26 ET (07:26 GMT), after earlier touching a record $4,690.75. U.S. gold futures also hit a new peak at $4,697.71 an ounce.
Silver prices surged more than 4% to a fresh all-time high of $94.03 an ounce, supported by safe-haven demand as well as its role as an industrial metal.
Oil prices edge lower
Oil prices edged lower, giving back part of last week’s gains as markets weighed the growing risk of a trade dispute linked to Greenland. Brent crude slipped 0.1% to $59.74 a barrel, while U.S. West Texas Intermediate fell 0.1% to $55.95.
Crude had rallied early last week on concerns that unrest in Iran could threaten oil supplies from the Middle East, a region that accounts for a significant share of global output. Much of that risk premium faded after President Trump ruled out immediate U.S. military action, leading prices to pull back before stabilizing toward the end of the week.
China’s economy meets 2025 growth target
China’s economy grew slightly more than expected in the fourth quarter of 2025, data released on Monday showed, as policy stimulus and a pickup in consumption helped the country meet its annual growth target.
Gross domestic product rose 4.5% year on year in the October–December period, in line with forecasts but down from 4.8% in the previous quarter, marking the slowest pace in three years. On a quarter-on-quarter basis, GDP expanded 1.2%, marginally above expectations of 1.1%.
The result brought full-year 2025 growth to 5%, meeting Beijing’s target. The government is widely expected to set a similar 5% growth goal again, as it continues to face heightened U.S. trade tensions, weak consumer demand and a prolonged property sector downturn.
Economic growth depends on population expansion and the formation of new households. While the idea of fewer people—less congestion, smaller crowds, and reduced strain on infrastructure—may seem appealing, the risks associated with population decline are often understated. Much like deflation, a shrinking population poses serious and potentially greater threats to long-term economic stability.
Demographers use the “total fertility rate” (TFR), defined as the average number of births per woman, as a key measure of population sustainability. A TFR of at least 2.1 is required to maintain a stable population, with the additional 0.1 accounting largely for infant mortality. Although the global TFR stood at 2.24 last year, this figure masks significant regional disparities. Excluding Africa, the global fertility rate falls well below 2.0.
In 2025, most major advanced economies reported TFRs under the replacement threshold of 2.0, underscoring the growing demographic challenge facing industrialized nations.
No major developed economy currently records a total fertility rate above the 2.1 replacement threshold. Outside of Africa, global population growth is already in decline. Historically, from 1950 to 1970, the world’s wealthiest nations averaged more than 2.7 births per woman. Since 1995, however, that figure has fallen sharply to around 1.6, reaching a record low of approximately 1.5 during the 2020–2025 period.
Globally, population growth remains marginally positive, driven largely by demographic expansion in Africa and rising life expectancy among older populations. However, Asia’s two largest economies—China and Japan—are experiencing population decline, a trend that constrains their long-term growth potential. More critically, shrinking cohorts of younger workers are increasingly unable to shoulder the financial burden of supporting aging populations that are living longer and often facing higher healthcare needs.
China has formally abandoned its long-standing one-child policy, but behavioral patterns shaped by decades of enforcement have proven difficult to reverse. Today, many young couples are reluctant to have even a single child, prioritizing career advancement and higher incomes instead. Compounding the challenge, the legacy of the policy produced severe demographic distortions. Prior to 2010, widespread prenatal sex selection—driven by the desire to raise a single male “heir” to support parents in old age—led to a significant gender imbalance, with roughly 118 male births for every 100 female births between 2002 and 2008. The result is a surplus of men and a shrinking pool of potential spouses.
In the mid-1990s, a typical Chinese household consisted of four grandparents, two parents, and one heavily relied-upon child—the so-called “young emperor.” This inverted demographic pyramid is financially unsustainable, as the burden of supporting multiple generations increasingly falls on a single income earner.
Europe faces an even steeper demographic challenge. With an average fertility rate of just 1.4 children per woman and a comparatively generous system of old-age pensions, the region confronts mounting fiscal pressure. These constraints help explain Europe’s historical reliance on the United States for security spending—a strategy that may prove risky as President Donald Trump presses European nations to assume greater responsibility for their own defense.
The United States remains in a stronger demographic position than Europe or much of Asia, in part because of its relatively effective assimilation of immigrants and higher rates of family formation in more conservative regions of the country. However, with the administration introducing tighter immigration restrictions and stepping up efforts to detain and deport undocumented workers, questions are emerging over whether there will be a sufficient supply of willing young workers to staff the growing number of factories being brought back onshore.
Another structural risk embedded in these demographic trends is the growing strain on Social Security and Medicare. These programs function as intergenerational compacts, in which today’s workers finance the retirement and rising healthcare costs of the elderly. Unlike 401(k) plans or IRAs, they are not savings vehicles but largely unfunded entitlements built on historical assumptions of higher birth rates and a broad, growing workforce.
As younger generations are increasingly less likely to marry, have children, or pursue stable, high-earning careers—instead relying more on gig-based employment—the system faces mounting pressure. These shifts raise serious concerns about the long-term sustainability of funding future benefits, particularly in a society producing fewer contributors to support the next generation of retirees.
Data from CoinGlass indicate that more than $800 million in leveraged positions were liquidated across the cryptocurrency market over the past 24 hours.
Risk-off sentiment has intensified as European capitals weigh retaliatory tariffs of up to $101 billion against the United States, following tariff threats from President Donald Trump.
Long positions accounted for 90.5% of total liquidations, with the largest single event being a $25.83 million BTCUSD liquidation on Hyperliquid.
The cryptocurrency market saw a sharp pullback on Monday, with total liquidations exceeding $800 million over the past 24 hours. The downturn was driven largely by rising risk-off sentiment, as escalating trade tensions between the European Union and the United States unsettled traders.
Escalating trade tensions dampen demand for risk assets
Cryptocurrency markets started the week under pressure, with Bitcoin (BTC) slipping below the $93,000 mark on Monday, dragging major altcoins—including Ethereum (ETH), Solana (SOL), and Cardano (ADA)—lower in tandem. The sell-off came amid escalating trade tensions between the United States and the European Union.
U.S. President Donald Trump announced plans to impose tariffs on eight European countries that have opposed his proposal for the United States to acquire Greenland. The measures include a 10% levy on goods from Denmark, Sweden, France, Germany, the Netherlands, Finland, the United Kingdom, and Norway, set to take effect on February 1 and remain in place until Washington is permitted to purchase the territory.
In response, the Financial Times reported on Sunday that EU capitals are weighing retaliatory measures, including up to €93 billion ($101 billion) in tariffs on U.S. goods or potential restrictions on American firms’ access to the European market.
The escalating trade dispute has fueled a risk-off mood among investors, weighing heavily on high-risk assets such as cryptocurrencies. This shift in sentiment triggered widespread liquidations across the crypto market, with more than $800 million in leveraged positions wiped out over the past 24 hours, according to CoinGlass data.
Long positions accounted for 90.5% of total liquidations, highlighting the market’s prior bullish positioning. The largest single liquidation was a $25.83 million BTCUSDT position on Hyperliquid.
The Fear and Greed Index slipped to 44 on Monday from a high of 61 on Thursday, signaling a shift away from optimism toward a more cautious market mood.
Volatility across major CoinDesk indices stayed low, with bitcoin maintaining its position above the key $94,500 breakout level despite limited price movement. Dash (DASH) led the market, climbing 15% on the day and pushing its weekly gain to 141% as most other altcoins cooled. Meanwhile, altcoins showed relative strength against major cryptocurrencies, with the CoinDesk 80 Index ticking higher as traders waited for new catalysts from U.S. markets and global political developments.
Crypto market volatility slowed sharply on Friday, with all major CoinDesk indexes moving less than 1% since midnight UTC. The subdued action comes as Bitcoin continues to trade above the key $94,500 level, which it broke earlier this week after months of range-bound movement.
Zcash, APT, and Polygon (POL) each recorded slight losses, while Dash—a privacy-focused payments token—continued its strong start to the year, climbing 15% and extending its weekly gain to 141%. The market is now looking for its next catalyst as political unrest in Iran and Venezuela revives crypto’s “safe-haven” narrative, highlighted by the divergence between digital assets and U.S. equities, which underperformed BTC and ETH this week.
Derivatives market positioning
Exchanges have unwound nearly $240 million in leveraged crypto futures positions. Total futures open interest across the market has eased to $143 billion from $146 billion, signaling a cooling in demand for leveraged trading.
Bitcoin’s volatility slump persists. Volmex’s 30-day implied volatility now reflects an average daily move of about 2.5% over the next month. Ethereum’s 30-day implied volatility has also fallen, reaching its lowest level since early 2024.
ZEC saw futures open interest drop 14% in 24 hours, contributing to capital outflows across most major tokens, including bitcoin, ether, solana, and XRP. In contrast, Monero stood out with an 8% increase in open interest.
ZEC’s annualized funding rates plunged to -50%, indicating strong demand for bearish, short positions. This also suggests that downside bets may be becoming crowded, a setup that can often precede a potential short squeeze.
In the options market, block trades showed a large short position in bitcoin’s $112,000 call expiring on February 6. This may have been paired with a long spot position as part of a covered call strategy to generate additional yield. For Ethereum, block flows leaned toward the iron condor strategy, which is typically used to benefit from a range-bound price environment.
Crypto token overview
DASH once again took the lead on Friday, climbing over 15% since midnight UTC, even as most of the altcoin market stayed subdued following an earlier rally at the start of the week. This could be a constructive signal for the broader altcoin space, as DASH had also been the first mover during Asian trading on Tuesday, hours before the wider market broke higher.
XTZ also displayed strength, advancing 8.3% from a morning low of $0.57 to $0.62. The CoinDesk 80 Index (CD80), which tracks a broader range of altcoins, is up 0.68% since midnight, while the CoinDesk 20 (CD20) is largely flat—suggesting relative outperformance among altcoins as major tokens move sideways.
Traders are now watching the U.S. market open to see whether traditional markets might inject volatility ahead of the weekend, a period that is typically marked by lighter volume and liquidity.
The Federal Reserve’s Beige Book released Wednesday indicated that “tariff-driven cost pressures were widespread across every district.” Out of the 12 Fed districts, only two saw mild price increases, while the remaining 10 experienced more intense price pressure. This suggests the Fed is unlikely to reduce benchmark interest rates at the upcoming FOMC meeting—unless signs of labor market weakness push them to cut rates again to support hiring.
Meanwhile, a 5.1% increase in existing home sales in December could point to a potential recovery in the housing sector. The median price of homes sold last month was $405,400, a gain of just 0.4% year-over-year, indicating that home price appreciation remains limited.
The Commerce Department reported that retail sales increased 0.6% in December, surpassing economists’ forecasts of a 0.5% gain. In addition, October’s retail sales were revised to a 0.1% decline, instead of the previously estimated 0.2% rise. Overall, 10 of the 13 retail categories posted higher sales in November, making this a strong performance that should continue to support solid GDP expansion.
Meanwhile, three missile-capable ships and an aircraft carrier are being deployed to the Middle East in a show of force aimed at pressuring Iran’s government. Crude oil markets are pricing in the possibility that Iran’s oil exports could be removed from global supply, depriving the regime of revenue. This signals that President Trump may take further action beyond sanctions and a 25% tariff on nations that trade with Iran.
Intense diplomatic efforts have been taking place between Iran and neighboring Arab countries. On Wednesday, President Trump said Iran had halted the killing of anti-government demonstrators and would not carry out death sentences against people accused of seeking to overthrow the regime. His comments suggested the U.S. might be stepping back from launching military strikes. Trump told reporters that the U.S. had received word Iran had “no plans to execute protesters.”He went on to say that new information indicated the deaths had ceased and the executions had been stopped, adding that many believed executions were scheduled for that day.
Jerome Powell’s eight-year leadership at the Federal Reserve is ending amid significant challenges for the U.S. central bank and divided opinions among policymakers about the right approach to monetary policy. So, what might Powell’s last moves as Chair look like in this environment?
The labor market is still slightly weaker than full employment. Private sector job growth has stalled recently, and although the unemployment rate dropped a bit in December, it remains above what most economists consider the long-term natural rate.
On the inflation front, recent data are more promising. Core CPI inflation fell to 2.6% year-over-year in December from 3.1% in August. Some temporary shutdown effects may be lowering this figure by about 0.1 percentage points, and the Fed’s preferred inflation gauge, the PCE deflator, likely hasn’t improved as much. However, the overall trend for core inflation entering 2026 is clearly downward.
Given this, the Federal Open Market Committee (FOMC) likely has room to continue guiding the federal funds rate toward a neutral level in the near term. The forecast remains two quarter-point rate cuts in March and June, with the rate then holding steady at 3.00%-3.25%.
However, the opportunity for further rate reductions is narrowing. Fiscal stimulus from the recent One Big Beautiful Bill Act is expected to start boosting the economy by spring or summer. Additionally, tariff risks seem to be declining, which could also spur faster growth later in the year. The recent 75 basis points of rate cuts over the past three months will likely provide some support as well.
If labor market and inflation indicators show signs of overheating in the coming months, Powell and the FOMC might opt to pause policy adjustments and leave things steady for the next Chair. This successor could face skepticism from a committee under pressure from the Trump administration. The expectation of stronger economic growth in spring and summer further supports holding rates steady.
For now, the current forecast stands, but there is growing risk that rate cuts may be delayed or reduced compared to the baseline prediction.
On Wednesday, Bitcoin is trading above $95,000, having recently broken through a crucial resistance level. Ethereum continues its upward momentum, currently trading above $3,300 after gaining nearly 7% this week. Meanwhile, XRP has bounced back, holding support near its 50-day EMA at $2.17, indicating the potential for further gains.
On Wednesday, Bitcoin (BTC), Ethereum (ETH), and Ripple (XRP) continued trading higher, following gains of over 4%, 7%, and 5% respectively the previous day. BTC closed above a critical resistance level, while ETH and XRP held firm support at key price points. These top three cryptocurrencies by market cap appear poised to extend their rallies, with targets set at $100,000 for BTC, $3,500 for ETH, and $2.35 for XRP.
Bitcoin Breaks and Closes Above Key Resistance at $94,253
Bitcoin found support near the former upper consolidation zone around $90,000 on January 8 and showed a modest recovery through Monday. On Tuesday, BTC surged over 4%, closing above the 61.8% Fibonacci retracement level—measured from the April low of $74,508 to the October all-time high of $126,199—at $94,253. As of Wednesday, Bitcoin is trading near $95,300.
If Bitcoin maintains its upward momentum, it could push further toward the important psychological milestone of $100,000.
The daily chart’s Relative Strength Index (RSI) stands at 66, above the neutral midpoint of 50 and trending higher, signaling strengthening bullish momentum. Additionally, the Moving Average Convergence Divergence (MACD) indicator shows a sustained bullish crossover, with increasing green histogram bars above the neutral line, reinforcing the optimistic outlook.
BTC/USDT daily chart
Conversely, if Bitcoin undergoes a pullback, it may drop further toward the critical support level at $94,253.
Ethereum Bounces Back Following 50-Day EMA Test
Ethereum found support near its 50-day EMA at $3,139 last week and remained around that level through Monday. On Tuesday, ETH surged over 7%, closing above $3,325. As of Wednesday, it’s trading near $3,200.
If the upward momentum persists, Ethereum could push toward the December 10 high of $3,447. Similar to Bitcoin, Ethereum’s RSI and MACD indicators show bullish signals, reinforcing a positive outlook.
ETH/USDT daily chart
However, should Ethereum experience a pullback, it may drop further toward the 50-day EMA support at $3,139.
XRP bulls aiming for the $2.35 mark
XRP found support near its 50-day EMA at $2.07 last week and remained around that level through Monday. On Tuesday, XRP climbed over 5%. As of Wednesday, it is trading close to $2.16.
If the rally continues, XRP could push higher toward the daily resistance at $2.35. Similar to Bitcoin and Ethereum, XRP’s momentum indicators, including RSI and MACD, display bullish signals, reinforcing a positive outlook.
XRP/USDT daily chart
On the other hand, if XRP faces a pullback, it could extend the decline toward the 50-day EMA at $2.07.
Story continues its recovery, approaching the $3 mark after gaining 27% on Monday.
MYX Finance is nearing $6, marking its third straight day of gains within a short-term trading range.
Dash rose 3% on Tuesday, building on Monday’s nearly 6% increase, and is now testing the 200-day Exponential Moving Average (EMA).
Story (IP) is spearheading the market rally with double-digit gains in the past 24 hours, while MYX Finance (MYX) and Dash (DASH) each climb about 6%. These top performers are approaching critical resistance levels as they seek to continue their upward momentum.
Story Continues Rapid Recovery
Story edged up more than 1% Tuesday, building on Monday’s impressive 27% gain. The meme coin is on its third consecutive day of recovery and is nearing the $3.00 mark, approaching the November 6 low of $3.26, which previously acted as resistance on November 26.
If Story (IP) breaks above $3.26, it may set its sights on the 200-day Exponential Moving Average (EMA) at $4.101.
Momentum indicators on the daily chart suggest strong bullish momentum. The Relative Strength Index (RSI) stands at 79, indicating overbought conditions, while the Moving Average Convergence Divergence (MACD) continues to rise, supported by green histogram bars.
IP/USDT daily price chart.
If Story cannot break above $3.00, it may face a pullback that tests support at the 50-day Exponential Moving Average (EMA) around $2.356.
MYX Finance could struggle to surpass $6
MYX Finance is approaching resistance near $6.07, marking the upper boundary of a short-term range and aligning with the January 3 closing price. At the time of writing, MYX has gained nearly 1%, adding to the previous day’s 4% increase.
A strong close above $6.07 could propel MYX toward the January 3 high of $7.29, where it faces resistance from a trendline connecting the October 29 and November 15 highs.
From a technical standpoint, MYX Finance is showing renewed bullish momentum, with the Relative Strength Index (RSI) at 71 on the daily chart, edging into overbought territory. The MACD and its signal line also continue their upward trajectory. However, the absence of a clear trend in these indicators signals a possible risk of reversal.
MYX/USDT daily logarithmic chart.
Conversely, if MYX fails to hold above $6.07, a pullback could drive the price down toward the January 6 low of $4.58.
Dash’s Recovery Reaches 200-day EMA
Dash gained 3% as of Tuesday, building on a 6% increase from the previous day. The privacy-focused cryptocurrency is recovering from a December 23 low of $36.68 and is now nearing the 200-day Exponential Moving Average (EMA) at $41.30.
If Dash surpasses this level, it could next aim for the 50-day EMA at $45.04.
Technical indicators on the daily chart point to a revival in buying interest. The Relative Strength Index (RSI) at 46 is approaching the midpoint, signaling a rebound from last week’s decline, while the MACD has crossed above its signal line, reflecting renewed bullish momentum.
DASH/USDT daily price chart.
On the downside, if DASH fails to break above $41.30, it may pull back to retest the $36.68 support level.
Bitwise’s Chief Investment Officer, Matt Hougan, criticized the notion that Bitcoin is unsuitable for investment and 401(k) plans due to its volatility, pointing out that certain stocks can experience even greater price fluctuations.
Hougan’s remarks came on the same day that U.S. Senator Elizabeth Warren urged the Securities and Exchange Commission (SEC) to clarify how it plans to manage the risks associated with including cryptocurrencies in retirement funds.
In August of last year, U.S. President Donald Trump signed an executive order directing the Labor Department to reconsider restrictions on alternative assets in defined-contribution plans, potentially allowing cryptocurrencies to be included in 401(k) retirement accounts.
In a Monday interview with Investopedia Express Live, Matt Hougan criticized previous efforts by management firms like Vanguard and regulatory advice discouraging Bitcoin’s inclusion in 401(k)s as “ridiculous.”
“This is simply another asset class. Yes, it experiences price fluctuations and carries risk. However, over the past year, Bitcoin has been less volatile than Nvidia stock, yet there are no restrictions preventing 401(k) providers from offering Nvidia stock,” Hougan stated.
In 2025, Nvidia’s stock experienced a dramatic 120% price swing, dropping to around $94.31 in April before surging past $207 by October. During the same period, Bitcoin fluctuated between $76,000 and $126,080, a 65% swing. The inclusion of crypto assets in 401(k) retirement plans remains a key goal for crypto companies seeking wider retail adoption and increased legitimacy within the financial system.
Warren demands SEC answers on crypto in 401(k)
Meanwhile, U.S. Senator Elizabeth Warren is pressing the SEC for clarity on how it plans to manage risks associated with 401(k) plans investing in “alternative investments” like cryptocurrencies.
In an open letter released Monday, Warren expressed concerns that including crypto in retirement accounts may not benefit participants due to higher fees and expenses typically associated with these assets, alongside crypto’s inherent volatility.
“For most Americans, their 401(k) is a crucial source of retirement security, not a venue for risky financial speculation. Introducing crypto into these accounts could expose workers and families to significant losses,” she warned.
Warren has called on SEC Chair Paul Atkins to confirm by January 27 whether the regulator considers volatility when valuing crypto holdings of publicly traded companies.
She also seeks information on whether the SEC has evaluated manipulative practices in crypto markets and if it plans to publish research and educational materials to improve investor awareness.
Cryptocurrency Inclusion in 401(k) Plans Will Become Standard Over Time
Beyond President Trump’s executive order, in May the Department of Labor’s Employee Benefits Security Administration took a neutral position on cryptocurrency in 401(k) plans. They neither endorsed nor opposed it, having withdrawn a 2022 compliance guidance that previously discouraged crypto investments in retirement accounts.
Hougan noted that while it’s uncertain whether 401(k) providers will begin investing in crypto during 2026, he expects it to happen eventually and become normalized.
“These institutions move slowly, but the trend is clear. Over time, crypto will be treated like any other asset — which is exactly how it should be,” he added.
On Tuesday, Cardano’s price approached a crucial support level at $0.38 after failing to break above the 50-day EMA at $0.41 last week.
Metrics from on-chain data and derivatives present a mixed picture: selective accumulation by whales and an increase in long positions contrast with negative funding rates and falling social dominance.
From a technical perspective, a rebound is possible if the $0.38 support holds, but a confirmed drop below this level could indicate a more significant correction.
On Tuesday, Cardano (ADA) price approached an important support level at $0.38, following rejection from the 50-day Exponential Moving Average (EMA) last week. Market indicators present a mixed picture: selective whale accumulation and increasing long positions point to underlying demand, while negative funding rates and decreasing social dominance reflect cautious market sentiment. Technically, ADA stands at a critical juncture—holding above support may lead to a price rebound, whereas falling below could trigger a more significant downturn.
Investor sentiment remains mixed
Data from Santiment’s Supply Distribution indicates a bullish sentiment for Cardano, with some whales accumulating ADA during recent price declines.
The data reveals that whales holding between 10 million and 100 million ADA tokens (represented by the blue line) have collectively acquired 180 million ADA from January 8 through Tuesday. Meanwhile, another group of whales holding between 1 million and 10 million ADA tokens (yellow line) and those with 100,000 to 1 million tokens (red line) have offloaded a total of 50 million tokens during the same period.
This suggests that the second group of whales may have experienced a capitulation event, while the first group capitalized on the opportunity to accumulate Cardano at discounted prices.
Cardano supply distribution chart. Source: Santiment
Coinglass reported that ADA’s long-to-short ratio reached 1.33 on Tuesday, marking its highest point in more than a month. A ratio above one indicates that a majority of traders are anticipating a price increase for Cardano.
Cardano’s long-to-short ratio chart. Source: Coinglass
Cardano’s social dominance measures the proportion of ADA-related conversations within the cryptocurrency media, currently signaling a bearish outlook. According to Santiment, ADA’s share of crypto media discussions stands at 0.037%, the lowest since early December, and has been steadily decreasing since early January. This downward trend reflects diminishing investor interest and lower speculative activity, which often correlates with weaker demand and reduced short-term price momentum.
Cardano Social Dominance chart. Data source: Santiment
Additionally, Cardano’s funding rates dropped into negative territory on Tuesday, as shown in the Coinglass chart below. Negative funding rates mean that short positions are paying long holders, signaling bearish sentiment toward ADA.
Cardano’s funding rate chart. Source: Coinglass
Cardano price outlook: ADA approaches critical $0.38 support level
On January 6, Cardano’s price was rejected at the 50-day EMA near $0.41 and subsequently dropped by almost 9% through Monday, retesting the daily support level at $0.38. As of Tuesday, ADA remains close to this key support.
A daily close below $0.38 could signal a further decline toward the December 31 low of $0.32.
The Relative Strength Index (RSI) on the daily chart is stabilizing around the neutral 50 level, reflecting trader indecision. Additionally, the Moving Average Convergence Divergence (MACD) lines are converging, which also points to a lack of clear direction.
ADA/USDT daily chart
If the $0.38 daily support level holds firm, ADA may rebound toward the 50-day EMA at $0.41.
If economists were meteorologists, this week’s forecast would predict a data blizzard. However, clarity is expected to improve as markets receive highly anticipated reports on inflation, retail sales, and industrial production ahead of the Federal Reserve’s policy meeting on January 28.
Few economists expect Fed Chair Jerome Powell and the Federal Open Market Committee (FOMC) to ease monetary policy again later this month—and neither do we. This week’s data could either confirm or challenge that view, starting with the December consumer price index report on Tuesday.
The Fed drama intensified last week after President Donald Trump instructed Fannie Mae and Freddie Mac to purchase $200 billion in mortgage bonds—an action typically undertaken by the Fed itself. Many saw this move as an attempt to restart quantitative easing. Meanwhile, Fed Governor Stephen Miran told Bloomberg he anticipates 150 basis points of rate cuts this year.
What’s still missing, however, is significantly lower inflation and a recession that would justify such aggressive easing. This week will also feature speeches from several Fed officials, which could provide insight into the central bank’s thinking. The lineup starts with New York Fed President John Williams on Monday, followed by Governors Miran (Wednesday), Michael Barr (Thursday), Michelle Bowman (Friday), and Vice Chair Philip Jefferson (Friday).
Here’s a rundown of this week’s key data releases likely to influence the timing and scale of any future Fed rate cuts:
Inflation
Since the 43-day government shutdown in October and November, investors have struggled to gauge inflation accurately. The 2.7% year-over-year CPI rise in November, a slight dip from October’s 3.0%, was met with caution, as the shutdown likely disrupted the Bureau of Labor Statistics’ data gathering.
This increases the importance of the upcoming CPI and PPI reports, which will be key indicators before the FOMC’s January 28 interest rate decision.
The upcoming CPI report on Tuesday is expected to show a modest easing in inflation, with the Cleveland Fed’s model forecasting a 0.2% monthly increase and 2.6% year-over-year growth. The November PPI report, due Wednesday, is considered less impactful, while import and export price data for November will be released on Thursday.
Retail sales
Retail sales (Wednesday) are expected to show a slight increase in November after remaining flat in October (see chart). Overall, we believe consumer spending remains resilient despite rising living costs and soft employment figures. Additional important demand indicators this week include December existing home sales (Wednesday) and mortgage applications for the week ending January 9 (Wednesday).
Jobless claims
We anticipate layoffs will stay minimal, which has been the key insight from recent initial unemployment claims data (Thursday) (see chart). While demand for labor may be slowing in certain sectors, the feared AI-driven collapse in the job market has not materialized yet.
Composite economic indicators & business surveys
The composite cyclical indicators for December, due Thursday, are expected to show the coincident index holding at a record high, while the (mis)leading index continues its decline. Additionally, given delays in official hard data, the National Federation of Independent Business’ Small Business Optimism Index for December (Tuesday) should provide valuable insights, following its rise to 99 in November. Later in the week, the Federal Reserve banks of New York and Philadelphia will release their January business surveys (Thursday).
Our preferred coincident indicator is the S&P 500 forward earnings per share, which has accelerated in recent weeks and hit record highs (see chart).
Bitcoin’s price trend moved differently as Nasdaq futures dropped by nearly 0.8%.
Bitcoin increased by 1% amid growing tensions between President Trump and Fed Chairman Powell, which rattled markets and led to declines in U.S. stock futures and the dollar. Powell described the legal challenge as politically driven, intended to pressure the central bank into aggressive interest rate cuts. However, prediction markets do not anticipate this conflict resulting in Powell leaving his position prematurely.
Bitcoin climbed 1% Monday afternoon Hong Kong time as escalating tensions between President Donald Trump and Federal Reserve Chairman Jerome Powell unsettled investors, pushing both U.S. stock futures and the dollar index down.
Bitcoin reached $92,000 but remained within last week’s range of $89,000 to $95,000, according to CoinDesk data. Meanwhile, Nasdaq futures declined 0.8%, S&P 500 futures dropped 0.5%, and the dollar index eased to 99.00 from Friday’s high of 99.26.
Typically, BTC tends to follow the Nasdaq’s movements, but this time it diverged, suggesting growing safe haven demand for the cryptocurrency as investors seek a “hideout” amid the intensifying Trump-Powell conflict. Supporters of BTC have long praised it as an anti-establishment asset and a safeguard against reckless fiscal and monetary policies. Meanwhile, gold, a classic safe haven, also climbed to a record high of $4,600 per ounce.
Tensions between the Federal Reserve and the White House intensified over the weekend after Powell revealed that the Trump administration had threatened him with a criminal indictment related to the renovation of the Fed’s headquarters.
Powell dismissed the indictment as politically motivated, aimed at pressuring the Fed into cutting interest rates.
Trump has long been critical of Federal Reserve policies, especially its hesitance to aggressively lower rates to stimulate economic growth. Since taking office in 2025, he has frequently pushed Fed Chair Jerome Powell to reduce rates more sharply, labeling him a “numbskull” and threatening to make changes to increase White House influence over monetary policy.
Trump has consistently called for interest rates to fall to 1% or below. Although the Fed cut rates by 25 basis points last month to 3.5%, it is expected to hold steady at least until March and is unlikely to return to ultra-low levels anytime soon.
Despite the escalating attacks from Trump’s team, prediction markets do not anticipate an early departure for Powell, whose term ends in May this year.
However, persistent assaults on central banks, especially amid ongoing inflation, can undermine investor confidence and destabilize the domestic currency.
The sharp decline of Turkey’s lira in recent years, triggered by President Recep Tayyip Erdogan’s interference with central bank independence, stands as a cautionary example. Still, the dollar’s position as the global reserve currency makes a severe collapse in the U.S. less likely.