A trend line is a straight line drawn on a chart that connects two or more significant price points (swing highs or swing lows) to show the overall market trend.
It helps traders:
- See the trend direction
- Identify entry and exit points
- Spot trend continuation or reversal
In greater detail
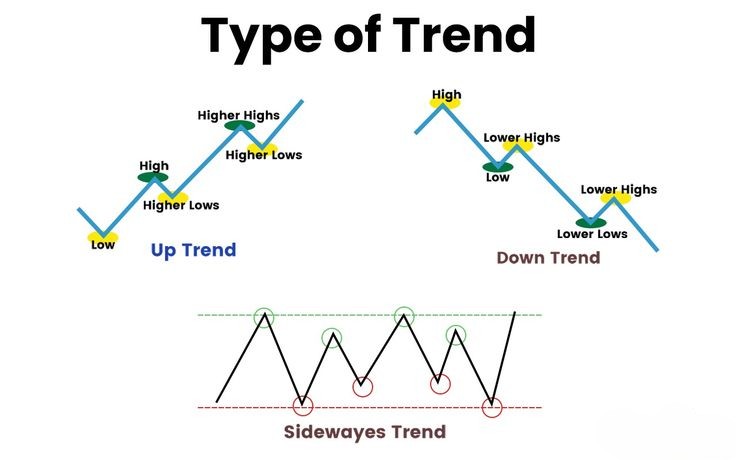
- Uptrend Line (Bullish Trend)
- Price tends to bounce upward from the line
- Drawn by connecting higher lows
- Acts as support
- Market is making higher highs & higher lows
- Downtrend Line (Bearish Trend)
- Drawn by connecting lower highs
- Acts as resistance
- Price tends to move downward from the line
- Market is making lower highs & lower lows
- Horizontal Trend Line (Sideways Market)
- Drawn across equal highs or equal lows
- Represents support or resistance
- Indicates range-bound (consolidation) market
- No clear trend
Why Trend Lines Matter
- Simple and visual
- Works in stocks, forex, crypto, commodities
- Combines well with:
- Support & resistance
- Candlestick patterns
- Indicators (RSI, MA, Volume)
Key Tip ⚠️
A trend line is a guide, not a guarantee. Always wait for confirmation before trading.
