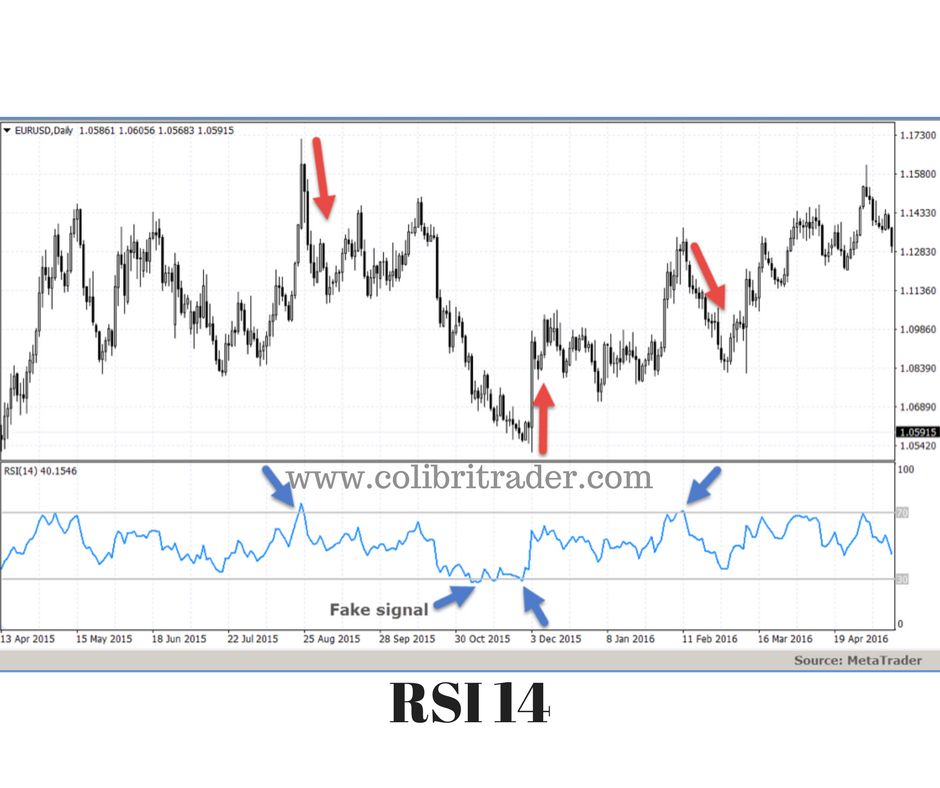
Relative Strength Index (RSI)
The Relative Strength Index (RSI) is a popular technical indicator used in financial markets to measure the speed and change of price movements. It helps traders identify overbought or oversold conditions in an asset’s price, signaling potential reversals or continuation of trends.
Key Points about RSI:
- Range: RSI values range from 0 to 100.
- Overbought condition: RSI above 70 typically suggests that the asset might be overbought, meaning it may be overvalued and a price pullback or reversal could happen.
- Oversold condition: RSI below 30 typically indicates the asset might be oversold, meaning it could be undervalued and a price rise might be expected.
- Calculation period: The standard RSI uses a 14-period timeframe (can be days, hours, minutes, depending on chart).
- Interpretation:
- RSI near 50 suggests neutral or balanced momentum.
- Divergences between RSI and price (e.g., price makes a new high but RSI does not) can indicate weakening momentum and possible trend reversals.
Moving Average Convergence Divergence (MACD)
MACD stands for Moving Average Convergence Divergence. It’s a popular technical analysis indicator used in trading to identify trends, momentum, and potential buy or sell signals in financial markets.
Key components
- MACD Line = 12 EMA – 26 EMA
- Signal Line = 9 EMA of MACD Line
- Histogram = MACD Line – Signal Line (visualizes the difference)
What traders look for:
- Crossovers:
- When the MACD line crosses above the Signal line → potential buy signal (bullish).
- When the MACD line crosses below the Signal line → potential sell signal (bearish).
- Divergence:
- When price moves in one direction but MACD moves in the opposite direction, indicating a possible trend reversal.
- Overbought/Oversold conditions:
- Very high or very low MACD values can signal the market might be overbought or oversold.

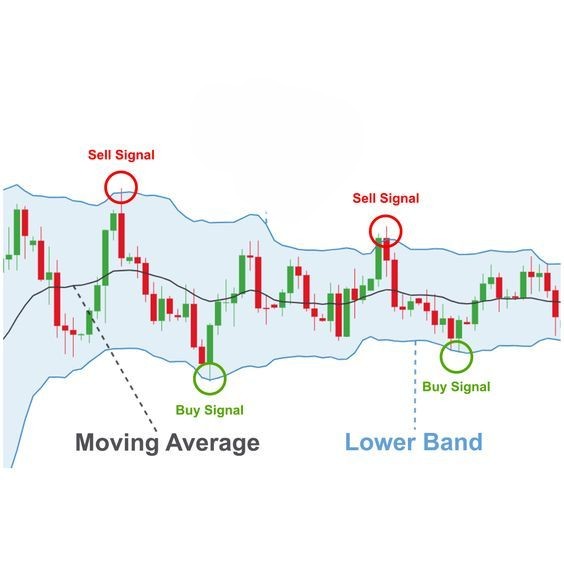
Bollinger Bands
Bollinger Bands are a popular technical analysis tool used in trading to measure market volatility and identify potential overbought or oversold conditions.
Components
- Middle Band: A simple moving average (SMA), usually set to 20 periods.
- Upper Band: Middle Band + (usually 2) standard deviations.
- Lower Band: Middle Band – (usually 2) standard deviations.
How it works
- The bands expand when volatility increases and contract when volatility decreases.
- Price tends to stay within the upper and lower bands most of the time.
- When the price touches or crosses the upper band, it might indicate the asset is overbought.
- When the price touches or crosses the lower band, it might indicate the asset is oversold.
Uses of Bollinger Bands
- Volatility measurement: Wider bands = higher volatility; narrower bands = lower volatility.
- Trend identification: Price movements outside the bands can signal strong trends.
- Reversal signals: Price bouncing off the bands can indicate possible reversals.
Important notes
These indicators are most effective when the market is moving sideways.
