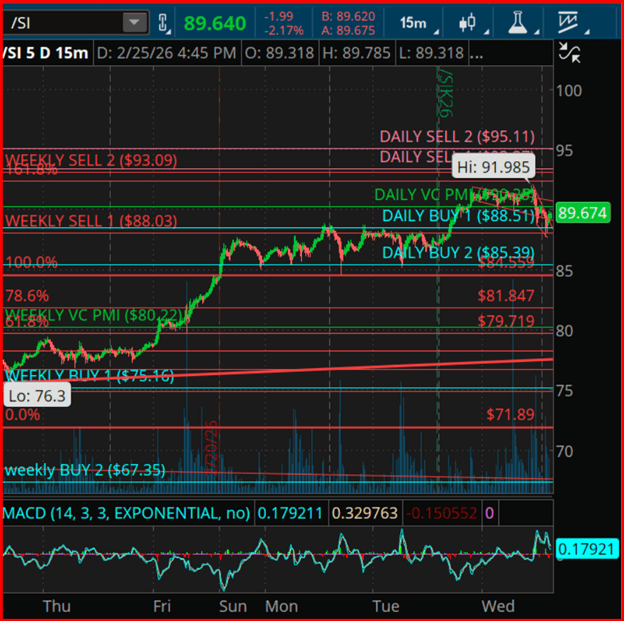
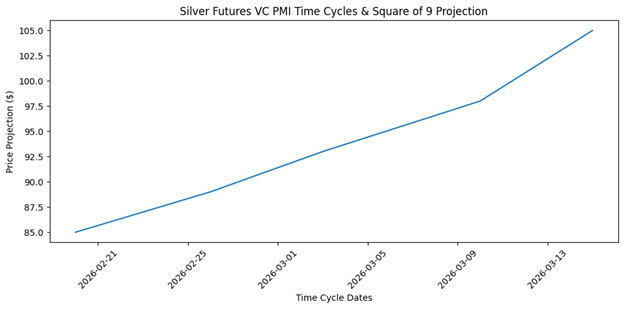
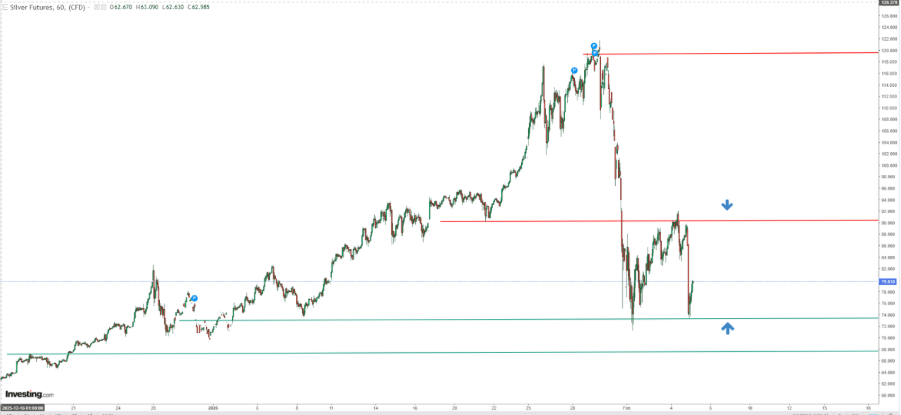
The February 26–March 3 cycle represents a projected volatility expansion window. If price maintains support above the weekly mean and regains upside momentum, the next bullish targets come in at $98, $105, and potentially $120. However, a breakdown below the $85.39 daily Buy-2 level would postpone the expansion phase and shift the market back into a deeper accumulation range between $81.85 and $79.71.
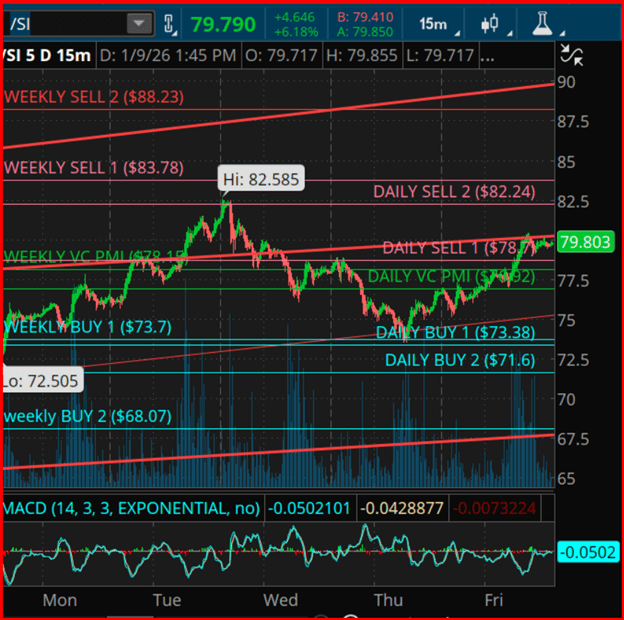
Silver futures are currently trading within a structured VC PMI mean-reversion model, signalling a transition from distribution into a fresh decision phase as price oscillates around both the daily and weekly averages. Within the VC PMI framework, the mean represents equilibrium — the point where supply and demand balance. Moves toward Buy-1/Buy-2 or Sell-1/Sell-2 define statistically extreme zones, carrying a 90%–95% probability of reverting back toward the mean.
Around the $89 area, silver has pulled back from upper resistance and is now rotating toward the daily mean in the $89–$90 zone. The weekly Sell-1 level at $88.03 and Sell-2 at $93.09 frame the upper distribution band. A decisive close above $93.09 would confirm a bullish breakout into the next fractal structure, flipping resistance into support and opening harmonic upside projections toward $98–$105 based on Square of 9 geometric expansion.
On the downside, failure to sustain trade above the weekly mean near $80.22 would keep silver locked in a broader consolidation pattern. In that scenario, Buy-1 at $75.16 and Buy-2 at $67.35 define longer-term accumulation levels.
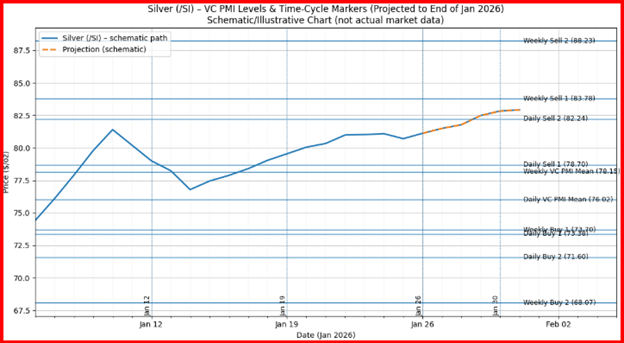
Time-cycle analysis highlights February 26 to March 3 as a pivotal rotational window — a period when corrective phases often conclude and directional momentum emerges. This timing aligns with the current consolidation around the mean, increasing the probability of volatility expansion into early March. A secondary cycle window between March 8 and 12 historically signals either continuation or reversal, depending on whether price holds above or below the mean established during the initial cycle.
These cyclical harmonics are derived from recurring liquidity patterns and repetitive market behavior rather than macro fundamentals, underscoring the quantitative foundation of the VC PMI framework.
Square of 9 geometry reinforces the current technical framework, highlighting harmonic resistance around $93 and $100 as key angular levels projected from prior lows and rotational pivot points. On the downside, support harmonics cluster near $85, $81.85, and $79.71, creating a geometric staircase of demand zones where the probability of institutional accumulation increases. When time and price harmonics converge, markets tend to generate accelerated directional moves — particularly if price pushes above the Sell-2 extreme or breaks below the Buy-2 threshold.
By integrating VC PMI, cyclical timing analysis, and Square of 9 geometry, this methodology offers a structured, rules-based trading approach. The emphasis remains on statistical probability, market structure, and disciplined execution rather than emotional decision-making.
The Chinese Spring Festival (Chinese New Year) holiday is now underway, a period that has historically coincided with softer fiat-denominated gold prices.
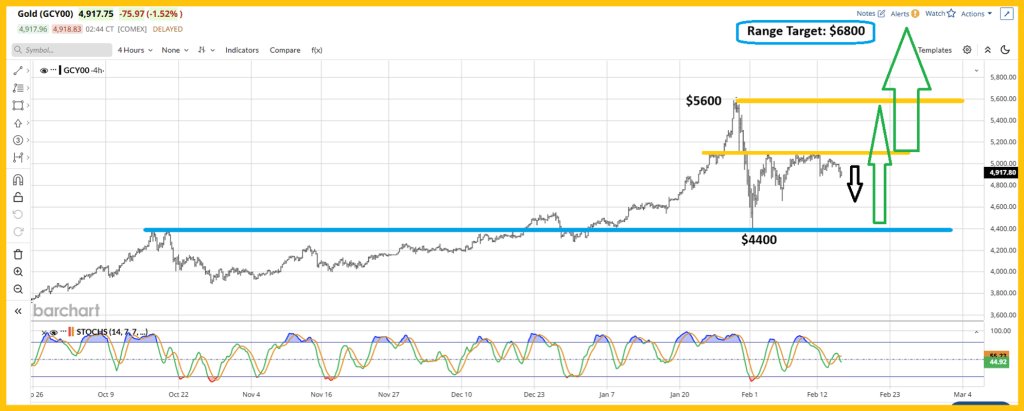
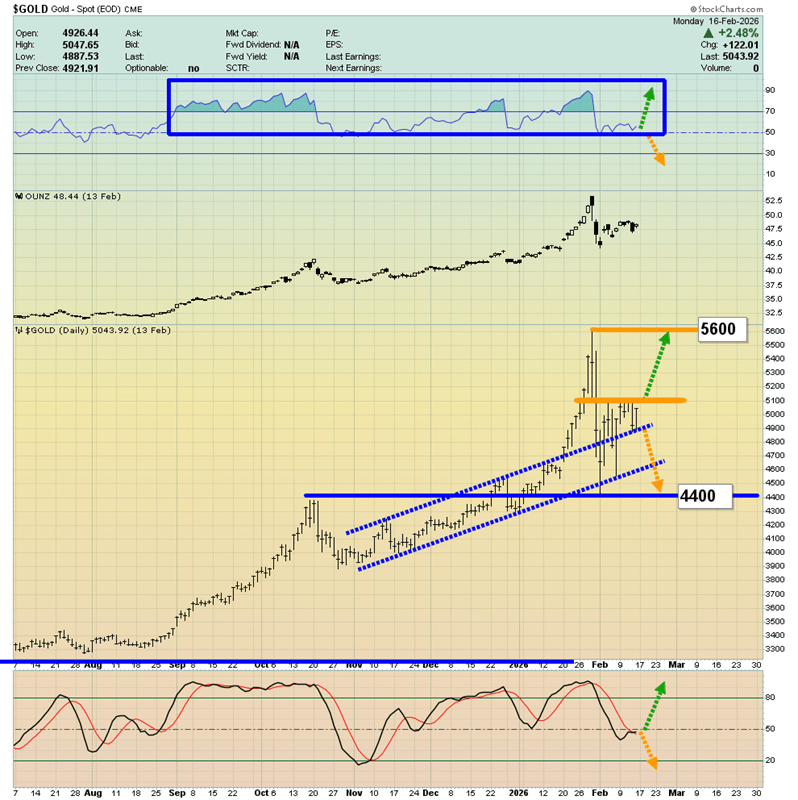
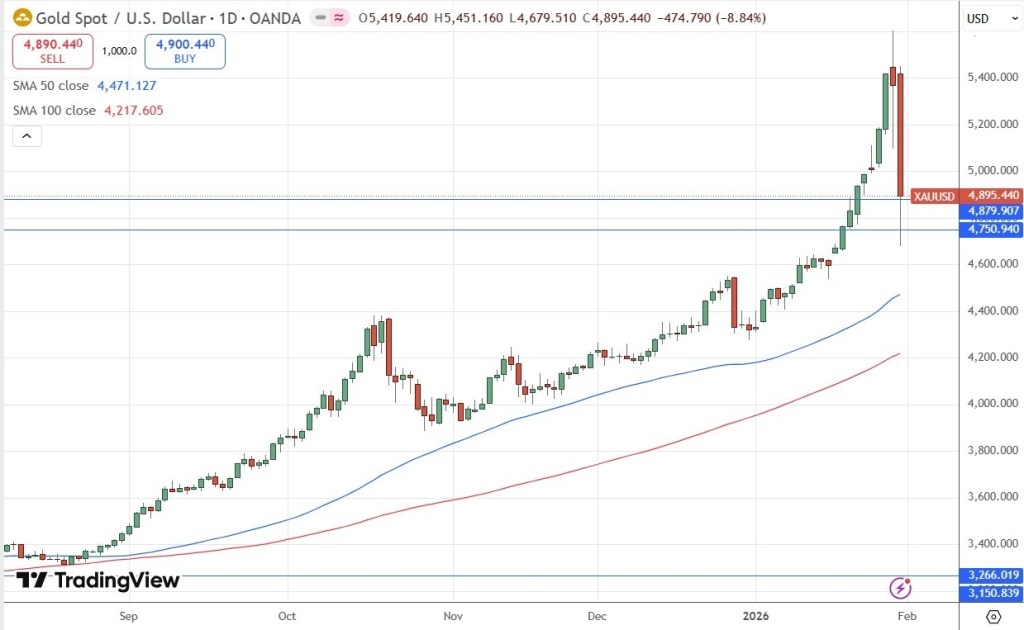
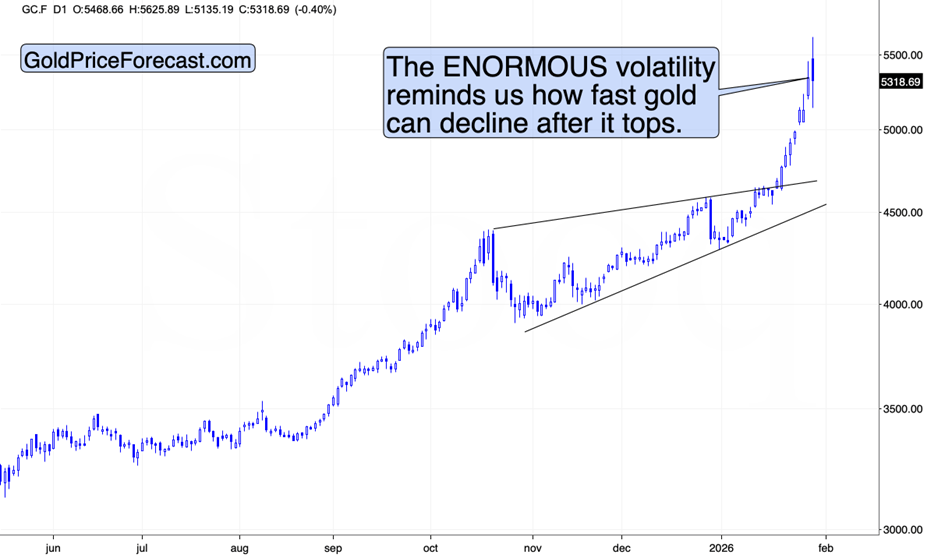
Meanwhile, gold is carving out a consolidation range between $4,400 and $5,600. The longer price action remains compressed within this band, the more constructive the setup becomes.
Extended consolidation typically builds pressure — increasing the probability of an eventual upside breakout and a potential rally toward $6,800.
Here’s another perspective on the price action. Notice the channel outlined by the dotted blue trendlines.
Gold has broken decisively above that channel and now seems to be digesting the move, consolidating gains after the breakout.
Seasonal softness across the metals complex could linger until the Chinese holiday concludes. For enthusiastic Western gold investors, this pullback phase may present an opportunity to increase exposure to gold, silver, and mining equities.
I’ve outlined what I call an emerging “gold bull era,” driven less by Western fear-based demand and more by the structural economic ascent of China and India—an expansion powerful enough to overshadow the West’s traditional crisis trade.
This new phase could also unfold alongside rapid automation, with hundreds of millions of robots taking on work that inflation-strained populations—both East and West—are increasingly burdened by.
In such an environment, widespread income support could evolve into significantly higher baseline incomes, and gold-oriented Asian consumers may expand their purchases well beyond already robust levels.
In the West, the backdrop looks increasingly fragile. Job growth in 2025 has been minimal, with the latest ADP data showing only around 22,000 positions added in January.
By contrast, the official government report showed a gain of 130,000 jobs. That wide gap raises questions—either the data contains significant distortions, or much of the hiring is concentrated in government roles funded by expanding public debt.
The core fear-trade argument is straightforward: if private-sector job creation continues to stall while debt-financed employment props up the headline numbers, underlying economic weakness may deepen.
Unless productivity gains from automation are formally reflected in economic measurements, the strain between slowing human employment and rising fiscal burdens could intensify.
For investors focused on hedging systemic risk, the question becomes familiar: is your portfolio positioned with assets designed to weather instability?
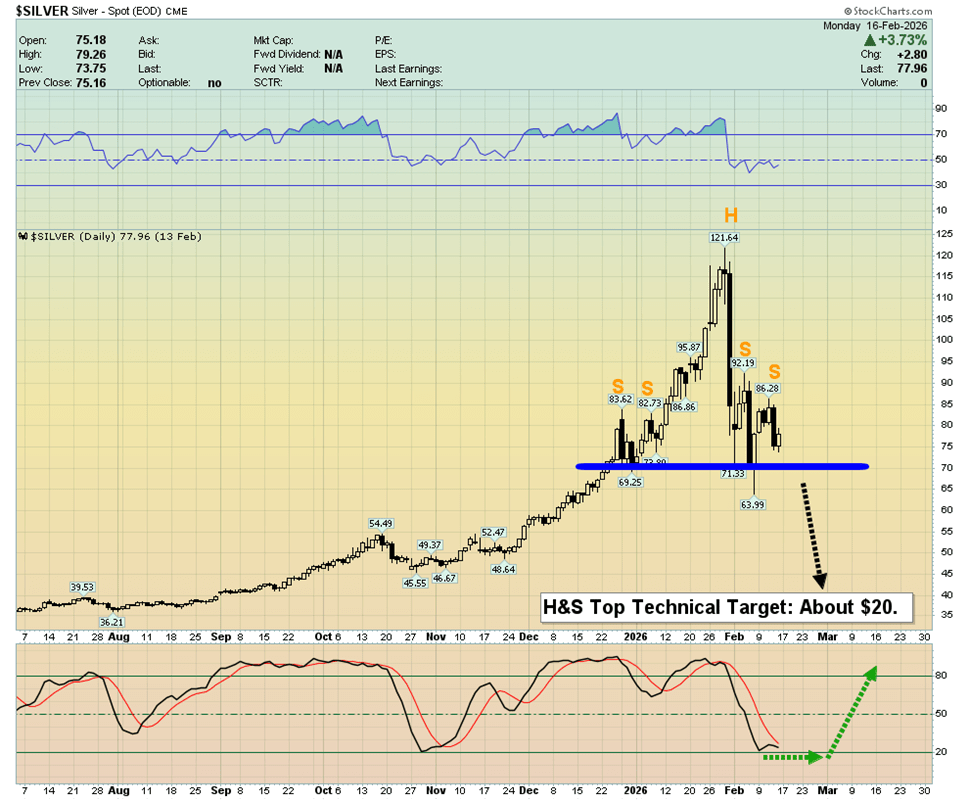
How about silver? The head-and-shoulders top currently forming is a bearish technical pattern pointing toward the $20 area. What might invalidate this setup?
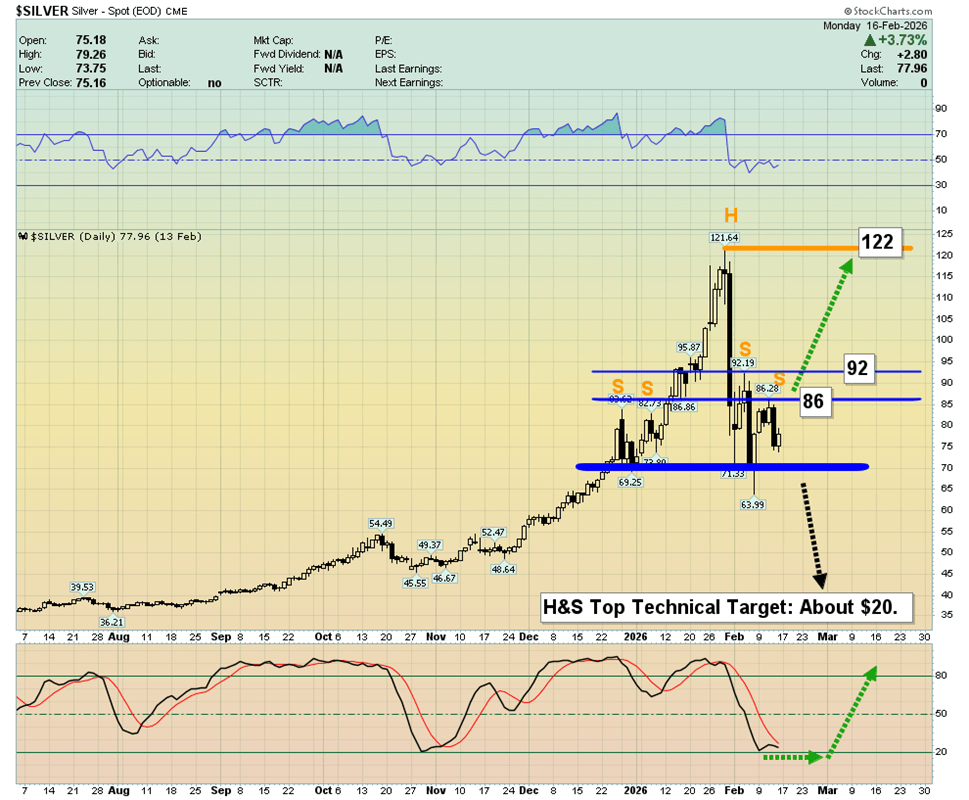
A rally to $87 would push silver back above three of the shoulders in the formation. An additional climb to $93 would fully invalidate the pattern and deal a severe blow to heavily leveraged bears.
Being a pure silver bug—someone almost entirely invested in silver—demands serious conviction and resilience. For the average investor newly drawn to this remarkable metal, it’s wise to keep ample cash on hand to take advantage of unexpected price pullbacks.
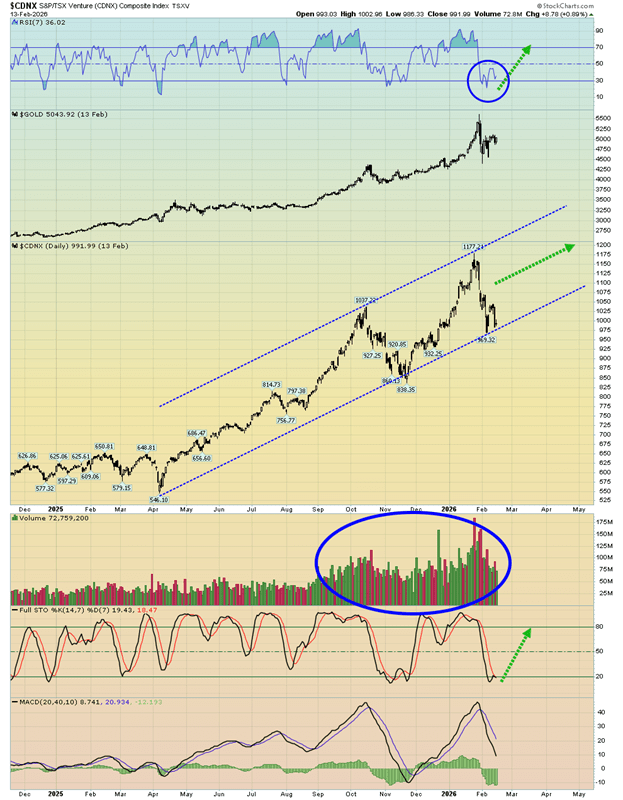
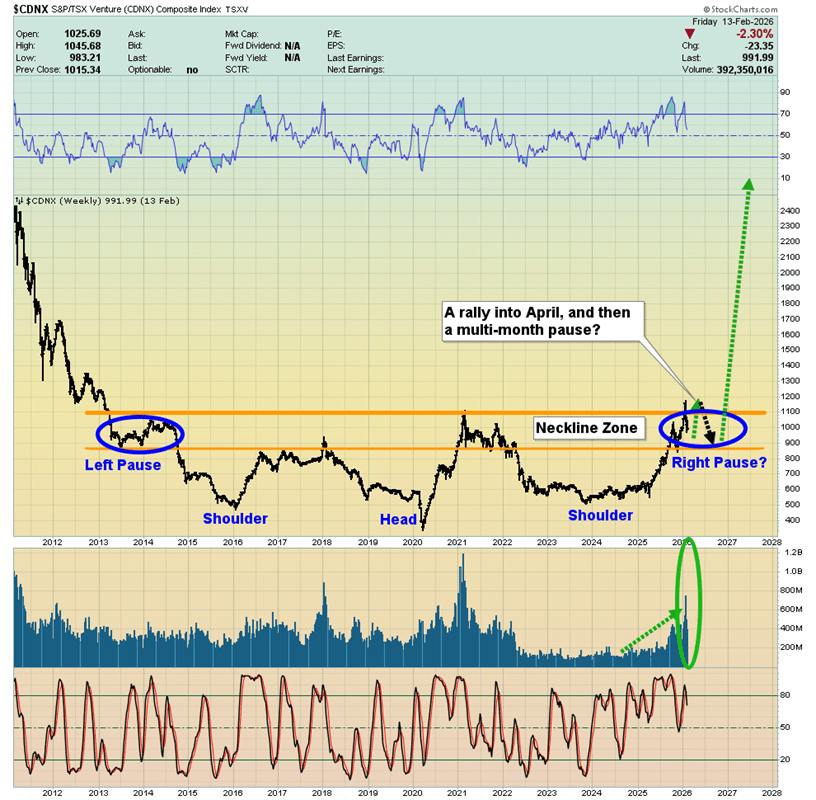
What about the miners? On the CDNX daily chart, the RSI and Stochastics are showing positive signals, but the key 20,40,10 MACD is still sluggish and lacking momentum. If that indicator begins to strengthen, the uptrend in junior mining stocks should pick back up.
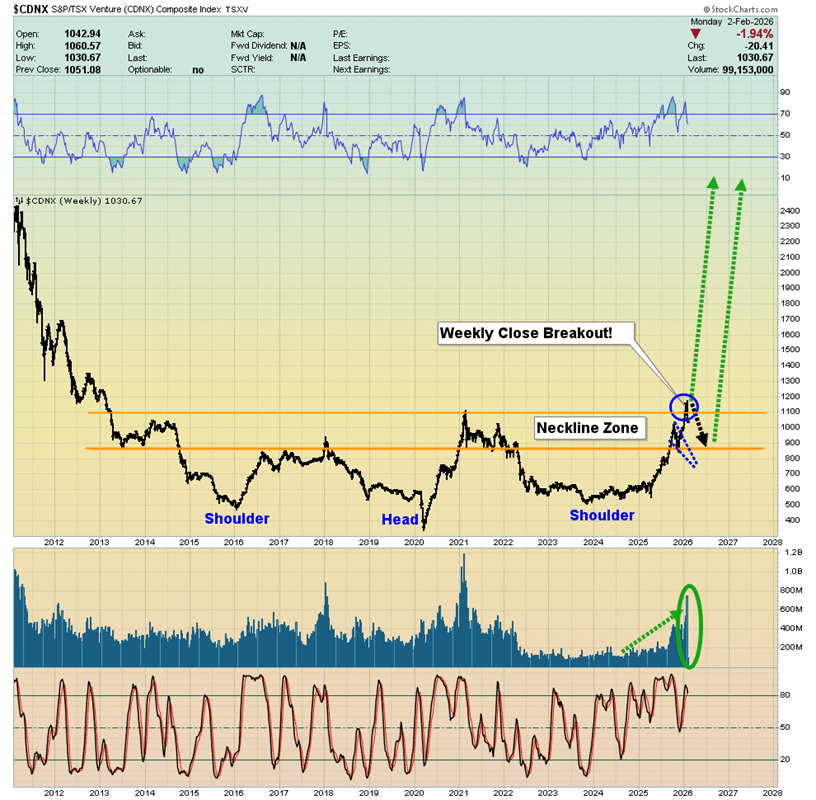
The CDNX weekly chart looks impressive. The base formation is strong and likely signals further upside not only for juniors, but also for intermediate and senior mining companies.
The most probable near-term outlook is a brief pause as Chinese investors step back for the New Year holiday, followed by a solid rally into April for the mining sector. After that, a seasonal consolidation through the summer seems likely, before a powerful, decisive breakout above the 1177 highs.
In the meantime, many individual mining stocks could “front-run” the CDNX, advancing to fresh highs ahead of the broader index.
Looking at the long-term chart of the VanEck Vectors Gold Miners ETF versus gold, mining stocks appear strikingly undervalued—arguably the cheapest sector relative to its underlying asset in modern market history.
The encouraging part is that this imbalance may be only months away from correcting through the only reset that truly counts: a major revaluation of gold equities relative to gold itself.
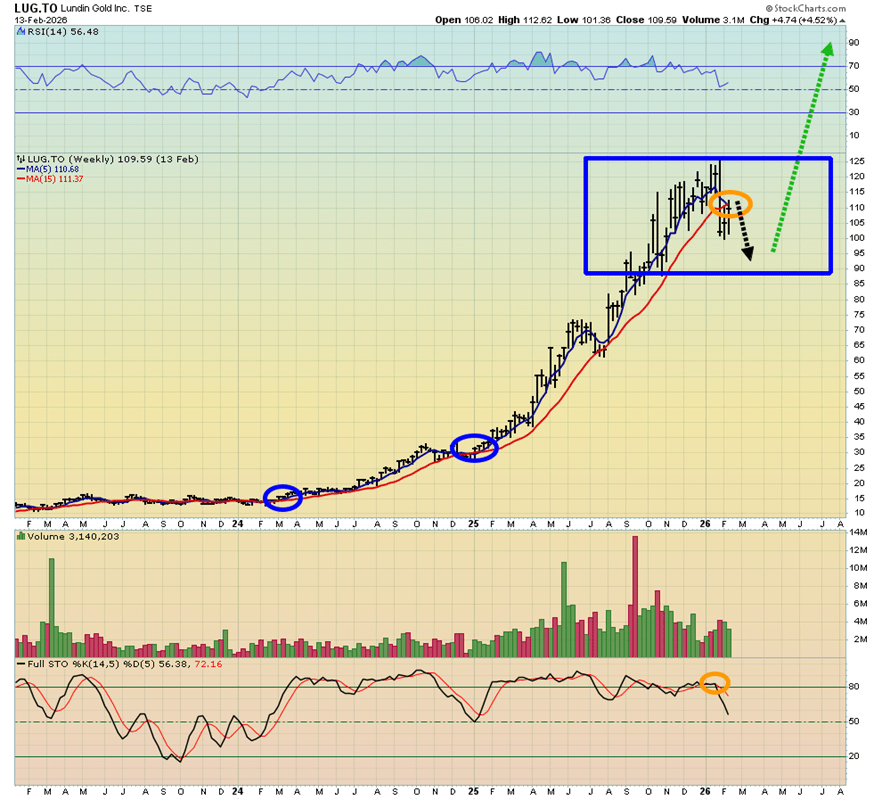
The weekly chart of Lundin Gold is particularly compelling. While most gold producers report all-in sustaining costs (AISC) below $2,000 per ounce—and silver producers around $20—Lundin’s AISC is closer to $1,000, underscoring its strong cost position. Still, even the most efficient miners require periodic technical pauses. The behavior of the key 5 and 15 moving averages highlights these natural consolidation phases.
Pullbacks across the mining sector—both juniors and seniors—can offer strategic entry points, especially as gold continues to consolidate following its broader fundamental breakout.
Some investors even speculate that the fiat price of gold could eventually exceed that of Bitcoin, viewing bitcoin primarily as a liquidity vehicle to accumulate more gold. Over time, rising global demand—particularly from China—could further reinforce gold’s long-term appeal.
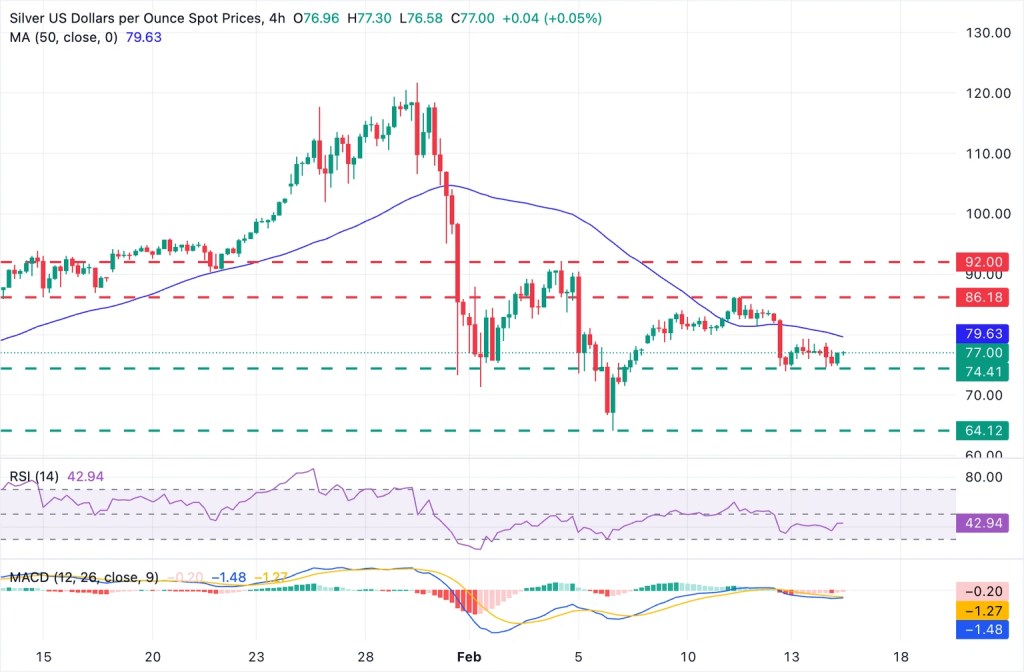
Silver is hovering around the $75.00–$77.00 region, struggling to capitalize on the US Dollar’s softness. Despite the weaker greenback, precious metals remain directionless in a subdued start to the week, with thin liquidity as several Asian markets were closed for Lunar New Year and US markets shut for President’s Day.
XAG/USD is posting modest losses near $77.00, not far from last week’s low around $74.50. Price action has been choppy in recent weeks, but the broader bearish structure from the late-January peak remains intact. Bulls continue to face strong resistance below the key $80.00 psychological barrier, keeping upside attempts contained.
Technical outlook
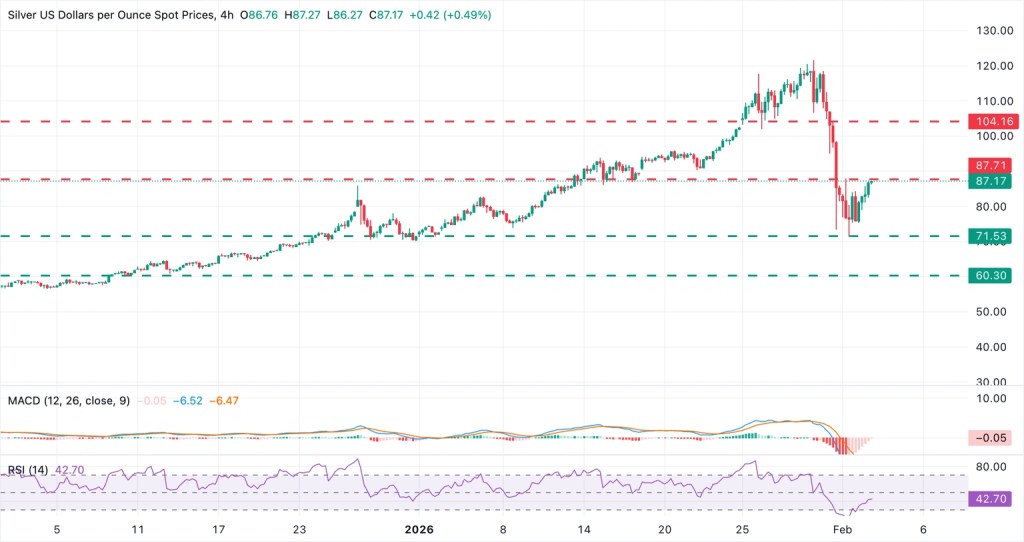
On the 4-hour chart, silver trades beneath a declining 50-period Simple Moving Average (SMA), reinforcing the near-term bearish bias. The MACD histogram remains in negative territory, while the RSI stands near 43 — consistent with neutral-to-bearish momentum.
Initial support lies around $74.40, near last week’s trough, followed by the February 6 low near $64.00. On the upside, immediate resistance is seen at the 50-period SMA around $80.00. A break above that could expose the upper boundary of last week’s range near $86.30, with stronger resistance ahead at the February 4 peak above $92.00.
Overall, silver maintains a cautious, slightly bearish tone unless buyers reclaim the $80.00 level with convincing momentum.
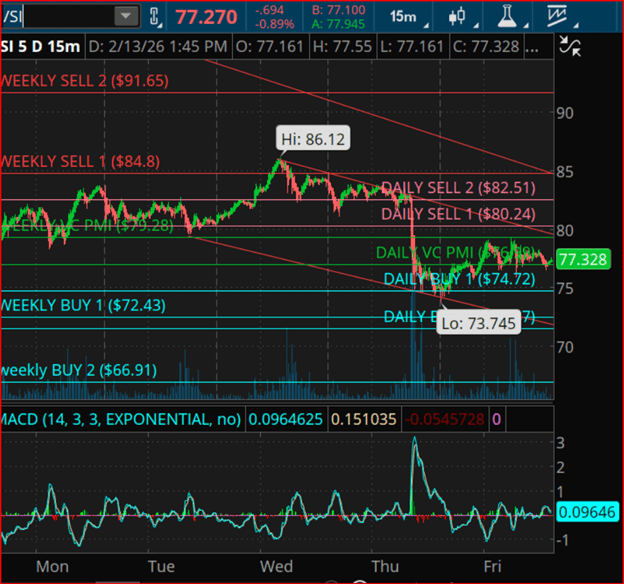
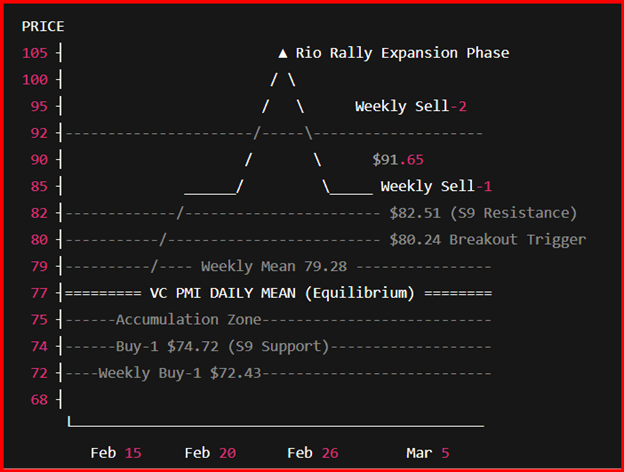
Silver futures remain confined within a clearly defined mean-reversion framework, anchored around the VC PMI equilibrium in the 76–77 range. This period of consolidation signals a transitional stage after the post–Chinese New Year liquidity reset and is laying the groundwork for the expected Rio Rally phase in the precious metals market.
From a seasonal standpoint, the Chinese New Year period typically brings short-term volatility and reduced institutional participation. As the holiday ends and Asian markets resume full operations, liquidity and physical demand tend to rebound. This shift often signals the onset of the Rio Rally — a cyclical upswing that usually begins in late February or early March and can persist through the remainder of the year. The current corrective setup aligns with this historical tendency of accumulation preceding expansion.
Time-cycle analysis highlights several high-probability inflection periods. The first key decision window falls between February 15–18, when price action is expected to define near-term direction around the VC PMI equilibrium. Sustained acceptance above the mean would indicate accumulation and bullish continuation, while rejection below it would open the door to a deeper corrective move toward support levels.
The second cycle window, February 20–24, serves as a confirmation phase. When prices remain above the weekly mean around 79.28 during this period, the market often extends toward the Weekly Sell-1 and Sell-2 objectives at 84.80 and 91.65. Historically, this window has signaled the ignition stage of the Rio Rally, as institutional capital returns following the post-holiday liquidity reset.
A third and broader expansion window unfolds between February 26 and March 5, coinciding with the March futures delivery cycle. This timeframe carries the strongest probability for a breakout and sustained directional move. A decisive close above 80.24 during this phase would trigger upside expansion toward 82.51, 84.80, and potentially 91.65 as momentum builds.
Within the VC PMI framework, support at 74.72 (Daily Buy-1) and 72.43 (Weekly Buy-1) marks high-probability accumulation zones if retested. These levels align with Square-of-9 geometric support angles and outline the final corrective range before a broader advance. On the upside, resistance at 80.24 and 82.51 corresponds with descending Square-of-9 angles and functions as breakout thresholds.
As the market moves beyond the Chinese New Year cycle and into the Rio Rally window, silver is approaching a pivotal time-cycle juncture. Sustained trade above the VC PMI equilibrium and a breakout through 80.24 would validate the start of the Rio Rally expansion phase into March and potentially beyond.
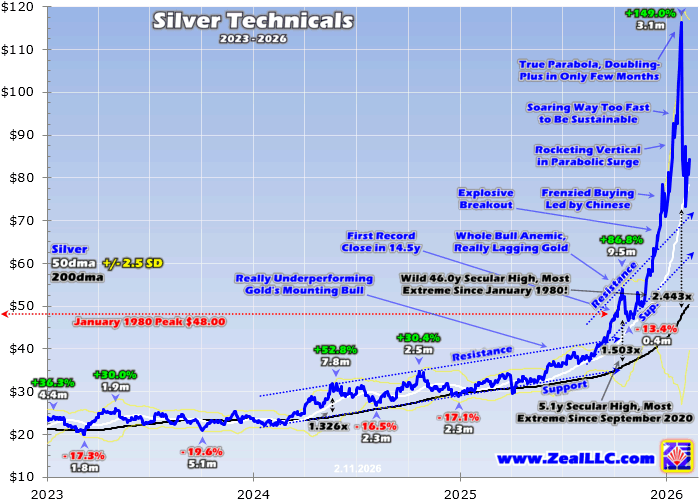
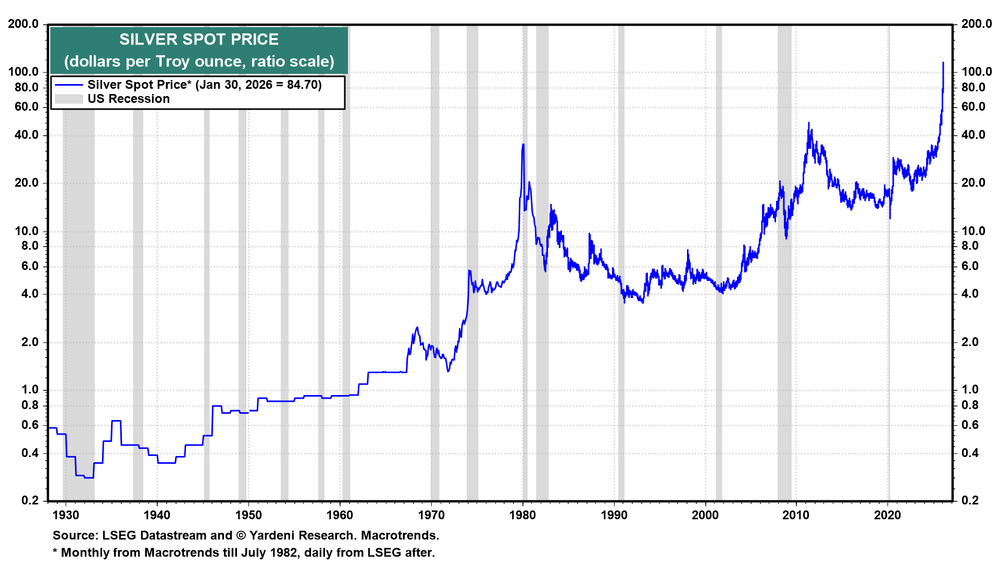
After surging in a classic speculative frenzy, silver went parabolic before collapsing in dramatic fashion. In recent weeks it has suffered some of its largest daily losses on record, echoing past episodes when extreme tops unraveled into violent crashes. Historically, such vertical “moonshots” have been followed by swift, symmetrical selloffs that wipe out a large share of prior gains—suggesting the current downturn may not yet be finished.
Silver has long attracted an intensely bullish following, especially during explosive rallies. But like all markets, its powerful upside extremes inevitably give way to sharp reversals. In mid-January, warnings emerged that silver had reached dangerously overbought levels not seen since the aftermath of the early 1980 bubble. Back then, prices plunged more than 75% within months and failed to sustainably exceed that peak for decades—underscoring the risks of vertical blow-offs.
From late October to late January, silver soared an extraordinary 149% in just over three months, logging numerous record closes. By some technical measures—such as its distance above the 200-day moving average—it reached historically rare territory, ranking among the most overbought readings in more than half a century. Comparable extremes were last seen in January 1980, during the infamous silver bubble.
Although silver often magnifies gold’s moves and has delivered strong long-term gains since the modern precious metals era began in 1971, its volatility cuts both ways. The same momentum and herd enthusiasm that fuel breathtaking advances tend to necessitate equally forceful corrections. This latest crash, following a surge to bubble-like extremes, has once again demonstrated just how unforgiving those reversals can be.
On January 30, silver plunged an extraordinary 27.5% in a single session—qualifying as a true crash by stock-market standards and marking its second-worst daily drop since 1971, just behind a 30.8% collapse in March 1980. The trigger was a sharp 10.3% fall in gold, driven largely by heavy Chinese selling, with silver amplifying that move roughly 2.7 times—consistent with its historical tendency to magnify gold’s swings. More steep losses followed, including another 16% plunge, creating a rare cluster of crash-grade declines reminiscent of the aftermath of the 1980 bubble.
While today’s rally into January 2026 was extreme—silver soared 149% in just over three months and reached one of the most overbought readings in more than five decades—it still fell short of the blow-off top seen in 1980. Back then, silver ultimately cratered nearly 77% in just over two months. Although a repeat of that magnitude appears unlikely, the recent 36.9% drop in only six trading days may not be sufficient to fully unwind the speculative excess. Simply returning to pre-mania levels would require far deeper losses.
Historical precedent suggests silver’s largest crash days rarely mark final bottoms. Except for a brief climax in March 1980, most 10%+ down days since 1971 have occurred early or mid-way through major selloffs, not at their end. Episodes in 2006, 2008, 2011, 2013, and 2020 all saw further grinding declines after dramatic crash sessions. Sharp bounces often follow panic selling, but sustained weakness is typically needed to shift herd psychology from greed to fear.
In speculative manias, fundamentals play little role in driving parabolic advances or subsequent collapses. Supply and demand rarely change fast enough to justify such extremes; sentiment and momentum dominate. Arguments about structural demand—such as AI-related usage—cannot rationalize silver doubling in a few months. That surge was largely fueled by speculative fervor, especially heavy Chinese buying, which has now reversed.
The broader lesson is that silver’s recent crash likely marks the early stages of a deeper rebalancing rather than its conclusion. After reaching near half-century overbought extremes, a proportionally large and sustained correction may be required to normalize sentiment. Historically, silver has tended to grind considerably lower after initial crash days, suggesting this reckoning may still have further to run.
Gold and silver edged higher in early Asian trading Wednesday after weak U.S. retail sales fueled expectations of a slowing economy, with investors awaiting payrolls data for clearer direction.
Despite the gains, precious metals remained volatile after retreating from record highs in late January, and have struggled to rebound. A softer dollar and weak U.S. data provided only modest support, while Middle East tensions sustained some safe-haven demand.
Spot gold rose 0.3% to $5,038.21 an ounce and April futures gained 0.6% to $5,061.45, still roughly $600 below recent peaks. Spot silver climbed 0.9% to $81.5135, and platinum added 0.9% to $2,105.86.
Metals rise following weak U.S. retail sales data.
Precious metals posted modest losses on Tuesday before rebounding Wednesday after December U.S. retail sales came in weaker than expected.
The softer data signaled cooling consumer spending amid persistent inflation and labor market pressures, raising concerns about the economic outlook. Expectations that the Federal Reserve may cut interest rates further this year weighed on Treasury yields and kept the dollar subdued, lending support to metal prices.
Investors are now focused on the upcoming nonfarm payrolls report for clearer signals on the economy. Signs of continued labor market weakness could strengthen bets on rate cuts, which typically favor non-yielding assets like gold.
However, uncertainty over U.S. monetary policy persists, particularly after President Donald Trump nominated Kevin Warsh as the next Fed chair. Warsh is seen as less dovish, a perception that has pressured metal markets since late January.
Gold prices slipped in early Asian trading on Tuesday, pulling back from strong gains in the previous session as investors turned cautious ahead of a series of important U.S. economic data releases this week. Silver and platinum also moved lower, despite some limited support from an overnight dip in the dollar, which later showed signs of recovery in Asian hours.
Spot gold declined 0.8% to $5,016.28 an ounce, while April gold futures fell 0.8% to $5,041.60 an ounce. Spot silver dropped 2.4% to $81.29 an ounce, and spot platinum slid 2% to $2,081.71 an ounce.
Precious metals have seen sharp volatility over the past week, with profit-taking and stretched positioning driving prices down from record highs. Markets have also been unsettled by uncertainty around U.S. monetary policy, particularly ahead of a potential leadership change at the Federal Reserve.
Attention this week is firmly on key U.S. economic indicators for signals on growth and the future path of interest rates. January nonfarm payrolls data is due on Wednesday, followed by consumer price index inflation data on Friday, both of which are critical inputs for the Fed given its focus on inflation and labor market conditions.
Investors are also assessing the potential policy direction under Kevin Warsh, President Donald Trump’s nominee to succeed Jerome Powell as Fed chair when Powell’s term ends in May. Warsh is widely seen as less dovish, and his nomination triggered steep selloffs in metals markets that have yet to be fully reversed, with gold plunging from near-record highs around $5,600 an ounce and silver falling from above $120 an ounce.
HSBC Asset Management said gold and silver posted dramatic price swings in 2025, fueled by geopolitical risks and worries about the Federal Reserve’s independence, before evolving into a retail-driven speculative phase. Analysts caution that leveraged selling could increase their correlation with equities, but note that central bank de-dollarisation efforts and crisis-related demand continue to support the long-term structural case for precious metals.
Safe-haven demand weighed against speculative flows
“This year’s moves in gold and silver have been extraordinary. Sparked by geopolitical tensions and concerns over the Federal Reserve’s independence, the 2025 rally morphed into a retail-driven speculative surge, making a correction increasingly probable.
So where does that leave investors who rely on gold as a portfolio diversifier? Although retail inflows lifted returns, they also brought equity-like volatility — at odds with gold’s traditional safe-haven role.
That said, recent turbulence shows that no safe haven is perfect, reinforcing the case for ‘diversifying the diversifiers’: taking an active, multi-asset approach to seek uncorrelated returns across a wide range of assets.”
Macquarie has updated its 2026 outlook for gold and silver, pointing to extreme volatility and recent geopolitical and policy-driven shocks as the main catalysts.
Strategist Peter Taylor noted that the bank had previously flagged the risk of gold reaching $5,000 per ounce amid concerns surrounding the Federal Reserve chair—a scenario that ultimately materialized. He also warned that silver was vulnerable to a sharp pullback, given its tendency to gap lower.
Macquarie raised its average gold price forecast for the first quarter of 2026 to $4,590 per ounce from $4,300, while its second-quarter estimate was lifted to $4,300 from $4,200. The bank also increased its full-year 2026 gold forecast to $4,323 per ounce, up from $4,225.
For silver, the Q1 target was raised sharply to $75 from $55, with the 2026 average forecast increased to $62 from $57.
Taylor emphasized that market conditions in January were exceptionally volatile, citing events such as threats of a criminal indictment against the Fed chair by the U.S. Department of Justice, the arrest and extradition of Venezuela’s Maduro, renewed focus on Greenland alongside potential tariffs on some NATO countries, and a buildup of military forces around Iran.
He added that while commodities broadly delivered strong gains, price movements were often detached from underlying fundamentals.
“Overall, this resulted in one of the strongest monthly performances for the commodities complex in recent history,” Taylor said.
Macquarie said it is holding off on revising longer-term forecasts for gold and silver, pointing to the ongoing disconnect between fundamentals and the unusually high volatility in precious metals markets.
Silver prices slipped to around $71.90 during the Asian session on Friday, pressured by profit-taking and easing geopolitical tensions that reduced demand for safe-haven assets. Meanwhile, U.S. initial jobless claims rose more than expected last week, coming in above market forecasts.
Silver prices (XAG/USD) slid to around $71.90 during Asian trading on Friday, marking their lowest level since January 2, as the metal extended recent losses amid easing geopolitical tensions and profit-taking. Market participants are closely watching scheduled U.S.–Iran talks later in the day for further cues.
Diminishing tensions between Washington and Tehran have weighed on safe-haven demand for precious metals. Iran has signaled it wants discussions to center on its long-running nuclear dispute with Western powers, while the U.S. is pushing to broaden the agenda to include Iran’s ballistic missile program, its alleged support for armed groups in the Middle East, and its human rights record.
Analysts note that recent price action has been driven largely by speculative flows, leveraged positioning, and options-related trading rather than underlying physical demand. Sunil Garg, managing director at Lighthouse Canton, said a substantial buildup of speculative positions has yet to be fully unwound.
Meanwhile, signs of softening in the U.S. labor market could limit further downside by pressuring the U.S. dollar and lending some support to dollar-denominated commodities. Data from the U.S. Bureau of Labor Statistics showed job openings unexpectedly fell in December to their lowest level since 2020, while layoffs increased. In addition, applications for unemployment benefits rose more than anticipated last week.
Gold and silver prices declined further in early Asian trading on Friday, extending steep losses from the previous session as profit-taking, easing geopolitical risks, and a stronger U.S. dollar continued to weigh on the metals complex. Silver remained the weakest performer after plunging around 15% on Thursday, while gold was trading nearly $1,000 per ounce below the record high reached last week.
Spot gold slipped 0.6% to $4,751.13 an ounce by 19:56 ET (00:56 GMT), while April gold futures dropped 2.5% to $4,766.11. Spot silver fell 2.2% to $69.383 per ounce, although it stayed above Thursday’s lows near $63, while silver futures tumbled 8.1% to $70.378.
OCBC analysts noted that the $70–$90 range has emerged as a key stabilization zone for silver, warning that a sustained break below this level could open the door to a deeper correction toward the $58–$60 area. They added, however, that holding within this range could allow bullish momentum to rebuild over time.
Losses extended across the broader precious metals space, with spot platinum sliding 7.2% to $1,853.81 an ounce. Metal markets have been under sustained pressure since last week, initially triggered by U.S. President Donald Trump’s nomination of Kevin Warsh to succeed Jerome Powell as Federal Reserve chair. Warsh has been perceived as less dovish, fueling a rally in the dollar that has weighed heavily on metals.
The U.S. currency was on track for its strongest weekly performance since early October, with softer labor market data failing to curb its advance. Meanwhile, easing tensions between the U.S. and Iran also dampened safe-haven demand for gold and silver, as the two sides were set to hold talks in Oman later in the day.
Silver sold off sharply after Kevin Warsh’s nomination to the Fed caught investors off guard who had been anticipating a more dovish pivot. The metal remains under pressure from margin increases, elevated physical delivery requirements, and aggressive short positioning by Chinese traders. While long-term fundamentals remain constructive, prices are still range-bound as the market waits for clearer macro and technical signals.
The steep decline in silver toward the end of last week can reasonably be characterized as a crash, triggered primarily by the announcement of Kevin Warsh’s nomination to lead the Federal Reserve.
Prior to the news, markets had been positioned for a notably dovish appointment, an expectation shaped by President Donald Trump’s repeated calls for a weaker U.S. dollar and faster interest-rate cuts. Warsh’s nomination caught investors off guard, forcing a rapid reassessment of monetary policy expectations.
Even so, uncertainty remains around how the incoming Fed chair would ultimately steer the central bank.
At the same time, broader commodity markets have struggled to regain traction. Despite several rebound attempts, prices have failed to establish sustained upside momentum, leaving commodities—silver included—likely confined to a period of sideways consolidation for now.
Investors Demand Physical Deliveries
Beyond monetary policy concerns, silver prices are facing additional pressure following the CME Group’s decision to raise margin requirements for gold and silver. The higher margins have forced some leveraged investors to unwind long positions, intensifying selling pressure.
At the same time, a growing number of futures contracts are moving toward physical delivery rather than being rolled forward. Given the current supply tightness, this dynamic is, for now, benefiting sellers more than buyers.
Activity out of China has also drawn attention. Zhongcai Futures reportedly established a sizable short position in silver—estimated at roughly $1.5 billion—and appears to have profited significantly from the recent decline.
With the Lunar New Year holiday ending and the Shanghai Stock Exchange reopening, market participants will be closely monitoring how Asian demand evolves.
Overall, the recent move appears to be a corrective pullback after metals prices advanced too rapidly over a short period. While the near-term retracement has weighed on sentiment, it does little to alter the longer-term outlook. From a fundamental perspective, the case for higher prices remains intact, supported by constrained supply and steadily rising industrial demand.
Investors will also be watching Kevin Warsh closely, as any public remarks could provide clearer insight into his economic views and expectations for the interest-rate path in the months ahead.
Technical View on Silver
Early in the week, demand showed signs of returning as investors stepped in to buy the dip. However, the rebound proved short-lived, with a fresh wave of selling reversing the recovery. For now, prices are consolidating within a range of roughly $74 to $92 per ounce.
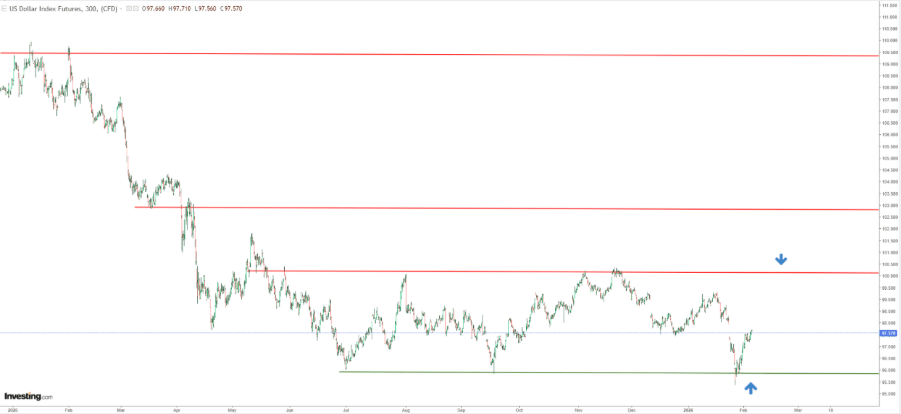
By the end of the week, prices are likely to stay confined within this range, provided U.S. labor market data does not deliver any major surprises. From a technical standpoint, the market appears to be in wait-and-see mode, looking for a decisive breakout to determine the next directional move. Meanwhile, the U.S. Dollar Index has once again held key support near the 96 level, which also represents its lows for the year.
If buyers are able to extend the rebound, the next major hurdle sits near the 100 resistance level. A decisive break above that area could pave the way for a move toward 103.
On the downside, a drop below 96 on the U.S. Dollar Index would be a clear signal that the broader downtrend remains intact and is likely to persist.
Silver prices fell sharply during Asian trading on Thursday, dragging the broader precious metals complex lower as renewed selling pressure erased most of this week’s brief rebound.
Spot silver plunged as much as 16.7% to $73.5565 an ounce, moving back toward the lows seen after last week’s selloff, while March silver futures slid more than 10% to $73.383 per ounce. The sudden drop unfolded during the Asian session and coincided with a modest rise in the U.S. dollar.
According to Chris Weston, head of research at Pepperstone, the selloff originated in China, beginning with a decline in Shanghai silver futures before spreading to CME futures and spot markets.
Precious metals have been under pressure from a stronger dollar over the past week, as the greenback rebounded from near four-year lows after markets interpreted President Donald Trump’s nominee for the next Federal Reserve Chair, Kevin Warsh, as less dovish than expected. This sentiment has continued to weigh on metal prices.
Meanwhile, traders remained broadly positioned in favor of the dollar ahead of key European central bank meetings on Thursday and the release of U.S. nonfarm payrolls data on Friday.
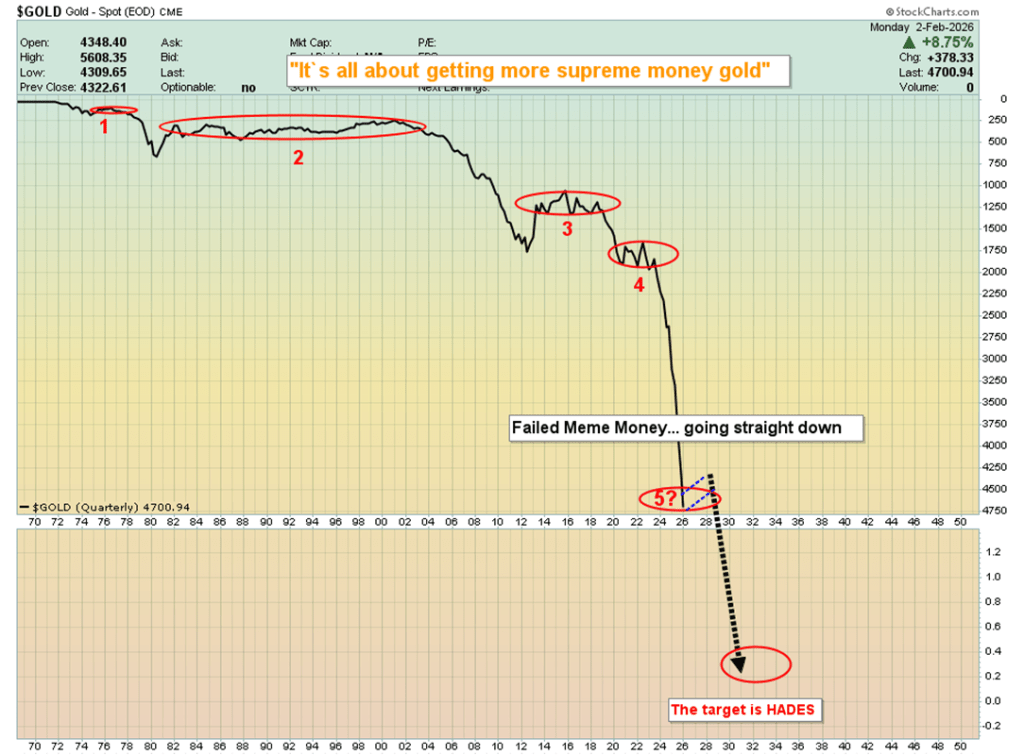
The mainstream narrative claims that a new Fed chair will safeguard the central bank’s independence from U.S. government influence—and that this alone justifies a $1,200/oz drop in gold and a $50 collapse in silver.
Put simply, that narrative is complete nonsense.
Fiat currency is best thought of as meme—or even junk—money, and despite its obvious flaws, it can still enjoy periodic rallies against what many see as the ultimate form of money: gold. These countertrend moves typically emerge during bouts of speculative excess, much like the frothy conditions that have dominated markets over the past couple of months.
From a fundamental standpoint, the gold bull market remains fully intact. Billions of gold-focused savers across China and India—along with a smaller group of informed Western investors—do not rely on central banks for validation. Their priority is building long-term wealth in gold, not accumulating ever more fiat currency and debt.
In the context of this broader bull cycle, it makes little difference who occupies the Fed chair. What matters is whether gold is attractively priced. When it is, prudent savers see it as an opportunity to accumulate more, regardless of short-term fiat-driven narratives.
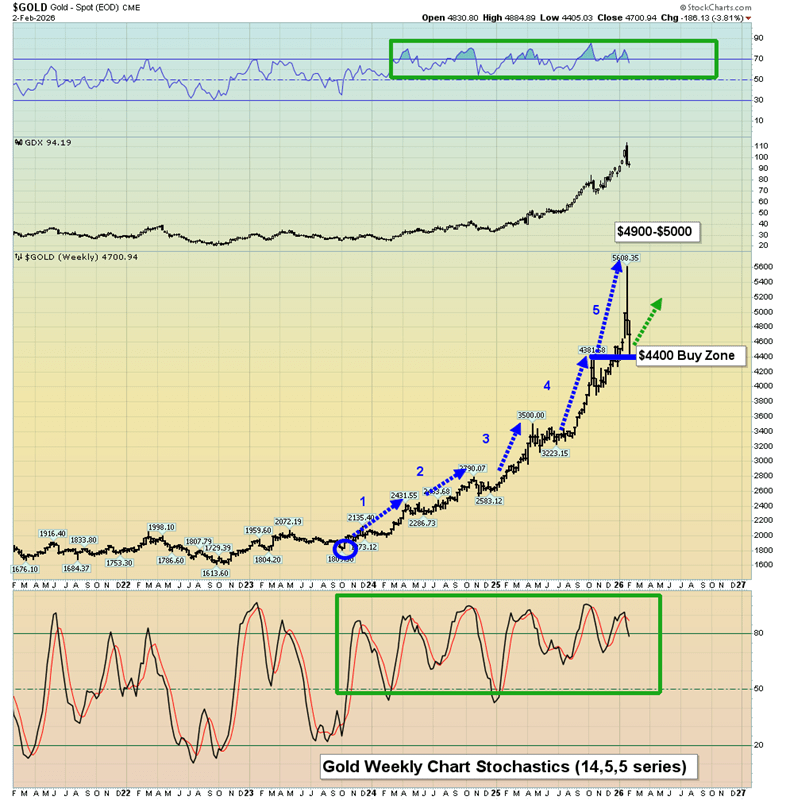
The long-awaited “exciting buy zone” has finally come into play. Gold investors were encouraged to prepare for a meaningful dip into the $4,400 area, and that discounted opportunity has now materialized.
Sustainable wealth building is not about predicting prices, but about preparing for unexpected moves. This pullback unfolded over just a few days, leaving unprepared investors confused and still focused on guessing what happens next.
The key development now is that the $5,600 region has emerged as a major accumulation zone on any future pullback. Gold investors should already be positioning themselves to take advantage of that opportunity if and when it presents itself.
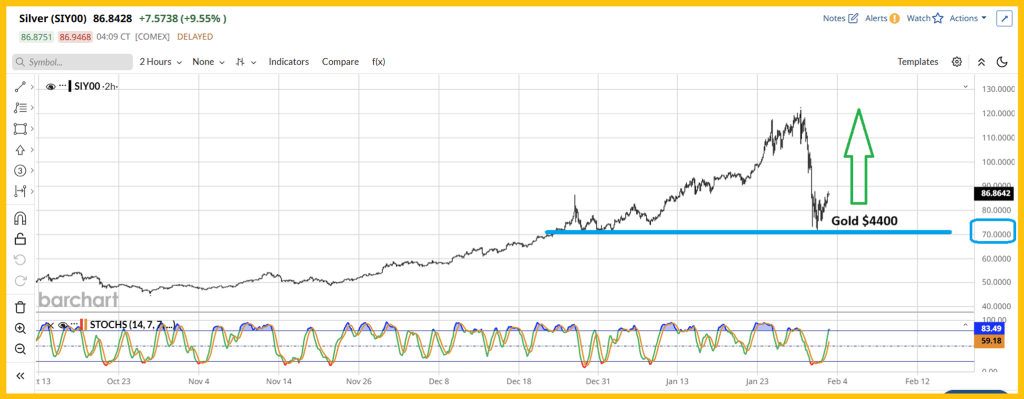
As for silver, the recent price sell-off was “super-sized,” driven by large and heavily leveraged bets against fiat currencies. That decline ultimately found support at the $70 buy zone, aligning perfectly with gold’s move into the $4,400 area.
Gold remains the undisputed leader of the precious metals complex. If silver investors and mining-stock enthusiasts take their cues from gold bullion, they position themselves to build substantial and durable wealth. The most likely near-term path for silver is a broad trading range between $70 and $120, followed by a powerful upside breakout that could propel prices toward the next target zone of $170–$200.
Over the longer term, silver has the potential to trade well above $1,000, largely because governments worldwide—both in the East and the West—continue to cling to fiat currencies and debt rather than returning to sound money anchored in gold.
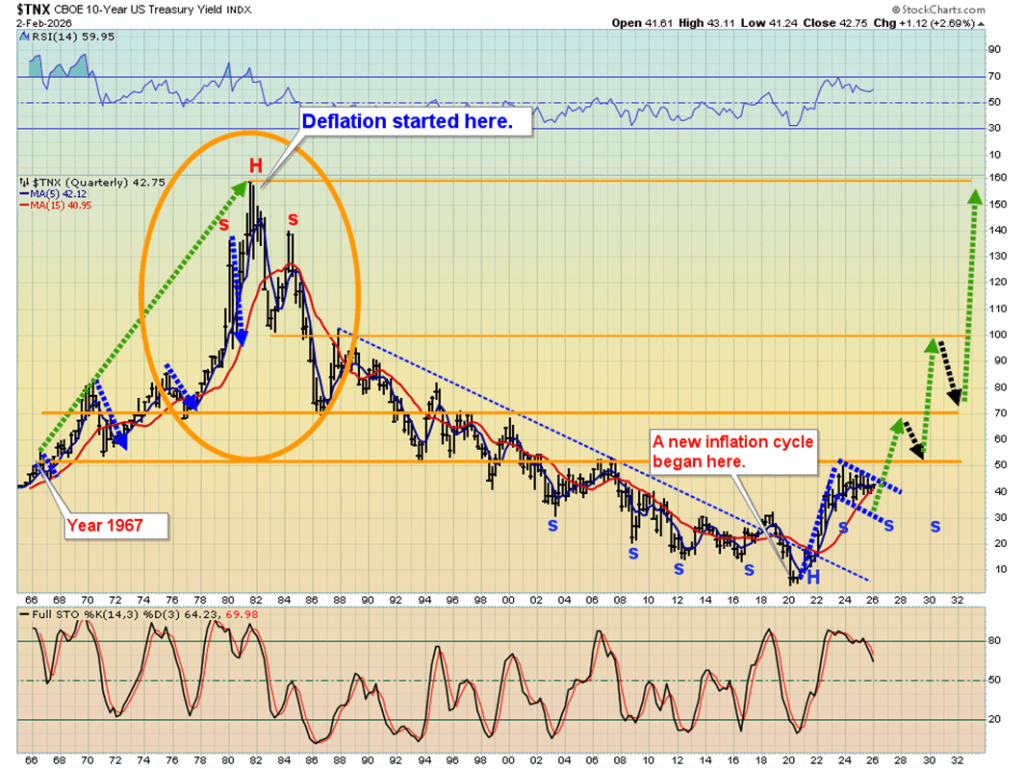
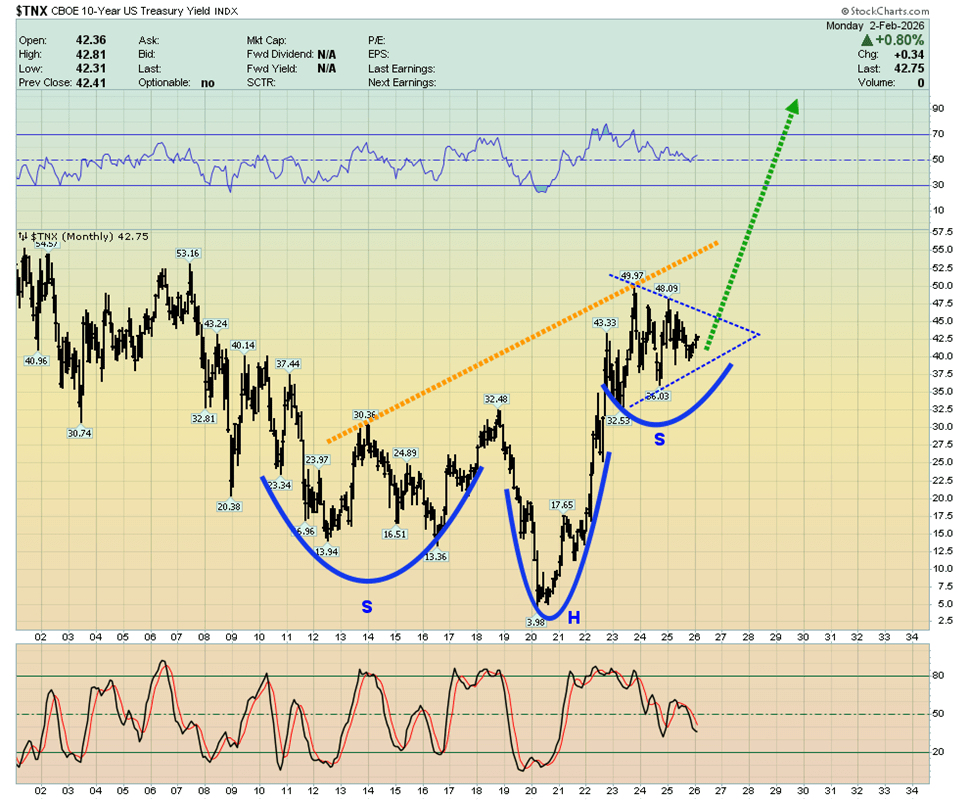
A new 40-year inflation cycle began in 2020 and is unlikely to end until U.S. interest rates reach record highs. Unlike the cycle’s conclusion in 1980, however, elevated rates this time are unlikely to curb inflation, as it is being driven by ongoing government policies rather than purely monetary conditions.
Another perspective on U.S. rates: the incoming Fed chair is more likely to lean toward fiscal restraint on a debt-addicted U.S. government than to dispense easy-money policies of QE and rate cuts. Such a stance would have implications for long-term sovereign yields worldwide, and global money managers are likely to continue shifting capital into gold as a strategic response.
As interest rates continue their relentless climb in the years ahead, governments will inevitably confront their “Queen Gold maker.” They will be forced to begin replacing fragile fiat currencies with gold—or face effective financial ruin.
As for robots, they will simply become another cost burden for citizens already trapped in stagflation. As automation expands rapidly and robot populations eventually outnumber humans, workers will be left competing for a shrinking pool of jobs. Confronted with government-driven stagflation and lacking the protection of gold savings, many will endure severe financial stress—conditions that would be further worsened by a stock market crash.
As for the miners, they too presented exceptional buying opportunities when gold dipped to $4,400. The CDNX is now starting to emerge from a decade-long base, with price action that closely resembles gold’s breakout above $2,000. The initial rally may appear deceptive, but it is genuine—because this type of breakout unfolds as a process rather than a single, short-lived move. Notably, trading volumes across CDNX-listed stocks have surged, reinforcing the strength of the move.
While pockets of speculative excess briefly appeared in gold and silver bullion, such froth has been absent in the mining sector. Several silver explorers nearing production are projecting all-in sustaining costs well below $20, while gold explorers with large-scale projects are reporting AISC figures under $2,000. The conclusion is clear: junior gold and silver miners may represent the most undervalued segment in market history.
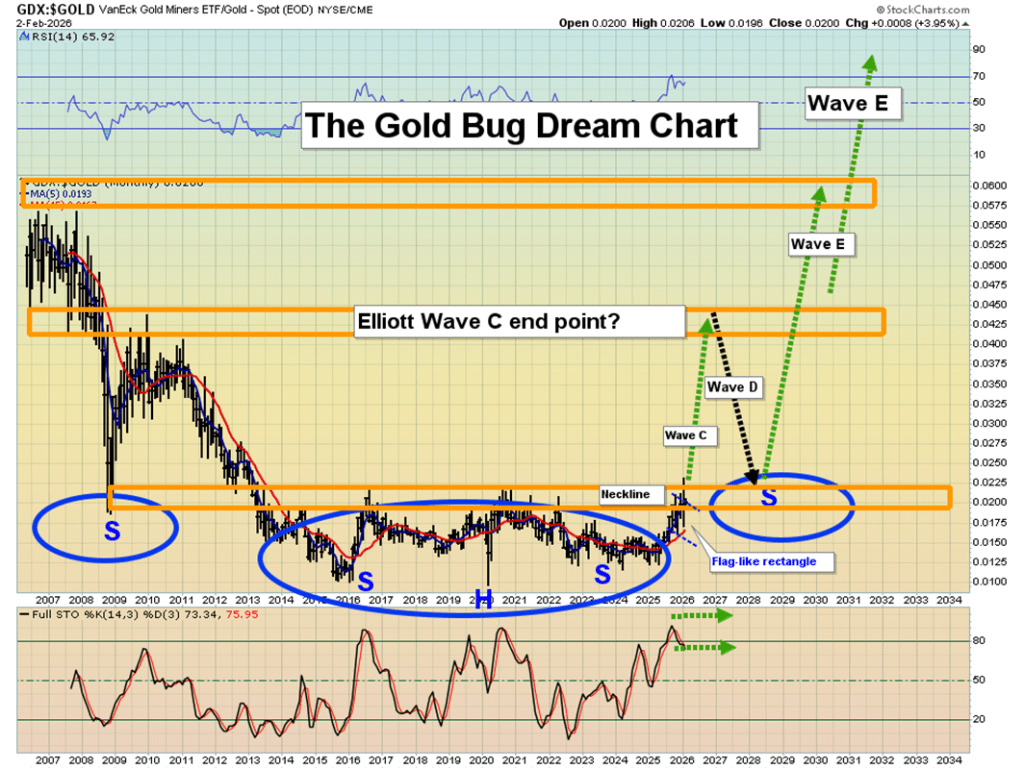
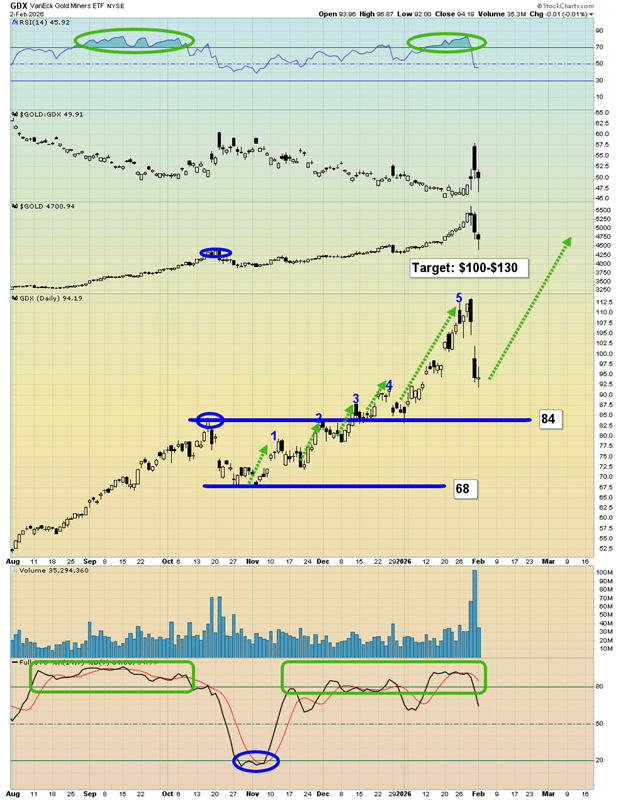
And what about the senior miners? The GDX versus gold chart is striking. Since the 2015 low—when the head of a massive inverse head-and-shoulders pattern began to form—I’ve been guiding investors through this setup. That structure points not merely to years, but potentially decades of strong performance for gold equities. In alignment with the CDNX-to-fiat picture, the breakout process is now underway.
The GDX daily chart delivers a real “wow factor.” The latest five-wave advance was remarkable—and signs suggest a new leg higher may already be unfolding. Notably, GDX’s recent pullback held well above its October highs, even as gold retraced back to that level. That kind of relative strength is a powerful signal that further upside is likely.
Even if gold consolidates between $5,600 and $4,400, and silver oscillates between $120 and $70, GDX and many of its underlying stocks could still push on to new highs. With 2026 marking the Chinese Year of the Fire Horse—symbolizing bold action and the fight for freedom—the question arises: are gold and silver equities poised for their own moment of liberation, breaking out to extraordinary new levels? The evidence suggests they are.
Silver prices climbed to around $87.60 during Wednesday’s Asian trading session.
However, shifting expectations surrounding the next Federal Reserve chair could limit further upside in the metal.
Demand for safe-haven assets strengthened after reports that the United States shot down an Iranian drone that was approaching an aircraft carrier.
Silver prices (XAG/USD) climbed to around $87.60 during Asian trading on Wednesday, rebounding after a historic correction last week as dip-buying activity returned to the market.
On Friday, U.S. President Donald Trump nominated Kevin Warsh to replace Jerome Powell as the next Chair of the Federal Reserve, with Warsh expected to assume the role when Powell’s term ends in May. Expectations that Trump’s nominee may favor keeping interest rates elevated to combat inflation have supported the U.S. dollar, potentially weighing on dollar-denominated commodities such as silver.
Precious metals have also faced pressure from margin hikes by the CME Group. Over the weekend, the exchange raised margin requirements for gold and silver, forcing many leveraged traders to liquidate positions to meet higher costs.
On the other hand, safe-haven demand has been underpinned by rising geopolitical risks and economic uncertainty. Reuters reported on Tuesday that the U.S. military shot down an Iranian drone that “aggressively” approached the Abraham Lincoln aircraft carrier in the Arabian Sea.
Separately, Iran requested that this week’s negotiations with the United States be held in Oman rather than Turkey and limited to bilateral discussions focused solely on nuclear issues. President Trump warned that with U.S. warships moving toward Iran, “bad things” could occur if an agreement is not reached.
Silver has climbed above $87.00 after rebounding from one-month lows below $72.00. Precious metals are rising on Tuesday as overall market sentiment improves, though XAG/USD bulls may face resistance in the $88.00–$90.00 zone.
Silver (XAG/USD) is posting modest gains on Tuesday, trading around $87.05 at the time of writing. The white metal has stabilized after plunging more than 30% over the previous two sessions, which pushed prices to one-month lows just below the $72.00 level.
In a departure from their typical behavior, precious metals are rebounding alongside an improvement in broader market sentiment. Optimism stemming from a trade agreement between the United States and India, along with reports of forthcoming nuclear talks with Iran, has lifted investor confidence and increased appetite for risk assets.
Technical analysis: XAG/USD faces immediate resistance at $88.00.
XAG/USD has recovered part of its recent losses, though technical indicators continue to signal a bearish bias. The Moving Average Convergence Divergence (MACD) remains below both the signal line and the zero level, even as the negative histogram narrows toward zero. Meanwhile, the Relative Strength Index (RSI) is ticking higher, suggesting a gradual easing of downside pressure, but it remains below the critical 50 threshold.
On the upside, the pair is expected to encounter resistance near Monday’s highs around the $88.00 mark. A sustained break above this level could shift attention toward the psychological $100.00 handle, followed by intraday resistance near $104.00.
On the downside, immediate support is located at the monthly low of $71.37. A break below this level would expose the early-December highs and mid-December lows clustered around the $60.00 area.
Although gold, silver, and platinum were the top-performing commodities over the past year, they came under pressure late last week.
Metals suffer a sharp pullback after hitting record highs.
Silver and gold suffered a sharp sell-off early Friday, dragging mining stocks and related ETFs lower. After an exceptional run in 2025, both metals have begun to give back part of their gains. Silver slid roughly 15%, falling back below the $100 level, while gold dropped about 7% and struggled to hold above $5,000. Weakness spread across the sector, with platinum and palladium also declining by around 14% and 12%, respectively.
Mining equities and ETFs came under heavy pressure. Producers such as Fresnillo, along with silver miners Endeavour and First Majestic, posted double-digit losses in pre-market trading. Silver-focused ETFs were hit even harder, with some falling as much as 25%.
Following last year’s explosive rally—when silver surged 150% and gold gained 65%—the market appears to be undergoing a correction. Overcrowded positioning, uncertainty surrounding the Federal Reserve’s policy outlook, and shifts in geopolitics and the U.S. dollar have all fueled the sell-off.
The move underscores that even traditional safe-haven assets are vulnerable to sharp volatility. When positioning becomes one-sided, even fundamentally strong markets can reverse quickly. Investors are now reassessing exposure, with some stepping in to buy the dip while others remain on the sidelines.
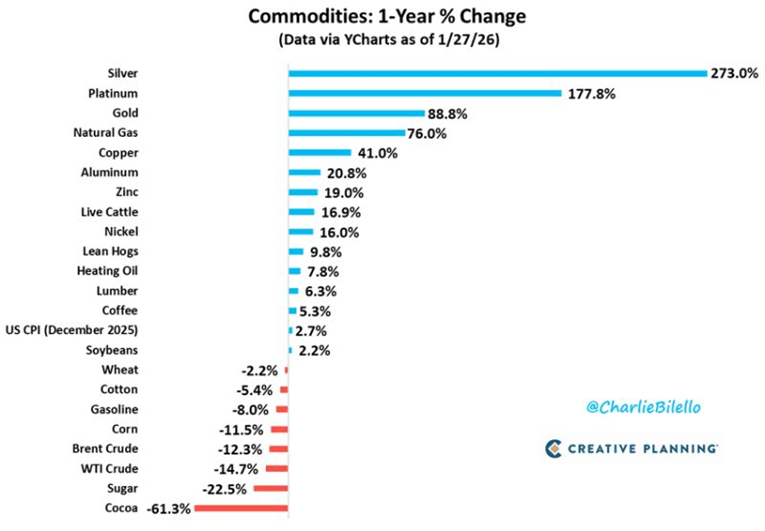
Top-Performing Commodities Over the Past Year
The three best performers are silver (+273%), platinum (+178%), and gold (+89%). These mark the strongest year-over-year gains for the metals since 1979–1980.
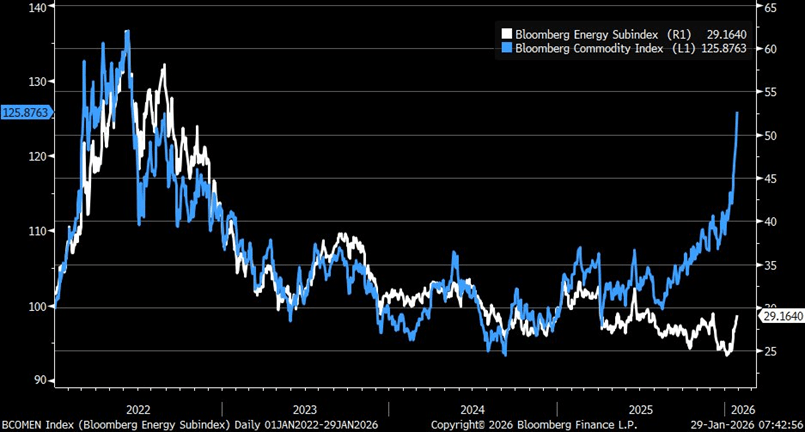
Can oil keep pace with the broader commodities rally?
The Bloomberg Commodity Index has surged, but the gains are not being driven by energy. Instead, strength is coming from other commodities, highlighting an unusual source of the rally.
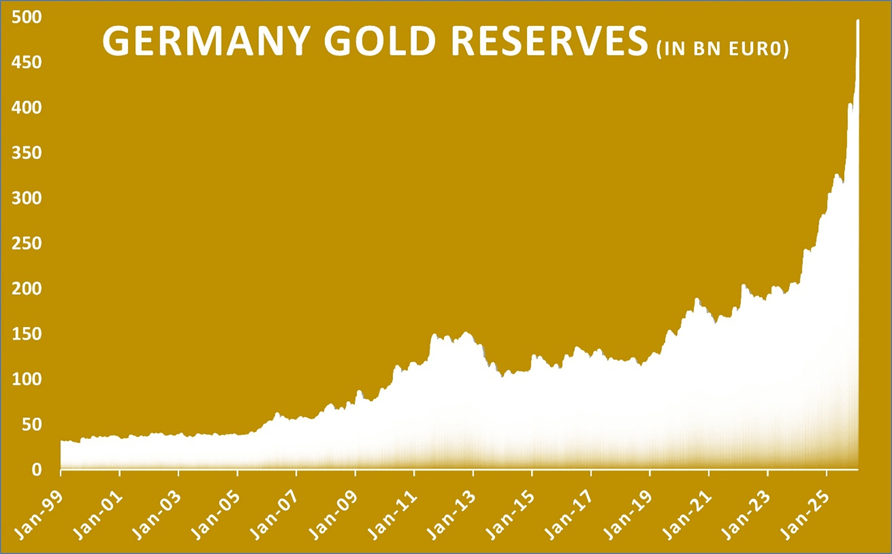
Germany’s gold reserves are valued at nearly €500 billion.
Germany’s gold reserves are now valued at €496 billion. The Bundesbank holds 3,352 tonnes in total, with more than 1,200 tonnes stored in New York and the rest kept in Frankfurt and London.
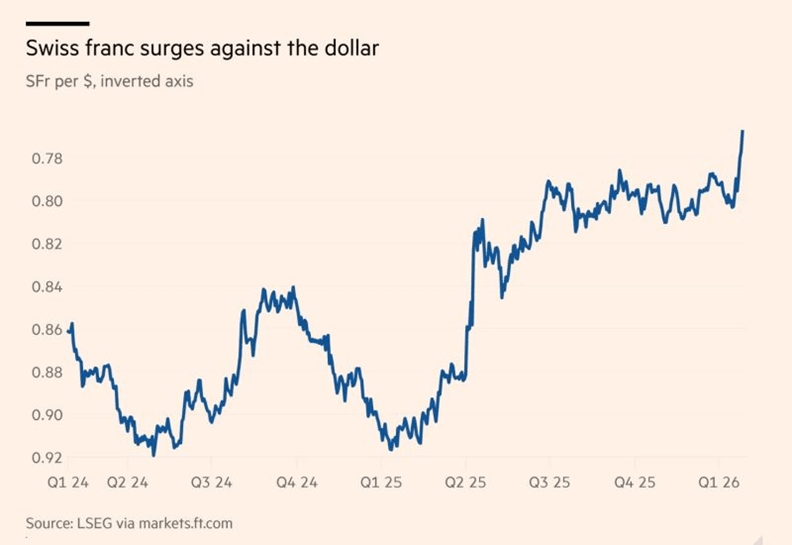
The Swiss franc strengthens against the U.S. dollar.
While market attention remains focused on the U.S. dollar and the yen, the Swiss franc has quietly climbed to its strongest level in more than a decade.
Here’s why the move matters globally:
The “safe-haven” appeal
Investors are gravitating toward stability. With gold pushing above $5,000 an ounce and political uncertainty weighing on major economies, the Swiss franc has reasserted itself as a preferred refuge. The currency is up about 3% so far this year, building on a strong 14% gain last year.
The Swiss National Bank’s policy challenge
Such strength is a double-edged sword. While it helps keep inflation exceptionally low—currently around 0.1%—it also increases pressure on Switzerland’s export-driven economy. This leaves the Swiss National Bank facing a difficult decision:
Cut interest rates? With rates already at 0%, a return to negative territory would be a step policymakers are reluctant to take.
Here is a refined paraphrase that flows naturally from the previous section:
Intervene? Direct action in currency markets risks accusations of manipulation and could spark diplomatic frictions.
The global backdrop
When the world’s primary reserve currency—the U.S. dollar—shows signs of instability, capital doesn’t disappear; it reallocates. Increasingly, those flows are moving toward perceived safe havens, with the Swiss franc emerging as a key beneficiary.
In an era of heightened market volatility, genuine stability has become one of the rarest—and most valuable—assets.
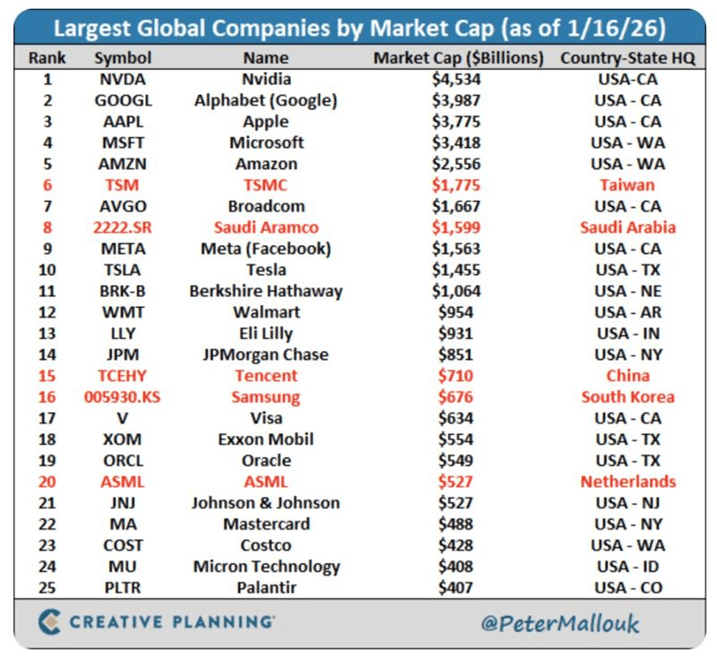
U.S. companies account for 20 of the world’s 25 largest market capitalizations.
The remaining five companies are based outside the U.S., with one each from Europe, China, Taiwan, South Korea, and Saudi Arabia.
Within the United States, California dominates with six of the world’s largest companies by market value. Texas and Washington follow with three each, while New York is home to two. Nebraska, Arkansas, Indiana, New Jersey, Idaho, and Colorado each host one of the top global firms.
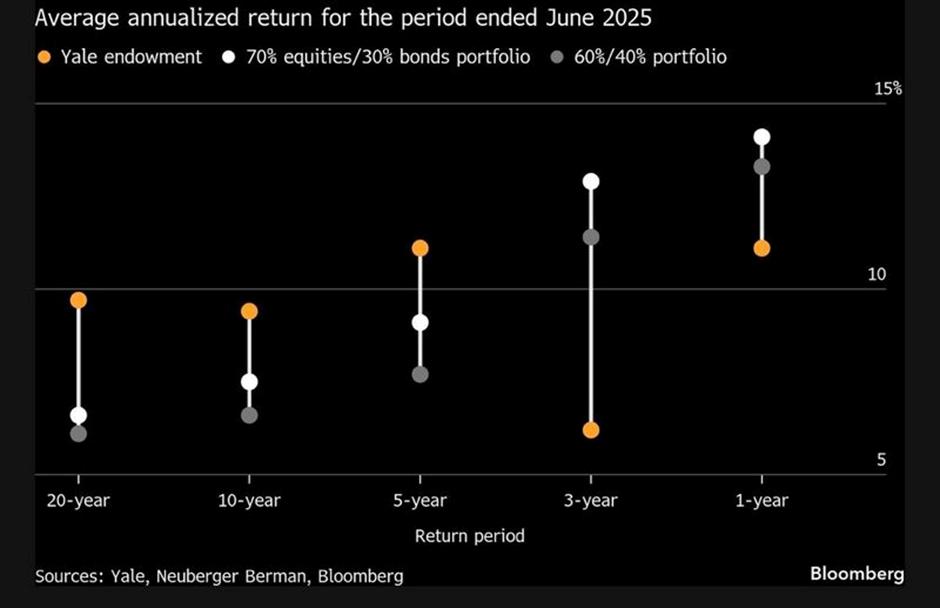
The endowment model faces mounting challenges.
For years, the endowment model—heavily tilted toward private assets—was held up as the gold standard for long-term investment success. Its track record was so compelling that institutions across the globe rushed to replicate it.
But every “secret sauce” loses its edge once it becomes common knowledge. As capital flooded into the same private markets, the once-distinct advantage began to erode.
Today, the space is increasingly crowded, and the classic endowment model is showing signs of strain. At the same time, more traditional portfolios with greater exposure to public markets are quietly regaining relevance.
The drivers are clear: too much money is chasing a limited pool of private opportunities, alpha in private equity is harder to extract, and liquid, public-market portfolios are proving more resilient than many expected.
This raises a critical question: is the era of private-heavy allocations coming to an end, or merely pausing? It may be time to revisit the “Yale model,” with a sharper focus on less congested private strategies and new sources of return—especially if the strong 60/40 performance of the past one and three years turns out to be more cyclical than enduring.
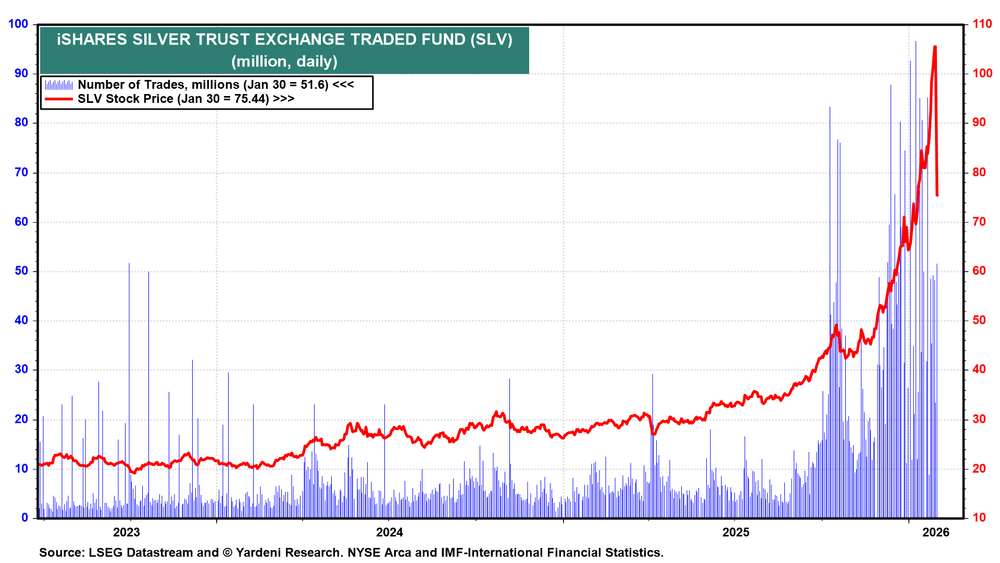
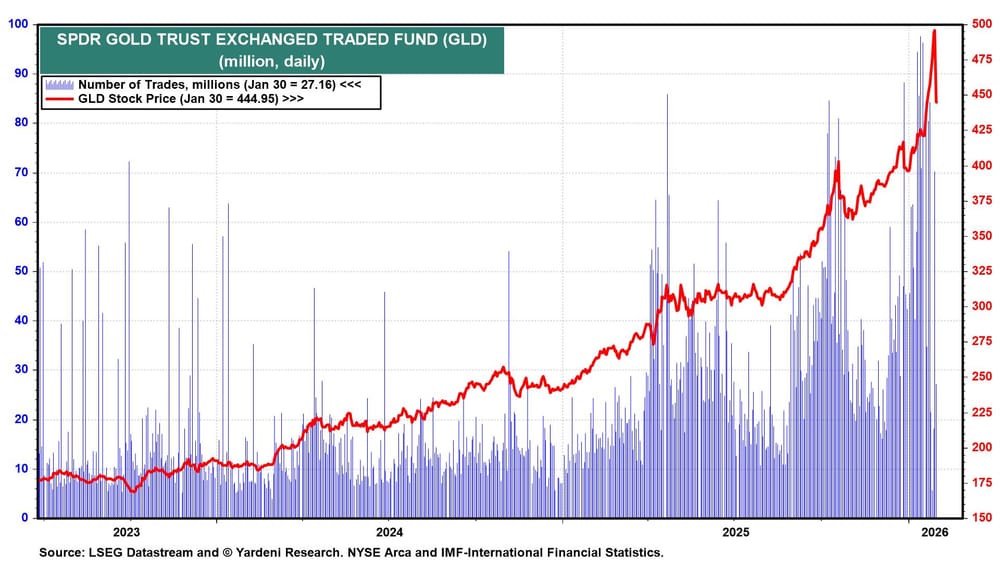
The Lone Ranger began as a radio series in 1933 and later ran as a television show for 21 years until 1954. The story follows the last surviving Texas Ranger, who is nursed back to health by Tonto, a Potawatomi tribesman. Together, they ride across the American West on their horses, Silver and Scout, fighting injustice while financing their mission through a silver mine that supplies both income and ammunition.
When the pair set off in pursuit of villains, the announcer famously cried, “Hi-Yo Silver, Away!” The show’s iconic theme music was written for the film The Lone Ranger and the City of Gold.
On Friday, however, silver traders were echoing a very different refrain: “Hi-No Silver, Away!” Silver led a broad selloff across precious metals and related ETFs. The SLV ETF plunged 28.5%, while GLD fell 10.3%. Despite the steep losses, trading volumes did not point to a full-blown panic in either fund.
Along with our colleague Michael Brush, we spent the morning reviewing the various explanations behind silver’s one-day bear market and gold’s sharp one-day correction. Early on Friday, the initial selloff may have been triggered by President Donald Trump’s nomination of Kevin Warsh to replace Jerome Powell as Federal Reserve chair. On the geopolitical side, reports that Iran is willing to negotiate with the U.S.—but only on terms Washington finds unacceptable—seem unlikely to have driven the rout.
Later in the day, at 2:00 p.m. EST, CME Group announced another increase in maintenance margin requirements—the second hike in three days—taking effect after the market close on Monday, February 2. Maintenance margins were raised to 8% from 6% for gold, to 15% from 11% for silver, to 15% from 12% for platinum, and to 16% from 14% for palladium. Margins on copper were also increased.
By announcing the margin increase ahead of Friday’s close, the CME effectively signaled to traders that any positions carried into the weekend would face substantially higher collateral requirements by Monday. This prompted many market participants to unwind positions in the final hours of Friday’s session, contributing to the sharp late-day acceleration in the price decline.
As a result, we discount the various conspiracy theories circulating in the market, including suggestions that the move marks the beginning of another Hunt Brothers–style silver crisis like March 27, 1980, when silver prices collapsed from about $21 to below $11 in a single day.
Notably, Warsh’s nomination should arguably have been supportive for precious metals, as he has favored boosting growth through lower interest rates and has downplayed the need for the Fed to be overly concerned about inflation at present.
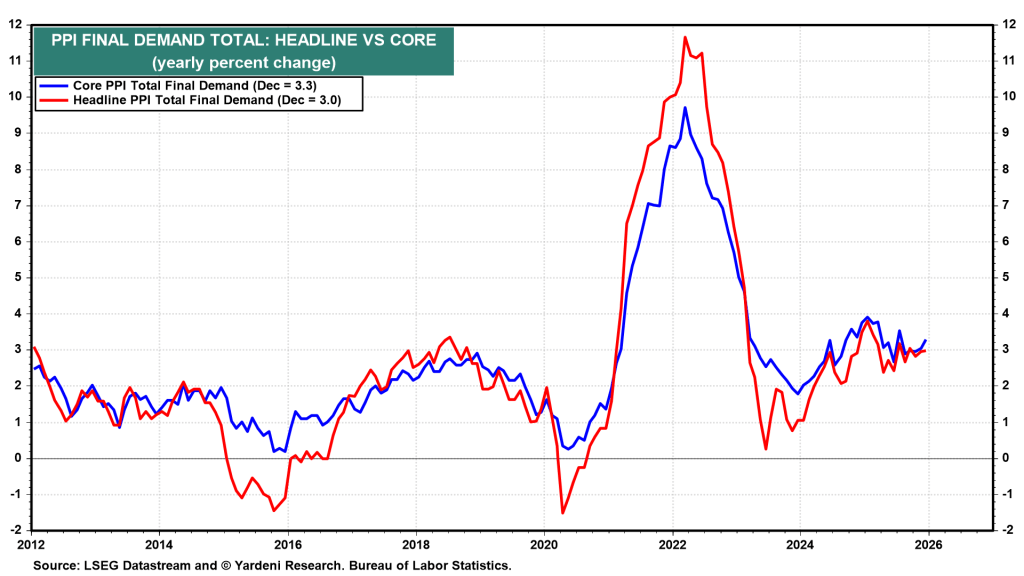
Friday’s December PPI report was also hotter than expected and, in theory, should have added to the bullish case for precious metals. Headline producer prices rose 0.5% month over month, while the core index increased 0.7%. On a year-over-year basis, headline and core PPI inflation climbed to 3.0% and 3.3%, respectively. The data suggest producers may be beginning to pass on higher costs from tariffs and a weaker currency further along the supply chain.
We asked Michael Brush for an update on insider buying activity, and he said: “It’s still early, but so far corporate executives and directors have shown little interest in buying the recent market weakness. Their cautious stance remains in place. Buying by investors classified as insiders due to large holdings—10% owners—has increased slightly, but this type of activity is generally less meaningful as a market signal.”
U.S. stock index futures edge lower as a sharp selloff in gold and silver weighs on investor sentiment ahead of a packed week of major corporate earnings and key economic releases. Bitcoin continues to slide after dropping below $80,000 over the weekend. Elsewhere, Oracle signals plans for fresh fundraising, while speculation over potential executive changes at Walt Disney grows ahead of its upcoming quarterly results.
Futures edge lower
U.S. equity index futures moved lower on Monday, pointing to a continuation of last session’s losses at the start of the new trading week.
As of 03:11 ET (08:11 GMT), Dow futures were down 323 points, or 0.7%, S&P 500 futures had declined 62 points, or 0.9%, and Nasdaq 100 futures were lower by 291 points, or 1.1%.
Market participants are closely watching a heavy slate of upcoming corporate earnings alongside a new monthly jobs report. Together, these releases could shed light on the health of the U.S. economy and test the resilience of a stock market rally now in its fourth year.
Beyond ongoing questions over the durability of the artificial intelligence-driven rally, investors are also weighing the implications of President Donald Trump’s nomination of Kevin Warsh as the next Federal Reserve Chair. If confirmed by the Senate, Warsh would bring his long-held calls for a shift in the monetary policy framework to the world’s most influential central bank.
Gold and silver extend their selloff
A sharp decline in both gold and silver, continuing the historic drop seen on Friday, weighed heavily on market sentiment—especially in Asia, where equities broadly fell.
Following a nearly 10% plunge late last week, spot gold fell another 4.9% to $4,626.80 per ounce by 03:27 ET, slipping well below the $5,000 mark it had just recently surpassed. Silver, which had benefited from speculative interest and industrial demand, also faced selling pressure but had somewhat stabilized around $79 an ounce as of 03:30 ET.
Analysts attribute the metals’ losses to a stronger U.S. dollar and widespread profit-taking after their significant rally in recent months.
Investors also showed concern about Kevin Warsh’s potentially hawkish stance in the long term. Although Warsh—formerly a Federal Reserve governor—has supported President Trump’s calls for sharply lower interest rates, he has been critical of the Fed’s asset purchase programs.
“Warsh is viewed as the most inflation-focused candidate for the Fed chair, reducing the chances of aggressive monetary easing. This sparked a wave of selling, with gold enduring its steepest decline in four decades,” ANZ analysts noted.
Bitcoin continues to decline
The risk-averse mood extended to cryptocurrencies, with Bitcoin dropping over 2% to $76,892.4. On Saturday, the leading digital currency fell below the $80,000 mark, continuing its decline from Friday. Some investors worried that Kevin Warsh might support shrinking the Federal Reserve’s balance sheet, which could reduce liquidity in the financial system.
Larger Fed balance sheets have historically supported cryptocurrencies by injecting cash into money markets, providing backing for riskier assets.
This latest slide marks another downturn for Bitcoin since reaching its all-time high last October. Once buoyed by optimism over increased cash flows and a friendlier regulatory environment under Trump, the token has now lost about one-third of its value.
With turmoil spreading across stocks, commodities, and crypto, Jonas Goltermann, Deputy Chief Markets Economist at Capital Economics, described the past few days as “unusually hectic […] for financial markets” in a recent note.
Oracle announces plans for new fundraising
On Sunday evening, Oracle Corporation announced plans to raise new capital in 2026 to support the expansion of its AI and cloud infrastructure amid rising demand for computing power.
The company aims to generate between $45 billion and $50 billion in gross proceeds during 2026, utilizing a mix of debt and equity financing.
About half of the funds will come from a combination of equity derivatives and common stock, according to a company statement.
Oracle plans to raise its debt funding through a single, one-time issuance of investment-grade senior unsecured bonds in early 2026, with no additional debt expected afterward.
Analysts at Vital Knowledge highlighted that roughly half of the total funding will come from equity-linked securities, including a $20 billion at-the-market (ATM) common equity program.
They noted, “Oracle’s $20 billion ATM offering is the first time a major tech company has been compelled to raise equity since the AI boom began. If this signals a shift toward greater fiscal caution in the industry, it could lead to a slower overall pace of spending.”
Disney set to release earnings
Walt Disney is set to release its earnings before the opening bell on Monday.
While the company’s continued focus on its streaming services, alongside its vital parks and studios divisions, will be closely watched, much of the attention may center on leadership succession.
According to the Wall Street Journal, Disney CEO Bob Iger has informed colleagues that he intends to step down and reduce his day-to-day involvement before his contract expires on December 31.
Board members are expected to convene soon to decide on Iger’s successor, with several media outlets naming Experiences division head Josh D’Amaro as the likely frontrunner.
Long EUR/USD after a daily close above 1.1866, resulting in a 0.24% loss.
Long Silver, which ended with a loss of 18.62%.
Long Gold after a daily close above $5,000, producing a 2.26% loss.
Taken together, these positions generated a total loss of 21.12%, or 7.04% per asset. While this was a sizable drawdown, the broader performance of my weekly forecasts over recent weeks remains positive, as earlier gains were exceptionally strong and more than offset this setback.
Key market data from last week:
U.S. Federal Reserve policy meeting: No surprises, with interest rates left unchanged.
U.S. Producer Price Index (PPI): The standout data release of the week. Inflation came in far hotter than expected, with headline PPI rising 0.5% month-on-month and core PPI increasing 0.7%, versus forecasts of just 0.2% for both. This reinforced a more hawkish Fed outlook, lifted the U.S. dollar, and accelerated the sharp reversal in Silver (and Gold). As a result, expectations for a second U.S. rate cut in 2026 were pushed back to October.
Bank of Canada policy meeting: No change to interest rates, as anticipated.
Australian CPI: Inflation exceeded expectations, with an annual rate of 3.8% versus 3.5% forecast, strengthening the case for possible RBA rate hikes and supporting the Australian dollar early in the week.
Canadian GDP: Slightly weaker than expected, showing zero month-on-month growth.
U.S. unemployment claims: In line with forecasts.
While PPI and Australian inflation influenced market moves, two broader developments likely had an even greater impact:
Federal Reserve leadership: President Trump announced his nominee for the next Fed Chair, Kevin Warsh. Although regarded as a hawk, Warsh is now thought to favor lower interest rates. The nomination contributed to the collapse of the Silver rally and provided additional support to the U.S. dollar.
Geopolitical tensions: The U.S. continued its military buildup near Iran, raising the risk of a wider regional conflict. Polymarket currently assigns a high probability to a U.S. strike on Iran in March, despite President Trump still referencing the possibility of a diplomatic agreement. These tensions appear to be supporting crude oil prices, with WTI crude reaching a new four-month high last week.
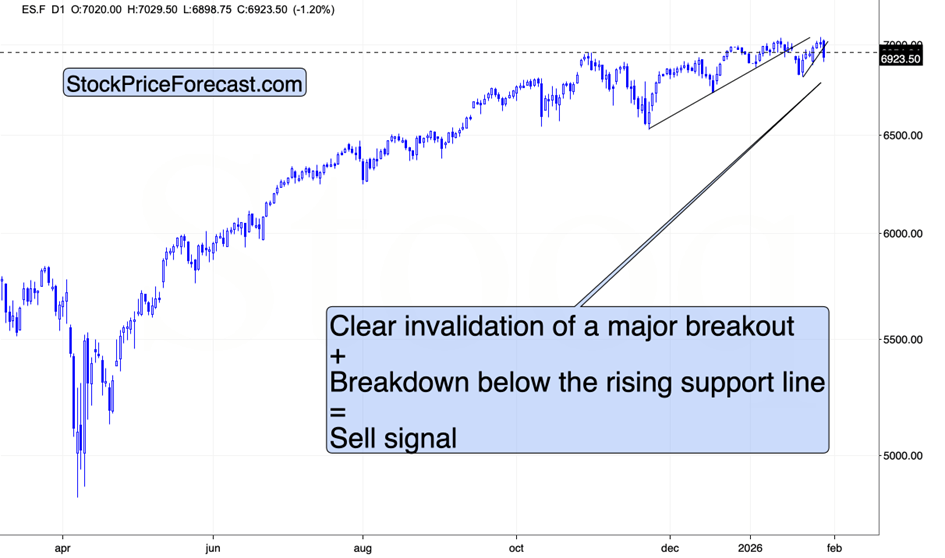
Meanwhile, the S&P 500 briefly pushed to a fresh record above 7,000. Although the index remains resilient, upside momentum is limited. In my view, a clearer resolution to U.S.–Iran tensions is needed before a more decisive directional move can develop.
The Week Ahead: 2nd – 6th February
The most significant data releases for the coming week, ranked by expected market impact, include:
U.S. Average Hourly Earnings and Non-Farm Payrolls
Preliminary University of Michigan Inflation Expectations
European Central Bank main refinancing rate decision and monetary policy statement
Bank of England official bank rate decision, voting breakdown, and monetary policy report
Reserve Bank of Australia cash rate decision, rate statement, and monetary policy statement
U.S. JOLTS job openings
Preliminary University of Michigan consumer sentiment
U.S. ISM services PMI
U.S. ISM manufacturing PMI
U.S. unemployment rate
New Zealand unemployment rate
Canadian unemployment rate
U.S. weekly unemployment claims
This will be a particularly busy and potentially market-moving week, with three major central banks delivering policy decisions. Please note that Friday is a public holiday in New Zealand, which may reduce liquidity in related markets.
Monthly Forecast February 2025
For the month of January 2026, I forecasted that the USD/JPY currency pair would rise in value. Unfortunately, this was a losing trade.
For the month of February, I forecast that the EUR/USD currency pair will rise in value.
Weekly Forecast 2nd February 2026
Last week, three currency crosses experienced unusually high volatility, prompting the following weekly trade forecasts:
Short NZD/JPY, which resulted in a 0.57% loss.
Short AUD/JPY, ending with a 0.32% loss.
Short NZD/CAD, producing a 0.39% loss.
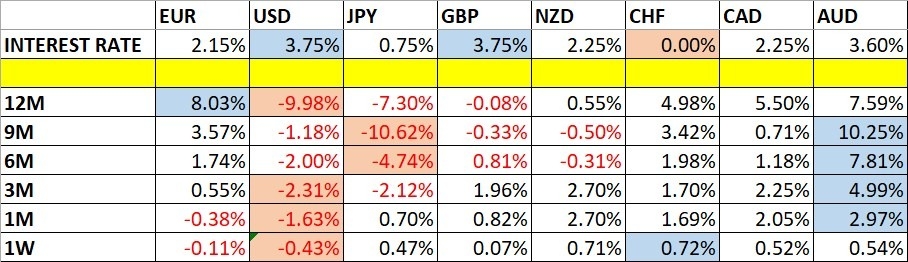
Overall, the Swiss franc and the New Zealand dollar emerged as the strongest major currencies of the week, while the U.S. dollar was the weakest. Market conditions were relatively subdued, with directional volatility dropping sharply—only 11% of major currency pairs and crosses moved by more than 1% over the week.
Technical Analysis
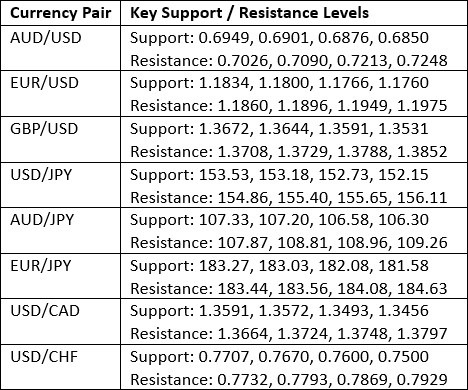
Key Support/Resistance Levels for Popular Pairs
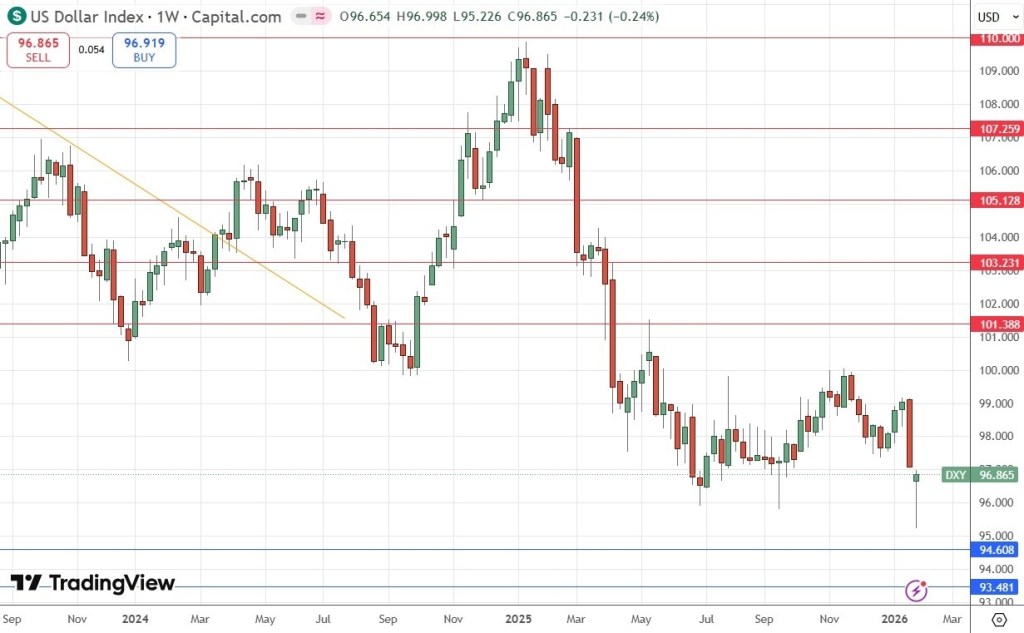
US Dollar Index
Last week, the U.S. Dollar Index formed a notably large bullish pin bar, rejecting a fresh four-year low. On its own, this price action is bullish. However, the broader technical structure remains bearish, with the index still trading below its levels from 13 and 26 weeks ago. As a result, the technical outlook for the U.S. dollar is mixed.
The nomination of Kevin Warsh as Federal Reserve Chair provided some support to the dollar during the week. Nevertheless, the forward outlook remains uncertain, and I believe the most attractive trading opportunities in the near term are likely to be independent of U.S. dollar direction.
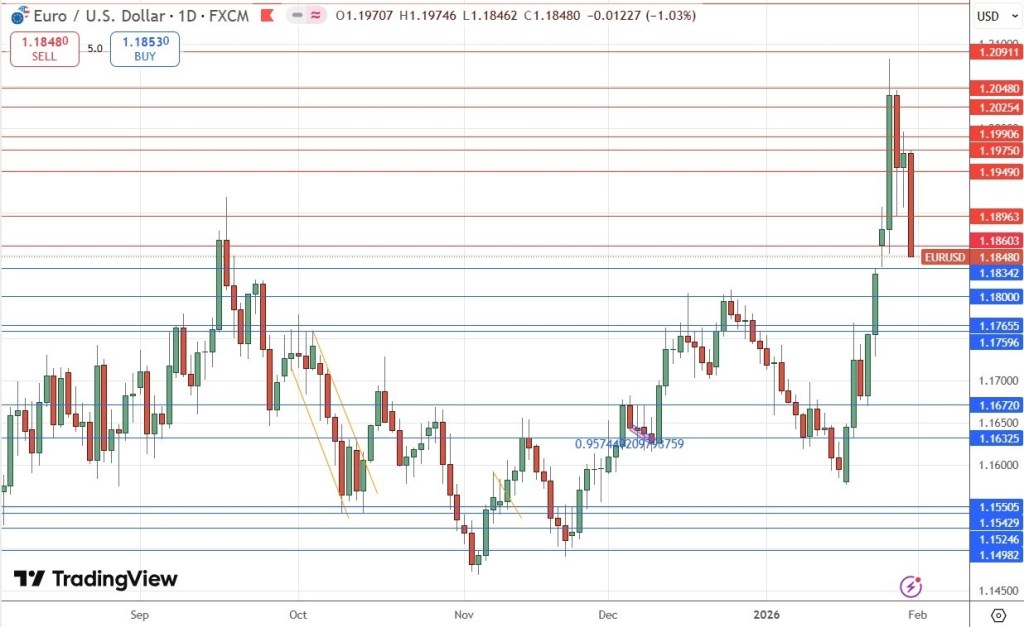
EUR/USD
The EUR/USD pair recently staged a strong long-term bullish breakout as the U.S. dollar accelerated lower and printed a new 3.5-year low. However, the move quickly failed, with price retreating sharply and finding minimal follow-through support.
This price action suggests the breakout may have been a temporary spike, although the potential for a sustained bullish trend should not be dismissed, as EUR/USD has historically shown a tendency to trend cleanly once momentum is established.
That said, the appointment of a new Fed Chair and the renewed strength in the U.S. dollar late in the week—driven by hotter inflation data—argue for a more cautious stance.
Accordingly, I would only consider a long position following a daily (New York close) above 1.2039.
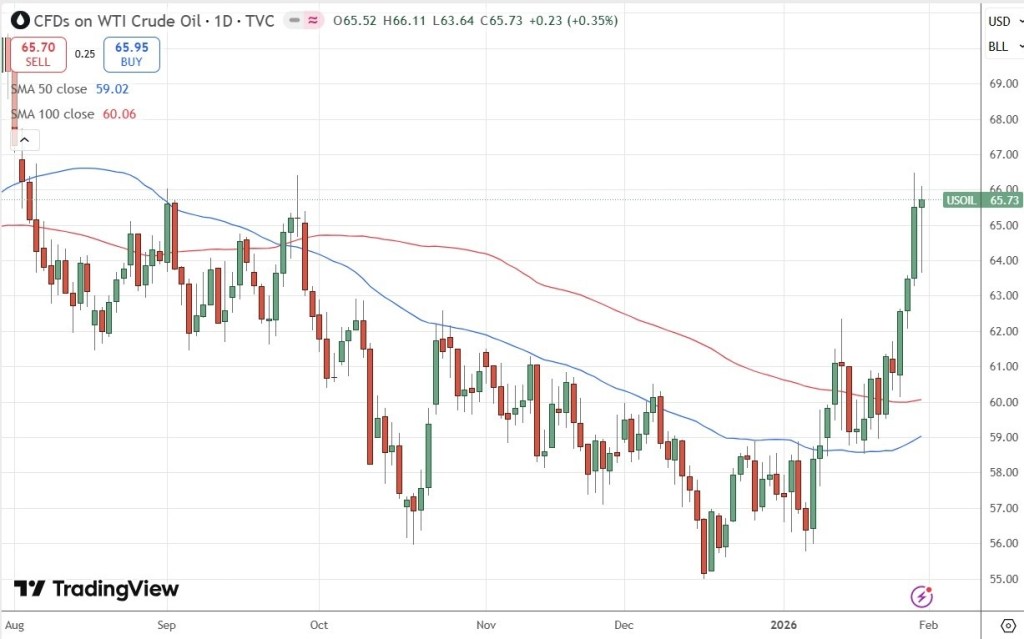
WTI Crude Oil
WTI crude oil has surged strongly in recent sessions as the risk of a regional conflict centered on Iran has intensified. Prediction markets are currently assigning a high probability to a U.S. strike on Iran in March, a scenario that could significantly disrupt global crude supply. Against this backdrop, prices pushed to a new four-month high by the end of last week, with a daily close above $66.25 marking a potential six-month high.
However, two important cautions should be noted:
While a daily close above $66.25 would typically attract trend-following buying, the current moving average structure does not confirm a bullish setup. Even in the event of military conflict, the move could prove to be a short-lived spike, especially if a rapid U.S. victory follows, potentially resulting in a failed breakout.
Unlike recent Democratic administrations, the Trump administration is likely to take aggressive steps to suppress crude oil prices, which could cap or reverse upside momentum.
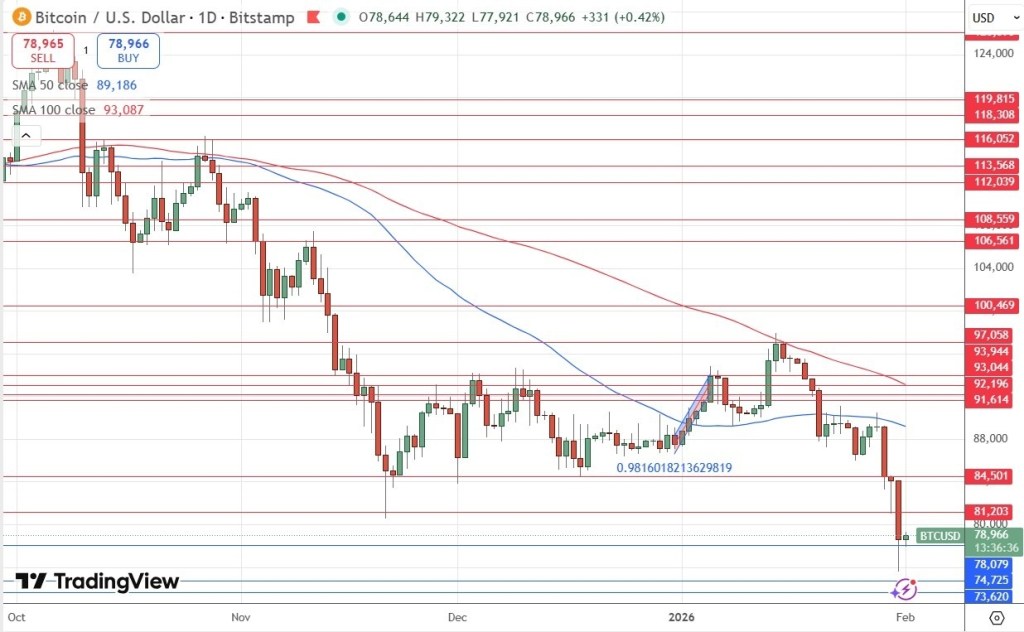
Bitcoin
BTC/USD has finally completed a decisive bearish breakdown below the long-term support zone just above $81,000. Price is now firmly established beneath this level and has pushed to a new nine-month low, a development that is technically significant and clearly bearish.
While equities and precious metals have rallied strongly in recent months, Bitcoin peaked at a record high several months ago and has since trended steadily lower. This divergence highlights a broader downturn across the crypto sector, with Bitcoin now showing clear signs of structural weakness.
Despite early expectations that Bitcoin would fundamentally reshape global finance, real-world adoption remains limited outside parts of Africa. Practical usability is still constrained, and its underlying value proposition remains uncertain.
Although I generally avoid short-selling, Bitcoin appears entrenched in a long-term bearish trend. I would not consider buying at current levels. Short positions may be worth considering, but only with strict risk management, as shorting is best suited to experienced traders.
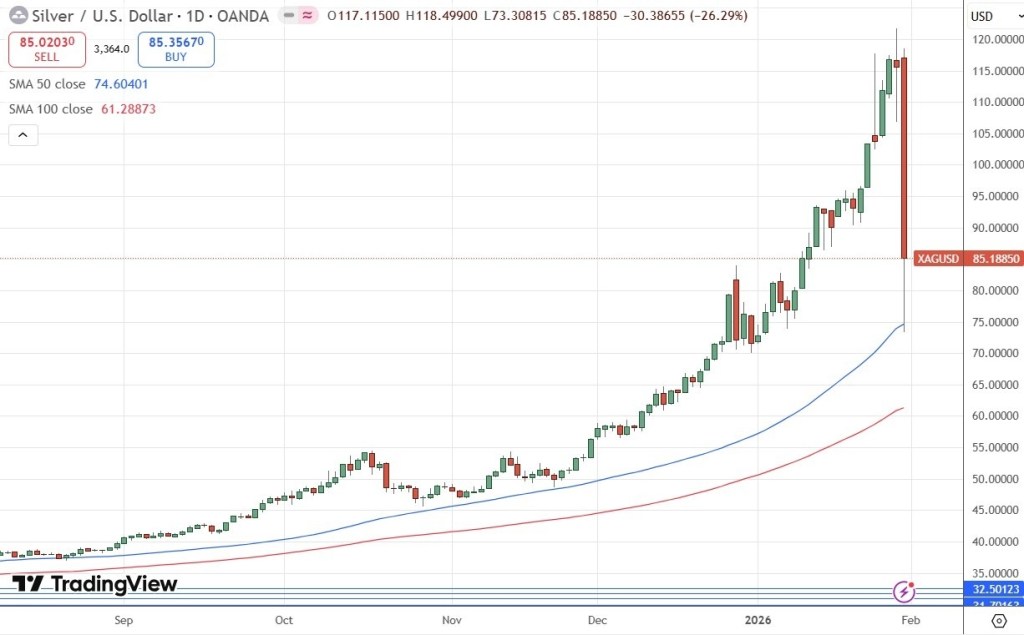
XAG/USD
Silver experienced an exceptionally volatile week, surging more than 15% to hit a new all-time high and the long-discussed $120 options target, before suffering a dramatic reversal. The sell-off unfolded sharply on Thursday and Friday—particularly Friday—when prices plunged 28% in a single session.
I had previously cautioned that the move was highly vulnerable to a sharp correction, and that while a long position was justified, it should be taken with a reduced position size.
The sheer magnitude of the collapse, even with some bullish undertones and modest resilience in the bounce from the weekly lows, strongly suggests that another record high is unlikely in the near term. This extraordinary rally appears to be finished, and the most probable next phase is a period of erratic consolidation, marked by large swings and gradually diminishing volatility.
XAU/USD
Much of the analysis above regarding Silver also applies to Gold. That said, gold’s volatility was noticeably lower, and its price action showed greater resilience at the lows.
While gold is also likely to enter a period of sideways consolidation, the underlying structure suggests it may recover to the upside more quickly than silver.
Bottom Line
My preferred trade for the coming week is:
Long EUR/USD, contingent on a daily (New York) close above 1.2039.
Silver prices are struggling to regain momentum after a sharp selloff on Friday. The metal came under heavy pressure as a stronger US Dollar—boosted by Kevin Warsh’s nomination as the next Federal Reserve Chair—combined with profit-taking to trigger a steep decline.
Market participants are now turning their attention to the upcoming US Nonfarm Payrolls report for fresh clues on the Federal Reserve’s monetary policy outlook.
Silver (XAG/USD) is trading cautiously around $80 during the Asian session at the start of the week, holding slightly above Friday’s fresh four-week low of $73.33. The white metal is attempting to stabilize after last week’s sharp selloff, during which it shed more than 30% from its record high of $121.66. The decline was driven by a stronger US Dollar, profit-taking following a strong rally, and expectations of a more hawkish Federal Reserve policy outlook.
From a technical perspective, the firmer US Dollar continues to undermine Silver’s risk-reward profile. At the time of writing, the US Dollar Index, which measures the Greenback against six major currencies, remains near its weekly high at around 97.33.
The US Dollar drew strong support on Friday after the White House nominated former Federal Reserve Governor Kevin Warsh to succeed Jerome Powell as Fed Chair. Analysts see Warsh’s nomination as preserving the central bank’s independence, countering earlier concerns sparked by President Donald Trump’s repeated comments that the next Chair would deliver additional rate cuts.
Warsh is known for favoring a strong US Dollar during his previous tenure at the Fed, suggesting monetary conditions could remain relatively tight going forward.
Looking ahead, investor focus will turn to the US Nonfarm Payrolls report for January, which is expected to play a key role in shaping expectations for the Federal Reserve’s future policy path.
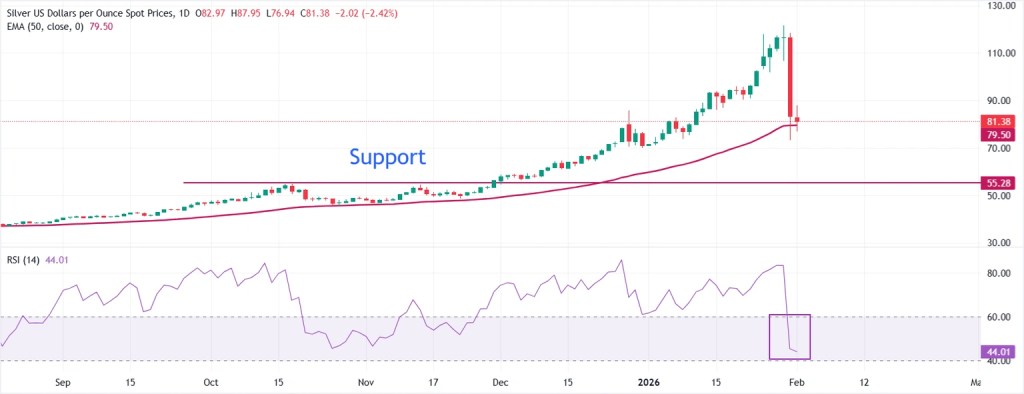
Silver technical analysis
On the daily chart, XAG/USD is trading around $81.38, holding above the rising 50-day Exponential Moving Average near $79.50 and preserving the medium-term uptrend. The upward slope of the moving average continues to underpin the broader bullish bias. Meanwhile, the Relative Strength Index sits near 44, in neutral territory, reflecting a cooling in momentum after a previously overbought phase.
As long as prices remain supported above the 50-day EMA, pullbacks are likely to attract initial buying interest around that dynamic level. However, the RSI’s position below 50 limits near-term upside, with a recovery above the midline needed to strengthen bullish momentum. If momentum stabilizes, buyers may look to extend the rebound, while a failure to regain traction could keep price action range-bound or tilt risks to the downside.
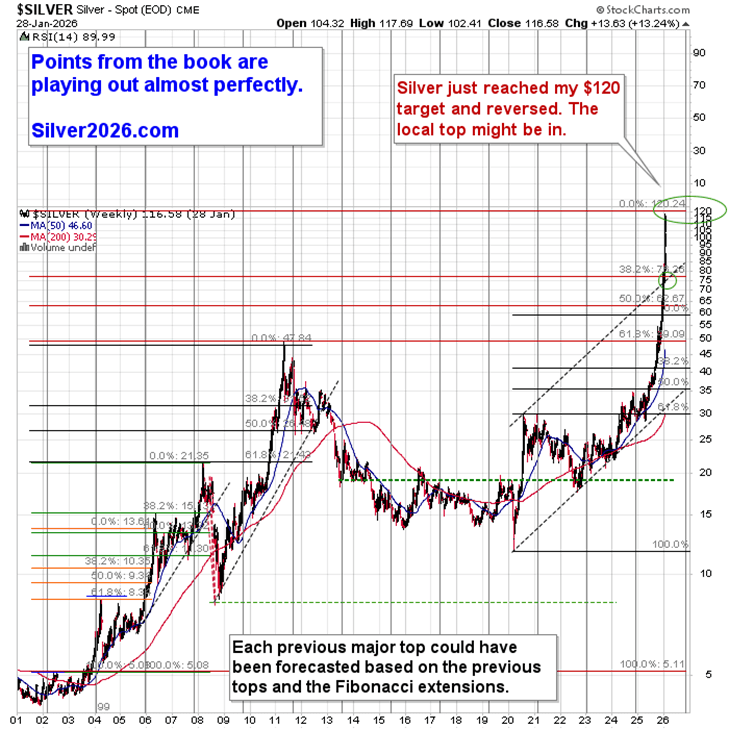
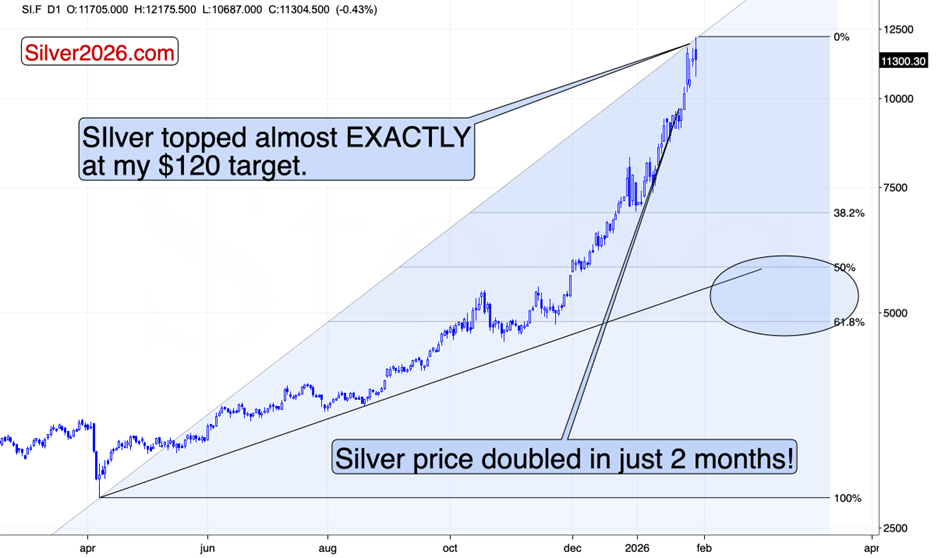
I’ve been highlighting a $120 target for silver for months, most recently again on Monday. In fact, the first time I presented the chart projecting $120 as a long-term objective was years ago. That level has now been reached.
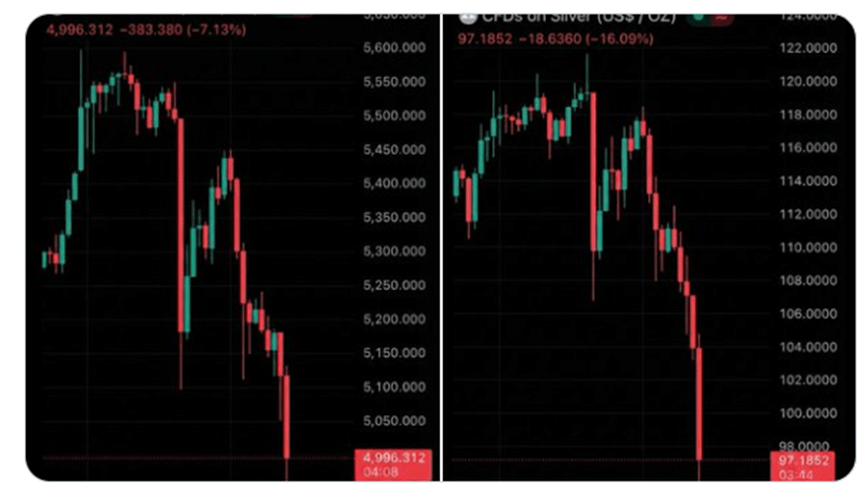
Silver futures peaked at $121.75 before plunging below $107, eventually stabilizing near $110. The magnitude of the intraday reversal is a stark reminder that the white metal can fall even faster than it rises.
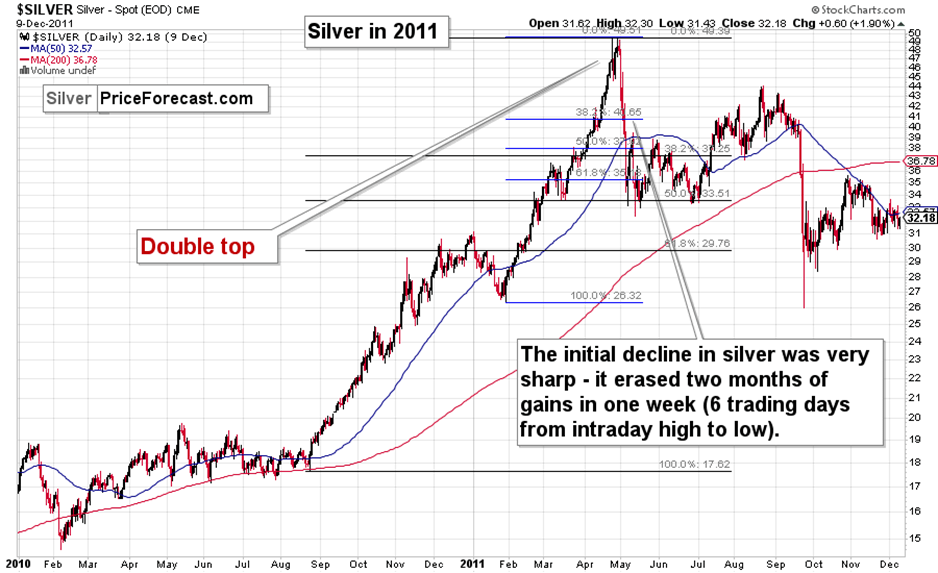
Recall that in 2011, silver erased two months of gains in just six trading days. If history were to repeat, prices would be sitting just above $50 before Valentine’s Day. Possible? Yes—but the decline doesn’t need to be nearly as violent.
A Potential Top Forming in Silver
That said, it’s still possible silver pushes higher in the near term. The metal didn’t collapse by tens of dollars—it was simply extremely volatile earlier today. However, with the long-term target now achieved, and considering conditions in the U.S. Dollar Index and the broader equity market, there’s a growing case that silver may have just put in a top.
The equity market may be especially critical in this context. The recent rebound in the U.S. Dollar Index failed to spark meaningful declines in precious metals, but today’s selloff in equities triggered much sharper downside moves. That contrast is an important signal.
Stocks have once again been unable to hold above their 2025 highs, suggesting the rally may be exhausted. While this is another in a series of similar invalidations, the magnitude of today’s intraday decline in precious metals hints that this episode could be different.
Adding to the cautionary tone, short-term weakness in mining stocks is also notable.
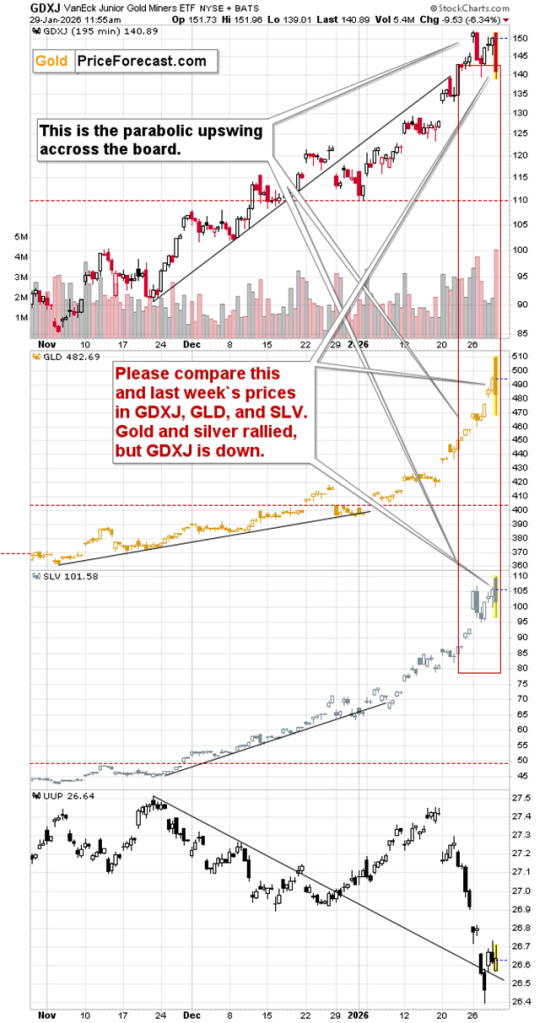
I highlighted the red rectangle to illustrate how current prices in GLD, SLV, and GDXJ compare with last week’s levels. In short, gold and silver are higher, while miners are lower—exactly the type of divergence that often marks the end of a rally.
Bitcoin Selloff Gains Momentum
Another important signal is the accelerating decline in Bitcoin.
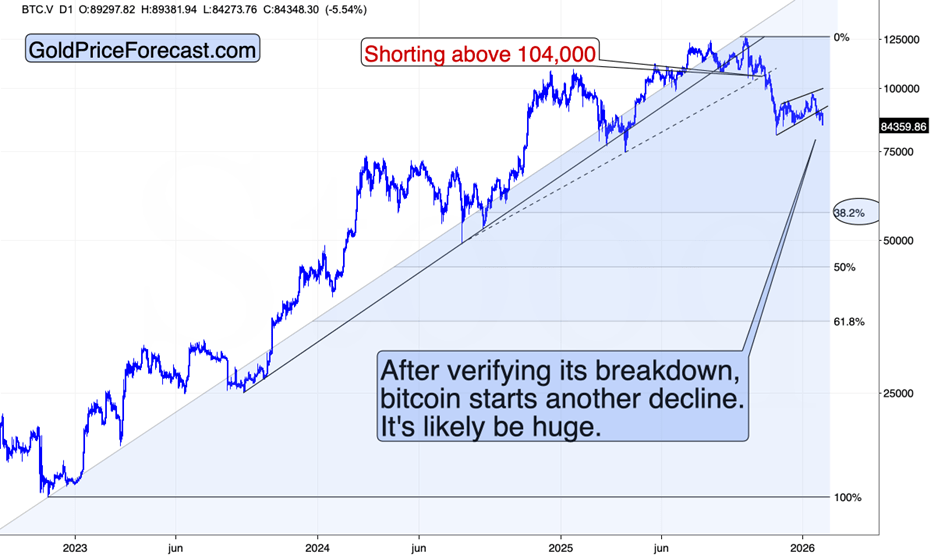
After confirming its breakdown below the flag pattern, Bitcoin fell roughly 5% today.
I previously noted that for those not yet short Bitcoin, this represented an attractive opportunity to initiate or add to positions if sizing felt insufficient. From a risk–reward perspective, that view still stands. The so-called “new gold” was perched at the edge—and has now taken its first decisive step lower.
Last but not least—gold. The yellow metal initially surged, only to reverse sharply, plunging nearly $500 on an intraday basis. When I first became interested in the precious metals market many years ago, gold’s entire nominal price was well below that amount. Time flies—and so has the price of gold. That said, it appears gravity may be about to reassert itself once again.
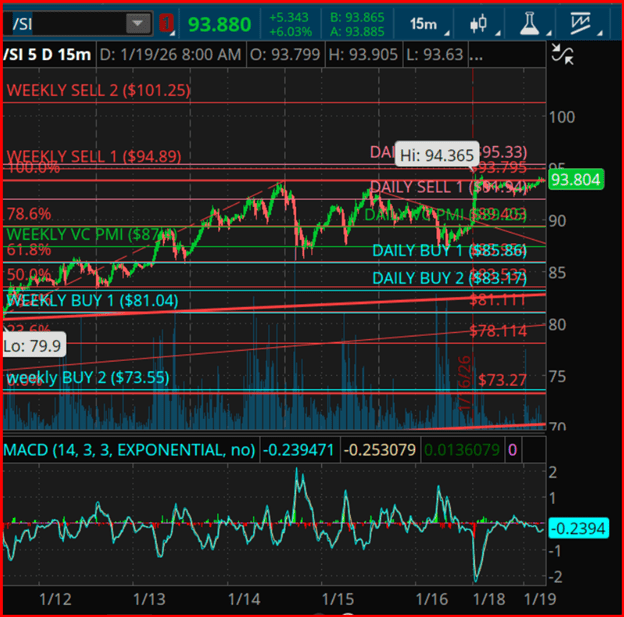
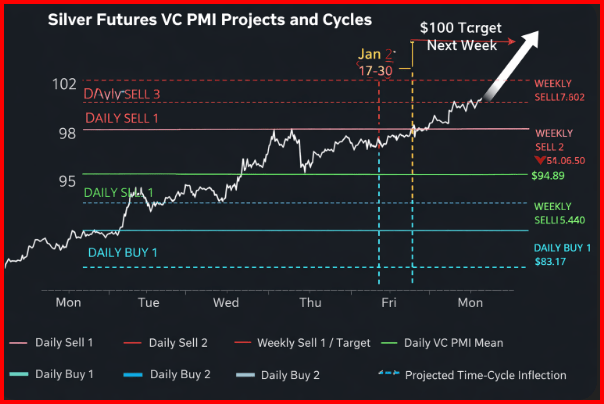
Silver remains in a high-momentum price-discovery phase, holding above the Daily VCPMI mean in the upper $89–$90 area, signaling sustained bullish momentum across both short- and intermediate-term timeframes.
The current structure points to strong participation on corrective pullbacks, increasing the likelihood that dips remain brief as buyers continue to defend the Daily Buy 1 and Weekly VCPMI support zones between $85 and $87.
From a time-cycle standpoint, the dominant 30-, 60-, and 90-day harmonic cycles remain in alignment with the broader expansion phase that began in early Q4. The market is now entering a near-term inflection window projected for January 18–20, a period that historically aligns with volatility compression and subsequent directional resolution. Should price sustain closes above the Daily Sell 1 level, the probability outlook shifts toward trend continuation, with upside targets extending to the Weekly Sell 1 and Weekly Sell 2 zones.
Square of 9 price geometry identifies $93.75, $94.80, and $95.40 as key harmonic resistance levels—rotational nodes where trend acceleration or rejection is most likely to occur. A sustained acceptance above this zone would open the technical pathway toward the $98–$101 range, aligning with the upper Weekly Sell 2 projection and longer-term cycle expansion targets.
Conversely, failure to rotate higher through this resistance band would favor a mean-reversion move back toward the Daily VCPMI mean and the Weekly Buy 1 support zone near $81–$83.
From a structural perspective, silver’s resilience amid elevated volatility and margin pressure continues to validate a supported trend environment, with accumulation behavior dominating corrective phases. Rising open interest and consistent closes above the Weekly VCPMI further support the view that the broader market remains positioned for higher price discovery rather than distribution.
Looking ahead, the secondary momentum window from January 27–30 marks the next key timing convergence, where the interplay between Square of 9 resistance and cyclical factors could drive either a decisive breakout or a rotational pullback.
Traders applying the VC PMI framework should maintain discipline, executing systematically at predefined probability levels while separating emotional bias from structured risk and money management.
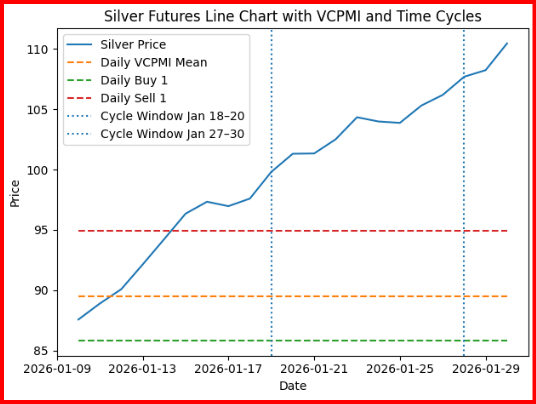
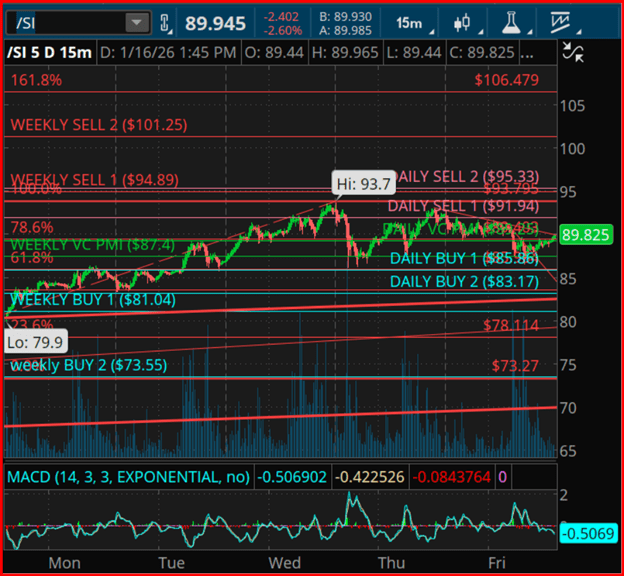
Silver remains within a clearly defined VC PMI probability structure, consolidating around the Daily VC PMI mean near the $89.25 area. This zone represents the market’s equilibrium level, where directional momentum is established. A sustained close above the mean would trigger bullish momentum, statistically favoring a move toward the Daily Sell 1 level near $91.94, followed by the Daily Sell 2 region around $95.33.
These upside targets also align with Square of 9 harmonic resistance levels, implying that any rally into these zones could be accompanied by heightened volatility and increased profit-taking.
Time-cycle analysis points to a near-term inflection window between January 18 and 20, followed by a secondary momentum window from January 27 to 30. These periods align with current Square of 9 price geometry, where 45-degree and 90-degree harmonic rotations from the recent swing low intersect with the Daily and Weekly VC PMI bands.
Historically, when these time and price relationships converge, markets tend to experience either an expansion in momentum or a corrective pause ahead of the next directional move.
On the downside, corrective phases remain brief and shallow, underscoring a structurally supported trend. The Daily Buy 1 level near $85.86 and Daily Buy 2 around $83.17 mark high-probability accumulation areas, where the VC PMI model assigns a 90–95% likelihood of mean reversion back toward the daily equilibrium. These levels are further supported by the Weekly VC PMI mean near $87.40, which continues to function as dynamic support within the broader trend framework.
From a higher-timeframe perspective, the Weekly Sell 1 level near $94.89 and Weekly Sell 2 around $101.25 represent the next key upside reference points should daily bullish momentum evolve into a sustained trend. A weekly close above both the daily and weekly means would confirm a structural shift, clearing the way toward these upper harmonic targets derived from Square of 9 geometry and Fibonacci extensions.
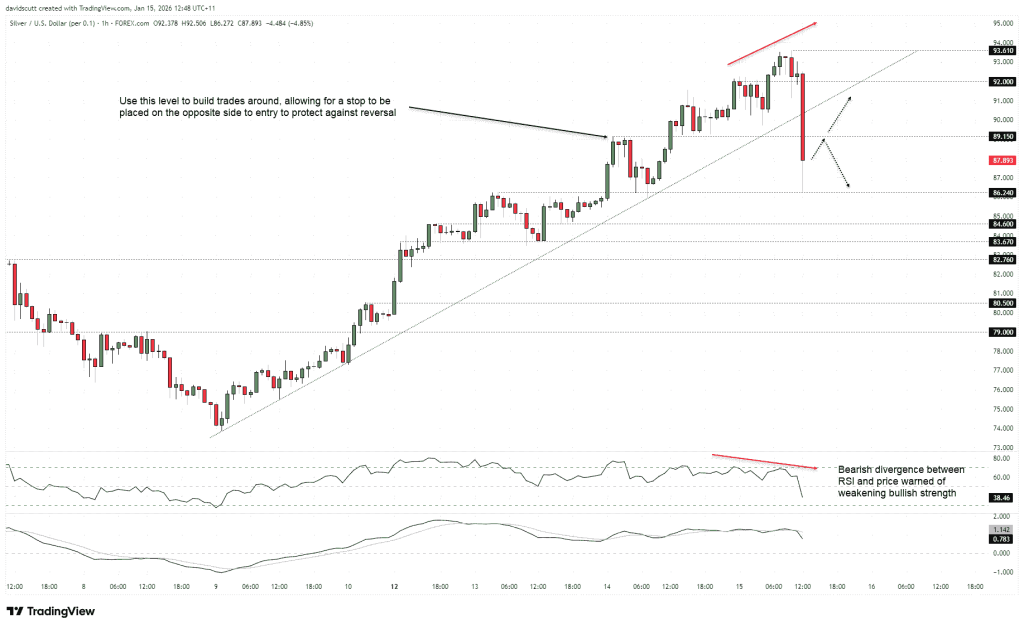
After reaching record highs and recording its largest four-day gain since 2008, silver’s momentum has sharply reversed. The price broke through its uptrend support from January 9, signaling a potential deeper correction.
Despite strong macroeconomic tailwinds, selling pressure has intensified, likely fueled by heavy retail trader activity, which has contributed to significant volatility.
The break of the uptrend was confirmed by a three-candle bearish reversal pattern on the hourly charts and bearish divergence in the RSI (14) indicator.
Following the trend break, silver’s price dropped sharply to a support level at $86.24 before rebounding toward $89.15. This price range has been a key area of activity recently and will be important for traders monitoring short-term movements.
If the bullish trend has ended and the price fails to climb back above $89.15 to rejoin the uptrend, traders might consider opening short positions just below this level with a tight stop-loss above it for protection. The initial target would be support at $89.24.
Should this support break, key downside levels to watch are $84.60, $83.67, and $82.76, all of which previously acted as short-term support or resistance during the upward move. Further declines could target $80.50 and $79 if the sell-off gains momentum.
However, as has often been the case with silver breakouts, bearish moves tend to be short-lived, so a strong wave of dip-buying remains possible. If buyers push the price back above $89.15, it could trigger new long positions aiming first for the previous uptrend level, followed by targets at $92 and the record high of $93.61.
While I don’t put much emphasis on the mixed signals from the RSI (14) and MACD regarding the short-term direction, the bearish divergence between RSI and price before the drop did offer an early warning that the bullish momentum was weakening. This is an important factor to consider regardless of silver’s next move.
Silver prices hit a new all-time high approaching $90.00 amid escalating tensions as the U.S. threatens military action in Iran. Meanwhile, leaders of major global central banks have criticized Washington for undermining the Federal Reserve’s independence. Despite this, the U.S. dollar rebounded sharply after these central bank chiefs expressed strong support for Fed Chair Jerome Powell.
Silver (XAG/USD) continued its winning streak for a fourth consecutive trading day on Wednesday, rallying close to $90.00 during the Asian session. The white metal’s advance is supported by sustained demand for safe-haven assets amid ongoing geopolitical tensions.
In Iran, widespread civil unrest driven by soaring inflation, a sharp depreciation of the Rial against the US Dollar, and government corruption has led to the deaths of hundreds of protesters calling for political change.
In response, U.S. President Donald Trump has threatened military action against Tehran if the Iranian government continues to kill protesters.
Meanwhile, concerns over the Federal Reserve’s independence have intensified following criminal charges against Chairman Jerome Powell related to alleged mismanagement of funds for renovating Washington’s headquarters. Powell dismissed the charges as a “pretext,” attributing them to the Fed’s decision to set interest rates based on public interest rather than presidential preferences. These developments kept safe-haven assets in demand.
The news initially caused a sharp drop in the U.S. dollar, with experts warning that any threat to the Fed’s autonomy could negatively impact the country’s sovereign credit rating. However, the dollar quickly recovered after top officials from global central banks expressed strong support for Powell amid his dispute with President Trump.
“We stand in full solidarity with the Fed System and its Chair Jerome H. Powell,” said leaders of the European Central Bank, Bank of England, and nine other major institutions in a joint statement on Tuesday.
Silver technical analysis
XAG/USD is trading higher near $90.00 at the time of writing, with strong buying momentum pushing the price further into overbought territory.
The 14-day Relative Strength Index (RSI) has risen to 74.77 from 72.52, signaling increasing bullish momentum. Although the trend remains upward, the overextended conditions may limit further gains and lead to a period of consolidation.
A slight pullback in momentum, with the RSI retreating closer to the 70 level, could provide a healthy reset and support a more gradual upward move. However, if the RSI accelerates again toward the previous high near 85.90, the rally may face a sharper correction due to rising momentum fatigue.
Silver is being boosted by expectations of interest rate cuts, a weaker US dollar, and increasing geopolitical tensions.
Limited supply combined with record-high industrial demand make silver very responsive to changes in market risk sentiment.
Staying above $83.36 maintains potential for further gains, while dips toward $75 are likely to draw in buyers.
Silver kicks off the week with robust momentum, fueled by multiple factors converging simultaneously. Safe-haven demand is increasing due to geopolitical tensions, the broader economic environment supports expectations of US interest rate cuts, and supply remains constrained amid strong industrial demand.
As a metal that bridges both precious and industrial categories, silver typically reacts more quickly than many other assets to changes in market risk sentiment.
Interest Rates, US Dollar, and Risk Sentiment Are Aligning Together
Last week’s US December jobs report indicated a cooling labor market. Non-farm payrolls increased by only 50,000, while the unemployment rate fell to 4.4%, revealing softer underlying growth despite the headline figures.
This data boosted market expectations for an earlier Federal Reserve interest rate cut. As rate cut bets rose and the US dollar weakened, demand grew for non-yielding assets like silver, giving prices fresh support.
At the same time, increased judicial scrutiny of Jerome Powell and escalating tensions between the Federal Reserve and the administration have added more pressure on the US dollar. Rising political and institutional uncertainty has driven investors toward safe-haven assets, a trend that often causes sharper price swings not just in gold but also in silver, which typically experiences greater volatility.
Safe Haven Demand Returns to Center Stage
Uncertainty in the Middle East and global politics continues to drive safe haven demand in commodity markets. Rising protests in Iran and renewed tensions between Tehran and the US have pushed investors toward gold and silver.
Recent moves by the Trump administration involving Venezuela and Iran, including plans for Venezuelan oil exports and new sanctions threats, have added further uncertainty. In this context, silver’s rebound above $80 an ounce shows how quickly changes in risk sentiment impact prices. Ongoing geopolitical risks from the Russia-Ukraine war and the Gaza conflict also reinforce the environment supporting strong demand for safe haven assets.
Industrial Demand and Supply Challenges
Attributing silver’s rise solely to macroeconomic and geopolitical factors overlooks a key part of the picture. Industrial demand for silver is projected to hit record highs in 2025 and remain strong into 2026. Currently, about 58% of global silver demand comes from industrial uses, driven by rapid growth in sectors like solar panels, electric vehicles, electronics, and AI-related hardware.
This evolving demand profile is making silver a more strategic commodity, which helps explain why its prices often react faster and with greater volatility when risk appetite or commodity exposure shifts.
On the supply side, constraints persist. Only around 27% of silver production comes from primary silver mines; the majority is a byproduct of copper, lead, zinc, and gold mining, limiting the ability to quickly ramp up output. Following several years of supply deficits from 2021 to 2024, total silver supply in 2025 is estimated at about 813 million ounces, compared to demand of roughly 1.24 billion ounces.
Inventories in London, China, and the United States have dropped to low levels, underscoring the tight market conditions. China’s new export licensing system, implemented on January 1, has added extra pressure by complicating shipments, particularly for smaller producers. Meanwhile, silver’s designation as a critical mineral in the US, along with consistent physical buying in China and India, continues to bolster fundamental demand.
Silver’s Technical Outlook
On the daily chart, silver spent much of last week trading sideways between $74.66 and $83.36 while maintaining its overall uptrend. This consolidation above the rising trendline suggests a temporary pause rather than a reversal. Strong buying interest near $74 late last week, followed by a renewed push toward new highs this week, indicates that short-term momentum has shifted back to the buyers.
Technically, the $83.36 level is crucial. A decisive break and sustained trading above this point would turn previous resistance into support. As long as silver stays above $83.36, any pullbacks are likely profit-taking rather than a trend change, keeping the bullish outlook intact.
In this scenario, silver could pick up pace toward the Fibonacci extension targets at $87, $88.76, and $91.28. Holding above $91 would further strengthen the case for a run toward the psychological $100 mark, with a potential next target around $103.63 if momentum continues.
Momentum indicators back this positive outlook. The Stochastic RSI has been hovering near oversold levels, increasing the chance of an upside signal if silver stays above $83.36. The moving averages remain bullish, with short-term exponential moving averages trending upward and price holding above the 8-day EMA at 78.56 and the 21-day EMA at 73.20, reinforcing the prevailing upward trend.
On the downside, daily closes below $83 would raise concerns about breaking the short-term rising trend. In that case, the first support to watch is 78.56, aligning with the 8-day EMA. If that fails, the 74.50 to 74.66 zone becomes crucial, marking the base of recent consolidation and a key Fibonacci retracement level.
A decisive break below this support band could lead to a deeper correction toward 69.28 and potentially 64.93. However, if the broader fundamentals remain supportive—such as expectations for rate cuts, a weaker dollar, elevated geopolitical risks, and ongoing supply constraints—any pullbacks near $75 are likely to attract buyers.
In summary, fundamentals continue to favor silver, but technically, holding above $83.36 is critical to confirm the uptrend. As long as this level holds, silver’s path higher remains open for gradual gains.
Silver futures continue their strong upward momentum, trading near $79.80 after a significant rally that pushed prices well above the VC PMI (Variable Changing Price Momentum Indicator) average and into the upper resistance zone.
This pattern indicates the market has entered what we call escape-velocity behavior—where the trend’s acceleration temporarily outweighs short-term oscillators but still respects longer-term geometry and cycle pressures.
Looking at the VC PMI, the daily mean is holding steady around $76.02, providing dynamic support throughout the week. The market also successfully defended the Daily Buy 1 level at $73.38, confirming the strength of the current bullish setup.
Now, prices are approaching the Daily Sell 1 zone near $78.70, with the Daily Sell 2 resistance at $82.24 closely matching the previous swing high of $82.58. This overlap suggests a higher likelihood of short-term profit-taking or consolidation, rather than a reversal of the uptrend.
On the weekly VC PMI framework, silver stays solidly above the Weekly Buy 1 level at $73.70, with the Weekly VC PMI mean around $78.15, reinforcing that the prevailing trend is upward. However, the Weekly Sell 1 level at $83.78 and Weekly Sell 2 at $88.23 mark key resistance zones where momentum typically slows and volatility tends to increase.
From a time-cycle perspective, silver is currently trading within a compressed late-week cycle window, a phase where markets often pause, rotate, or experience slight retracements before the next move. Such pauses are common in strong trends and usually serve to reset momentum for continuation rather than signaling a reversal.
The present cycle alignment suggests an initial phase of range expansion, followed by consolidation, rather than signaling a trend exhaustion.
The Square of 9 geometry further supports this view. The $82–$83 area corresponds with a significant angular resistance band, while the $78–$76 range serves as a key rotational support zone. As long as prices stay above the VC PMI mean, the primary square rotation remains bullish, with higher-level targets pointing toward the mid-$80s in upcoming cycle windows.
In summary, silver maintains a strong bullish structure according to both the VC PMI and Square of 9 frameworks. Any short-term pauses or pullbacks should be seen as opportunities for mean reversion within the broader uptrend, rather than signs of trend reversal.
Reflecting on the start of this century, the first striking observation is our national shortsightedness. After surviving Y2K and the dot-com crash in 2000, our leaders assumed the path ahead would be smooth sailing from year one onward.
However, reality proved otherwise, beginning with a series of black swan events, notably the attacks on the World Trade Center and Pentagon on September 11. While such events are inherently unpredictable, it’s remarkable that the Congressional Budget Office (CBO) economists confidently forecasted in 2001 a future of continuous budget surpluses, anticipating the complete elimination of national debt by 2011.
For reasons unknown, the CBO issues 10-year federal spending and revenue projections, despite having no solid factual or practical foundation to accurately forecast beyond a year or two—akin to trying to predict the weather a year in advance.
The January 2001 CBO report highlights this myopia. Their projections simply extended current trends indefinitely without grounding in reality. Under this unrealistic mandate, the CBO projected a cumulative surplus of $5.6 trillion for 2002–2011.
In reality, deficits over that decade totaled $6.1 trillion—a swing of $11.7 trillion. It would have been much simpler to just flip a plus sign to a minus. The projections failed to account for the soaring costs of Bush’s “War on Terror” post-9/11, which led to prolonged wars in Afghanistan and Iraq, the bursting of the real estate bubble, and massive TARP bailouts to rescue large banks.
In short, this is a summary of CBO’s flawed foresight:
The first takeaway from this bleak forecast is that the CBO economists assumed deficits would increase in a smooth, predictable fashion—almost as if they were drawing a straight line with minor fluctuations, rather than reflecting the unpredictable realities of economic growth.
A second point is that the 2003 Bush tax cuts were not the main driver of the deficits. In fact, annual deficits dropped significantly—from $413 billion in fiscal year 2004 (which began October 1, 2003) to just $161 billion in fiscal year 2007. This means the deficit shrank by more than half during the four years following the tax cuts and before the 2007 real estate crash.
While much of this now feels like distant history, the ongoing wars and the Federal Reserve’s drastic response to the 2008 financial crisis—keeping interest rates near zero for eight years, essentially through the entire Obama administration—contributed to massive deficits that have persisted through to today, especially in the five years following the COVID-19 pandemic.
Since 2001, U.S. federal deficits have averaged about $1 billion annually, but that figure has surged to over $2 trillion per year since 2020, according to the U.S. Treasury.
Today, the total federal deficit stands at $38 trillion, which amounts to roughly $110,000 owed per American—far from the anticipated surpluses once projected.
Following a Challenging 2000–2009, Markets Surged in the First Quarter
What about the markets? After nearly a “lost decade” lasting nine years from March 2000 to March 2009, all major market indexes have experienced remarkable growth—particularly gold relative to the U.S. dollar.
By March 9, 2009, three of the four major indexes—the S&P 500, NASDAQ, and Russell 2000—had fallen by 50% since the decade began (while the Dow was down 40%), but they bounced back strongly from 2009 through 2025:
Over the same 25-year period, the Consumer Price Index (CPI) increased by 83%, which means the real market gains were somewhat diminished.
The U.S. dollar performed even worse, losing about 10% in value overall (and 8% against the euro), while gold and silver surged more than 15 times in value:
The first-quarter returns were decent, but the strong performance of gold and silver signals that the dollar—and the CBO’s deficit forecasts—cannot be relied on in the long run. In fact, President Trump has set a goal for 2026 to deliberately weaken the dollar against the Chinese yuan to “help” exporters boost overseas sales. Much of the talk about the dominance of the “King Dollar” is just rhetoric. In reality, many politicians aim to devalue their currencies to encourage trade, turning paper money into a “race to the bottom,” while gold quietly holds its value, watching from the sidelines.
This brings us to the 2025 summary—a major victory for precious metals as the dollar dropped by 10%.
2025 Brought Massive Gains for Precious Metals
The year 2025 exemplified the key trends seen over the past 25 years—while the stock market continued to climb, gold and silver surged even faster. Although inflation is easing, gold today serves less as an inflation hedge and more as a safeguard against crises, a hedge against the dollar, and increasingly, a hedge against cryptocurrency volatility.
In 2025, the U.S. Dollar Index (DXY) dropped by 10%, allowing major global currencies to gain between 5% and 15%. Meanwhile, the poorest-performing investments of 2025 brought good news for consumers through lower food and energy prices:
So, if 2026 mirrors the gains of 2025, it will surely be a rewarding year for most investors.
Gold continued its strong rally in Asian trading on Tuesday, moving back toward record territory as rising geopolitical tensions after a U.S. strike on Venezuela boosted safe-haven demand for the metal.
Spot gold inched up 0.2% to $4,458.20 an ounce at 01:22 ET (06:22 GMT), while U.S. gold futures gained 0.4% to $4,469.10 per ounce.
Bullion had jumped 2.7% in the previous session—its biggest one-day advance in weeks—as investors sought refuge in precious metals amid growing global market uncertainty.
Although prices reached a record high of $4,549.71 per ounce last week before retreating on profit-taking, gold has since recovered and is again trading close to those peak levels.
Gold jumps as U.S. action in Venezuela and Fed rate-cut expectations fuel demand
The surge was mainly sparked by events in Venezuela, where U.S. troops carried out a surprise operation over the weekend that led to the arrest of President Nicolás Maduro, sharply intensifying geopolitical risks and unsettling commodity markets.
Officials said Maduro was taken to the United States to face long-standing narcotics-related charges and entered a not-guilty plea in a New York court on Monday.
According to Reuters, U.S. President Donald Trump is preparing to meet with executives from major American oil companies to discuss measures to increase Venezuela’s oil output.
Expectations of prolonged geopolitical tensions and potential policy changes have further strengthened gold’s role as a hedge against market volatility.
Gold also drew support from growing expectations that U.S. interest rates will continue to decline in 2026.
Markets are now factoring in two additional Federal Reserve rate cuts this year, an environment that typically benefits non-yielding assets like gold.
On Monday, Minneapolis Fed President Neel Kashkari noted that U.S. inflation has been easing gradually, strengthening the view that the central bank could have room to ease policy if price pressures keep moderating.
Investors are closely tracking upcoming U.S. economic data for further signals on the Fed’s policy direction. December’s nonfarm payrolls report, due Friday, is expected to be a crucial gauge of labor market strength and could shape rate expectations in the months ahead.
Silver and platinum climb as copper sets a new record
Other precious and industrial metals also traded firmly higher on Tuesday.
Silver surged 3% to $78.78 an ounce, while platinum gained 2% to $2,331.25 per ounce.
On the London Metal Exchange, benchmark copper futures rose 2.2% to a record $13,331.0 per ton. U.S. copper futures also advanced 1.5% to $6.07 a pound, marking their highest level on record.
According to ING analysts, copper’s continued rally has been driven by disruptions to mine supply and shifts in trade flows caused by tariffs imposed by U.S. President Trump.