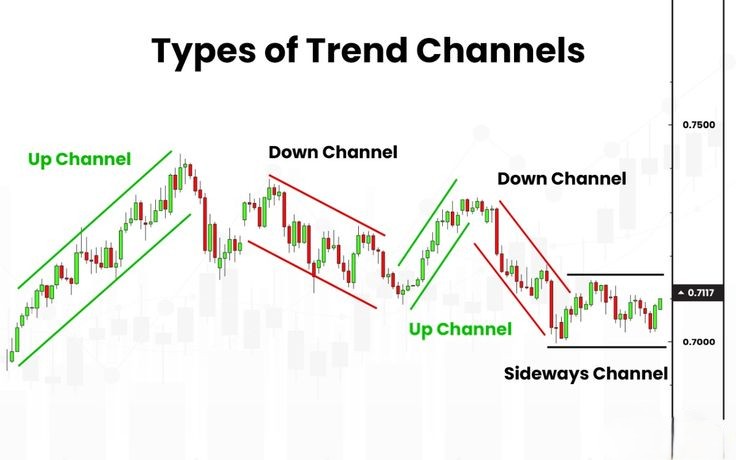
Tag: trend line

  • Channel Line

    channel line (or price channel) is a technical analysis tool used to show the direction of a market trend and the range where price tends to move.

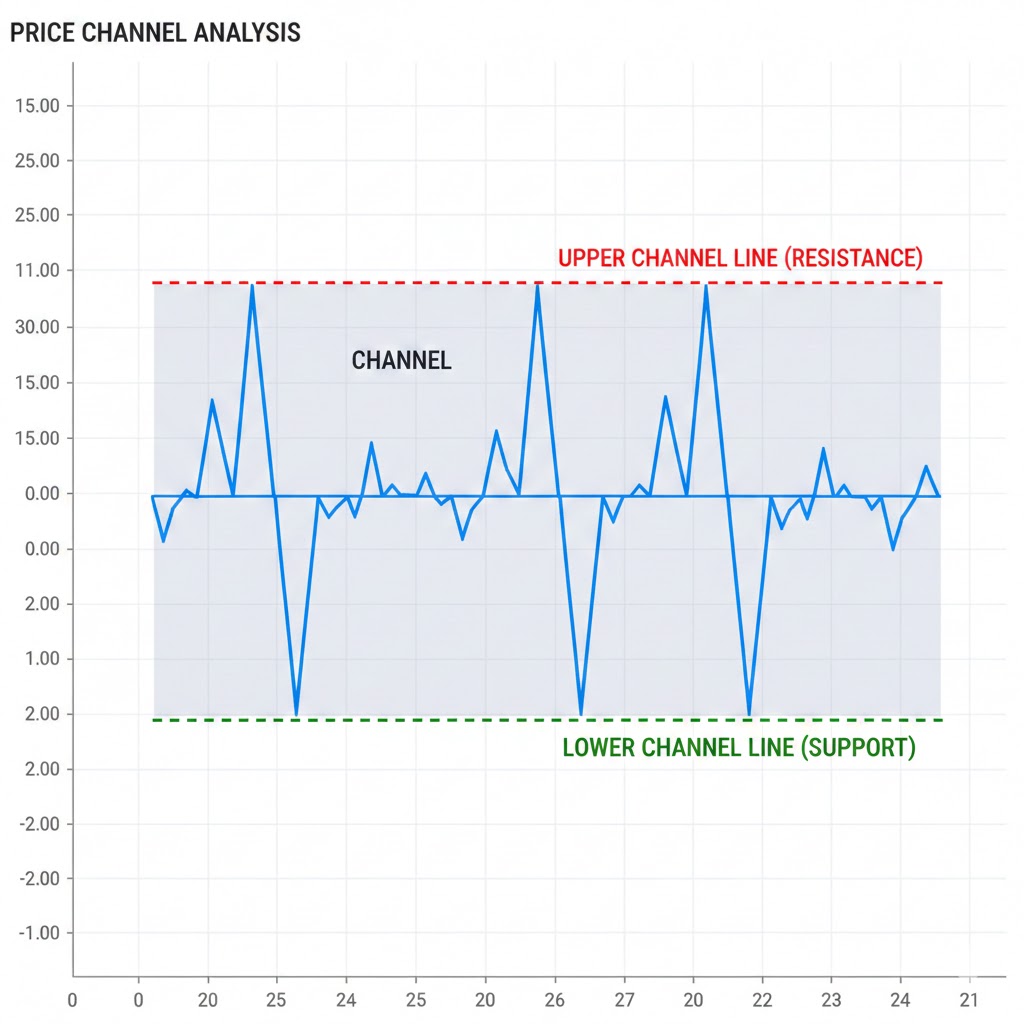
    How Traders Use Channel Lines

    • Buy near support, sell near resistance
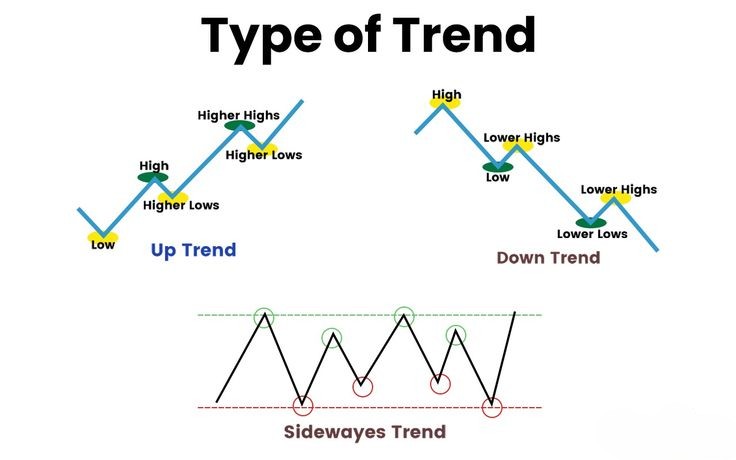
    • Identify trend strength
    • Spot breakouts (price breaks outside the channel)
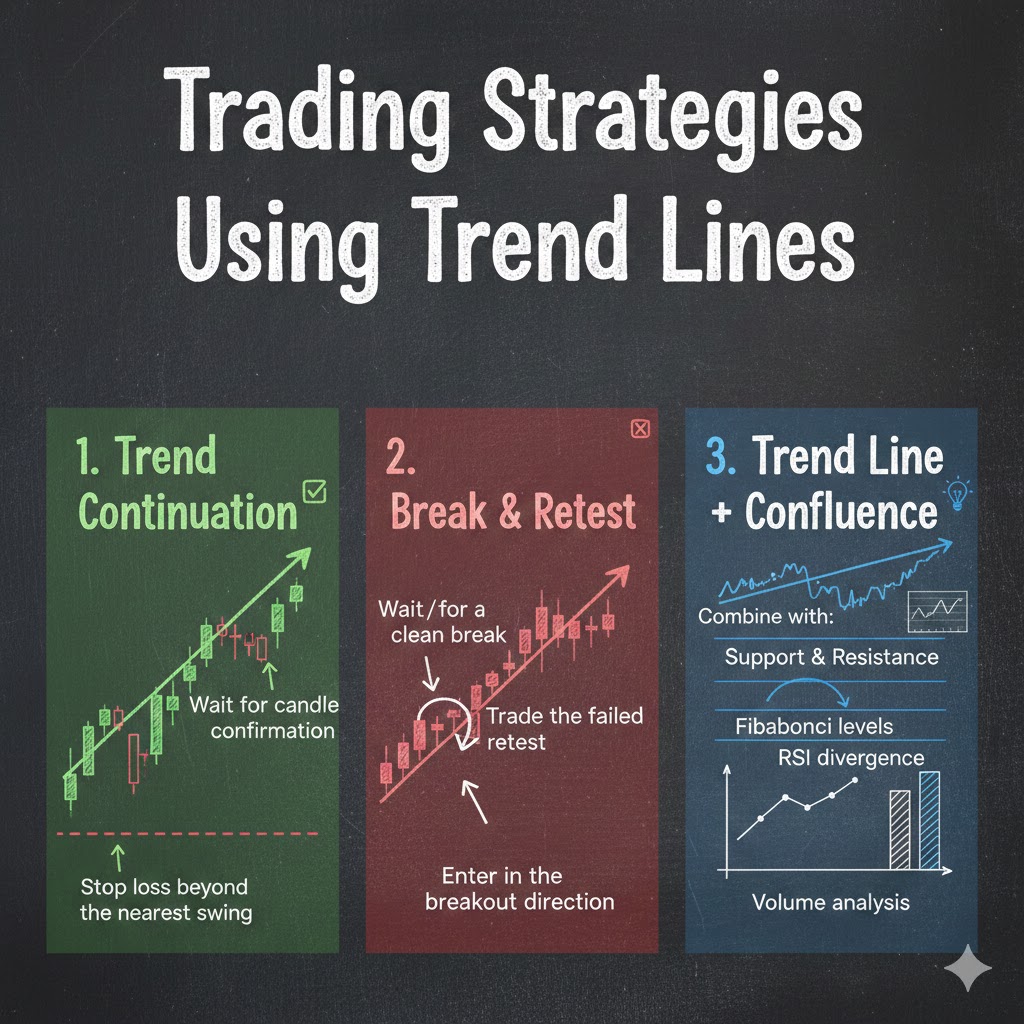
    • Combine with:
      • Candlestick patterns
      • RSI / MACD
      • Volume

    Key Notes

    ⚠️ Channel lines are dynamic, not fixed
    ⚠️ False breakouts can happen
    ✅ Best used with confirmation tools

  • Trend Line – Part 2

    Price Behavior at the Trend Line

    Common Mistakes Traders Make

    ❌ Drawing trend lines in sideways markets
    ❌ Using too many trend lines
    ❌ Treating trend lines as price prediction tools
    ❌ Confusing trend line break with structure break


    Trend Line in a Professional Trading Mindset

    A trend line is not an entry tool,
    but a market behavior orientation tool.

  • Trend Line – Part 1

    trend line is a straight line drawn on a chart that connects two or more significant price points (swing highs or swing lows) to show the overall market trend.

    It helps traders:

    • See the trend direction
    • Identify entry and exit points
    • Spot trend continuation or reversal

    In greater detail
    1. Uptrend Line (Bullish Trend)
      • Price tends to bounce upward from the line
      • Drawn by connecting higher lows
      • Acts as support
        • Market is making higher highs & higher lows
    2. Downtrend Line (Bearish Trend)
      • Drawn by connecting lower highs
      • Acts as resistance
      • Price tends to move downward from the line
        • Market is making lower highs & lower lows
    3. Horizontal Trend Line (Sideways Market)
      • Drawn across equal highs or equal lows
      • Represents support or resistance
      • Indicates range-bound (consolidation) market
        • No clear trend

    Why Trend Lines Matter

    • Simple and visual
    • Works in stocks, forex, crypto, commodities
    • Combines well with:
      • Support & resistance
      • Candlestick patterns
      • Indicators (RSI, MA, Volume)

    Key Tip 

    trend line is a guide, not a guarantee. Always wait for confirmation before trading.