Stochastic Oscillator
The Stochastic Oscillator is a popular technical analysis indicator used to measure the momentum of a financial asset — basically, how fast the price is moving compared to its recent range.
- It compares the closing price of an asset to its price range over a specific period of time.
- It helps traders identify overbought or oversold conditions in the market.
- Values range between 0 and 100.
How it works
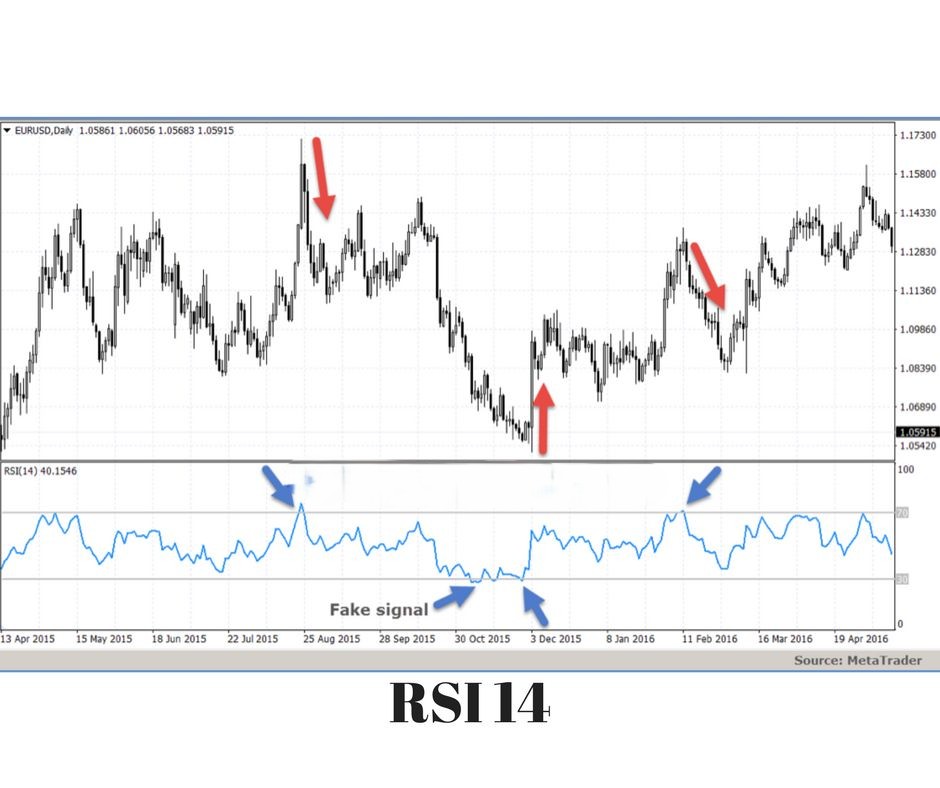
- When the oscillator is above 80, the asset is considered overbought (price might be too high, possible reversal or pullback soon).
- When it is below 20, the asset is considered oversold (price might be too low, possible upward reversal).
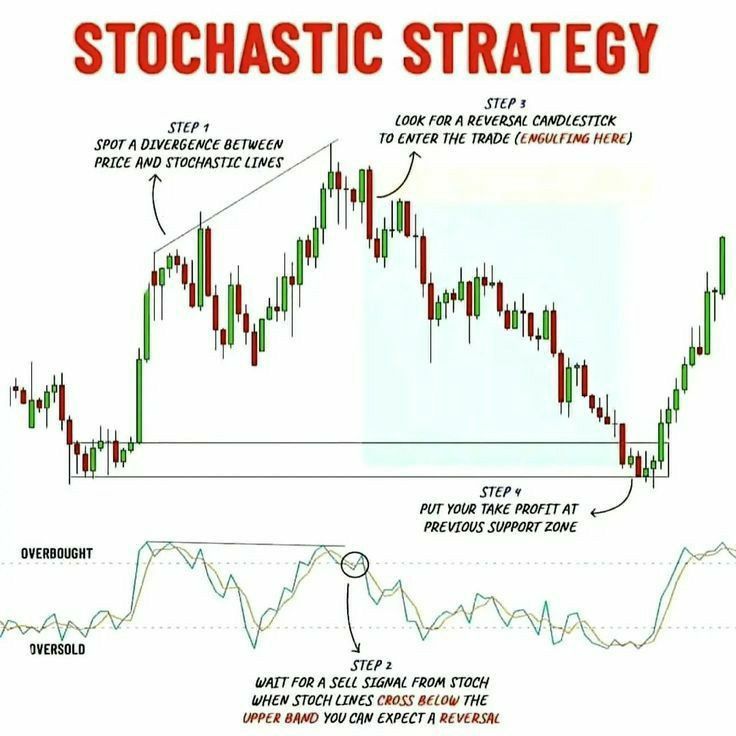
- It’s often used to spot potential trend reversals or entry/exit points.
Typical usage
- Traders watch for crossovers between %K and %D lines for buy/sell signals.
- Also, look for divergences between price and the oscillator to spot weakening trends.
Notes
- %K and %D are the two main lines used to generate signals:
- %K — The Fast Stochastic Line
- %D — The Slow Stochastic Line
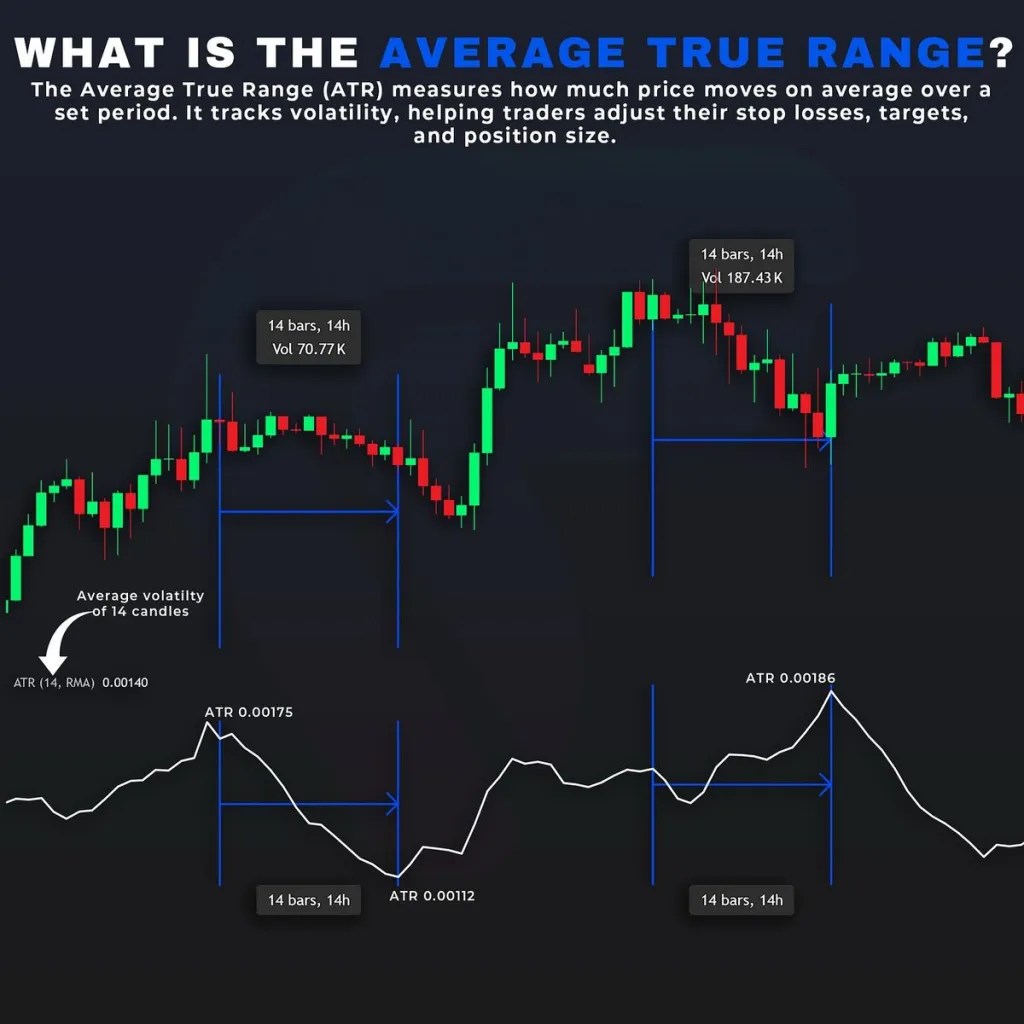
Average True Range (ATR)
Average True Range (ATR) is a technical analysis indicator that measures market volatility.
- It was introduced by J. Welles Wilder Jr. in his 1978 book New Concepts in Technical Trading Systems.
- ATR shows how much an asset’s price moves, on average, during a given period.
- It helps traders understand the degree of price fluctuations or volatility.
How is ATR calculated
- True Range (TR) for each period is the greatest of:
- Current High − Current Low
- Absolute value of (Current High − Previous Close)
- Absolute value of (Current Low − Previous Close)
- Then, ATR is the moving average (usually 14 periods) of the True Range values.
Why use ATR
- It tells you how much the price typically moves, regardless of direction.
- Higher ATR = higher volatility (bigger price swings).
- Lower ATR = lower volatility (smaller price movements).
- Traders use ATR for:
- Setting stop-loss orders to avoid getting stopped out by normal volatility.
- Identifying periods of high or low market volatility.
- Confirming breakouts or trend strength.
Volume indicators
Volume indicators are tools used in technical analysis to measure and analyze the amount of a security (like stocks, forex, crypto) traded during a specific period of time.
What do Volume Indicators tell you
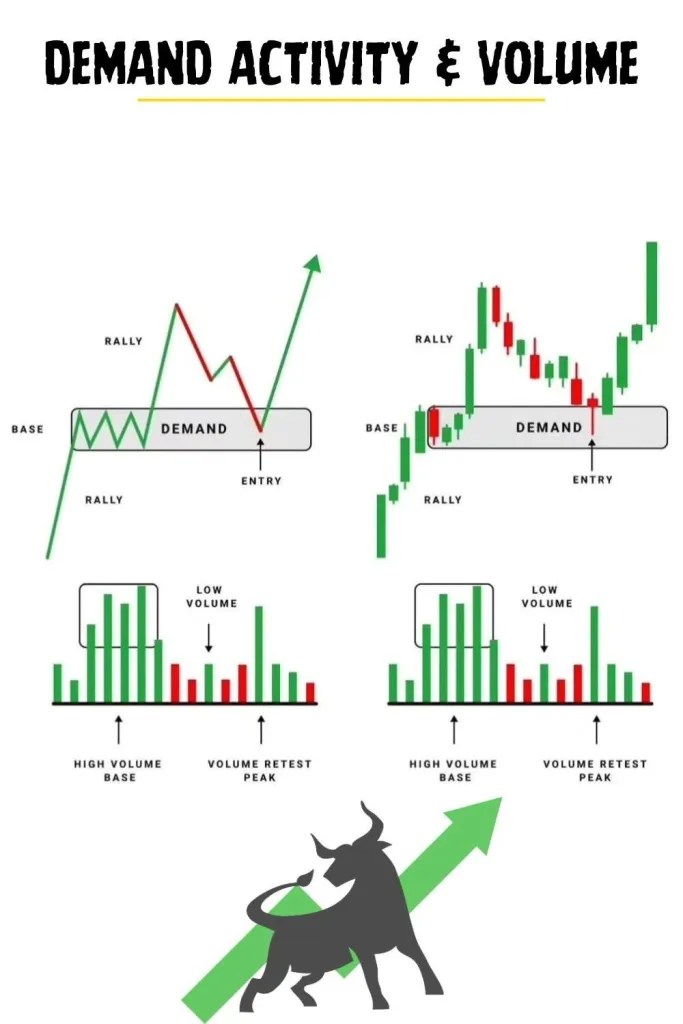
- Trading activity strength: They show how strong or weak a price movement is by looking at the number of shares/contracts traded.
- Confirm trends: High volume during a price rise can confirm a strong uptrend, while low volume might indicate weakness.
- Spot reversals or breakouts: Sudden spikes or drops in volume often precede or accompany major price changes.
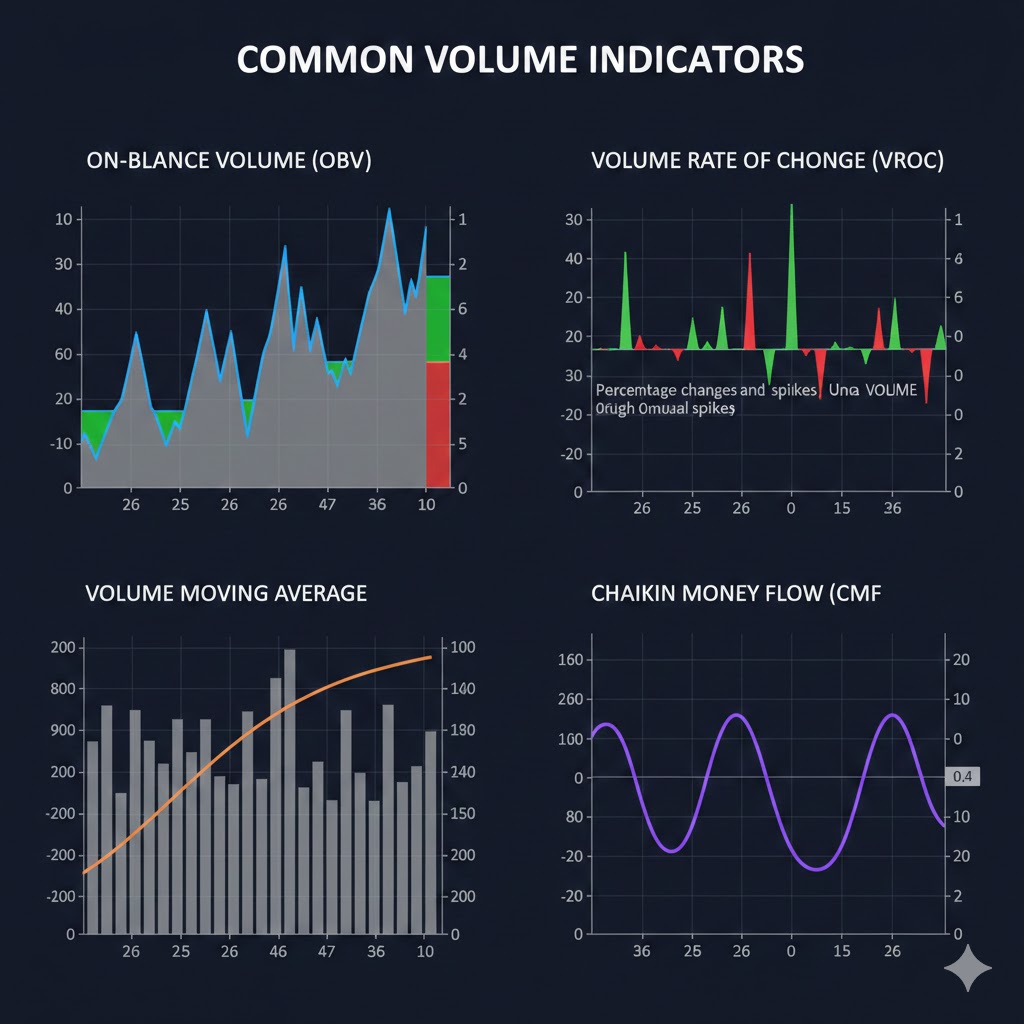
Common Volume Indicators
- On-Balance Volume (OBV):
It adds volume on up days and subtracts volume on down days to show cumulative buying or selling pressure. - Volume Moving Average:
Smooths volume data over a period (like 20 days) to identify trends in trading activity. - Volume Rate of Change (VROC):
Measures the percentage change in volume between two periods to detect unusual volume spikes. - Chaikin Money Flow (CMF):
Combines price and volume to show buying or selling pressure over a period.
Important notes
These indicators are most effective when the market is moving sideways.