Support and Resistance are core concepts in technical analysis used to identify key price levels where the market tends to react.
Support
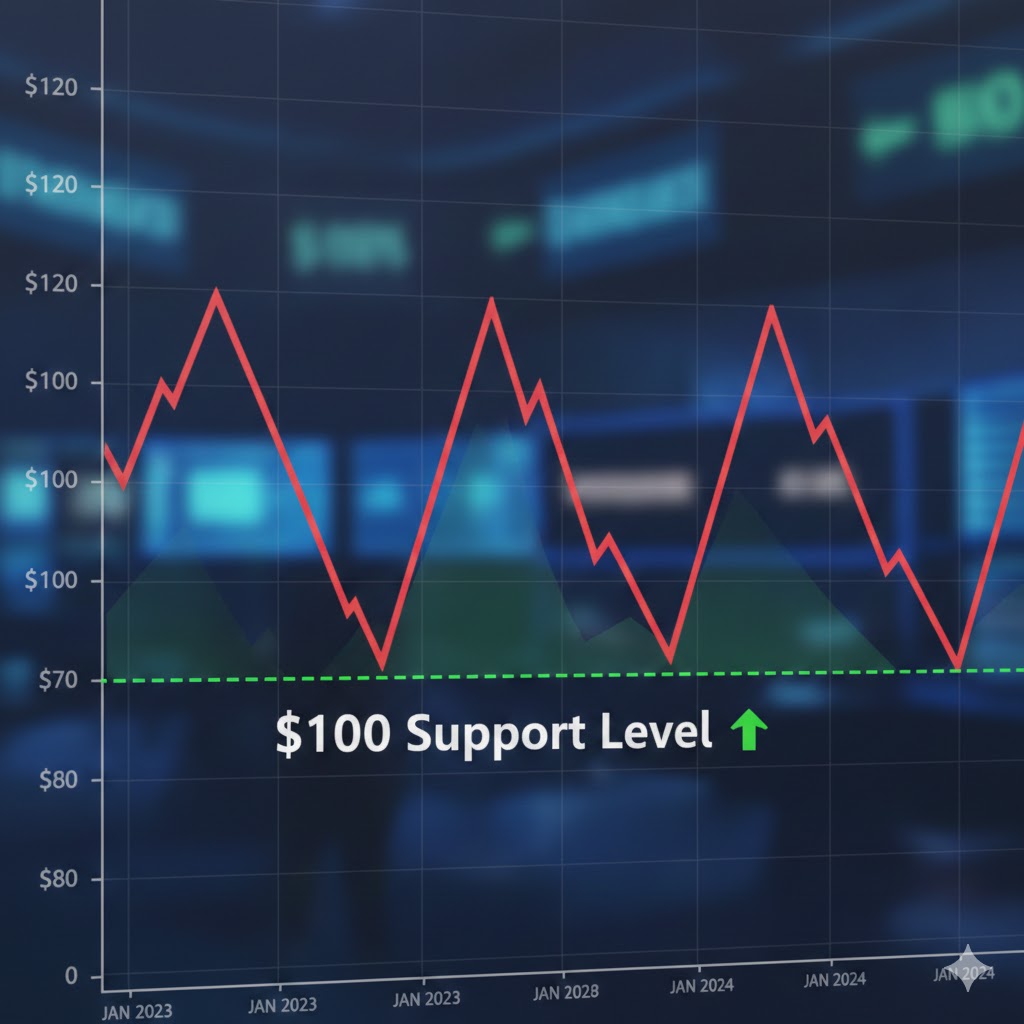
Support is a price level where buying interest is strong enough to stop or slow down a price decline.
At support:
- Demand > Supply
- Price often bounces upward
- Buyers consider the price “cheap” or attractive
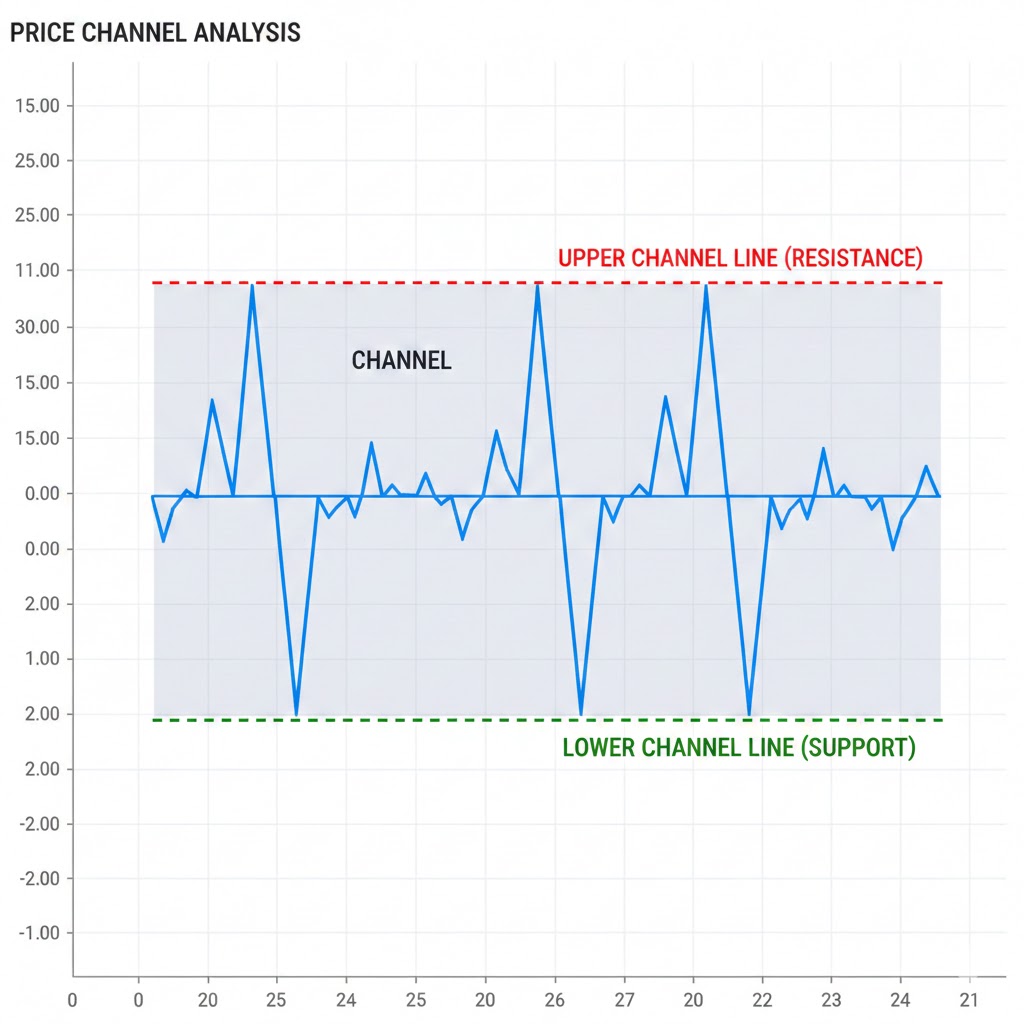
Resistance
Resistance is a price level where selling pressure is strong enough to stop or slow down a price increase.
At resistance:
- Supply > Demand
- Price often pulls back downward
- Sellers consider the price “expensive”

Why Support & Resistance Matter
They help traders:
- Identify entry points (buy near support, sell near resistance)
- Set stop-loss and take-profit levels
- Understand market psychology
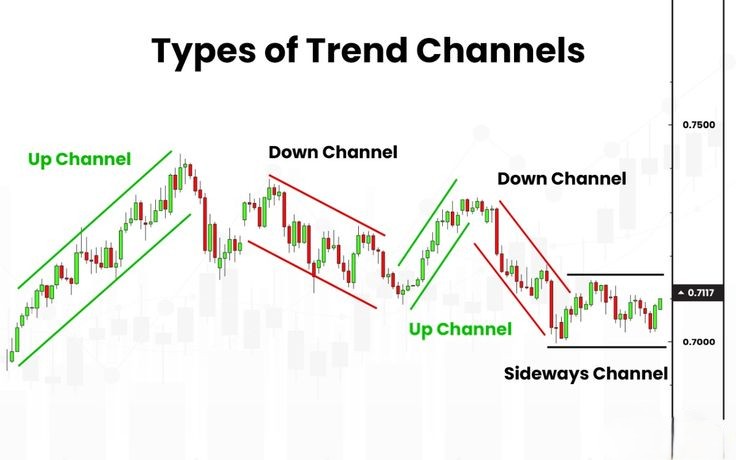
- Anticipate breakouts or reversals
Key Characteristics
- Support and resistance are zones, not exact lines
- Old support can turn into resistance, and vice versa
- Stronger when tested multiple times
- More reliable on higher timeframes