Tag: S&P500

  • S&P 500: Close Below 6,780 Signals a 60% Chance the Rally Has Ended

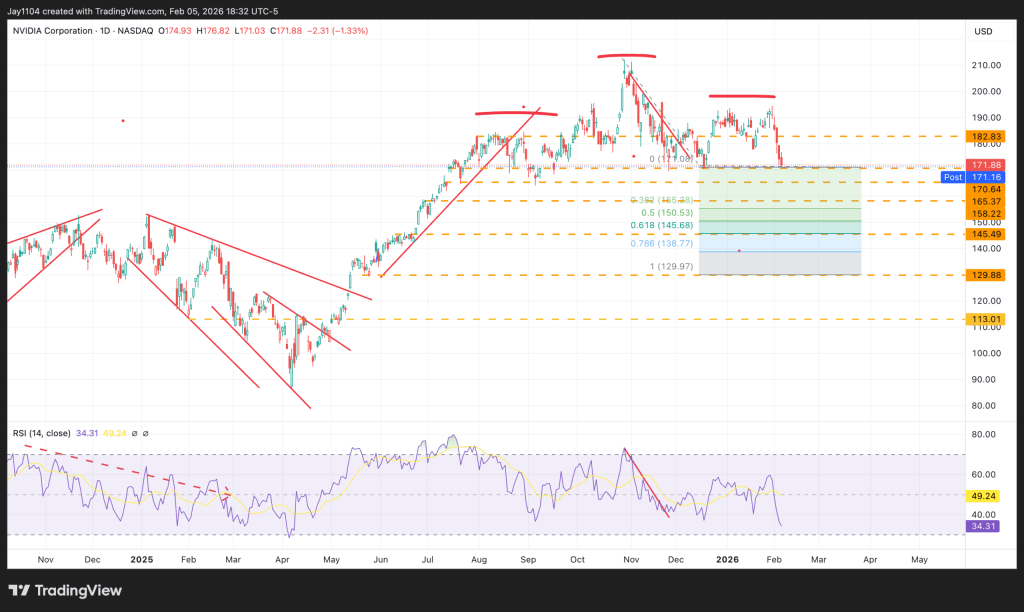
    The Elliott Wave (EW) framework seeks to measure and interpret investor sentiment, which unfolds in recognizable wave patterns. These waves can span extremely short periods—such as minutes—or stretch across decades and even centuries. At its core, the pattern reflects a “three steps forward, two steps back” progression. Because this structure repeats across multiple timeframes, it is considered fractal in nature.

    Given that markets are non-linear, stochastic, and probabilistic, Elliott Wave analysis does not predict certainties but instead identifies the most probable path forward—so long as key price levels remain intact. If those levels are breached—such as a downside break signaling a potential top—the outlook shifts, providing a clear framework for adjusting positions to protect profits or limit losses.

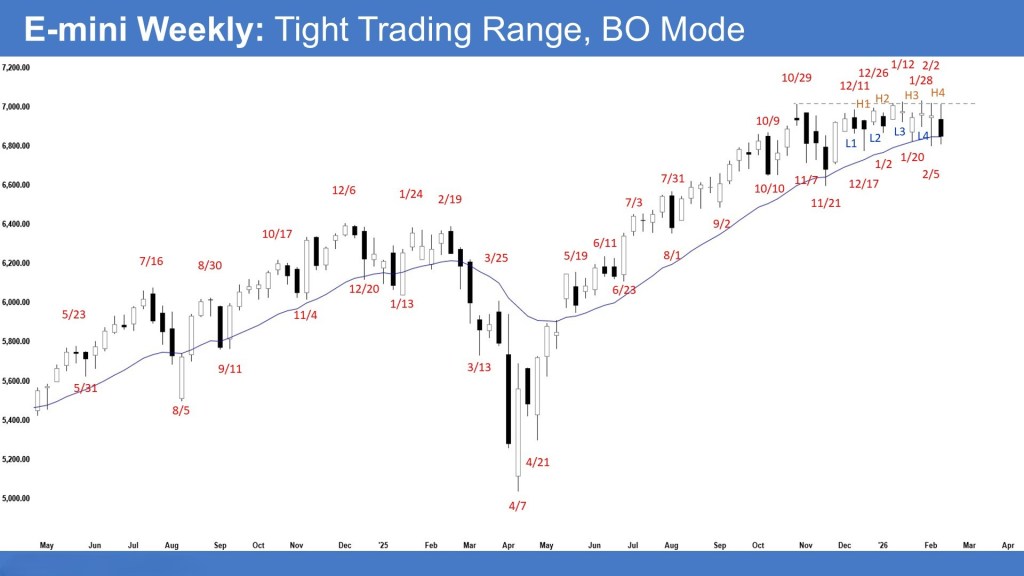
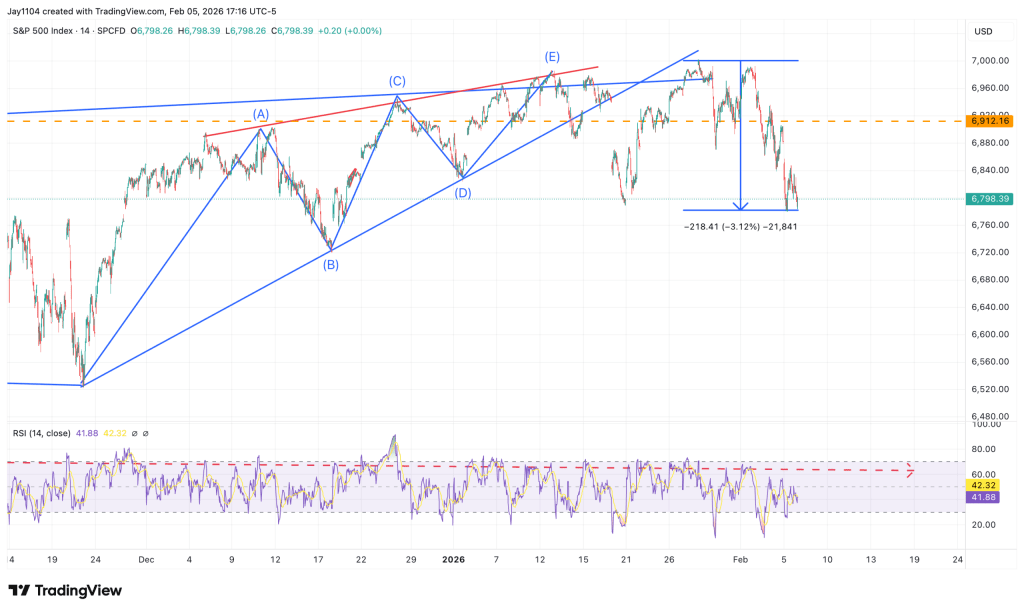
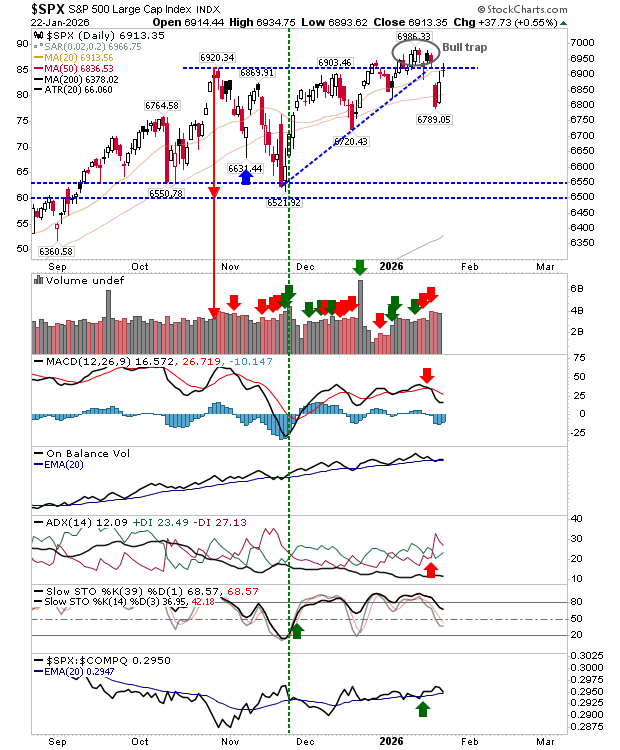
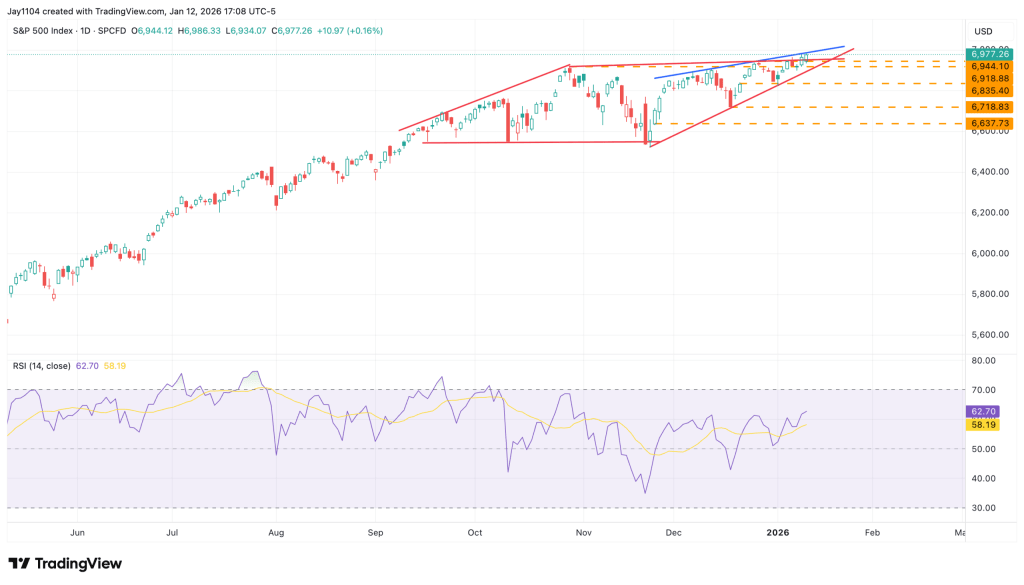
    Turning to the S&P 500, we have been monitoring an advance labeled green Wave 5, forming what appears to be an overlapping ending diagonal (ED) since the November 2025 low (green Wave 4). As illustrated in Figure 1, we first identified this developing structure in mid-December and have been tracking its progression closely to assess how the pattern ultimately resolves.

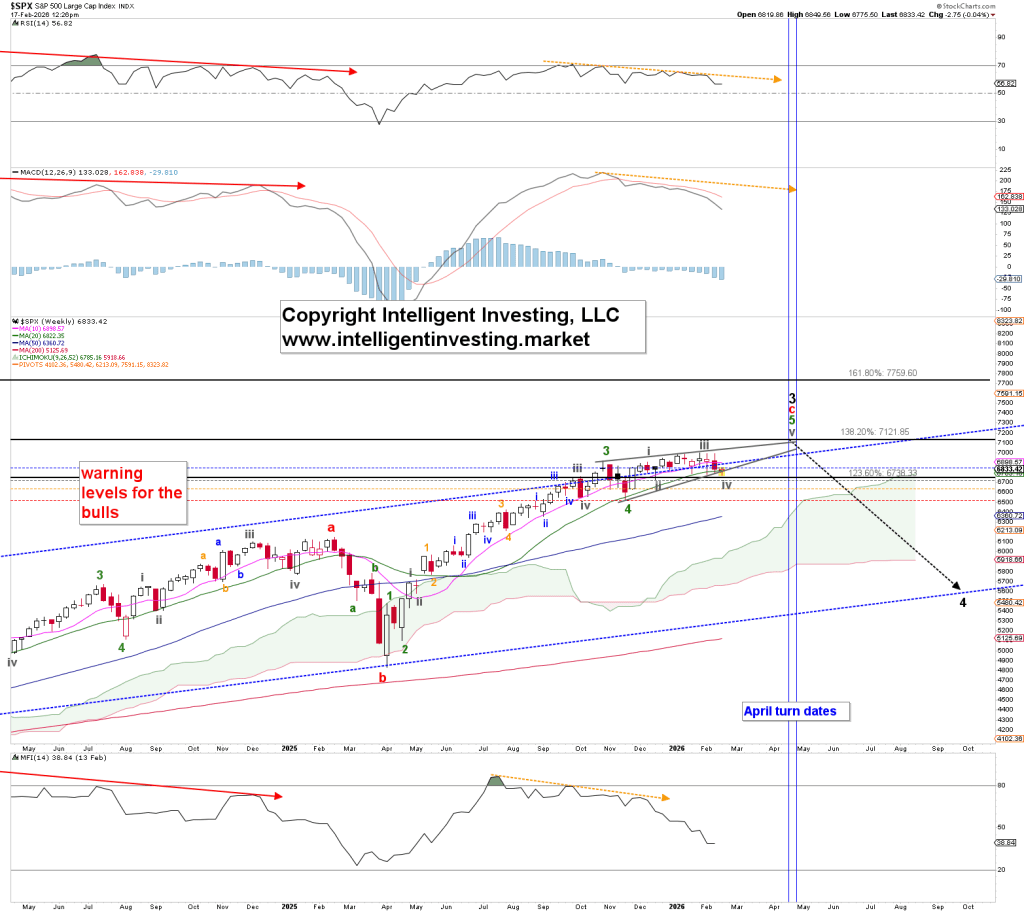
    Figure 1. Intermediate-term Elliott Wave count for the S&P 500 (SPX).

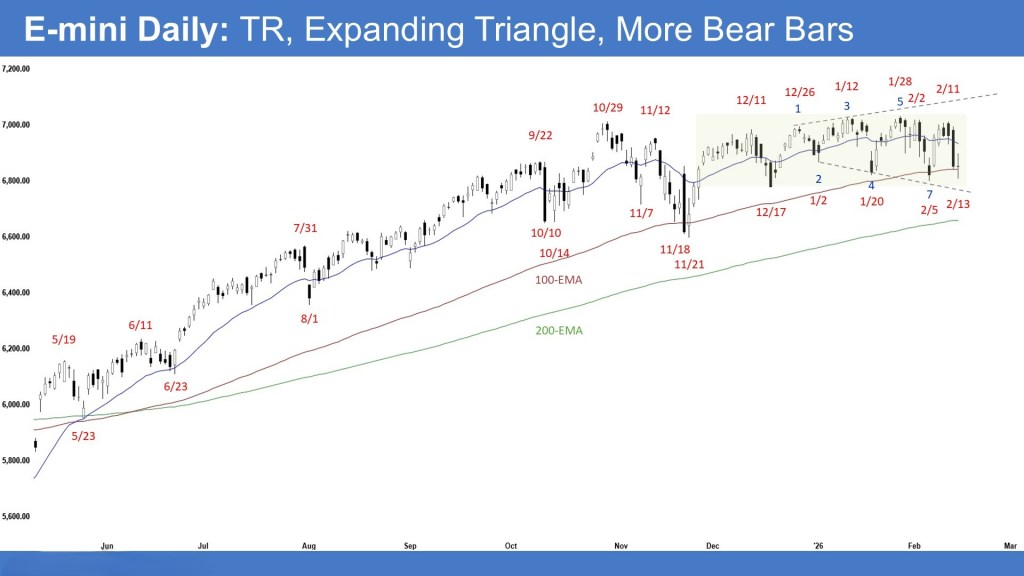
    An ending diagonal is made up of five overlapping waves—here labeled gray Wave i through v. Importantly, each of those gray waves unfolds as its own three-wave structure. Three-wave patterns are notoriously difficult to forecast, and the current sideways action in the index reflects that overlapping, indecisive character. (See Figure 2.)

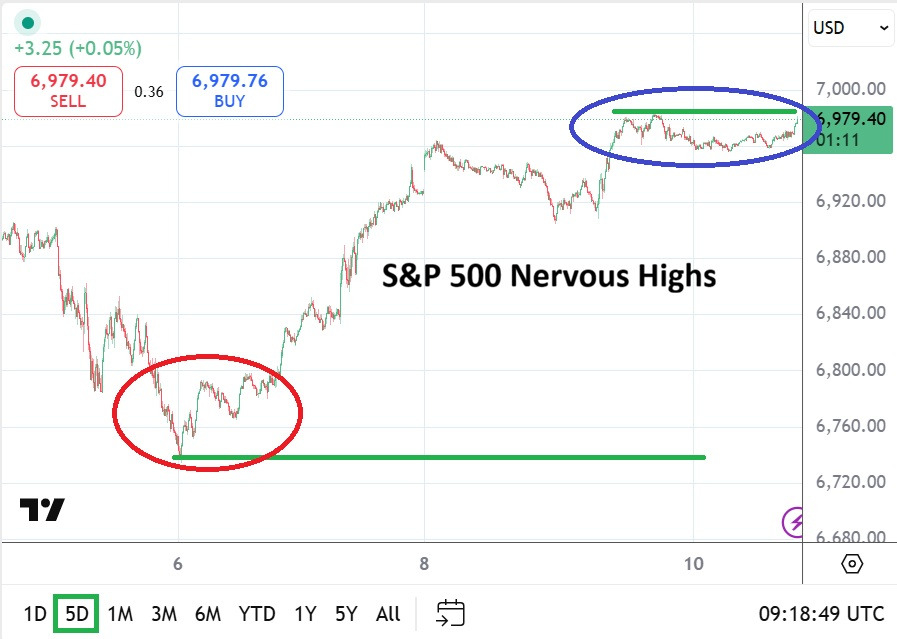
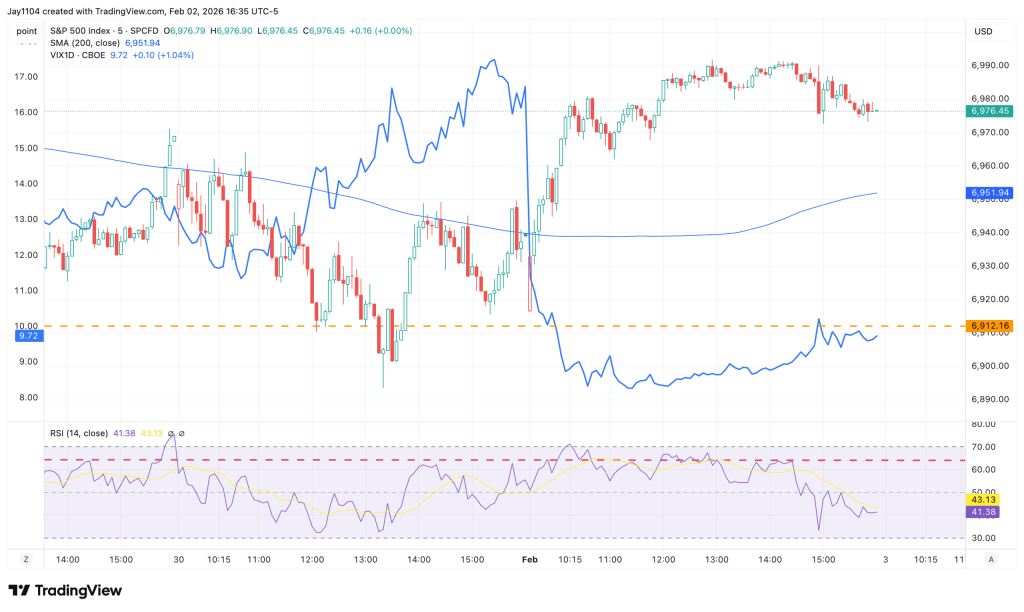
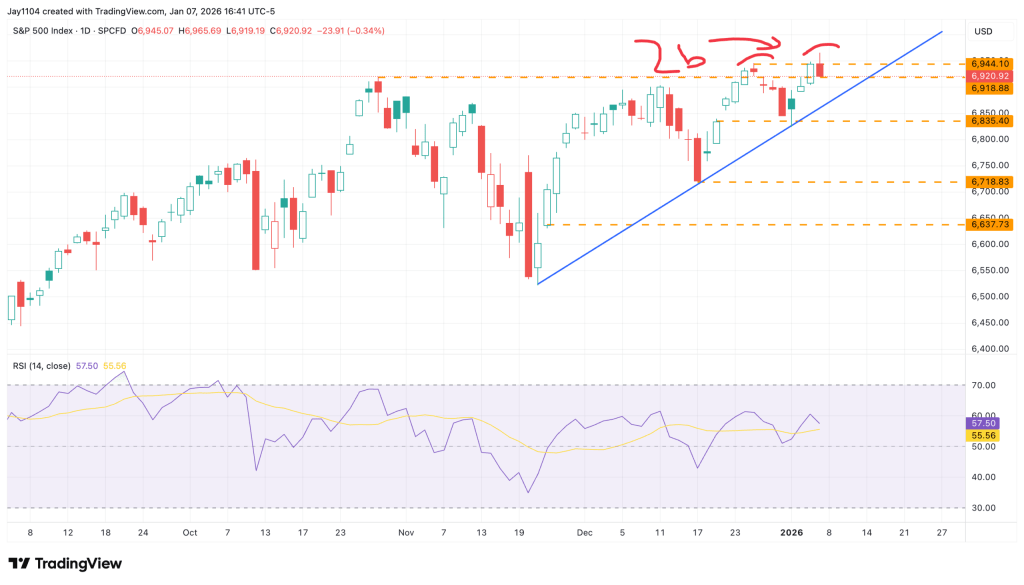
    At present, the S&P 500 is trading near the same levels seen in late October. The 6,985 area has been tested ten times (red arrows), while support around 6,780 has held on four occasions (green arrows). This repeated interaction with resistance and support suggests a developing range.

    Range-bound conditions tend to frustrate traders because the absence of a clear directional trend makes forecasting more challenging. From a symmetry standpoint, an upside breakout projects toward approximately 7,190 (6,985 + 6,985 − 6,780), highlighted by the green box. Conversely, a breakdown below support would imply a downside target near 6,575 (6,780 − 6,985 + 6,780), marked by the red box.

    With today’s price action, the bulls appear to be on the brink. However, if the index manages to close higher, a positive divergence could form on the daily RSI(5) (green arrow), signaling that downside momentum may be fading and giving way to emerging upside strength.

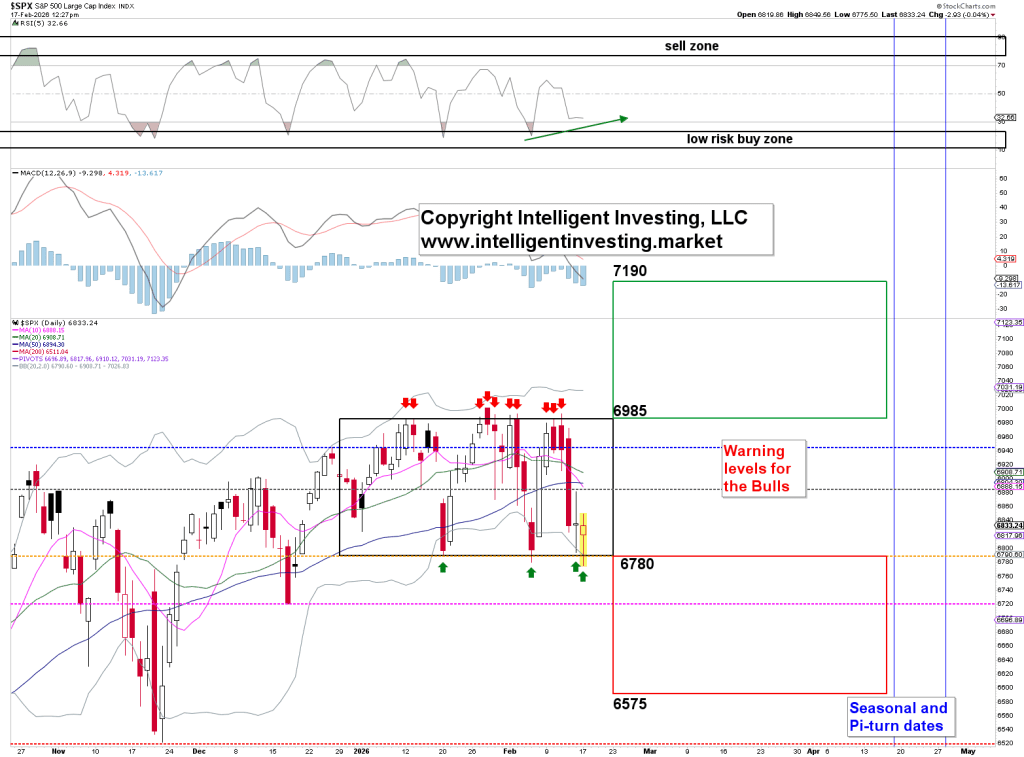
    Figure 2. The S&P 500 since October 2025 has largely traded within a defined range.

    As noted earlier, Elliott Wave analysis outlines the most probable path forward—provided key price levels remain intact. Once those levels are breached, the outlook shifts, giving traders a clear signal to protect gains or limit losses.

    In this case, the pivotal level is the November low at 6,521. A decisive break beneath that threshold would signal that the ending diagonal has completed and that a larger corrective phase—black Wave 4 in Figure 1—is underway, with a preferred target zone between 5,500 and 6,125, ideally toward the upper end of that range.

    For now, the focus remains on 6,780. If the bulls can defend that level—our third warning threshold—we can still allow for a final gray Wave v advance toward roughly 7,120–7,190, potentially extending into the April turn window. However, a daily close below 6,780 raises the probability to about 60% that the broader uptrend has already topped.

    Should support fail, attention quickly shifts to 6,575 as the next downside level to monitor.

    Sources: Arnout ter Schure

  • Bears in the S&P 500 E-Mini are aiming for a downside breakout below key support.

    The S&P 500 E-mini bears are targeting a decisive breakdown below the February 5 low and the 20-week EMA, followed by strong and sustained selling pressure. In contrast, bulls want the 20-week EMA to hold as support, and if prices decline, they are looking to the November 21 low as a key support level.

    S&P 500 E-Mini Futures – Weekly Chart

    This week’s candlestick formed an inside bear bar that closed in the lower half of its range while testing the 20-week EMA. As mentioned last week, the market was likely to continue moving sideways in the near term, and so far it remains confined within an 11-week tight trading range.

    From the bearish perspective, the chart shows a wedge top (December 11, December 26, and January 12), a double top (October 29 and January 28), and a smaller double top (January 12 and January 28). Bears want the October 29 high to serve as resistance. Their goal is a strong breakout below the February 5 low and the 20-week EMA, followed by continued selling that could project a measured move down toward 6,500, based on the height of the 11-week range. To shift the market into an Always In Short condition, bears need consecutive strong bear bars closing well below the 20-week EMA. If the market moves higher, they prefer weak follow-through buying to raise the probability of a failed breakout.

    Bulls, on the other hand, see a large double-bottom bull flag (December 17 and February 5), along with a High 4 buy setup. They need a powerful breakout above the January 28 high with sustained follow-through to increase the likelihood of trend continuation, targeting a measured move toward 7,300, based on the range height. Bulls want the 20-week EMA to hold as support, and if prices fall, they expect the November 21 low to provide backing.

    The market has traded in a tight range for 11 weeks, reflecting a balance between buyers and sellers as bearish pressure has caught up with the prior uptrend. Over the past two weeks, bulls have been unable to break above previous highs and have seen progressively lower closes within the range.

    Until a decisive breakout occurs, traders may continue to apply a Buy Low, Sell High strategy within the range. Market participants will watch whether bears can push through the bottom of the 11-week range with strong follow-through selling, or whether bulls can retest and break above the all-time high. However, even if a new high is reached, lack of sustained buying would increase the risk of a failed breakout.

    Alternatively, the market may continue to consolidate around the October 29 high. Most traders will likely wait for a clear breakout with strong follow-through—either above the all-time high or below the 20-week EMA—before committing aggressively. The longer price stalls near the October 29 high without breaking higher, the greater the probability of a deeper pullback.

    Daily S&P 500 E-Mini Chart

    The market edged higher early in the week. Although Tuesday and Wednesday opened with gap-ups, both sessions reversed and closed as bear bars. On Thursday, a large bear bar formed, testing the 100-day EMA, and Friday printed a doji, signaling hesitation.

    Last week, traders were monitoring whether price would stall near the 20-day EMA and develop a second sideways-to-down leg, or whether bulls could produce enough follow-through buying to push to new all-time highs. So far, price action is pausing around both the 20-day EMA and the all-time high zone.

    From the bullish perspective, the chart shows a large double-bottom bull flag (December 17 and February 5), a wedge bull flag (January 2, January 20, and February 5), and a smaller double bottom (February 5 and February 13). Bulls are aiming for a decisive breakout above the January 28 high with sustained buying momentum, targeting a measured move toward 7,300 based on the height of the 11-week range. If the market declines, they want the November 21 low or the 200-day EMA to provide support. To improve the odds of a successful breakout and renewed uptrend, bulls need consecutive strong bull bars.

    Bears, meanwhile, want the 20-day EMA to cap price as resistance. Their objective is a clear breakdown below the 11-week trading range, with a projected move toward 6,500 based on the same range measurement. To shift the market into an Always In Short condition, they need consecutive strong bear bars breaking below the December 17 low and the 100-day EMA. If the market rallies to a new all-time high, bears prefer to see weak follow-through buying to raise the likelihood of a failed breakout.

    The market continues to trade within a range that began in late November, with bulls seeking an upside breakout and bears pushing for a downside resolution. Since late December, price action has shaped an expanding triangle, which can serve as either a continuation or reversal pattern and often traps traders with false breakouts before reversing.

    Over the past two weeks, bear bars have been more pronounced than bull bars, suggesting gradually increasing and cumulative selling pressure. Traders are closely watching whether the market keeps stalling around the 20-day EMA and the all-time high area. A pattern of slightly lower highs accompanied by stronger bear bars would increase the probability of a downside breakout. Conversely, if bulls manage a breakout to new highs, traders will look for strong follow-through; without it, the risk of a failed breakout rises.

    Until a decisive move with sustained momentum occurs in either direction, traders may continue applying a Buy Low, Sell High (BLSH) approach — buying near the lower third of the range and selling near the upper third.

    Sources: Al Brooks

  • S&P 500: Market volatility widens as AI concerns trigger a valuation reset, says Deutsche Bank.

    Analysts at Deutsche Bank say mounting concerns about artificial intelligence have sparked a dramatic repricing in global equities, wiping out more than $1 trillion in market value and spreading volatility far beyond the technology sector. They note that softer U.S. economic data and mixed growth signals also contributed to a strong rally in Treasuries and weekly declines in the S&P 500.

    AI fears deepen and broaden the sell-off

    Over the past two weeks, markets have erased well over $1 trillion in global equity value amid worries that AI could fundamentally alter business models and squeeze profit margins across industries ranging from software and legal services to IT consulting, wealth management, logistics, insurance, real estate brokerage, and commercial property.

    What began as tech-driven volatility earlier in the month evolved into a more indiscriminate market downturn last week. The low point came on Thursday with a sharp drop in software stocks, but losses were widespread. Companies in wealth management, real estate, and financials posted double-digit declines, highlighting the breadth of the pullback.

    Market breadth reflected the shift: the equal-weighted S&P 500 fell 1.37% on Thursday before ending the week up 0.29% (including a 1.04% gain on Friday). Overall, major U.S. indices closed the week weaker, with the S&P 500 down 1.39%, the Nasdaq Composite off 2.10%, and the “Magnificent 7” sliding 3.24%.

    While AI-related fears dominated sentiment, a busy run of U.S. economic data also influenced markets. Early-week releases—including flat December retail sales, a softer fourth-quarter Employment Cost Index, and downgraded Q4 growth estimates from the Atlanta Fed—helped drive Treasury yields lower across the curve.

    Sources: Fxstreet

  • S&P 500: Technical Pressures Mount Behind a Composed Surface

    The S&P 500 climbed early in the session, gaining roughly 50–60 basis points at its intraday peak, but those advances faded as the volatility crush quickly ran out of steam. As mentioned previously, the 1-day VIX had closed at 13.6—levels that typically coincide with 50–60 basis-point moves when volatility compresses. However, the 1-day VIX opened near 9, steadily increased during the session, and finished around 12, making the volatility unwind even more short-lived than anticipated.

    More notably, subtle signs of stress are emerging beneath the surface. The VVIX—which tracks implied volatility of the VIX itself—moved higher, and the S&P 500 left-tail index also rose. While the index may appear calm on the surface, these indicators suggest that underlying volatility is building and becoming harder to ignore.

    Single-stock volatility, reflected by VIXEQ, remains unusually elevated compared with the headline VIX, which measures index-level volatility. The spread between the two sits near 21.5. Historically, when this gap widens to such levels, it has often preceded meaningful market pullbacks.

    Although the surface looks stable, significant shifts are occurring underneath, serving as a cautionary signal. As earnings season progresses, implied volatility for individual stocks should continue to ease, as is typical. If that happens, the spread is likely to compress. That normalization process may require the unwinding of positioning, which could trigger a sharp downside move. This risk has been a recurring theme in prior commentary.

    Meanwhile, several sectors appear technically stretched. The Materials ETF (XLB) now shows a weekly RSI of 77 and is trading above its upper weekly Bollinger Band—classic overbought signals that suggest near-term vulnerability.

    The Industrials ETF (XLI) is even more extended, trading above its upper monthly Bollinger Band with an RSI of 78.3. Historically, similar conditions—in 2007, 2013–2014, and 2018—have led to prolonged consolidation phases. When monthly momentum reaches these extremes, sustaining further upside typically becomes difficult without first easing overbought pressures.

    The complication is that Industrials, Materials, Staples (XLP), and Energy (XLE) have been key drivers of the equal-weight S&P 500 (RSP) outperforming the cap-weighted index. This rotation helps explain why the headline S&P 500 often appears relatively steady: leadership shifts from one group to another, offsetting weakness elsewhere. The large-cap “Mag 7” stocks alone are no longer carrying the market.

    One possible factor behind this dynamic is the growing influence of zero-DTE options and heavy trading in short-dated contracts. While definitive proof is lacking, the pattern suggests dealer hedging flows may be shaping price action around heavily concentrated strike levels.

    For instance, if substantial open interest exists at a strike like 6,950, positioning could effectively pin the index near that level. As a result, underlying sector rotation may occur to keep the index aligned with options pricing. This could drive increased dispersion beneath the surface, with individual sectors making larger moves even as the broader index appears relatively unchanged.

    Sources: Michael Kramer

  • S&P 500 Analysis: Record Highs Amid Cautious Optimism and Active Buying

    Despite ongoing noise around elevated valuations, rapid price swings, and a general sense of unease surrounding major U.S. equity indices, the S&P 500 continues to hover near record territory. Futures have edged higher again this morning, with the index trading around the 6,979.50 level.

    Early last Friday, the S&P 500 dipped toward the 6,738.00 area, marking its lowest point since mid-December. However, a swift rebound restored upside momentum, pushing the index back within striking distance of all-time highs. The 7,000.00 mark remains a powerful psychological milestone for investors and short-term traders alike, especially those closely monitoring daily price action.

    The 7,000 Milestone in a Cautious Environment

    Although the S&P 500 typically moves less aggressively than the Nasdaq 100, it remains a popular vehicle for speculative positioning, particularly among retail traders using CFDs. Recent weeks have brought heightened volatility, yet the index has consistently stayed near the 7,000.00 threshold—a level it briefly surpassed in late January and early February.

    Still, maintaining sustained breakouts has proven challenging. For bullish conviction to strengthen, traders may look for a decisive and lasting move above 7,000.00. Until such confirmation materializes, choppy and range-bound conditions are likely to persist—especially with key economic releases on deck, including Retail Sales, employment data, and Friday’s Consumer Price Index report.

    Short-Term Positioning Amid Lingering Caution

    While it may seem contradictory to speak of nervousness with the index near record highs, institutional sentiment appears notably guarded. This caution could serve as a defensive posture in case markets experience renewed downside volatility, similar to the sharp pullbacks seen in recent weeks.

    Although the S&P 500’s ability to test upper-tier levels is encouraging, persistent headwinds have so far prevented a confident breakout into fresh territory. A series of strong U.S. economic readings may be needed to fuel a sustained advance. Whether that catalyst emerges remains to be seen.

    S&P 500 Short-Term Outlook:

    • Current Resistance: 6,982.00
    • Current Support: 6,972.00
    • Upside Target: 7,015.00
    • Downside Target: 6,957.00

    Sources: Robert

  • U.S. stock futures edged up as investors awaited the postponed employment report.

    U.S. equity futures moved slightly higher Tuesday night following a modest decline in the regular trading session, as investors assessed softer retail sales figures and looked ahead to a series of postponed U.S. economic reports due later in the week.

    By 20:11 ET (01:11 GMT), S&P 500 futures rose 0.2% to 6,978.25, Nasdaq 100 futures advanced 0.3% to 25,291.75, and Dow Jones futures added 0.2% to 50,385.0.

    Wall Street declined ahead of the upcoming jobs report, while the Dow posted a fresh record closing high.

    During Tuesday’s regular session, the S&P 500 declined 0.3% and the Nasdaq Composite dropped 0.6%, pressured by losses in technology and other growth-oriented stocks.

    In contrast, the Dow Jones Industrial Average managed a slight advance, closing above the 50,000 mark at a new record high for the third consecutive session.

    Earlier, investors reacted to U.S. retail sales figures showing flat monthly consumer spending, missing expectations. The softer data fueled worries that elevated borrowing costs may be starting to curb household demand, despite broader signs of economic resilience. This strengthened expectations that the Federal Reserve could move toward rate cuts later this year if growth continues to ease.

    Attention now shifts to the delayed monthly employment report, set for release Wednesday following the recent government shutdown. The data will offer the first detailed snapshot of labor market conditions in weeks, as policymakers monitor for indications of cooling.

    Markets are also awaiting the postponed U.S. consumer price index report on Friday, which could play a pivotal role in shaping near-term market sentiment.

    Robinhood and Lyft slide in after-hours trading.

    In company-specific developments, Robinhood Markets (NASDAQ: HOOD) fell 7.5% in after-hours trading after posting earnings that came in below expectations, as weaker-than-anticipated revenue and user figures pressured the stock.

    Shares of Lyft (NASDAQ: LYFT) plunged more than 17% in extended trading after the ride-hailing firm reported results that missed forecasts, further weighing on consumer-focused tech stocks.

    Meanwhile, Ford Motor Company (NYSE: F) delivered quarterly earnings that fell short of Wall Street estimates, citing costs related to its electric vehicle operations and ongoing supply chain challenges. Despite the miss, the automaker projected improved earnings in 2026. Ford shares rose 0.5% in after-hours trading.

    Sources: Ayushman Ojha

  • Wall Street futures edge higher on tech recovery ahead of delayed jobs and CPI data

    U.S. stock futures ticked higher on Sunday evening after Wall Street mounted a strong rebound late last week, even as investors remained cautious ahead of delayed U.S. employment and inflation data scheduled for release in the coming days.

    S&P 500 futures rose 0.4% to 6,978.75 points, while Nasdaq 100 futures advanced 0.6% to 25,319.0 points by 19:12 ET (00:12 GMT). Dow Jones futures were up 0.2% at 50,327.0 points.

    Wall Street bounced back late last week as AI disruption fears eased

    Wall Street’s major indexes surged on Friday after several days of losses, as investors stepped in to scoop up beaten-down technology stocks and found reassurance in easing bond yields.

    The S&P 500 advanced 2%, while the Nasdaq Composite climbed 2.2%. The Dow Jones Industrial Average rose 2.5%, notching its first close above the 50,000-point mark.

    Gains were led by chipmakers and AI-linked stocks, which had faced intense selling pressure amid concerns over technology disruption and lofty valuations.

    Earlier in the week, the technology sector had suffered sharp declines as investors rotated away from high-growth names, worried that rapid advances in artificial intelligence could upend software business models and squeeze profit margins.

    For the week as a whole, the Dow gained roughly 2.5%, supported by strength in industrial and financial stocks. The S&P 500 slipped 0.1%, while the Nasdaq fell about 2%, underscoring the sector’s pronounced weakness.

    Jobs, inflation data in focus with major earnings ahead

    Market attention is shifting toward key U.S. economic data releases that were postponed due to the partial government shutdown.

    The closely watched January employment report, originally due last week, is now scheduled for release on Wednesday. A private-sector jobs report published last week showed weaker-than-expected hiring, sparking concerns that labor market momentum may be starting to cool after months of strength.

    Focus will then turn to January consumer price index data, set for release on Friday following the shutdown-related delay. The inflation report will be closely examined for indications that price pressures are easing enough to give the Federal Reserve scope to consider interest rate cuts later this year.

    Corporate earnings may also influence markets in the days ahead, with companies such as Coca-Cola Co (NYSE:KO) and Ford Motor Company (NYSE:F) among the notable firms due to report quarterly results this week.

    Sources: Ayushman Ojha

  • Amazon shares slide after 2026 capex forecast far exceeds expectations

    Amazon.com (NASDAQ: AMZN) reported quarterly revenue that topped expectations on Thursday, but markets focused on the company’s 2026 capital expenditure forecast of roughly $200 billion—far above what analysts had anticipated.

    Shares ended Friday down 5.55%, though they pared earlier losses as a broad rally on Wall Street boosted risk assets.

    The results arrive amid a notable rotation out of technology stocks into other sectors. Investor sentiment has shifted from viewing the tech sector broadly as an AI beneficiary to a more selective approach, with clear winners and losers emerging. Software firms have been singled out as laggards, with weakness spreading to chipmakers and the wider tech space.

    Concerns around stretched valuations and aggressive spending plans have also weighed on sentiment. Amazon’s projected $200 billion in 2026 capex significantly exceeded the consensus estimate of $146.11 billion.

    Despite those concerns, Morgan Stanley analyst Brian Nowak struck an optimistic tone, noting that AWS is gaining momentum with stronger growth ahead, while Amazon’s retail business continues to improve efficiency. Although the company is ramping up investment across AWS, Retail, and its low-Earth-orbit initiatives, Nowak highlighted Amazon’s solid history of delivering returns on invested capital, keeping the firm bullish on what it views as an underappreciated GenAI leader.

    Amazon’s guidance followed closely on the heels of Alphabet (NASDAQ: GOOGL), which also surprised investors earlier in the week with plans to spend as much as $185 billion in capital expenditures in 2026.

    On the earnings front, Amazon narrowly missed profit expectations, posting earnings of $1.95 per share—one cent below forecasts—on revenue of $213.39 billion for Q4 2025, representing a 13.6% year-over-year increase. Revenue exceeded the consensus estimate of $211.27 billion.

    Emarketer principal analyst Sky Canaves described the results as slightly mixed, citing strong overall revenue growth and a notable acceleration in the cloud business, which had been closely watched by investors.

    Looking ahead, Amazon forecast first-quarter 2026 revenue in the range of $173.5 billion to $178.5 billion, compared with analyst expectations of $175.2 billion.

    CEO Andy Jassy said the company plans to invest heavily in areas such as AI, custom chips, robotics, and low-Earth-orbit satellites, adding that Amazon expects these investments to generate strong long-term returns on invested capital despite the elevated spending outlook.

    An overview of AWS

    For Amazon, one of the Magnificent Seven, Amazon Web Services (AWS) sits at the core of its AI strategy and remains its fastest-expanding business. AWS generated $35.58 billion in revenue in Q4, marking a 23.6% year-over-year increase. Beyond cloud services, the unit includes Amazon’s AI development platforms and infrastructure—such as Bedrock—as well as products like Alexa and Polly.

    According to Emarketer analyst Canaves, AWS delivered an uncommon performance in Q4 by outpacing the advertising segment’s growth while also improving operating margins. Amazon has also deepened its exposure to AI through a substantial investment in Anthropic, the startup behind the Claude AI models.

    Amazon revealed in October that it had added 3.8 gigawatts of cloud computing capacity over the past year—more than any rival provider. CEO Andy Jassy noted during the earnings call that AWS’s power capacity has doubled since 2022 and is expected to double again by 2027.

    UBS has argued that the market is not fully accounting for the implications of Amazon’s aggressive capital expenditure plans. The bank raised its combined CapEx forecast for 4Q25–4Q27 to $344 billion from $300 billion, including an increase in AWS investment estimates from $225 billion to $260 billion.

    UBS analysts Stephen Ju and Vanessa Fong believe Amazon shares remain undervalued, as neither they nor broader markets are factoring in the possibility that AWS revenue could double by 2028. They estimate this scenario could generate an additional $20 billion in free cash flow that year.

    Despite these growth drivers, Amazon’s stock has lagged its Magnificent Seven peers. Shares rose just 5.2% in 2024—the weakest performance among the group—and trailed the S&P 500’s 16.4% gain. Performance in the current year has also been modest, with Amazon up 0.9% year-to-date, compared with the S&P 500’s 0.5% increase.

    While AI continues to attract attention, Amazon’s core business is still its e-commerce, retail, and subscription services—primarily housed in its North America segment. This division posted Q4 revenue of $127.08 billion, up 9.9% year over year.

    Consumer spending faced increasing pressure last year amid economic challenges. The National Retail Federation projects 2025 holiday sales growth of 4.1%, down from 4.3% in 2024, while consumer confidence has recently dropped to its lowest level since May 2014.

    Even so, Amazon’s retail operations showed resilience during the critical holiday season. Canaves noted that profitability in North America improved due to stronger fulfillment efficiency, despite faster delivery rollouts. Meanwhile, Amazon’s AI shopping assistant, Rufus, is gaining adoption and contributing to higher sales among users.

    Sources: Anuron Mitra

  • S&P 500: A Drop Below 6,800 May Signal Further Downside

    It’s striking that the S&P 500 is only about 2–3% below its all-time high given the turmoil seen across other areas of the market. On Thursday alone, silver and bitcoin fell by roughly 20% and 13%, respectively. For the moment, the index is hovering near the 6,800 level, supported by gamma-related positioning, though that support can shift quickly. A break below 6,800 would likely expose the next support zone around 6,700–6,720.

    Based on some of the post-earnings price action late last evening, there is also a meaningful risk that the index opens with a downside gap.

    At present, the VIX remains below the three-month VIX index, indicating that the volatility curve has not yet moved into backwardation. This suggests that implied volatility is increasing across maturities, but the market has not yet experienced a full-fledged spike in fear.

    In addition, the dispersion index minus the three-month implied correlation index is still near the top of its range, indicating that the broader unwind has yet to begin.

    At this stage, NVIDIA (NASDAQ: NVDA) appears to be one of the few pillars supporting the broader market, having held above the $170 level since July. That area represents a key support zone and can reasonably be viewed as the neckline of a potential head-and-shoulders pattern. A decisive break below $170 would likely signal further downside for NVIDIA and could also act as a catalyst for a wider breakdown across the major equity indexes.

    Viewed through a second-order lens, the prevailing narrative suggests that AI could disrupt—or even undermine—the traditional SaaS business model. That naturally leads to a third-order question: if the SaaS model falters, who will be left to purchase AI models from the hyperscalers? And if hyperscalers struggle to earn adequate returns, who ultimately continues to drive demand for GPUs from NVIDIA?

    Ironically—or perhaps predictably—the software sector topped out before NVIDIA did. With software stocks now turning lower, the key question is whether NVIDIA will eventually follow the same trajectory.

    Sources: Michael Kramer

  • Wall Street futures slide after Amazon’s capex guidance hits tech stocks

    U.S. stock index futures slipped on Thursday evening, extending Wall Street’s losses as the selloff in technology shares showed little sign of abating. Amazon.com led declines after forecasting a sharp increase in capital expenditures for 2026.

    Futures weakened after another steeply negative session on Wall Street, where technology stocks fell amid ongoing concerns over AI-driven disruption within the software sector. Investors were also unsettled by elevated spending across the industry, with Amazon’s outlook echoing similar guidance from other major tech firms. By 18:30 ET (23:30 GMT), S&P 500 Futures were down 0.5% at 6,789.25, Nasdaq 100 Futures slid 0.9% to 24,422.0, and Dow Jones Futures fell 0.3% to 48,857.0.

    Amazon plunges 11% after projecting higher-than-expected 2026 capex

    Amazon.com Inc (NASDAQ: AMZN) was among the biggest laggards in after-hours trading, plunging 11% following the release of its December-quarter earnings. The company projected capital expenditures of roughly $200 billion in 2026, far exceeding both last year’s spending and analyst estimates of about $146.1 billion.

    Quarterly profit came in at $1.95 per share, narrowly missing expectations, while the outlook for the current quarter also fell short as the e-commerce giant factored in rising AI-related costs. Revenue from Amazon Web Services—the core of the company’s artificial intelligence strategy—climbed 24% to $35.6 billion, topping analyst forecasts.

    Despite the strong AWS performance, investors were unsettled by the scale of the planned spending, amid growing uncertainty over when heavy AI investments will begin to generate meaningful returns. In sympathy, shares of Microsoft (NASDAQ: MSFT), Alphabet (NASDAQ: GOOGL), and Meta Platforms (NASDAQ: META)—all of which have recently outlined elevated AI spending plans for 2026—fell by as much as 3% in after-hours trade following Amazon’s results.

    Wall Street declines again on heavy tech losses, weak employment figures

    Wall Street benchmarks extended their decline on Thursday, led lower by the Nasdaq Composite, which fell 1.6%. The S&P 500 dropped 1.3%, while the Dow Jones Industrial Average slid 1.2%. Both the Nasdaq and the S&P fell to their lowest levels since late November and mid-December, respectively.

    Technology stocks continued to be the main drag on U.S. equities, as investors grew increasingly concerned about elevated AI-related spending and the potential disruptive effects of artificial intelligence on the software sector. Additional pressure came from disruptions tied to AI’s heavy demand for memory chips. Qualcomm (NASDAQ: QCOM) tumbled 8.5% after warning about the impact of a global memory-chip shortage, while data from Counterpoint Research showed memory-chip prices have surged by as much as 90% quarter-on-quarter so far this quarter.

    Broader economic worries also weighed on sentiment. Data from Challenger indicated that U.S. layoffs in January rose to their highest level since the 2009 financial crisis. Weekly jobless claims came in above expectations, while December job openings data also fell short of forecasts, reinforcing concerns about a slowing labor market.

    Although signs of labor market weakness have raised expectations for additional Federal Reserve rate cuts, investors remained focused on the outlook for monetary policy under Kevin Warsh, President Donald Trump’s nominee to become the next Fed chair. Warsh has been perceived as a less dovish choice, a view that has also weighed on Wall Street sentiment.

    Sources: Ambar Warrick

  • S&P 500: Liquidity Worries Persist Amid Mixed Signals

    Stocks ended lower on Wednesday, though the S&P 500 slipped just 50 basis points. In contrast, the equal-weight S&P 500 ETF (RSP) gained nearly 90 basis points, highlighting a notable degree of dispersion beneath the surface. This divergence was reflected in the Dispersion Index, which climbed to 37.6 and is once again approaching the upper end of its historical range. As earnings season draws to a close, dispersion is likely to ease, with correlations gradually moving higher.

    The spread between the Dispersion Index and the three-month implied correlation index widened on Wednesday. As earnings season comes to an end, this gap is likely to narrow in the coming weeks as dispersion trades begin to unwind and correlations normalize.

    One explanation for the notable strength in Walmart (NASDAQ: WMT) and the broader consumer staples sector may be the rise in implied volatility. While IV typically increases ahead of earnings season, this year it appears to be climbing to levels well above those seen in prior quarters. With Walmart not scheduled to report until February 19 and most retailers releasing earnings later in the cycle, the recent strength in XLP may not reflect a true sector rotation. Instead, it could be driven by the same dispersion dynamics observed ahead of the major technology earnings releases.

    Long-term rates edged higher on Wednesday, with the 30-year yield rising about 2 basis points to 4.92%, once again testing the upper end of its resistance range. Whether it ultimately breaks higher remains uncertain. Fundamentally, yields have had ample justification to move higher for weeks, yet they remain stubbornly range-bound. The 30-year could arguably already be above 5%, but the market continues to wait.

    The latest QRA released Wednesday continues to point to mounting stress at the long end of the curve, though those pressures have yet to fully materialize. The report noted that the Treasury General Account (TGA) is expected to exceed $1 trillion around tax season—roughly $150 billion above current levels. That represents a significant liquidity drain from the system, and based on rough estimates, the Fed’s bill purchases would dilute, rather than offset, that impact.

    Looking ahead, Kevin Warsh’s arrival in May adds another layer of uncertainty around balance-sheet policy. As a result, liquidity conditions are likely to remain tight for some time.

    Sources: Michael Kramer

  • Wall Street futures ticked up after a tech-driven selloff, with focus on Alphabet earnings.

    U.S. stock index futures ticked up slightly on Wednesday night after a weaker close on Wall Street, as technology stocks remained under pressure amid concerns over AI-driven disruption, while investors assessed Alphabet’s earnings report and new labor market data. S&P 500 futures rose 0.3% to 6,923.0, Nasdaq 100 futures advanced 0.4% to 25,088.75, and Dow Jones futures were mostly unchanged at 49,589.0.

    Technology stocks extended their sell-off, while investors turned their attention to Alphabet’s earnings report.

    In regular trading, the S&P 500 and the Nasdaq Composite fell 0.5% and 1.5%, respectively, as renewed selling pressure hit heavyweight technology and AI-related stocks. In contrast, the Dow Jones Industrial Average rose about 0.5% as investors shifted toward defensive and value names.

    Technology and AI shares led the decline, extending a sector-wide selloff that has persisted into early February. Software and services stocks slid amid growing concerns that rapid advances in AI could disrupt traditional business models and squeeze margins for established companies.

    Advanced Micro Devices was a key drag on market sentiment, with its shares plunging around 17% after the company reported earnings and issued guidance that failed to meet lofty market expectations. Although AMD pointed to strong AI-driven demand, investors focused on pricing pressures and intensifying competition in data centers, resulting in the stock’s sharpest one-day drop in years.

    Focus also turned to Alphabet’s earnings after the close. The Google parent posted solid advertising revenue and reaffirmed plans for significant investment in AI infrastructure, but caution lingered over the near-term impact on profitability. Alphabet shares fell more than 1% in extended trading.

    Meanwhile, Qualcomm shares slid nearly 10% after hours after the company forecast second-quarter revenue and profit below Wall Street estimates, citing a global memory chip shortage expected to weigh on smartphone sales and broader device demand.

    U.S. private-sector payrolls rose by less than expected in January, signaling some cooling in the labor market.

    Broader market sentiment was also influenced by economic data. Figures released on Wednesday showed private-sector employment increased by just 22,000 jobs last month, well short of the 50,000 gain expected, following a downwardly revised rise of 37,000 in December.

    A brief government shutdown led to the postponement of the closely watched monthly jobs report, which had been scheduled for release on Friday.

    Investors are now turning their attention to weekly jobless claims data due on Thursday, which should offer a near-term snapshot of labor market conditions ahead of the delayed nonfarm payrolls report.

    Sources: Ayushman Ojha

  • Artificial Intelligence Raises the Competitive Stakes Across Tech

    On December 7, 2025, we advised maintaining a market-weight stance rather than an overweight position in the S&P 500’s Information Technology and Communication Services sectors. Since then, their combined share of the index’s market capitalization has fallen from a record 46.7% on November 5, 2025, to 43.9% as of Monday (see chart). This decline has occurred even as their combined contribution to S&P 500 earnings continued to climb, reaching a new high of 39.8% by Monday.

    Despite strong growth in the two sectors’ combined forward earnings, their aggregate forward P/E multiple has compressed from 28.9 on November 5, 2025, to 24.3 currently (see chart).

    On December 7 last year, we argued that AI was intensifying competition among the Magnificent Seven, compelling them to sharply ramp up investment in AI infrastructure. On that basis, we recommended an underweight position. We expect the primary beneficiaries of this dynamic to be the broader S&P 500—often referred to as the “Impressive 493”—which are leveraging AI tools to boost productivity rather than competing on infrastructure scale.

    Technology has always been a highly competitive industry, and AI is intensifying that dynamic even further. In my 2018 book Predicting the Markets, I described the tech sector as a textbook case of “creative destruction,” where new innovations relentlessly displace older technologies.

    More recently, software stocks have come under pressure as AI tools become increasingly proficient at writing code (see charts). While forward earnings for the sector have climbed to record levels, investors have compressed valuation multiples in response to the growing competitive threat posed by AI.

    On Tuesday, software stocks were hit particularly hard after Anthropic unveiled new tools for its Cowork product. While it remains too early to assess their practical impact, investors responded by marking down valuation multiples across the software sector.

    By contrast, semiconductor stocks have proven relatively resilient, even as the industry’s forward P/E multiple has declined amid a sharp surge in forward earnings (see chart). Competitive pressures are intensifying, particularly among chips designed to rival Nvidia’s (NASDAQ: NVDA) GPUs. At the same time, tight memory supply has driven prices sharply higher, though history suggests that once capacity expands to meet demand, those prices are likely to retreat.

    Shares of semiconductor equipment makers have continued to climb, alongside rising earnings and expanding valuation multiples (see chart). This strength reflects the industry’s relative insulation from competitive pressures, as these companies benefit whenever demand is strong for equipment that enables chipmakers to expand production capacity.

    Sources: Ed Yardeni

  • Nasdaq 100 Weakness Weighs on S&P 500 as Valuation Concerns Intensify

    Stocks came under heavy pressure, even as the S&P 500 ended the session with a relatively modest 85-basis-point decline. Losses were concentrated in technology and software, with the Nasdaq 100 sliding more than 1.5% and the XLK technology ETF falling over 2%. The selloff in software has been particularly severe, with several names now trading below their 2022 lows. Adobe, for instance, closed at its weakest level since October 2019.

    In some ways, the current environment echoes the shift from 2021 into 2022. The crucial difference is that the Federal Reserve is now in an easing cycle, whereas policy was tightening back then. Oil prices were also racing toward $100 at the time, while this week they have struggled to stay above $60. Even so, the pattern is familiar: the Software ETF (IGV) peaked well ahead of the S&P 500 and helped pull the broader market lower, a dynamic that has also played out across several other market segments.

    Pressure has also resurfaced in private equity stocks, with many now trading below their November lows.

    Meanwhile, consumer staples—tracked by XLP—are surging to record highs in an unusually sharp move, reinforcing the view that markets are undergoing a broader re-rating of risk. This shift may reflect growing expectations of multiple compression, driven either by concerns that a new Fed chair could be less supportive of markets and liquidity, or by an increasing tendency among investors to separate winners from losers in the AI race.

    I see this mainly as a re-pricing of risk and the early phase of multiple compression, a view that is reinforced by Microsoft’s (NASDAQ: MSFT) P/E ratio.

    Sources: Michael Kramer

  • Yield Curve Steepening Points to Rising Long-Term Yields

    The S&P 500 closed the session up just over 50 basis points, in what felt like a familiar Monday pattern following Friday’s sharp drop in the 1-day VIX from 16.4 to 9.5. While the repetition can feel tiresome, the signal is clear: with volatility effectively reset, the index is once again at risk of stalling.

    In other developments, the quarterly refunding announcement came in stronger than anticipated based on prior guidance, with the second quarter standing out as the key surprise. The Treasury now expects to issue $109 billion, assuming a Treasury General Account balance of $900 billion. The increase in the TGA target from $850 billion was unsurprising given the scale of U.S. debt and is a point that has been repeatedly highlighted.

    Treasury yields were higher for much of the session following the stronger-than-expected ISM manufacturing data and extended those gains after the Treasury’s 3:00 p.m. ET announcement. Further clarity on the composition of the issuance is expected Wednesday morning.

    The 30-year minus 3-month spread has returned to the upper boundary of its bull-flag formation. A decisive break above the 1.25% level could trigger further upside momentum, with scope for a move toward the 1.7%–1.75% range.

    Absent a meaningful downside shock, the yield curve is likely to continue steepening, driven primarily by higher long-end yields.

    As highlighted yesterday, Palantir’s (NASDAQ: PLTR) key resistance level from an options-positioning perspective sits near $160, which is where the stock stalled in after-hours trading. If shares fail to break decisively above that level, a reversal of recent gains and a sharp pullback during today’s session would not be unexpected.

    Sources: Michael Kramer

  • Wall Street futures edge lower as Microsoft’s decline drags, while Apple tops expectations

    U.S. stock index futures slipped slightly on Thursday evening after Wall Street ended mostly lower, as weaker-than-expected results from Microsoft rekindled doubts over the returns on heavy AI spending, while investors absorbed a wave of other corporate earnings.

    S&P 500 futures dipped 0.3% to 6,975.0 points, Nasdaq 100 futures declined 0.3% to 25,916.75 points, and Dow Jones futures also fell 0.3% to 49,049.0 points by 19:36 ET (00:36 GMT).

    Wall Street dips as Microsoft’s slide weighs; Apple earnings take center stage

    The S&P 500 and NASDAQ Composite closed Thursday’s regular session on a weak note, with technology stocks among the session’s biggest laggards.

    Shares of Microsoft Corporation (NASDAQ:MSFT) plunged 10% after the company’s quarterly earnings highlighted slower cloud revenue growth and record AI-related spending, failing to reassure investors about near-term returns.

    Microsoft’s selloff dragged down broader technology sentiment, with software peers including ServiceNow Inc (NYSE:NOW) and SAP (NYSE:SAP) also posting steep declines following disappointing earnings and outlooks.

    Investors were also focused on Apple Inc.’s (NASDAQ:AAPL) earnings released after the close, which topped expectations as strong iPhone demand and a recovery in Greater China boosted both revenue and profit.

    Apple reported roughly $143.8 billion in revenue and earnings per share well above consensus estimates, sending its shares up nearly 1% in after-hours trading.

    SanDisk jumps on earnings beat; Trump backs spending agreement

    Elsewhere on the earnings front, shares of SanDisk Corporation (NASDAQ:SNDK) jumped 16% in after-hours trading after the storage-chip maker posted a strong profit beat and lifted its outlook, driven by stronger-than-expected demand for data-center and AI-focused memory products.

    By contrast, Visa (NYSE:V) shares edged lower despite surpassing first-quarter earnings and revenue forecasts, as investors focused on weaker-than-expected transaction volumes and ongoing caution surrounding broader consumer spending.

    On the political side, President Donald Trump voiced support for a bipartisan spending agreement crafted by Senate Republicans and Democrats aimed at avoiding an imminent government shutdown, expressing his backing on Truth Social and calling for cooperation.

    The deal would provide funding for most federal agencies while deferring divisive immigration issues for future negotiations.

    Sources: Investing

  • US futures stayed stable with attention focused on the Federal Reserve meeting and earnings reports from megacap firms

    U.S. stock index futures were largely unchanged late Tuesday as investors remained cautious ahead of the Federal Reserve’s interest rate decision and a busy earnings schedule featuring major technology leaders.

    S&P 500 futures edged up 0.1% to 7,017.50, while Nasdaq 100 futures rose 0.3% to 26,155.75 by 20:10 ET (00:10 GMT). Dow Jones futures were flat at 49,154.0.

    S&P 500 closes at a record as Dow edges lower on Medicare concerns

    During Tuesday’s regular session, the S&P 500 climbed 0.4% to a record closing high, extending its advance as investors rotated back into growth stocks and responded positively to broadly solid earnings results. Gains in technology shares led the move, pushing the benchmark to a fresh peak.

    The Nasdaq Composite jumped 0.9%, driven by strength in megacap stocks.

    Meanwhile, the Dow Jones Industrial Average fell 0.8%, weighed down by steep declines in healthcare and insurance shares. Major health insurers came under pressure after the U.S. government released a Medicare Advantage payment plan that the market perceived as less favorable than anticipated.

    Markets focus on Fed decision and megacap earnings

    Investor focus has shifted squarely to the Federal Reserve, which kicked off its two-day policy meeting on Tuesday. The central bank is widely expected to leave interest rates unchanged when it delivers its decision on Wednesday, with markets pricing in a pause as policymakers assess easing but still-elevated inflation alongside signs of steady economic growth and a resilient labor market.

    Close attention will be paid to Fed Chair Jerome Powell’s remarks for indications on how long rates may remain at current levels and when eventual cuts could begin.

    “The key will be any dissent and the Fed’s communication, particularly around questions of central bank independence,” ING analysts said, adding that the decision will also be overshadowed by President Trump’s upcoming nomination of a new Fed chair.

    Corporate earnings are another major catalyst this week, with four members of the so-called “Magnificent Seven” technology group set to report. Tesla, Meta Platforms and Microsoft are scheduled to post results on Wednesday, followed by Apple on Thursday.

    Given their heavy weighting in major equity indexes, guidance from these companies on artificial intelligence investment, cloud demand and consumer trends is expected to play a key role in shaping near-term market direction.

    Sources: Investing

  • Stocks and Crypto Climb, Yet S&P 500 and Bitcoin Still Face Bull Traps

    Markets managed to rebound after Tuesday’s sell-off, but the bounce—despite attracting attention—fell short of fully recouping the earlier losses. More importantly, a significant “bull trap” remains in place for the S&P 500. Technical signals for the index continue to be mixed, with momentum indicators such as stochastics failing to move back into overbought territory—a key condition needed to support a sustained rally.

    Bitcoin faces more significant challenges. Yesterday’s rise alone is far from sufficient to undo what was beginning to resemble the formation of a right-hand base. That said, this still appears to be the early stages of building a new base and could represent an attractive buying opportunity for investors willing to hold through what may be a year-long process, potentially targeting a move toward $125K. For now, technical indicators remain net bearish, and a break below $85K would invalidate any bullish outlook.

    The Nasdaq has mounted a counter-trend bounce following the breakdown, but the symmetrical triangle pattern has already resolved, meaning attention now shifts to identifying new support and resistance levels. There is still a potential bullish scenario if price action evolves into a bullish ascending triangle.

    On the other hand, the Russell 2000 shows the potential to form a bearish “evening star” pattern, though this would require a gap lower today. Setting that possibility aside, the index remains firmly in rally mode and is far from any “bull trap” conditions. Overall, technical indicators are net bullish.

    For today, bulls may want to focus on Bitcoin, while bears should monitor the Russell 2000 for signs that a bearish “evening star” pattern could emerge.

    Sources: Declan Fallon

  • S&P 500: Low Trading Volume and Limited Volatility Hinder Expectations for a Market Breakout

    The VIX 1-Day index closed below 10 on Monday, indicating that if a significant price surge follows the CPI report, it is unlikely to be driven initially by increased implied volatility. Instead, any substantial move would need to be supported by actual buying activity rather than a rise in volatility. However, volatility could still spike overnight, setting the stage for the familiar CPI-driven market reaction.

    The S&P 500 appears stable for now, but I don’t believe this is the significant breakout many have anticipated since late October. Currently, the index hasn’t even fully cleared resistance at the trendline by a single bar. We witnessed similar patterns at the beginning of 2022 and 2025.

    The market could keep inching up by 10, 20, or even 30 basis points, but considering the unusually low levels of both realized and implied volatility, along with one-month implied correlation at just 7, the odds aren’t in favor of a strong move. Monday’s trading volume in S&P 500 futures was so thin, it felt like December 22 all over again.

    It seems the authorities have the ability to push the 3-month VIX back down to its July 2024 lows.

    Perhaps those same market forces can drive the 1-month implied correlation down to 2.

    Alternatively, the VXTLT bond market volatility index might decline to levels unseen since 2019.

    The main takeaway is that, in my opinion, the market’s current structure is not set up for a sharp, explosive rally. While it may continue to grind upward, eventually volatility is likely to mean-revert higher, triggering a pullback similar to the one seen from late October into November.

    Interestingly, despite numerous challenges in the oil market over the past four years, XLE has largely avoided a significant breakdown, instead trading mostly sideways throughout this period. If oil prices were to break out decisively and start climbing, it could signal a strong bullish trend for the sector. Currently, XLE is approaching a critical resistance level and merits close attention.

    This could prove significant if oil’s breakout above the downtrend sustains and prices start climbing back into the $60 range. For now, $55 seems to be a support level, and oil remains one of the few commodities yet to make a notable upward move. It’s definitely worth monitoring for potential gains.

    Sources: Mott Capital Management

  • 2026 Forecast: Economic Trends, Corporate Earnings, and the Optimistic Case for Stocks

    With holiday decorations packed away and investment professionals back at their desks, the serious market work for 2026 is officially underway. So far, investor sentiment appears optimistic, as the S&P 500 has posted a 1.76% gain—a promising start to the year.

    Looking ahead, nearly every major Wall Street firm forecasts another strong year for stocks. While leadership within the market may shift, the broad consensus remains that stock prices are poised for healthy gains in 2026.

    You might wonder how this optimism holds up amid concerns about AI bubbles, geopolitical tensions, inflation, and lofty valuations. Having wrestled with this question myself, I believe it’s worthwhile to step back and review the fundamental drivers underpinning the stock market.

    From my experience managing money for over 40 years, I’ve learned that while short-term market movements are nearly impossible to predict, understanding the broader macroeconomic environment helps to get the major market moves “mostly right, most of the time.” Simply put, aligning with the dominant primary market cycle is my foremost objective in this line of work.

    So, without wasting any time, let’s briefly review the key macro drivers: the economy, corporate earnings, inflation, the Fed and interest rates, and, naturally, valuations.

    Since there’s quite a bit to cover—and I doubt many of you want to read a 5,000-word report on a Monday morning—I’ve decided to split this analysis into several parts. Today, we’ll begin with a focus on the economy and corporate earnings.

    Overview of the Economy

    The U.S. economy is generally divided into three main sectors: manufacturing, consumers, and government. Of these, the consumer sector—also known as the services sector—is by far the largest, accounting for roughly 70% of overall economic activity in the United States.

    Because of this, the sluggish manufacturing sector, which has been in a prolonged slowdown, is less of a concern. While an improvement there would be welcome, consumer sentiment remains the primary driver of economic growth today.

    It’s also important to highlight that high-income earners now dominate consumer spending. Reports indicate that the wealthiest individuals account for just over 50%—a record high—of all U.S. consumer expenditures. These affluent consumers are less sensitive to price increases and tend to maintain their spending habits despite inflation.

    Indeed, the labor market has shown signs of weakening, which could eventually affect consumer spending. However, current evidence suggests that job market softness is primarily impacting lower-income consumers at this stage. This situation remains fluid—if job losses accelerate, the services sector would likely feel the impact. But for now, this hasn’t been the case.

    The key takeaway is that despite negative headlines, the economy appears to be performing well. U.S. GDP growth was strong last year, moving from a slight contraction of -0.6% in Q1 to +3.8% in Q2 and +4.3% in Q3.

    More recently, the Atlanta Fed’s GDPNow model—a real-time GDP estimate—registered a robust +5.4% last week.

    From my perspective, anyone claiming the economy is weak or unstable is overlooking the actual data.

    Company Earnings Reports

    Earnings are often described as the lifeblood of the stock market, making it crucial to stay informed about corporate profit trends. To get straight to the point, corporate earnings are very strong—remarkably so.

    For example, Q3 results showed about a 15% increase, significantly surpassing analyst expectations.

    Looking forward, consensus estimates from Wall Street analysts predict that S&P 500 companies will see earnings grow by approximately 17.3% in 2026. Quite impressive.

    Of course, analysts rarely get their projections exactly right. Estimates often start off too optimistic and are revised downward over time. So, it would be unwise to assume that 2026 earnings per share (EPS) will definitively rise by 17% compared to last year.

    The important takeaway is that EPS growth is still expected to be strong this year—significantly above the historical average. (Goldman Sachs recently released a report titled “2026: An Earnings Story.”) My view is that as long as earnings come reasonably close to these expectations, there should be plenty of room for stocks to advance.

    Is There Further Upside Potential?

    The key question is how much further the stock indices can climb. While I’ll address valuations in the coming weeks, it’s clear to everyone that current stock multiples are quite high. This likely explains why Wall Street analysts are forecasting relatively modest gains of around 10% for the year—roughly in line with the S&P’s average annual return since 1980—even with anticipated earnings growth.

    Given the strong economic outlook and expected earnings growth, it’s difficult for me to take a negative stance on the stock market.

    That said, it might be prudent to temper enthusiasm somewhat due to elevated valuations. However, from a broader perspective, I believe the best approach is to stay on the bullish path and trust the market leaders to navigate any near-term challenges.

    What shapes our lives are the questions we ask, refuse to ask, or never think to ask.

    Sam Keen

    Sources: Investing

  • Signs of Increasing Vulnerability Emerge in the S&P 500

    The S&P 500 ended Wednesday down roughly 34 basis points. The index now appears to be forming a possible 2B reversal top after failing to sustain a breakout to new highs. Instead, it turned lower and finished the session back near support around 6,920.

    If the index cannot clear the 6,950 level and subsequently falls below 6,920, it could open the door toward the 6,835 area. More broadly, the S&P 500 has shown little net progress since late October, and such a move would also threaten the uptrend established from the November 21 lows. As a result, the index looks more exposed to downside risks than it might initially suggest.

    BTIC S&P 500 Total Return Futures (EFFR) for the December 2026 contracts declined again on Wednesday, reaching their lowest level since March 2024. While some may interpret this as bullish on the basis that financing costs are easing, it is difficult to identify periods when the S&P 500 advanced while these contracts were falling—at least based on my observations. To me, this is clearly bearish and suggests that demand for leverage is weakening or that positions are being unwound.

    Implied volatility increased on Wednesday ahead of Friday’s employment report and upcoming Supreme Court opinions, which could include a ruling on tariffs. Kalshi currently assigns a 30% probability that the Court upholds the tariffs, implying a 70% likelihood that they are overturned.

    I anticipate implied volatility will keep increasing as we approach this news event. The VIX 1-day is likely to rise significantly by Thursday afternoon and could continue climbing after the jobs report, given that the Supreme Court rulings are expected later that day. In my view, a VIX 1-day reading between 15 and 20 appears very probable.

    Sources: Mott Capital Management