Economic behavior refers to the way individuals, households, businesses, or organizations make decisions and take actions related to the production, distribution, exchange, and consumption of economic resources such as money, time, labor, and natural resources.
Simply put, it is how people choose when resources are limited but needs are unlimited.
Key characteristics of economic behavior
1. Based on choice
Because resources are scarce, people must choose one option over another.
2. Benefit-oriented
Decisions usually aim to maximize benefits (profit, satisfaction) and minimize costs.
3. Influenced by many factors
- Income and prices
- Information and expectations
- Psychology, habits, and culture
- Government policies and the social environment
4. Not always perfectly rational
Behavioral economics shows that people often make decisions influenced by emotions, cognitive biases, or personal beliefs.
Examples of economic behavior

- Consumers compare prices and quality before buying tea
- Businesses expand production when demand increases
- Investors choose gold as a safe-haven asset during market volatility
- People save more when they fear an economic downturn
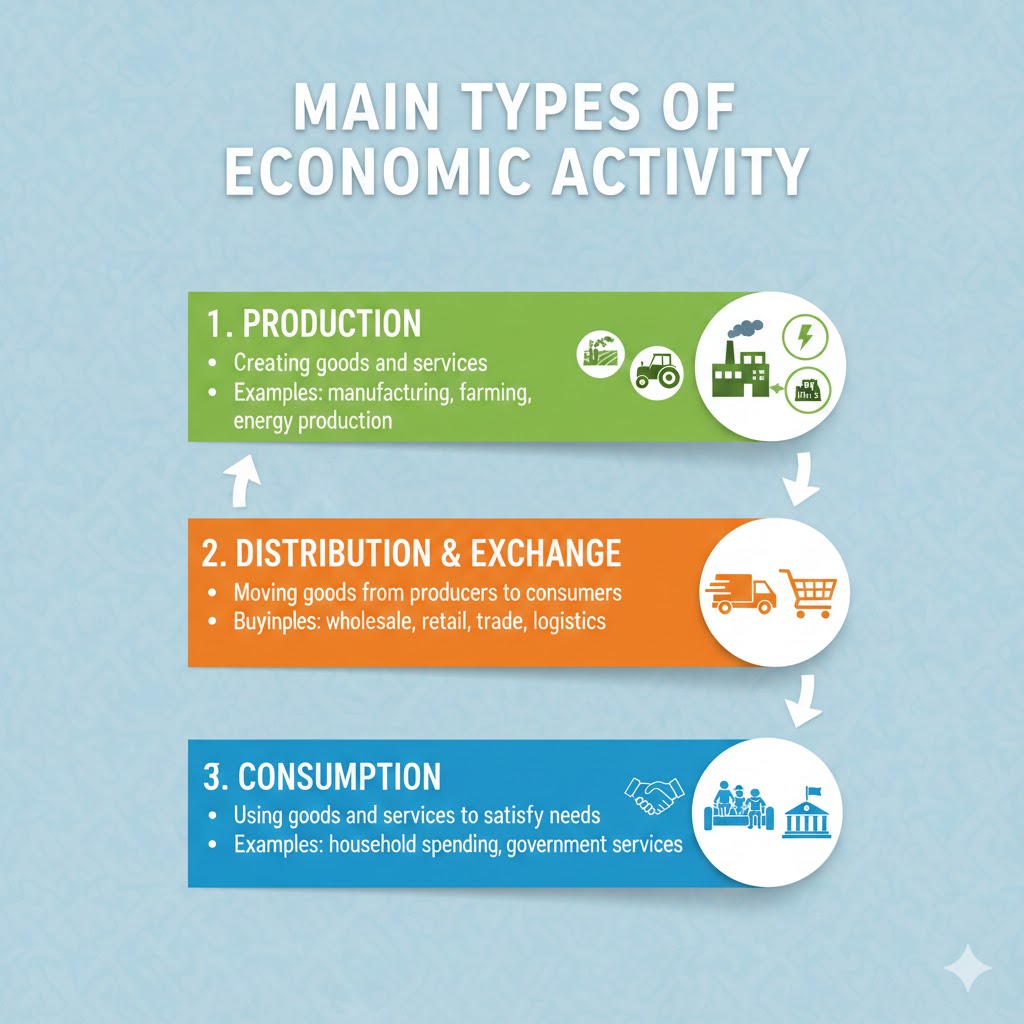
Types of economic behavior
Consumption behavior
Consumption behavior refers to how individuals or households decide what goods and services to buy, how much to buy, and when to buy in order to satisfy their needs and wants.
Key decision factors
- Income level and disposable income
- Prices of goods and services
- Preferences, tastes, and lifestyle
- Psychological factors (brand perception, emotions, habits)
- Social and cultural influences
- Expectations about future income or prices
Examples
- A consumer choosing between premium tea and mass-market tea based on budget and perceived quality
- Buying more during promotions or discounts
- Reducing spending when economic uncertainty increases
Economic significance
Consumption drives demand, which in turn influences production, employment, and economic growth.
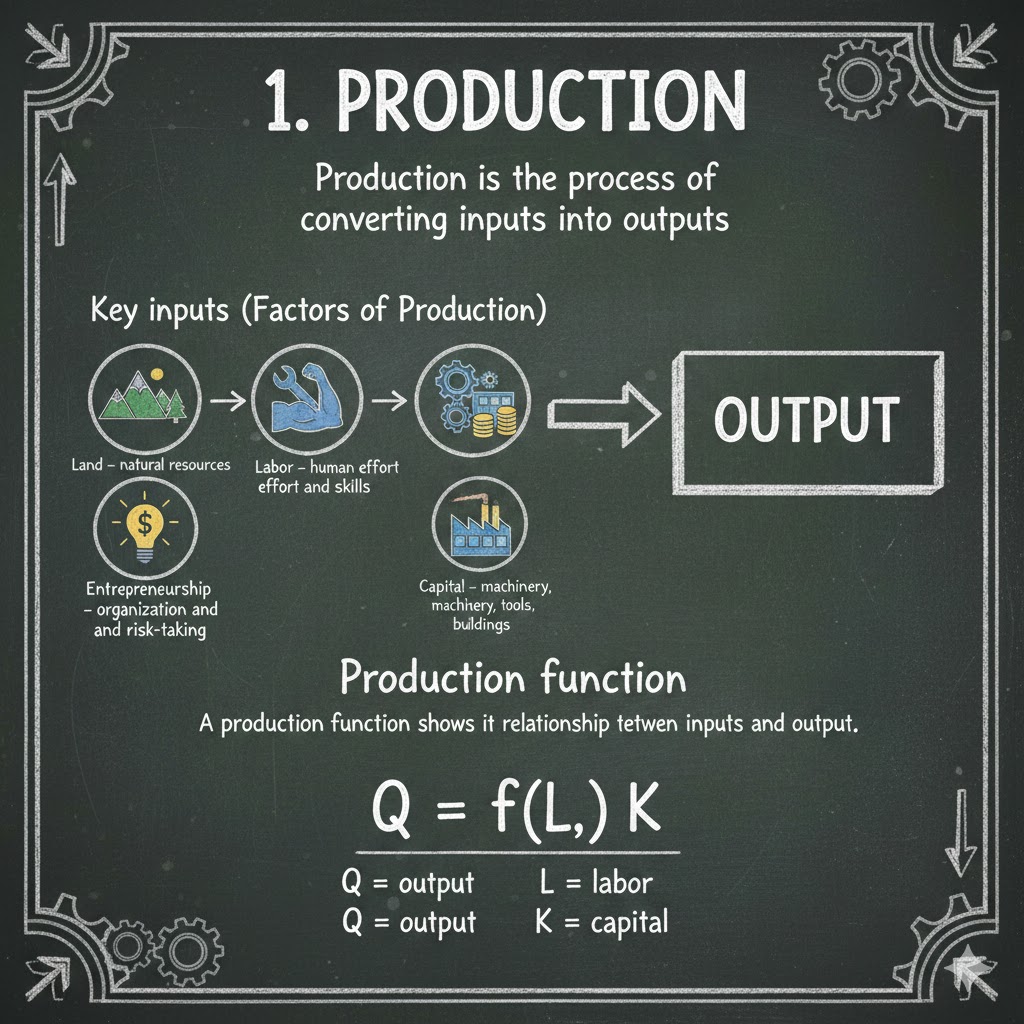
Production behavior
Production behavior describes how firms or producers decide what to produce, how much to produce, and which production methods to use.
Key decision factors
- Market demand and consumer preferences
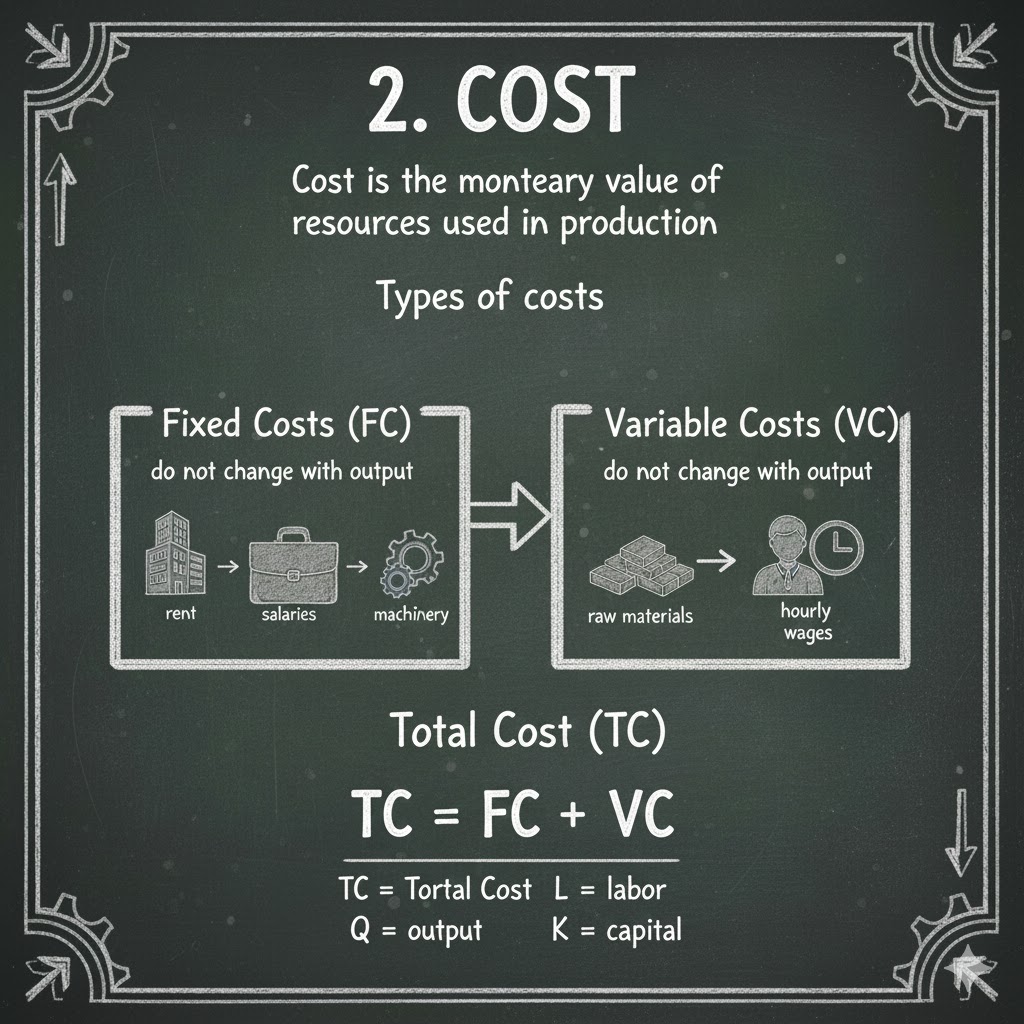
- Production costs (labor, raw materials, energy)
- Technology and efficiency
- Competition and market structure
- Government regulations and taxes
- Expected profits
Examples
- A tea company deciding to produce organic tea instead of conventional tea
- Investing in automation to reduce labor costs
- Cutting production when demand declines
Economic significance
Production behavior determines supply, pricing, productivity, and the efficient allocation of resources.
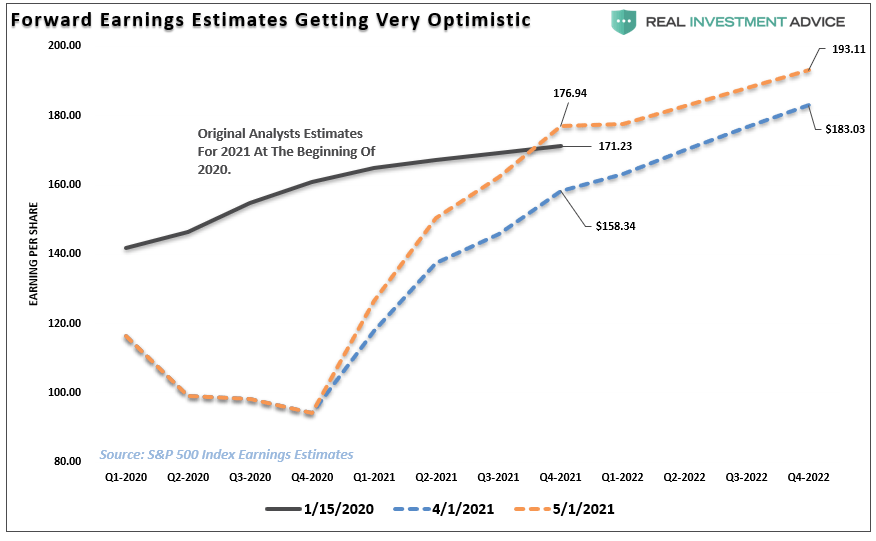
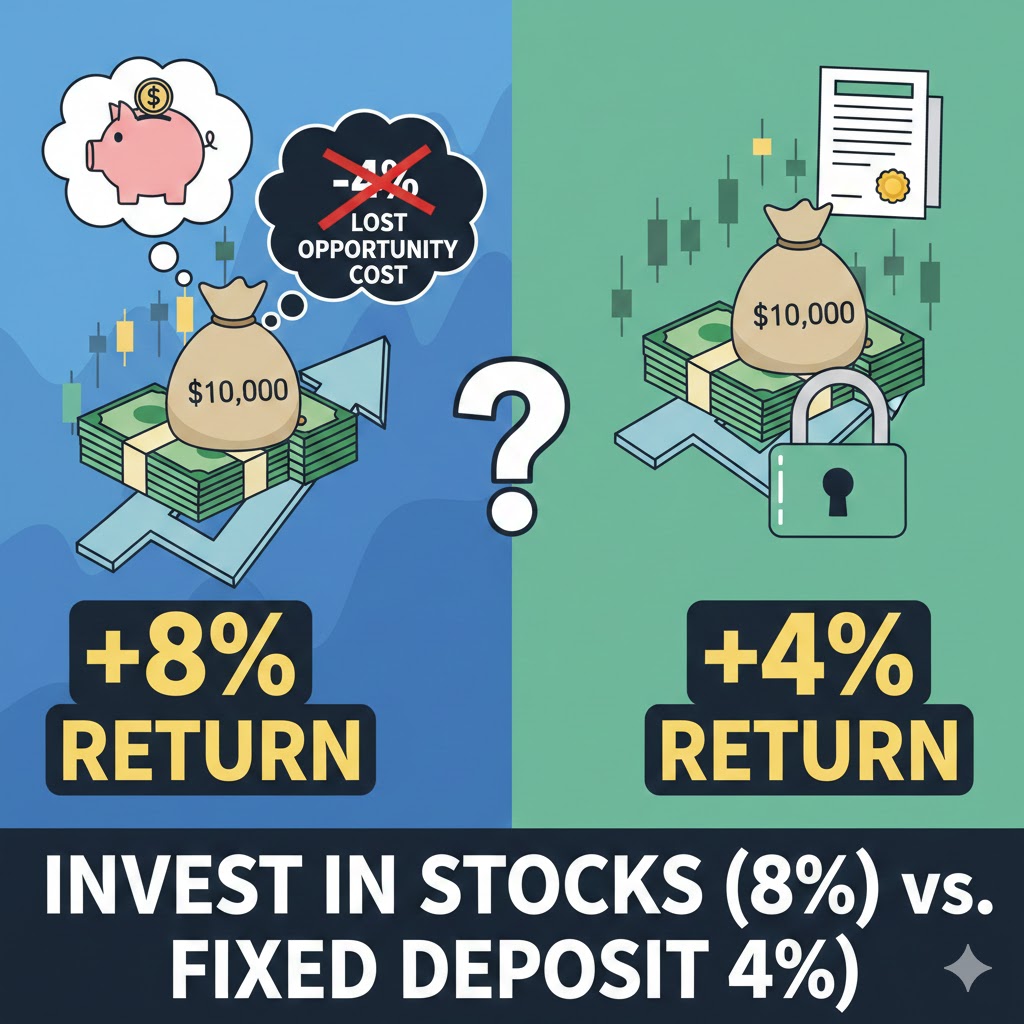
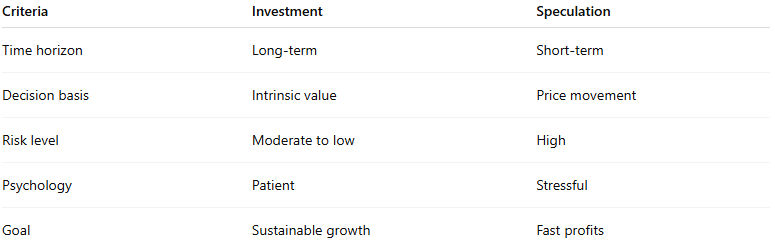
Investment behavior
Investment behavior refers to decisions made by individuals or organizations regarding how and where to allocate capital to generate future returns.
Key decision factors
- Expected rate of return
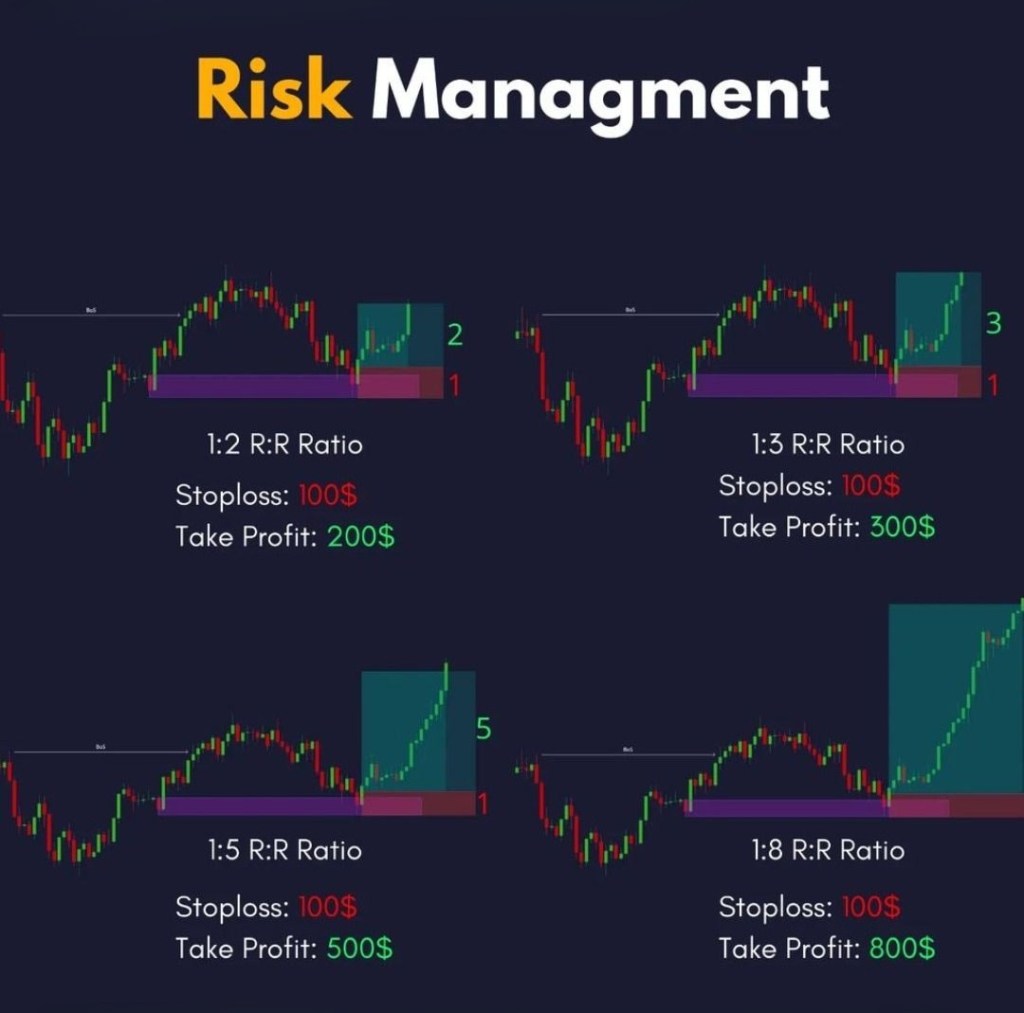
- Risk tolerance and uncertainty
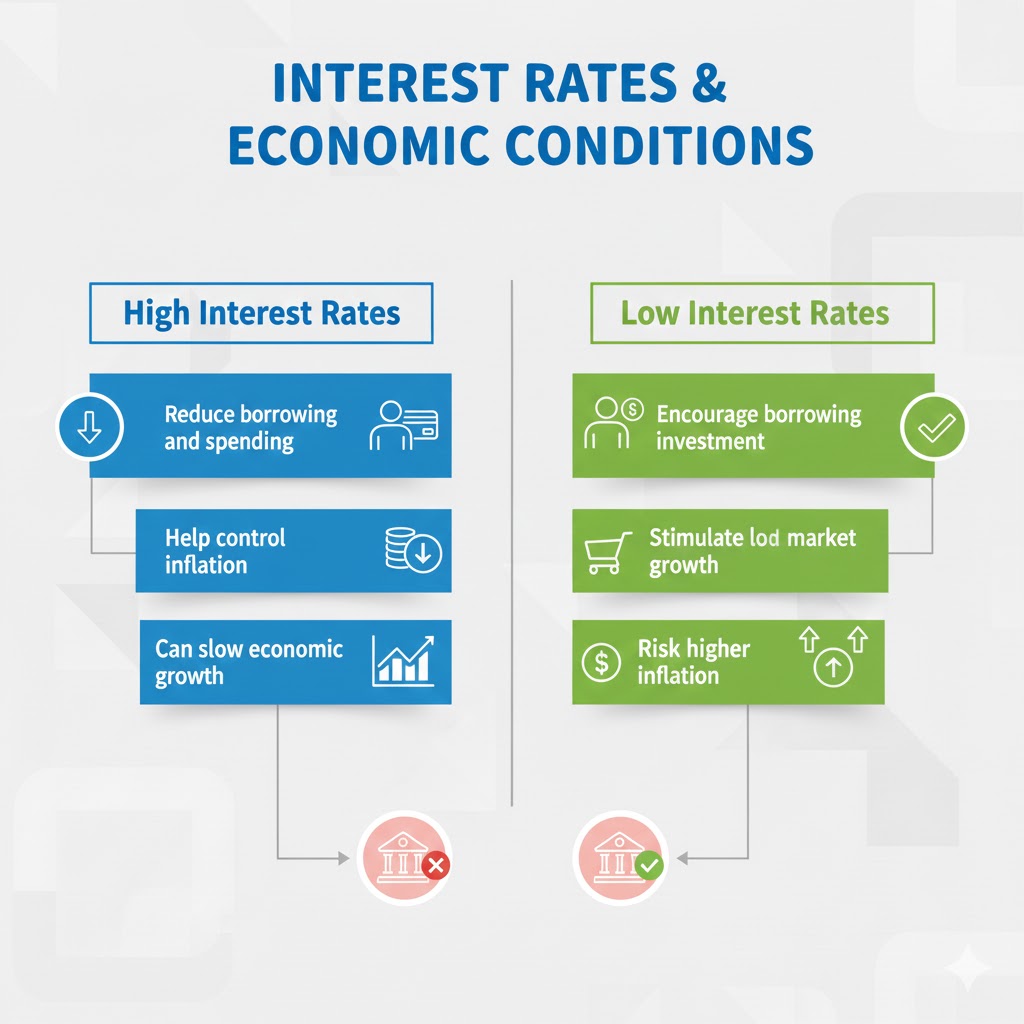
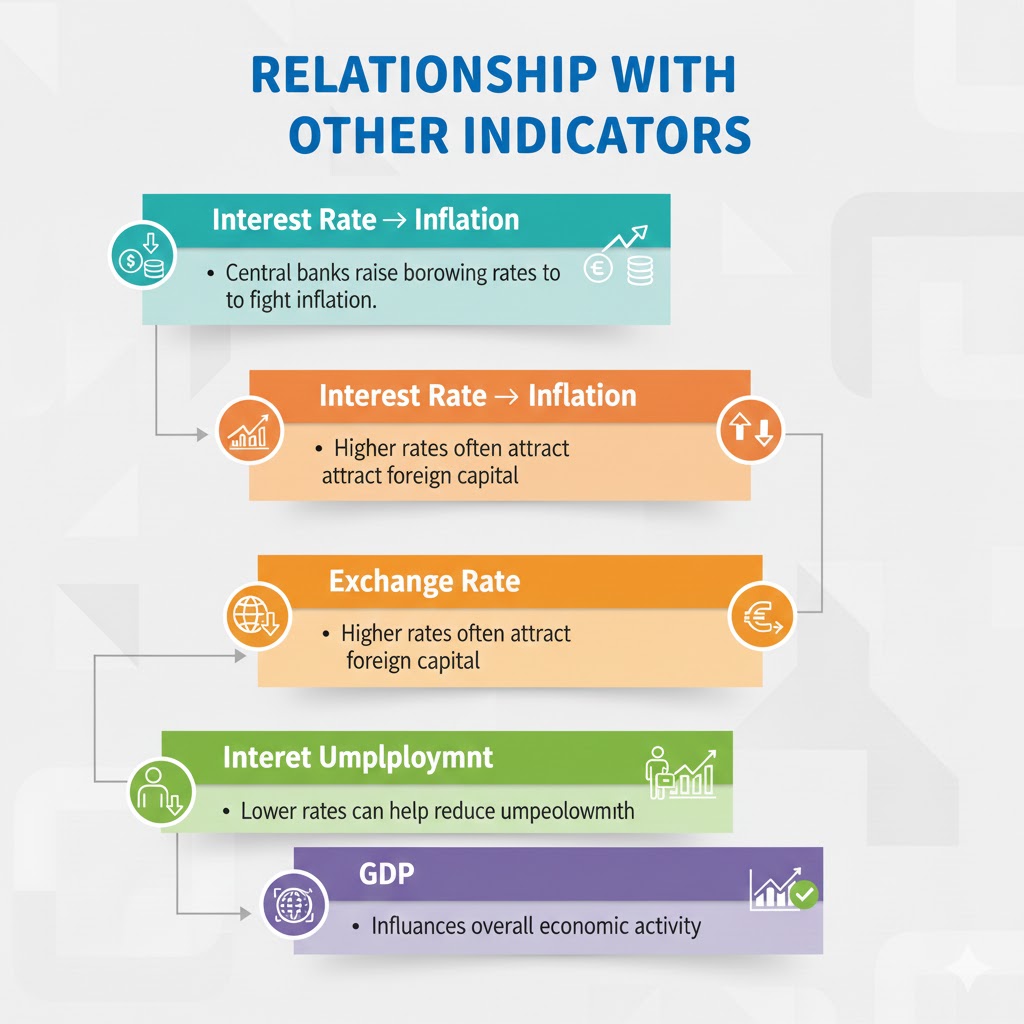
- Interest rates and inflation
- Market conditions and economic outlook
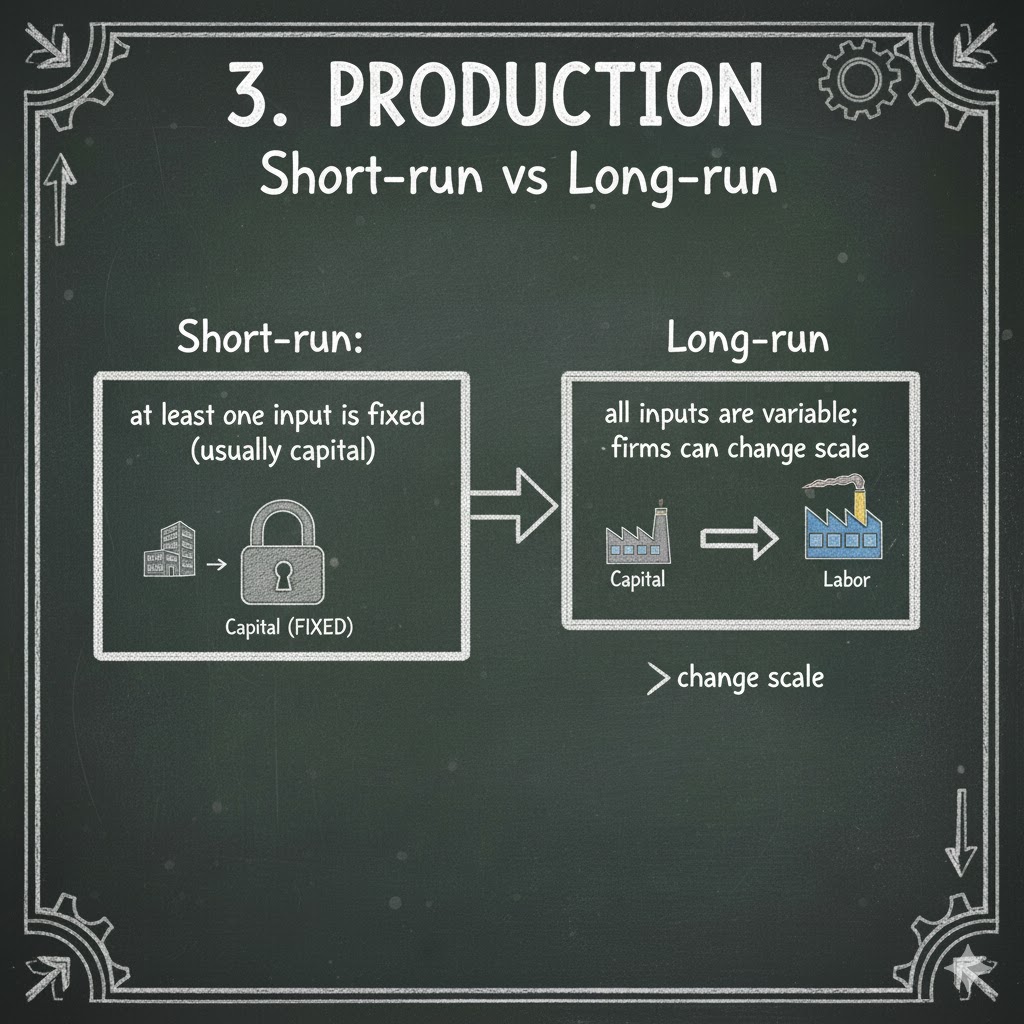
- Time horizon (short-term vs long-term)
Examples
- Investors buying stocks, bonds, gold, or real estate
- A business expanding factories or investing in R&D
- Choosing safe-haven assets during financial instability
Economic significance
Investment fuels capital formation, innovation, and long-term economic growth.
Saving behavior
Saving behavior involves decisions about how much income to set aside for future use rather than current consumption.
Key decision factors
- Income stability and employment security
- Interest rates and returns on savings
- Life cycle stage (youth, working age, retirement)
- Precautionary motives (emergency funds)
- Cultural attitudes toward saving
Examples
- Households increasing savings during a recession
- Individuals saving for education, housing, or retirement
- Businesses retaining earnings instead of distributing dividends
Economic significance
Savings provide funds for investment and help stabilize financial systems.
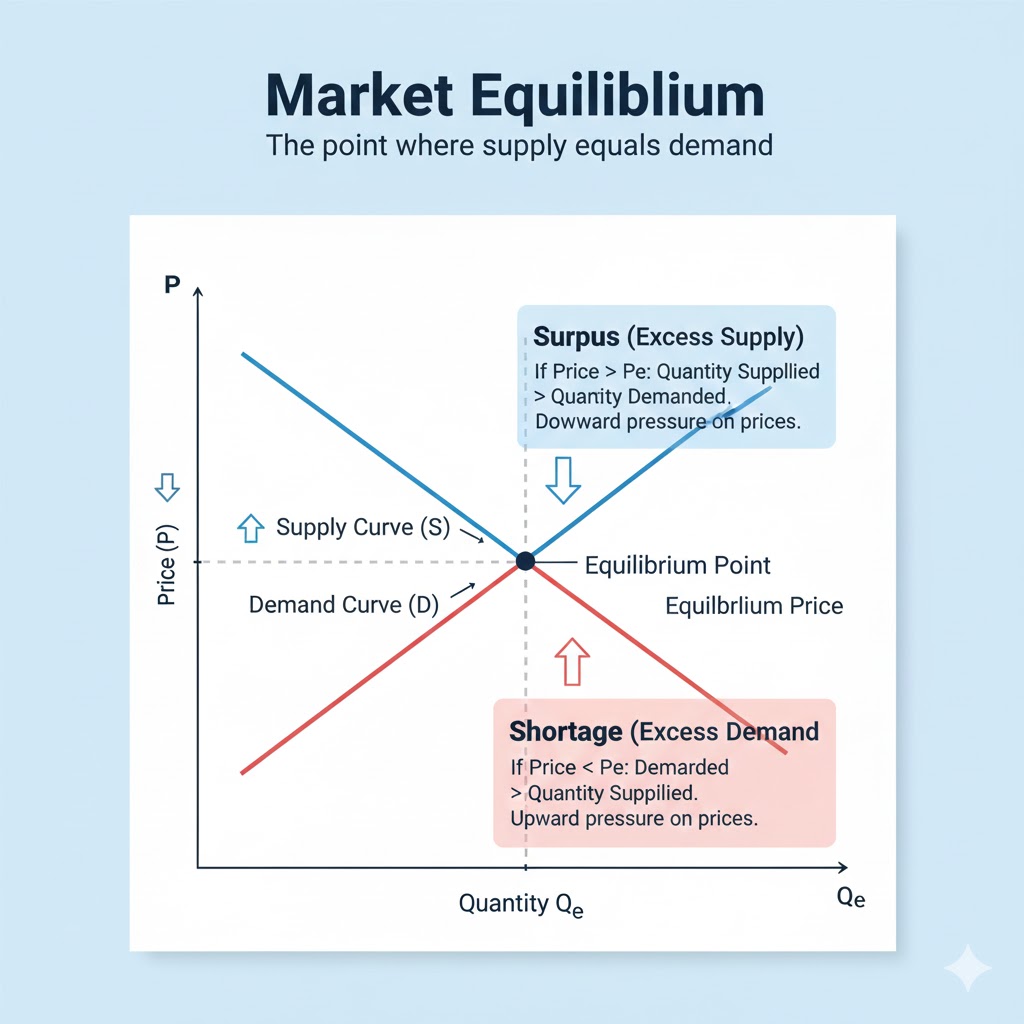
Exchange (Market) Behavior
Exchange behavior refers to how economic agents buy, sell, and negotiate in markets.
Key decision factors
- Market prices and transaction costs
- Bargaining power and competition
- Information availability and transparency
- Trust and contractual enforcement
Examples
- Negotiating wholesale tea prices with suppliers
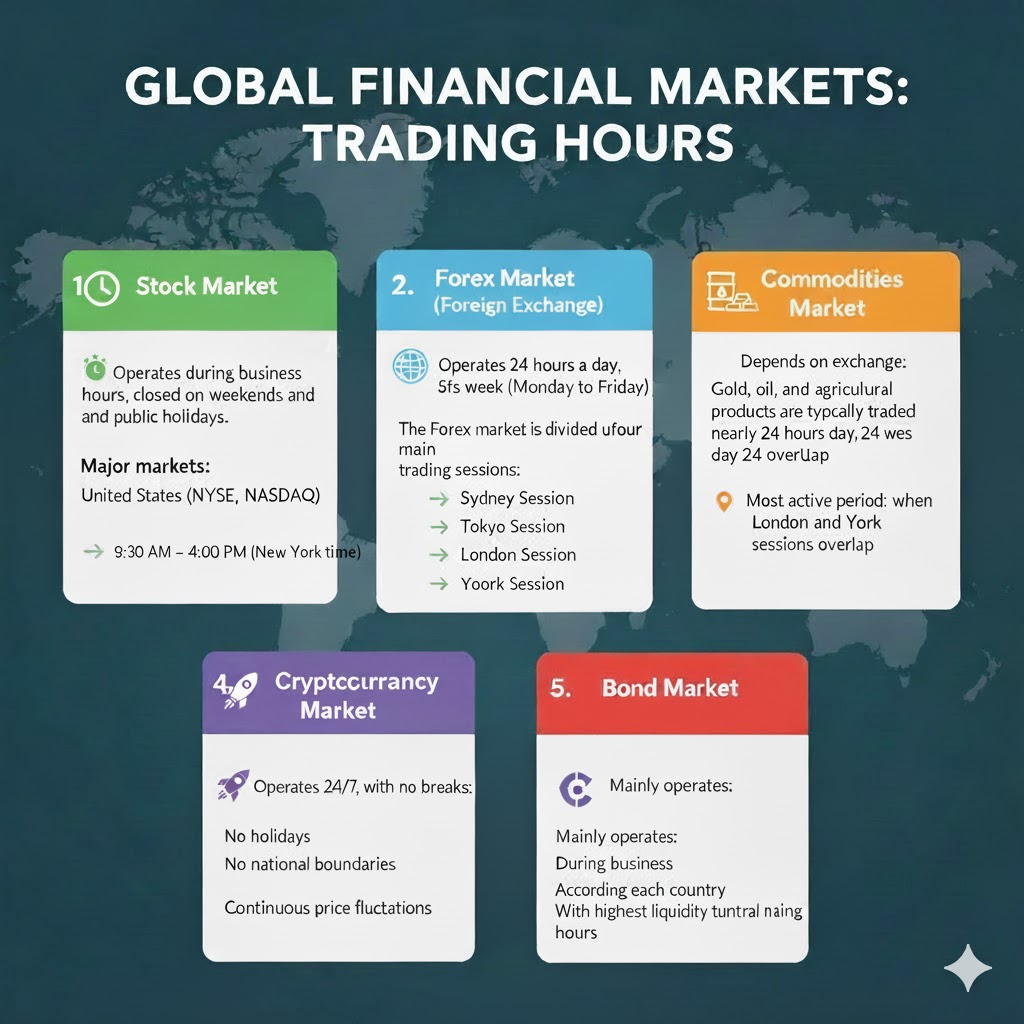
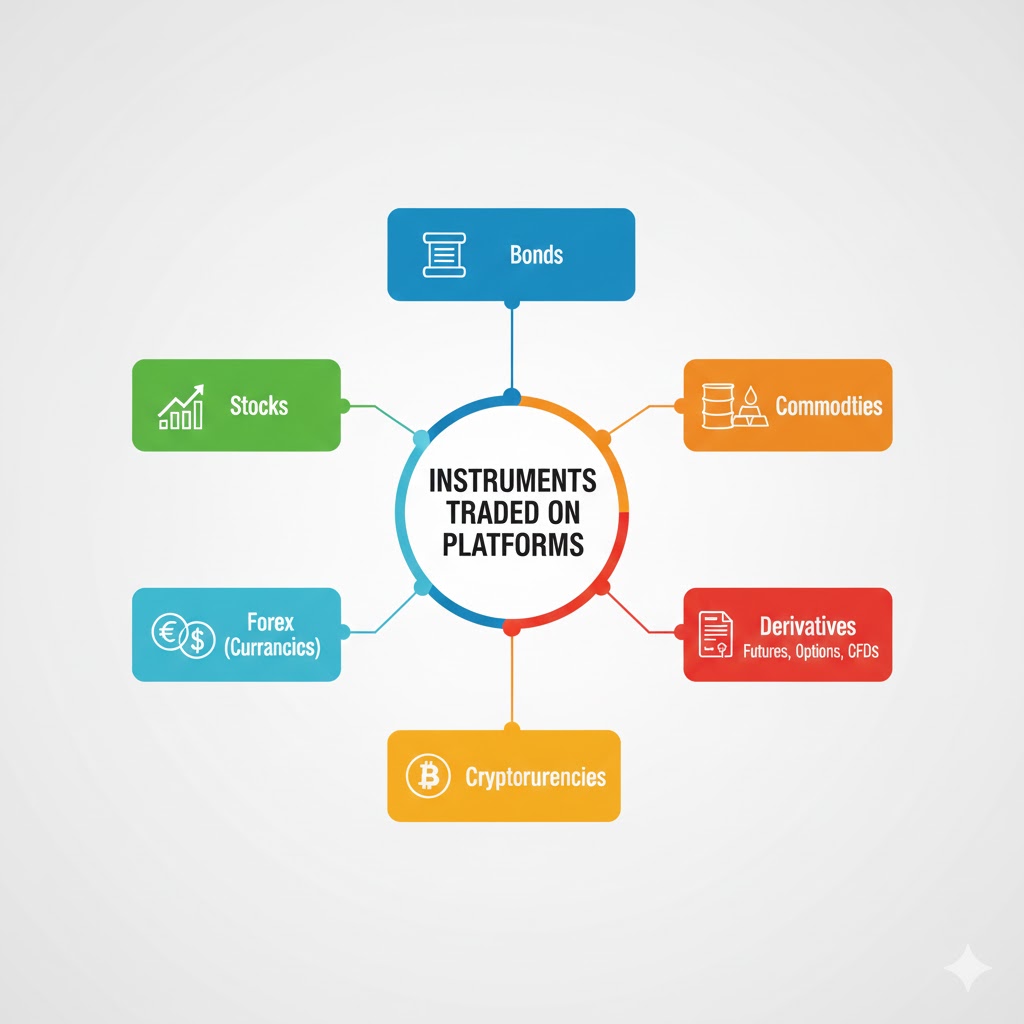
- Online trading of financial assets
- Choosing platforms based on fees and convenience
Economic significance
Exchange behavior ensures the circulation of goods, services, and capital in the economy.
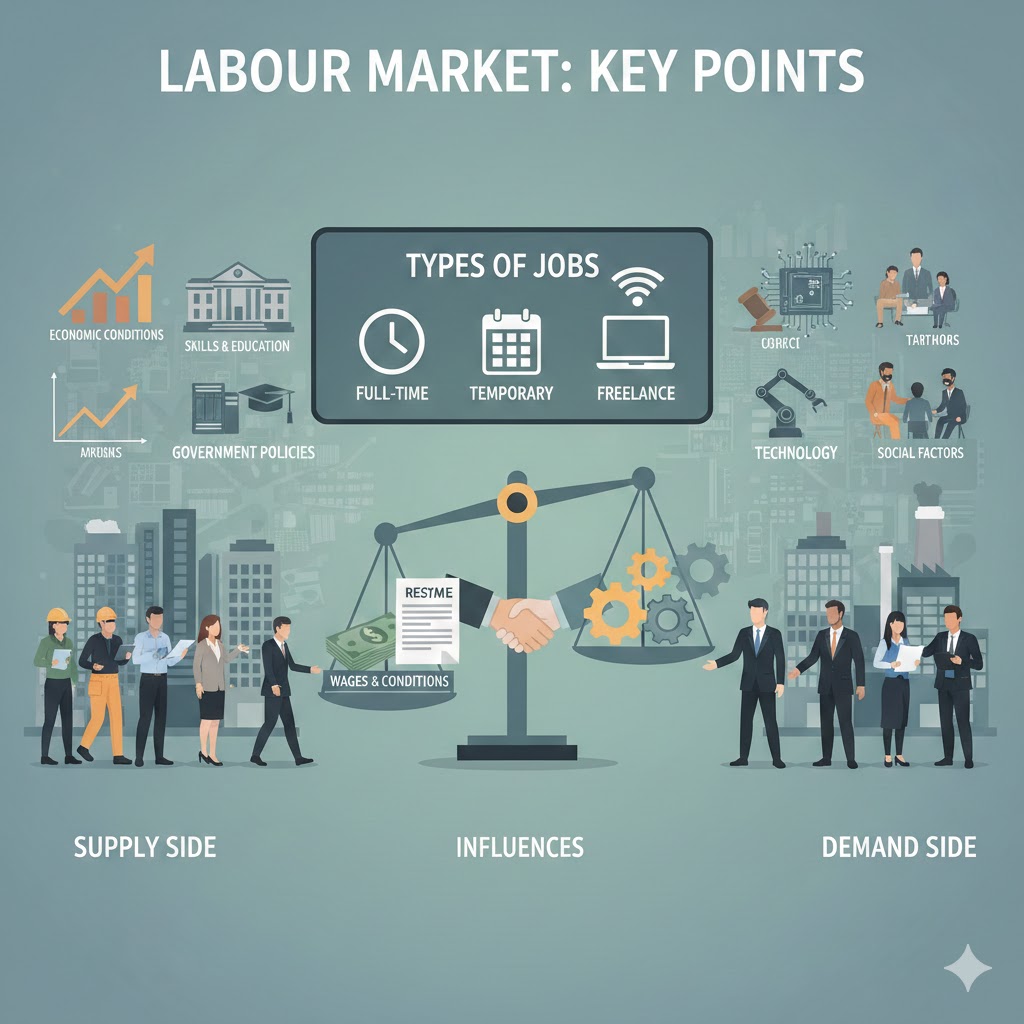
Labor (Work) Behavior
Labor behavior focuses on decisions related to working, hiring, wage setting, and skill development.
Key decision factors
- Wage levels and benefits
- Working conditions and job security
- Education and skill requirements
- Work-life balance preferences
- Labor market regulations
Examples
- Workers choosing between higher pay or better working conditions
- Firms hiring skilled labor to improve productivity
- Employees investing in training to increase income potential
Economic significance
Labor behavior directly affects productivity, income distribution, and employment levels.
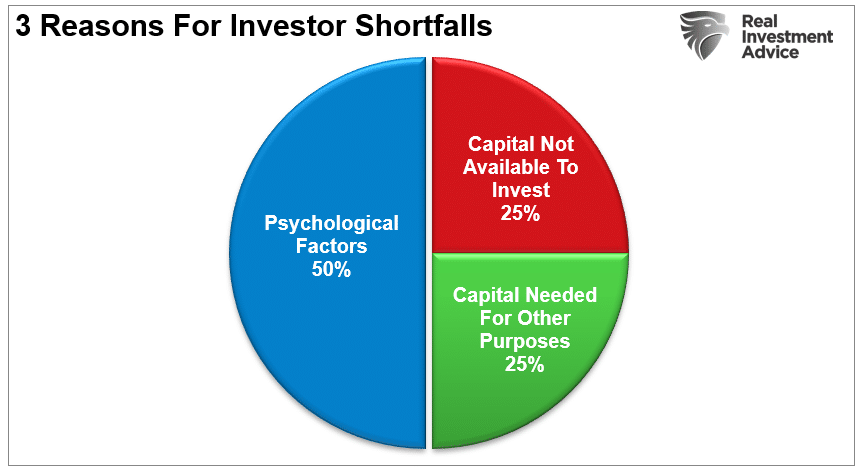
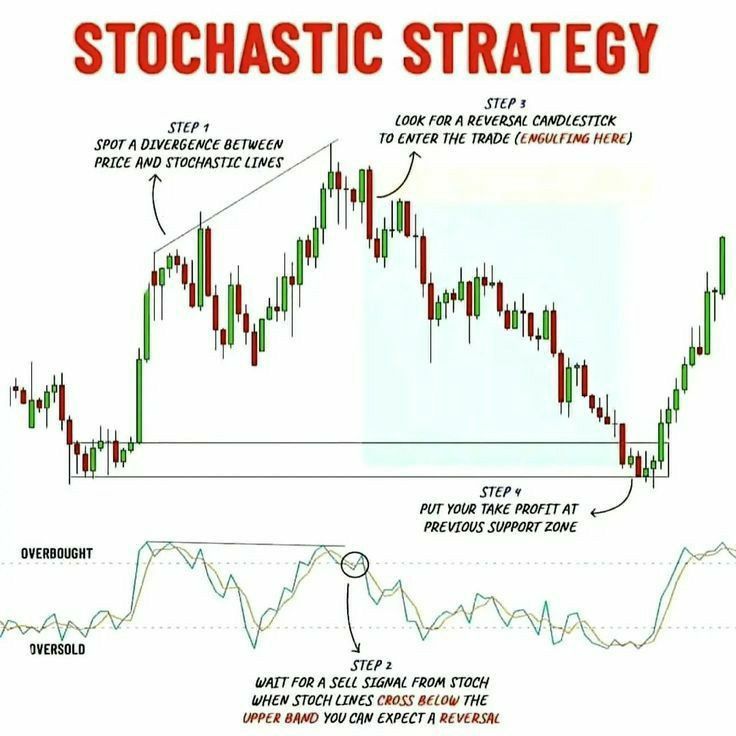
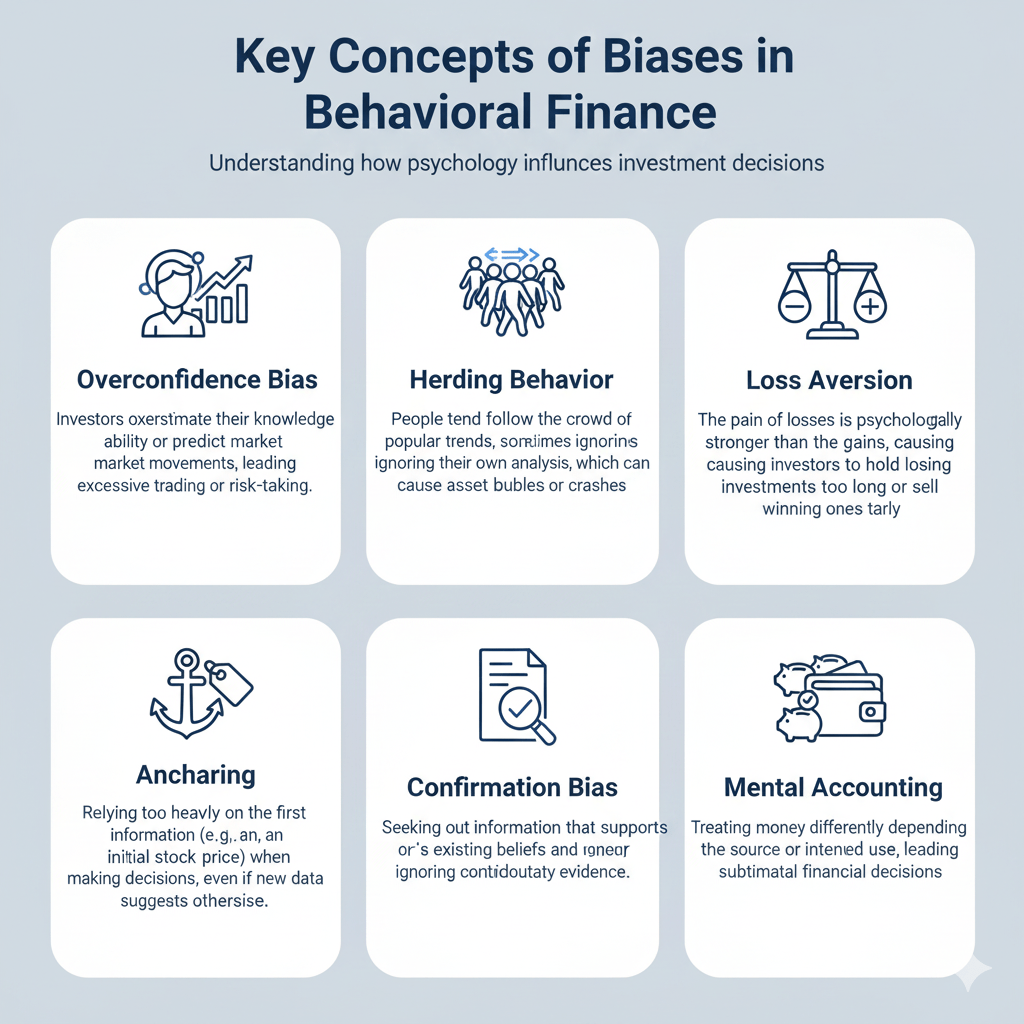
Behavioral (Psychological) Economic Behavior
This type highlights how psychological biases and emotions influence economic decisions, often leading to outcomes that deviate from rational models.
Key influences
- Loss aversion
- Overconfidence
- Herd behavior
- Anchoring and framing effects
Examples
- Panic selling during market crashes
- Consumers overpaying due to brand loyalty
- Investors following market trends without analysis
Economic significance
Understanding behavioral factors helps explain real-world market anomalies and improves policy and business strategies.