Tag: investment

  • Bitcoin slides beneath $64,000, dragging BCH, HYPE and PUMP lower

    • Bitcoin Cash slipped below the $500 mark on Tuesday, extending losses after plunging 13% in the previous session.
    • Hyperliquid fell another 1% on Tuesday, marking its fourth straight day of declines following Monday’s sharp 9% drop.
    • Pump.fun also came under pressure, sliding beneath a key psychological support level after tumbling 11% on Monday.

    Altcoins such as Bitcoin Cash (BCH), Hyperliquid (HYPE), and Pump.fun (PUMP) have led declines over the past 24 hours as Bitcoin slipped below the $64,000 level on Tuesday. Technical indicators for BCH, HYPE, and PUMP point to further downside risks amid broad-based market selling.

    The wider cryptocurrency market remains under strain as Donald Trump explores new legal avenues, citing national security concerns, to introduce additional tariffs. Meanwhile, U.S. equities ended Monday’s session in negative territory, adding to the cautious tone across risk assets.

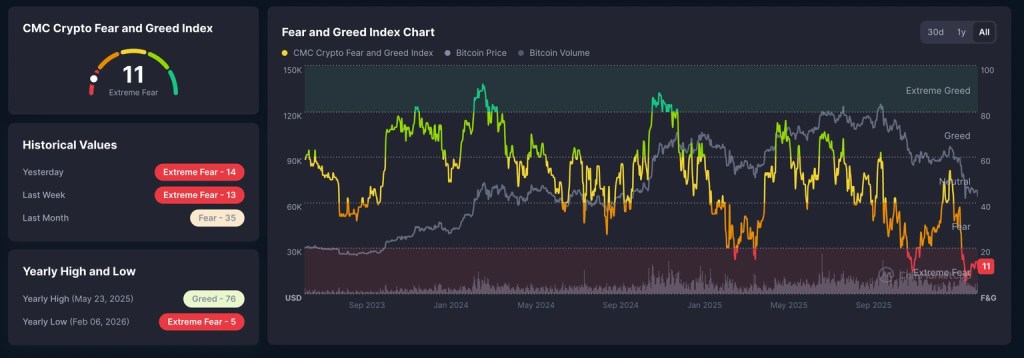
    CoinMarketCap’s Fear and Greed Index has dropped to 11, signaling extreme fear in the market and underscoring that sellers remain firmly in control.

    Bitcoin Cash slips beneath the $500 mark

    Bitcoin Cash was trading below the $500 level on Tuesday, extending losses after plunging 13% in the prior session. The altcoin has slipped beneath its 200-day Exponential Moving Average (EMA) at $544, while the 50-day EMA — now trending lower at $555 — is approaching a potential death cross formation.

    Technically, the path of least resistance appears tilted to the downside, with the next key support seen around $443, corresponding to the October 17 low.

    Daily chart indicators reinforce the bearish momentum shift. The Relative Strength Index (RSI) has dropped to 36, edging closer to oversold territory as selling pressure intensifies. Meanwhile, the Moving Average Convergence Divergence (MACD) has crossed below its signal line, signaling a bearish crossover.
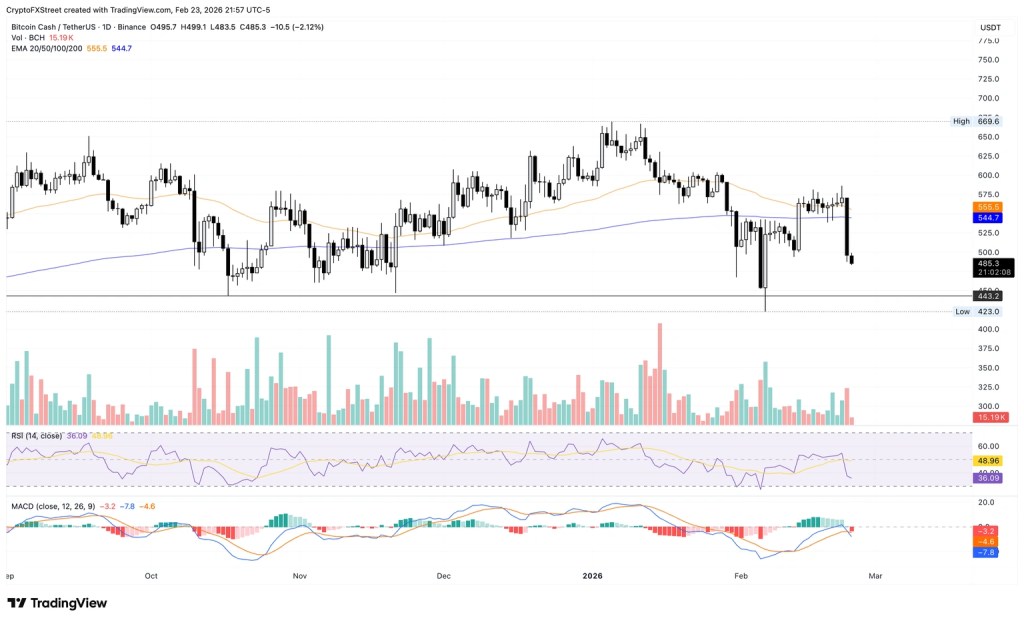
    BCH/USDT

    If Bitcoin Cash reclaims the $500 psychological barrier with a strong daily close above it, selling pressure could begin to fade, potentially paving the way for a rebound toward the 200-day EMA near $544.

    Hyperliquid retreats amid mounting downside momentum

    Hyperliquid was trading below $26 on Tuesday, extending losses after falling 9% in the previous session. The HYPE token has now declined for a fourth straight day and remains well under both its 50-day EMA at $29.08 and 200-day EMA at $32.37, reinforcing a bearish outlook.

    On the daily chart, the Relative Strength Index (RSI) stands at 38 and continues to trend lower, with further room before entering oversold territory. Meanwhile, the Moving Average Convergence Divergence (MACD) and its signal line are steadily declining, with widening bearish histogram bars signaling strengthening downside momentum.

    Immediate support levels are seen at $23.58, marking the December 21 low, followed by $20.82, the October 10 low.
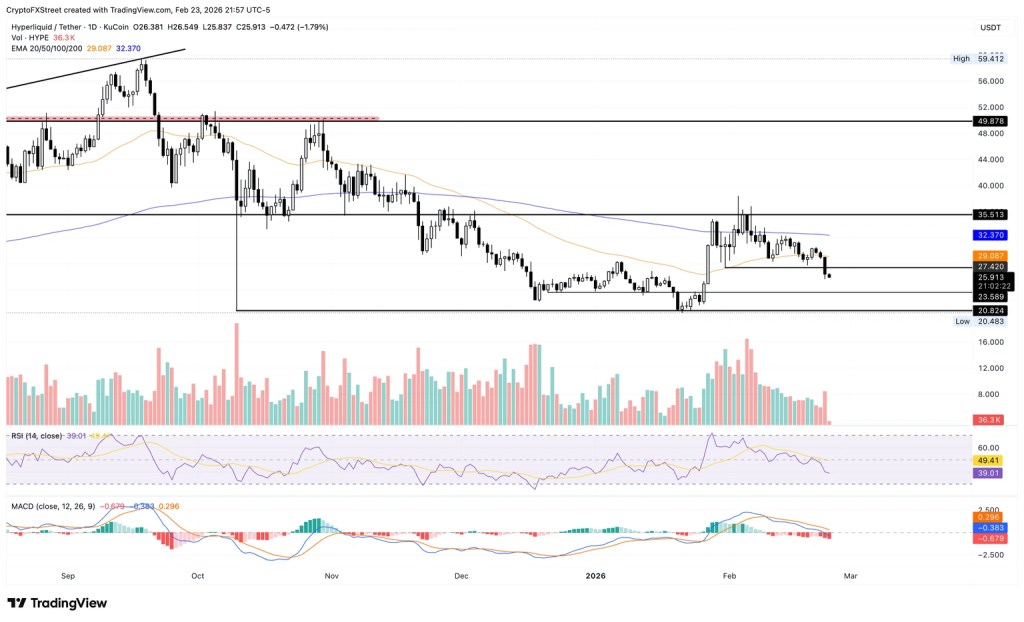
    HYPE/USDT

    On the upside, Hyperliquid would need to break back above its 50-day EMA at $29.08 to revive short-term bullish momentum and signal the start of a potential recovery.

    Pump.fun slides toward all-time low amid heavy selling

    Pump.fun was trading around $0.001800 at the time of writing on Tuesday, after tumbling 11% in the previous session. The meme-coin launchpad token has continued its broader downtrend since late September and is now eyeing support at $0.001678 — a level that previously sparked a rebound on February 6.

    A firm break and close below this support could open the door to further losses toward the S2 pivot at $0.001199.

    Momentum indicators point to mounting downside pressure. The Relative Strength Index (RSI) sits at 37, hovering just above oversold territory and reflecting persistent selling interest. Meanwhile, the Moving Average Convergence Divergence (MACD) and its signal line have resumed a downward trajectory following a bearish crossover on Monday, indicating renewed negative momentum.
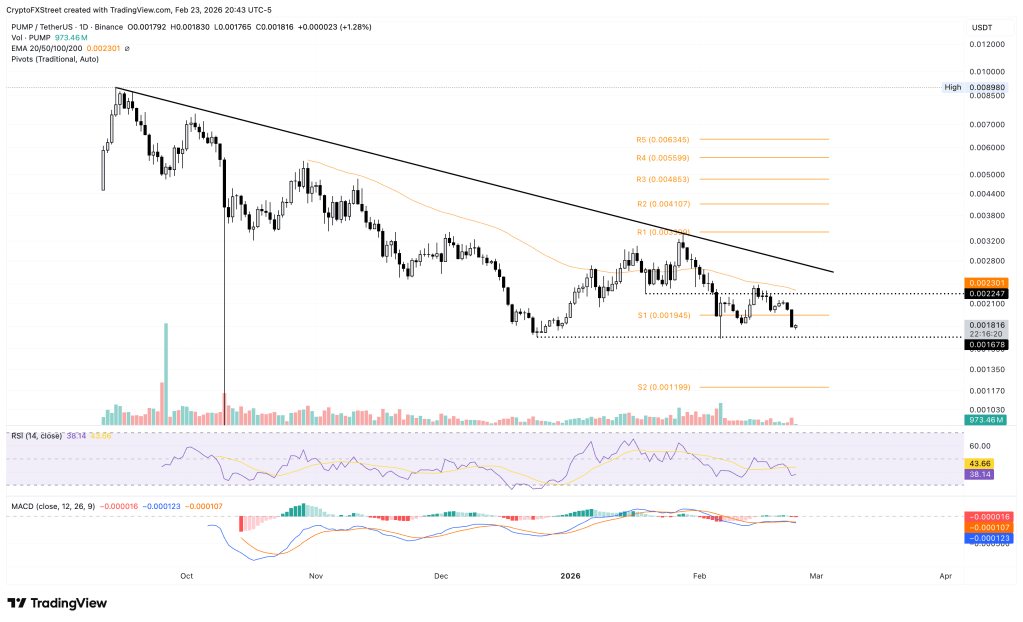
    PUMP/USDT

    If Pump.fun climbs back above the S1 pivot at $0.001945, it may pave the way for a move toward the 50-day EMA near $0.002300, potentially easing near-term bearish pressure.

    Sources: Vishal

  • S&P 500: Technical Pressures Mount Behind a Composed Surface

    The S&P 500 climbed early in the session, gaining roughly 50–60 basis points at its intraday peak, but those advances faded as the volatility crush quickly ran out of steam. As mentioned previously, the 1-day VIX had closed at 13.6—levels that typically coincide with 50–60 basis-point moves when volatility compresses. However, the 1-day VIX opened near 9, steadily increased during the session, and finished around 12, making the volatility unwind even more short-lived than anticipated.

    More notably, subtle signs of stress are emerging beneath the surface. The VVIX—which tracks implied volatility of the VIX itself—moved higher, and the S&P 500 left-tail index also rose. While the index may appear calm on the surface, these indicators suggest that underlying volatility is building and becoming harder to ignore.

    Single-stock volatility, reflected by VIXEQ, remains unusually elevated compared with the headline VIX, which measures index-level volatility. The spread between the two sits near 21.5. Historically, when this gap widens to such levels, it has often preceded meaningful market pullbacks.

    Although the surface looks stable, significant shifts are occurring underneath, serving as a cautionary signal. As earnings season progresses, implied volatility for individual stocks should continue to ease, as is typical. If that happens, the spread is likely to compress. That normalization process may require the unwinding of positioning, which could trigger a sharp downside move. This risk has been a recurring theme in prior commentary.

    Meanwhile, several sectors appear technically stretched. The Materials ETF (XLB) now shows a weekly RSI of 77 and is trading above its upper weekly Bollinger Band—classic overbought signals that suggest near-term vulnerability.

    The Industrials ETF (XLI) is even more extended, trading above its upper monthly Bollinger Band with an RSI of 78.3. Historically, similar conditions—in 2007, 2013–2014, and 2018—have led to prolonged consolidation phases. When monthly momentum reaches these extremes, sustaining further upside typically becomes difficult without first easing overbought pressures.

    The complication is that Industrials, Materials, Staples (XLP), and Energy (XLE) have been key drivers of the equal-weight S&P 500 (RSP) outperforming the cap-weighted index. This rotation helps explain why the headline S&P 500 often appears relatively steady: leadership shifts from one group to another, offsetting weakness elsewhere. The large-cap “Mag 7” stocks alone are no longer carrying the market.

    One possible factor behind this dynamic is the growing influence of zero-DTE options and heavy trading in short-dated contracts. While definitive proof is lacking, the pattern suggests dealer hedging flows may be shaping price action around heavily concentrated strike levels.

    For instance, if substantial open interest exists at a strike like 6,950, positioning could effectively pin the index near that level. As a result, underlying sector rotation may occur to keep the index aligned with options pricing. This could drive increased dispersion beneath the surface, with individual sectors making larger moves even as the broader index appears relatively unchanged.

    Sources: Michael Kramer

  • Gold jumps back above $5,000 an ounce as Iran tensions fuel safe-haven demand

    Gold prices climbed back above key technical levels during Asian trading on Wednesday, as renewed signs of tension between the United States and Iran fueled safe-haven demand for the precious metal.

    Bullion extended its rebound from Tuesday after sharply recovering from recent losses, with dip-buying activity also remaining strong following last week’s more than $1,000 price sell-off.

    Spot gold gained 2% to $5,048.37 per ounce by 21:00 ET (02:00 GMT), while April gold futures advanced 2.8% to $5,017.19 per ounce.

    Other precious metals also moved higher on Wednesday, building on the rebound seen in the previous session. Spot silver gained 0.5% to $85.5245 per ounce, while spot platinum climbed 1.7% to $2,256.04 per ounce.

    Iran concerns return ahead of upcoming nuclear talks

    Renewed concerns over escalating tensions between the United States and Iran were a key catalyst for safe-haven demand, particularly after overnight reports that U.S. forces shot down an Iranian drone over the Arabian Sea.

    In a separate development, Iranian gunboats were reported to have approached a U.S.-linked oil tanker in the Strait of Hormuz.

    These incidents partially offset earlier statements from both Tehran and Washington indicating that talks would be held this Friday. News of the planned negotiations had previously eased market anxiety and weighed on safe-haven demand for gold.

    Gold’s recent pullback was largely driven by expectations that U.S. President Donald Trump’s nominee for Federal Reserve chair, Kevin Warsh, may adopt a less dovish stance than markets had anticipated. This fueled a sharp rally in the U.S. dollar, pressuring precious metals, while gold also faced profit-taking after surging to a record high near $5,600 per ounce last week.

    Despite the recent decline, gold remains up nearly 15% so far in 2026.

    ANZ analysts noted that the core fundamentals underpinning gold’s strength—safe-haven demand, robust physical buying, and ongoing central bank purchases—remain firmly intact.

    Sources: Ambar Warrick

  • CME margin increases drive sharp silver price rout

    The Lone Ranger began as a radio series in 1933 and later ran as a television show for 21 years until 1954. The story follows the last surviving Texas Ranger, who is nursed back to health by Tonto, a Potawatomi tribesman. Together, they ride across the American West on their horses, Silver and Scout, fighting injustice while financing their mission through a silver mine that supplies both income and ammunition.

    When the pair set off in pursuit of villains, the announcer famously cried, “Hi-Yo Silver, Away!” The show’s iconic theme music was written for the film The Lone Ranger and the City of Gold.

    On Friday, however, silver traders were echoing a very different refrain: “Hi-No Silver, Away!” Silver led a broad selloff across precious metals and related ETFs. The SLV ETF plunged 28.5%, while GLD fell 10.3%. Despite the steep losses, trading volumes did not point to a full-blown panic in either fund.

    Along with our colleague Michael Brush, we spent the morning reviewing the various explanations behind silver’s one-day bear market and gold’s sharp one-day correction. Early on Friday, the initial selloff may have been triggered by President Donald Trump’s nomination of Kevin Warsh to replace Jerome Powell as Federal Reserve chair. On the geopolitical side, reports that Iran is willing to negotiate with the U.S.—but only on terms Washington finds unacceptable—seem unlikely to have driven the rout.

    Later in the day, at 2:00 p.m. EST, CME Group announced another increase in maintenance margin requirements—the second hike in three days—taking effect after the market close on Monday, February 2. Maintenance margins were raised to 8% from 6% for gold, to 15% from 11% for silver, to 15% from 12% for platinum, and to 16% from 14% for palladium. Margins on copper were also increased.

    By announcing the margin increase ahead of Friday’s close, the CME effectively signaled to traders that any positions carried into the weekend would face substantially higher collateral requirements by Monday. This prompted many market participants to unwind positions in the final hours of Friday’s session, contributing to the sharp late-day acceleration in the price decline.

    As a result, we discount the various conspiracy theories circulating in the market, including suggestions that the move marks the beginning of another Hunt Brothers–style silver crisis like March 27, 1980, when silver prices collapsed from about $21 to below $11 in a single day.

    Notably, Warsh’s nomination should arguably have been supportive for precious metals, as he has favored boosting growth through lower interest rates and has downplayed the need for the Fed to be overly concerned about inflation at present.

    Friday’s December PPI report was also hotter than expected and, in theory, should have added to the bullish case for precious metals. Headline producer prices rose 0.5% month over month, while the core index increased 0.7%. On a year-over-year basis, headline and core PPI inflation climbed to 3.0% and 3.3%, respectively. The data suggest producers may be beginning to pass on higher costs from tariffs and a weaker currency further along the supply chain.

    We asked Michael Brush for an update on insider buying activity, and he said: “It’s still early, but so far corporate executives and directors have shown little interest in buying the recent market weakness. Their cautious stance remains in place. Buying by investors classified as insiders due to large holdings—10% owners—has increased slightly, but this type of activity is generally less meaningful as a market signal.”

    Sources: Ed Yardeni

  • Gold hits new record above $5,200 as Fed decision looms

    Gold prices climbed toward a fresh record near $5,220 during Asian trading on Wednesday, extending gains on a weaker U.S. dollar, persistent geopolitical tensions and ongoing economic uncertainty. Investors are now awaiting the Federal Reserve’s interest rate decision later in the day for further direction.

    Fundamental Analysis Overview

    Expectations of further policy easing by the U.S. Federal Reserve, persistent selling pressure on the U.S. dollar, continued central bank purchases, and record inflows into exchange-traded funds have provided strong support for gold prices.

    Although U.S. President Donald Trump stepped back from a tariff threat after saying a framework agreement had been reached on a future Greenland deal with NATO, the brief episode raised concerns about the reliability of global alliances. These doubts, combined with the prolonged Russia–Ukraine conflict, continue to fuel safe-haven demand for gold. Russia launched another large-scale drone and missile assault on Ukraine during the second day of U.S.-mediated peace talks in Abu Dhabi over the weekend, which concluded without an agreement. While trilateral discussions are set to resume on February 1, expectations for a breakthrough in the nearly four-year conflict remain low, keeping geopolitical risks elevated.

    Further weighing on market sentiment, Trump warned on Saturday that the U.S. could impose a 100% tariff on Canada should it proceed with a trade agreement with China. The possibility of renewed tensions over Greenland and other unpredictable policy moves from the Trump administration has undermined confidence in the U.S. dollar. As a result, the Dollar Index (DXY) has fallen to its lowest level since September 2025, pressured further by market expectations that the Fed could cut rates twice more in 2025. This environment continues to favor non-yielding assets such as gold, particularly as attention turns to the two-day FOMC meeting that began on Tuesday.

    The Federal Reserve is set to announce its policy decision on Wednesday and is widely expected to keep interest rates unchanged. As such, investor focus will center on the accompanying statement and Fed Chair Jerome Powell’s press conference for signals on the future policy path. Any guidance on the timing and pace of potential rate cuts will be critical in shaping near-term dollar movements and determining gold’s next directional move. In the shorter term, U.S. Durable Goods Orders data due later Monday could generate trading opportunities during the North American session.

    On the demand side, the People’s Bank of China extended its gold-buying streak for a fourteenth consecutive month in December. Other emerging market central banks, including those of Poland, India, and Brazil, were also active buyers in late 2025 and early 2026. Meanwhile, global investment demand through gold ETFs rose 25% in 2025, with total holdings increasing to 4,025.4 tonnes from 3,224.2 tonnes a year earlier. Assets under management climbed to $558.9 billion, reinforcing gold’s bullish case and supporting expectations for a continuation of the well-established uptrend amid a favorable fundamental backdrop.

    XAU/USD Technical Outlook

    The rising channel originating from $4,464.07 continues to support the broader uptrend, with upside currently constrained near $5,101.21. The MACD remains in positive territory, although the histogram is starting to narrow, indicating fading momentum even as the MACD line stays above the signal line. Meanwhile, the RSI is elevated around 78, signaling overbought conditions that may limit near-term gains and favor consolidation near the upper boundary of the channel.

    Should prices fail to break decisively above the channel top, a corrective move toward support at $4,934.92 could develop. Further contraction in the MACD histogram would strengthen the case for a pullback, while a downturn in the RSI from overbought levels would point to mean reversion within the channel. On the other hand, if bullish momentum persists and MACD remains supportive, the prevailing uptrend would stay intact, maintaining the upside bias defined by the ascending channel.

    Sources: Fxstreet

  • Why Prediction Markets Pose a Threat to Thematic ETF Providers

    Trump has effectively set off a regime change in Venezuela. The Monroe Doctrine has suddenly become relevant again. A special forces mission in Caracas plays across social media, Nicolás Maduro is taken into U.S. custody to face trial, and Washington declares it will run the country temporarily. No lives are lost. Global attention immediately focuses on Venezuela’s massive oil reserves, drawing in major energy companies.

    Overnight, ETFs respond predictably. Defense-related funds soar, while oil services ETFs rally on expectations of rebuilding, drilling, and upgrading energy infrastructure.

    Initially, that seems reassuring for ETF providers. Thematic and sector-based strategies still appear to “work.” Despite elevated fees, retail investors’ chronically bad timing, and the tendency for funds to debut right at the top of market themes, money still pours in when major geopolitical shocks occur.

    But here’s the difficult reality. By 2026, issuers who depend on thematic ETFs will face a much tougher landscape. Not because their products stop being relevant, but because a newer, more direct alternative is quietly overtaking them: Prediction markets.

    I say this frankly as someone inside the ETF business who is seeing investor habits evolve in real time, particularly among those under 30. Across social platforms, younger millennials and Gen Z investors are bypassing thematic ETFs entirely and placing their macro bets through prediction markets instead.

    Understanding Prediction Markets

    A prediction market is a marketplace where people buy and sell contracts based on the outcome of a clearly defined event. These contracts usually pay out either $1 if the event happens or $0 if it doesn’t. Their prices move beforehand as expectations change.

    Polymarket and Kalshi are currently two of the biggest platforms. Although their legal frameworks and back-end systems vary, they function in much the same way. Users can trade contracts on issues such as whether a government decision will be made, if interest rates will be reduced by a set deadline, or whether a geopolitical conflict will intensify. When the result is known, the contracts settle automatically.

    Most of these platforms operate with or alongside crypto, enabling fast account setup, funding, and settlement. More significantly, they remove extra layers of indirection. Instead of buying securities that represent a theme, users wager directly on the outcome of the event itself.

    Why Prediction Markets Could Undermine Thematic ETFs

    Prediction markets react much more aggressively to fresh information. When a development raises the likelihood of a given outcome, contract prices can jump by double digits within moments. That speed and sensitivity is a major draw for investors.

    In the Venezuela scenario, markets tied to potential U.S. intervention rallied far more dramatically than any defense or energy-themed ETF—even those offering multiple layers of leverage. ETFs spread exposure across many companies, balance sheets, and indirect impacts. Prediction markets offer pure exposure to a single event.

    Thematic ETF investing, by contrast, requires multiple steps of inference. You begin with a headline. You estimate which sectors might benefit. You choose the companies with the most relevant exposure. You locate an ETF with a reasonable basket, verify fees and trading volume, and then hope the broader market validates your thesis.

    Prediction markets compress that whole decision chain into a single action. You find the contract and place your bet. The outcome may be all-or-nothing, and the pricing is constantly arbitraged, but the simplicity is the appeal. They make sense instantly. Gen Z especially gravitates toward speed, transparency, and the freedom to get in and out of a position without digging through fund disclosures, holdings breakdowns, or factor metrics.

    The Outlook for Thematic ETF Strategies

    This isn’t a death notice for the category. I don’t believe sector ETFs are disappearing. Low-cost, market-cap sector funds—especially those priced below 10 basis points and spanning the 11 GICS sectors—will continue to serve as essential asset-allocation building blocks.

    Major thematic ETFs should also endure. Products with over $1 billion in assets have the size, trading depth, and embedded capital gains that tend to keep investors from exiting. Momentum still works in their favor.

    Where the real pressure shows up is at the edges. Smaller thematic products—particularly those with less than $50 million, along with brand-new funds launched to chase the latest storyline—are entering a very tough competitive landscape. Their rivals are no longer just other ETFs. They’re up against prediction markets that provide quicker, simpler, and more emotionally direct ways to express a macro belief.

    If you’re running an ETF business, now might be the moment to tap the brakes. The old playbook—rolling out a stream of hyper-niche thematic funds and hoping a few gain traction—looks much less sustainable in 2026. With retail investors tiring out, fees getting squeezed, and prediction markets gaining momentum, the “launch everything and see what works” model is hitting some real limits.

    Sources: Investing

  • Frequently Asked Questions (FAQ) From Speculators (Traders) and Investors

    Are there any scams in the financial market?

    Yes, scams exist in every market, including traditional ones. This happens because scammers see opportunities to make illegal money by exploiting market demand.

    What scamming cases are common in this market?

    Case 1: Following a signal provider’s instructions to open large positions with a small account, resulting in quick losses.

    Case 2: Leading investors to invest in assets that are not available or do not exist in the market.

    Case 3: Convincing people to deposit funds with a broker or financial institution that lacks a financial services license.

    Case 4: Forging company’s financial documents and records to deceive investors.

    How to avoid scam in this market?

    Suggestion 1: Verify the financial service license of the broker or financial institution.

    Suggestion 2: Verify the educational background of the signal provider.

    Suggestion 3: Verify which company provides the asset and confirm its legal business activities.

    Suggestion 4: Contact to The Eternal Sovereign to support further

    What knowledge is needed to speculate (trade) or invest in the financial market?

    Once you have a foundation, the knowledge you need to focus on is fundamental and technical analysis to trade or invest effectively.

    1. Fundamental knowledge helps you forecast the market’s future direction and protect your funds effectively.
    2. Technical knowledge helps you execute positions more precisely.

    For a complete understanding, please refer to the Knowledge section.

    Does having knowledge mean I can speculate (trade) or invest effectively?

    No, having knowledge without practice makes it difficult to speculate and invest effectively. You will need a team or advisor to help you make informed decisions through market analysis and practical education.

    Therefore, you can see that from small to large financial institutions, they always have teams or advisors to support decision-making.

    What are the benefits of news and analysis (opinions and analysis) in the financial market?

    1. Stay Informed: Keeps you updated on market events, trends, and economic changes.
    2. Better Decision-Making: Helps you understand market sentiment and potential impacts on assets.
    3. Identify Opportunities: Spot emerging trends or risks early through expert insights.
    4. Diversify Perspectives: Gain different viewpoints to avoid biased decisions.
    5. Improve Timing: News and analysis can guide when to enter or exit positions.

    If I have many other questions, requests, or issues that need to be addressed, what should I do?

    You can contact us anytime to resolve your issues. Our advice and consulting services are free of charge. Please don’t hesitate to reach out.

  • 5 Effective Market Volatility Strategies to Protect and Grow Your Long-Term Wealth

    Market volatility often feels personal. One week, your investment portfolio appears stable; the next, it drops, headlines turn alarming, and every conversation sounds like a prediction. This emotional rollercoaster is normal, but panic selling can turn temporary market swings into lasting financial damage.

    For high-net-worth families and business owners, the stakes are even higher. Investments are not for entertainment—they serve real financial goals like retirement income, business transitions, philanthropy, and preserving long-term wealth.

    The good news is, successful investing doesn’t require perfect timing. Instead, it demands a consistent process that withstands diverse market conditions, volatile periods, and unforeseen events. The most effective market volatility strategies emphasize preparation, discipline, and risk management, all geared toward sustainable long-term growth.

    Key Takeaways

    • Market volatility is a normal part of investing; having a rules-based plan helps minimize panic selling and costly mistakes.
    • Effective risk management begins with clear asset allocation, defined investment horizons, and practical guardrails.
    • Portfolio diversification works best when intentional and based on asset class exposure—not simply by increasing the number of holdings.
    • Regular rebalancing reinforces the discipline of “selling high” and helps reduce volatility over time.
    • Maintaining a steady investment psychology keeps investors focused on long-term performance rather than daily market fluctuations.

    What Market Volatility Really Means in the Stock Market

    Market volatility reflects shifting expectations. Stock prices fluctuate, bond yields change, and the market continuously reprices risk as economic conditions evolve. Factors such as inflation risk, interest rate changes, and unexpected news can quickly alter market values.

    Volatility is not limited to equities. When interest rates rise, bond prices typically fall, often surprising investors who expect fixed-income assets to provide stability. In the bond market, price fluctuations are driven by interest rate risk, credit risk, and credit quality—especially in high-yield bonds and certain bond funds.

    Not every market downturn signals a crisis, but each one tests whether your portfolio aligns with your risk tolerance and investment objectives.

    Investment Psychology: Why Many Investors Make Costly Moves

    During volatile periods, investment psychology can undermine sound judgment. Loss aversion makes market declines feel unbearable, while recency bias convinces investors that recent events will dictate future outcomes. Coupled with constant commentary on indices like the Dow Jones and “potential winners,” investors face emotional pressure from all sides.

    Risk-averse investors are particularly vulnerable. When fear peaks, many abandon their original plans and move to cash at inopportune moments. Hesitation to re-enter the market thereafter can significantly harm long-term returns.

    The solution is not bravado but structure. A well-designed, rules-based investment plan reduces the likelihood of reactive decisions during turbulent times.


    Practical Risk Management Strategies for a Diversified Portfolio

    During periods of market turbulence, the objective isn’t to predict headlines but to manage risk effectively and keep your balanced portfolio aligned with your long-term financial goals.

    1. Start With Asset Allocation and Risk Tolerance

    Asset allocation is one of the most important factors driving long-term investment performance. A well-designed allocation reflects both your risk tolerance—the level of risk you are comfortable with—and your risk capacity, which is more practical and considers your time horizon, liquidity needs, and how much additional risk your financial plan can realistically withstand without forcing unwanted changes.

    If a market downturn would compel you to sell assets to cover life expenses, your portfolio’s overall risk might be too high for your situation. This is especially critical for business owners nearing liquidity events or investors approaching retirement, who need to ensure their allocation aligns with their unique financial circumstances.

    2. Build Portfolio Diversification That Holds Up Across Market Conditions

    Portfolio diversification is effective when your assets respond differently under the same market conditions. Simply owning multiple mutual funds tracking similar benchmarks can still expose you to a single dominant risk factor.

    A truly diversified portfolio includes exposure to multiple asset classes, such as:

    • Equities across various sectors
    • International stocks for broader geographic exposure
    • Fixed income securities selected by credit quality and duration
    • Cash or short-term instruments to manage liquidity risk

    This approach reduces overall portfolio volatility by not relying on a single market narrative. It also preserves long-term growth potential by avoiding overconcentration in any one area.

    3. Use Fixed Income Investments With Eyes Open

    Bonds can provide portfolio stability, but selecting the right bonds is crucial. Government and high-quality bonds often behave differently from corporate or high-yield bonds, especially during economic stress. Credit risk and duration significantly impact bond performance.

    Rising interest rates typically cause bond prices to fall, particularly for longer-duration bonds. Bond funds may also experience unexpected market value fluctuations, and selling during market stress can lock in losses. Understanding interest rate risk, credit quality, and bond price sensitivity across economic cycles is essential.

    Fixed income investments play an important role but should be tailored to your time horizon and investment objectives—not based on assumptions or market noise.

    4. Rebalancing With Discipline to Manage Risk

    Rebalancing is a disciplined approach to managing risk and maintaining a balanced portfolio. It helps prevent emotional trading by systematically adjusting your holdings back to your target asset allocation.

    Over time, rebalancing reinforces the “sell high” discipline by trimming assets that have grown disproportionately and adding to those that have lagged behind. While it’s not a guarantee of gains, this method effectively controls risk and reduces portfolio drift during volatile market conditions.

    5. Plan Liquidity to Reduce Forced Selling

    Liquidity risk becomes a critical concern when cash is needed during a market downturn. Having a clear cash plan, maintaining an emergency reserve, and carefully timing large expenses can help minimize the risk of being forced to sell investments at unfavorable prices.

    This strategy is especially vital for investors with irregular cash flows, upcoming tax obligations, or significant business expenses. A well-structured liquidity plan safeguards your long-term investment goals by preventing your portfolio from being tapped as an emergency fund.

    Sources: Investing