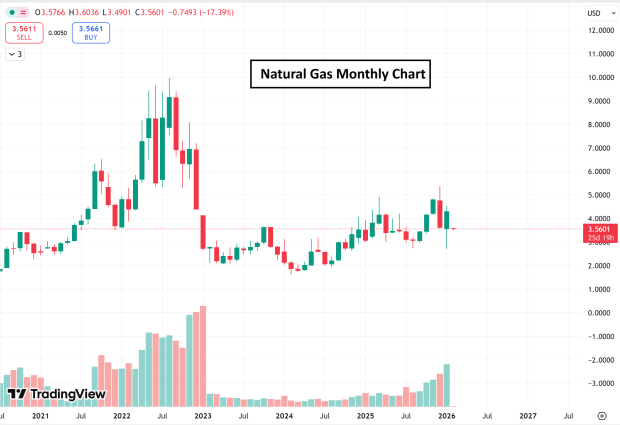
Following a sharp and prolonged rally triggered by the outbreak of the Russia–Ukraine war in 2022, natural gas prices have since collapsed. The downturn has been driven by record U.S. output, warmer-than-expected winters, and improvements in drilling technology, all of which have contributed to a significant supply–demand imbalance.
Over the past five years, natural gas—and related instruments such as the US Natural Gas Fund ETF (NYSE: UNG)—has dropped nearly 60%, reinforcing its long-standing reputation as the “widow maker.”
However, following a sharp cold-weather-driven spike, warmer February forecasts have dampened near-term demand expectations, triggering a roughly 15% selloff in natural gas prices on Sunday evening.
Even so, a number of bullish catalysts are coming into focus that could pave the way for a powerful, 2022-style rally in natural gas. Below are three key reasons to maintain a bullish outlook, including:
Rising Energy Demand From Data Centers
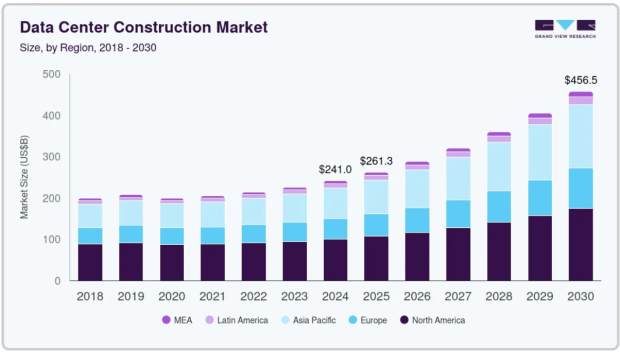
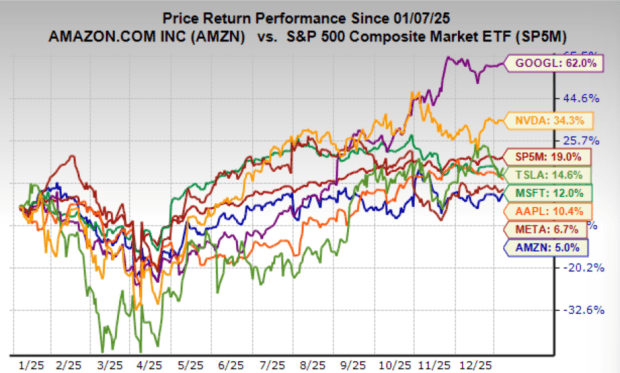
Already, the buildout of AI-focused data centers represents the largest infrastructure expansion in history. Data from Grand View Research shows that the data center construction market surpassed $250 billion in 2025, as hyperscalers such as Alphabet (NASDAQ: GOOGL) and Microsoft (NASDAQ: MSFT) race to secure leadership in artificial intelligence. Looking ahead, spending on AI data center construction is projected to surge to $450 billion by the end of the decade.
Recent remarks from Nvidia’s (NASDAQ: NVDA) influential CEO, Jensen Huang, reinforce this view. Speaking at the World Economic Forum (WEF) 2026 in Davos, Switzerland, Huang pushed back against concerns of an AI bubble, pointing to rising spot prices—even for older GPUs—and the scarcity of available units for rent. He also suggested that trillions of dollars of capital are poised to flow into the development of increasingly powerful AI models.
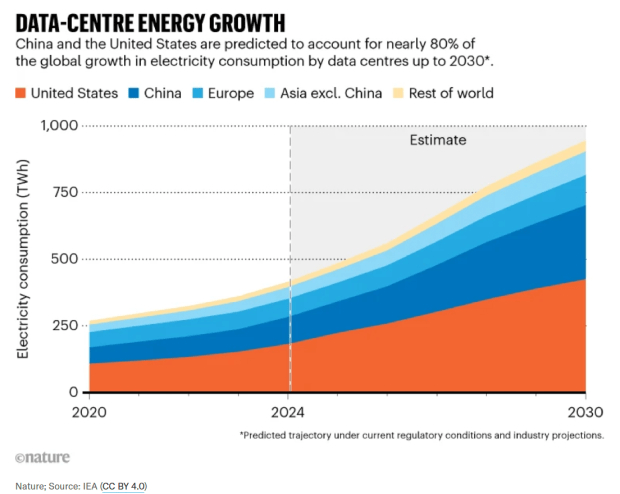
That said, hyperscalers face a significant constraint: energy. Power costs are climbing as electricity demand from AI data centers is projected to double by the end of the decade.
While renewable and nuclear energy continue to dominate Wall Street’s narrative, both come with relatively high upfront costs. In the near term, natural gas remains the most reliable, scalable, and cost-effective source of power for meeting large-scale electricity demand.
U.S. LNG Producers Capitalize on Global Demand
Several major liquefied natural gas (LNG) export terminals are set to come online in 2026, expanding U.S. producers’ ability to supply Europe and other global markets. With U.S. natural gas prices well below those in Europe, exporters are incentivized to ship more volumes overseas. This dynamic is expected to absorb excess domestic supply, helping establish a solid price floor for U.S. natural gas.
In addition, the Trump administration has emphasized an “American Energy Dominance” strategy, securing multiple long-term LNG supply agreements with countries such as Japan and Qatar. These deals underpin durable, long-term demand for U.S. LNG exports.
Natural Gas Poised to Replace Coal
According to the U.S. Energy Information Administration (EIA), U.S. coal production declined 11.3% year over year, with the number of active coal mines dropping from 560 to 524. Although many countries are transitioning toward renewable sources such as solar, these alternatives are currently insufficient to fully replace coal-fired generation. In the near term, natural gas offers the most viable solution, given its scalability, cost efficiency, and significantly lower emissions—producing roughly half the CO₂ of coal.
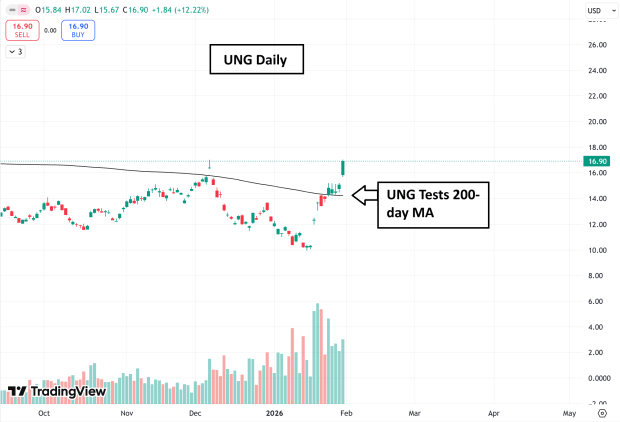
Technical Outlook for Natural Gas
Over the past several weeks, UNG has surged from roughly $10 to $16.90. However, warmer-than-expected weather forecasts suggest the ETF may pull back to test its 200-day moving average. Bulls will be watching closely this week to see whether that key support level holds.
Bottom Line
While natural gas is well known for its short-term volatility and weather-driven swings, the underlying fundamentals are increasingly pointing toward a bullish long-term trajectory. Rising energy demand from AI data centers, combined with expanding U.S. export capacity, is expected to drive sustained growth in demand over time.
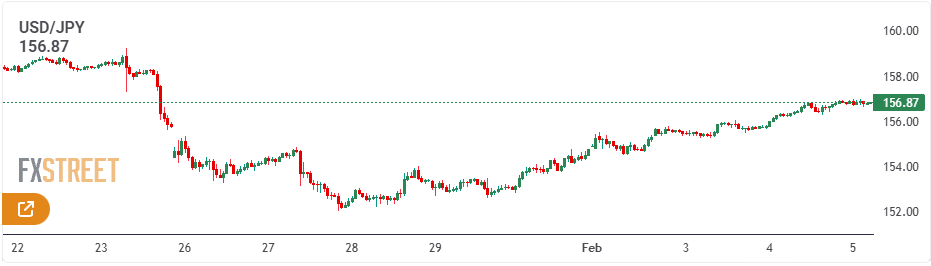
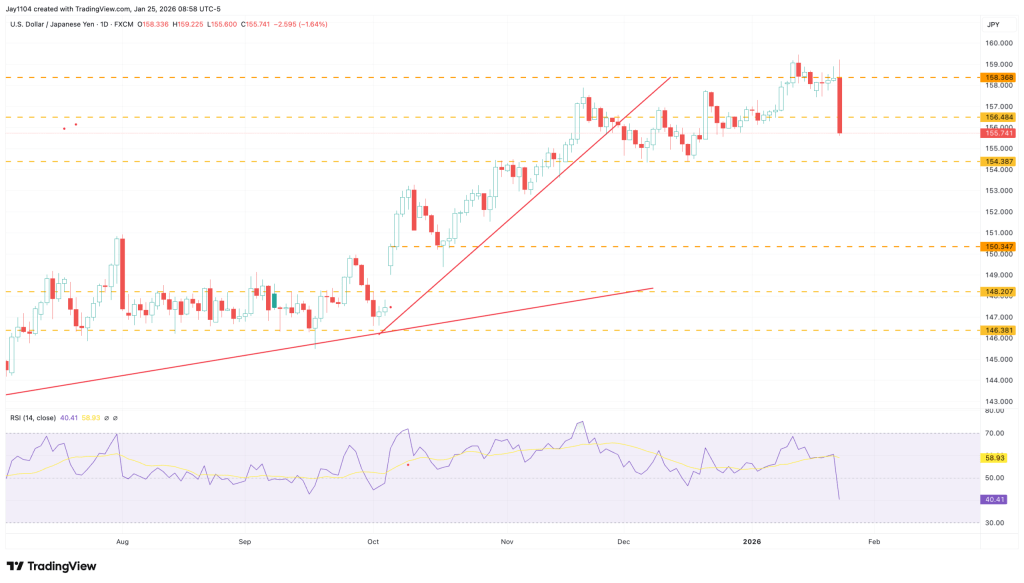
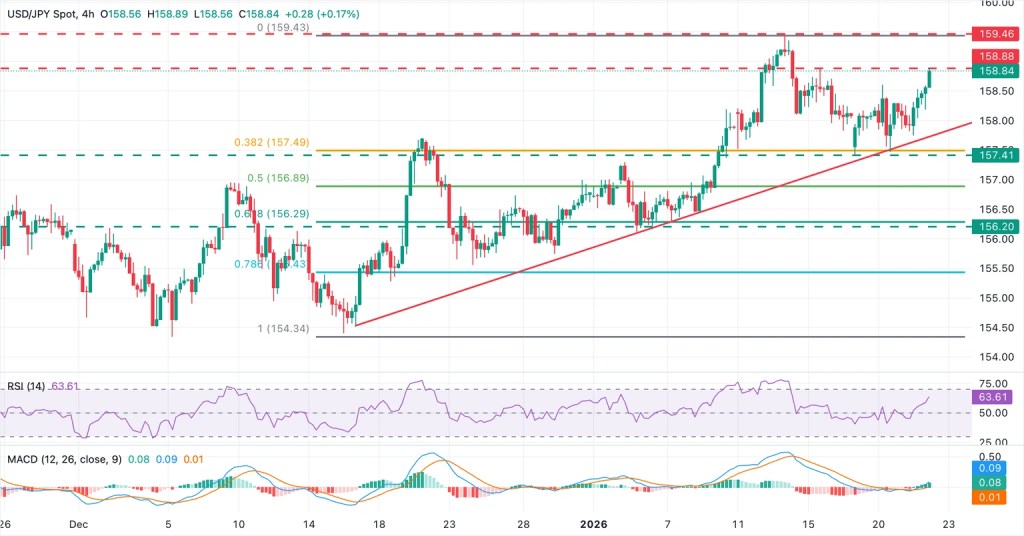
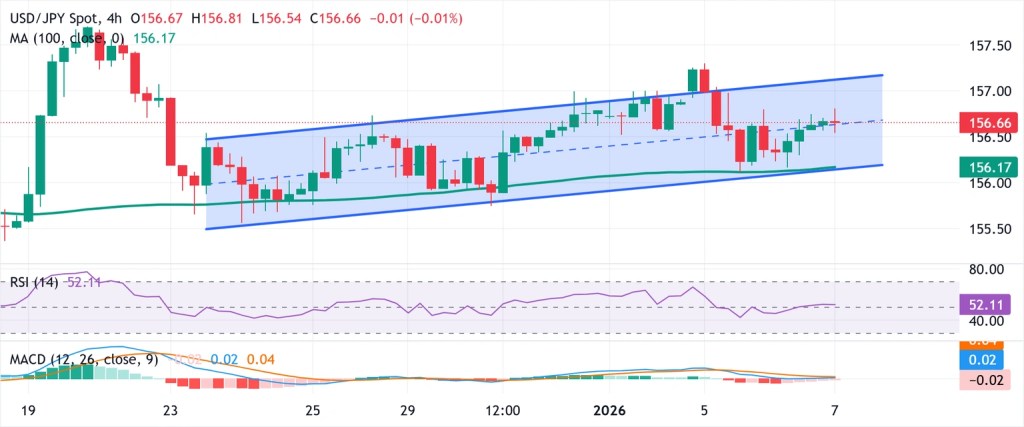
USD/JPY paused its advance near the 157.00 mark during Thursday’s Asian session, as a renewed bout of risk aversion revived safe-haven demand for the Japanese yen.
That said, the yen remains on fragile footing amid ongoing concerns over Japan’s fiscal position under Prime Minister Sanae Takaichi’s expansionary spending agenda, helping to limit downside pressure on the pair.
Looking ahead, the U.S. JOLTS Job Openings report could provide fresh impetus for near-term trading.
USD/JPY Technical Analysis
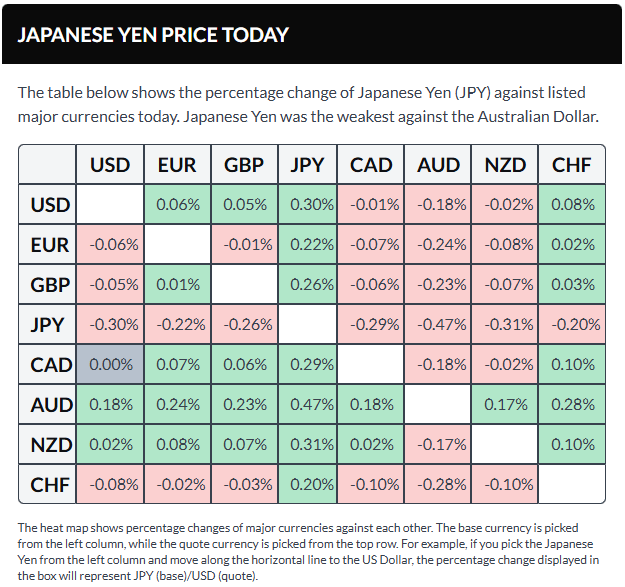
The Japanese yen emerged as the weakest-performing G8 currency on Wednesday. Its sharp underperformance has lifted USD/JPY above the 156.80 level at the time of writing, putting the pair on course for a roughly 3% rebound from last week’s lows.
Fundamental Analysis
Investors are offloading the yen broadly ahead of this weekend’s snap election. Rising support for Prime Minister Takaichi has fuelled concerns that a stronger electoral mandate would allow her to extend tax cuts and expand stimulus spending, heightening fears of fiscal strain.
Markets Brush Aside Intervention Concerns
Tokyo authorities have warned of possible intervention to curb excessive yen volatility, but those concerns have been largely brushed aside. Comments from Prime Minister Takaichi highlighting the benefits of a weaker yen, along with the U.S. Treasury Secretary’s denial of any coordinated effort to stabilise the currency, have instead driven the yen sharply lower across the board.
The U.S. dollar, however, is not especially strong on Wednesday. While markets continue to react positively to the nomination of Kevin Warsh as the next Federal Reserve Chair and to the end of the brief partial government shutdown, the recent rally in the U.S. Dollar Index appears to be losing momentum.
Attention now turns to upcoming U.S. data, including the Services PMI and the ADP Employment Change report. The latter could be particularly influential, as the government shutdown has delayed Friday’s official nonfarm payrolls release, leaving private-sector jobs data as a key guide for markets.
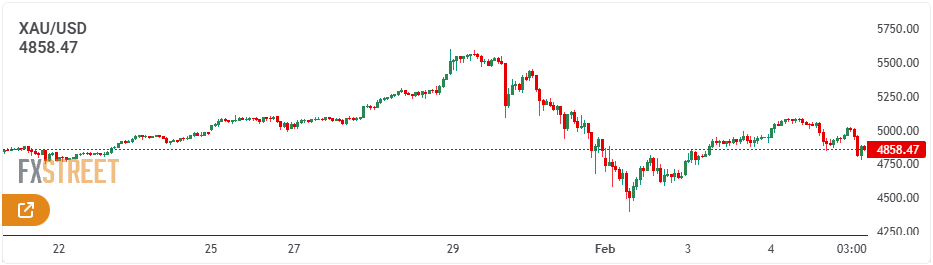
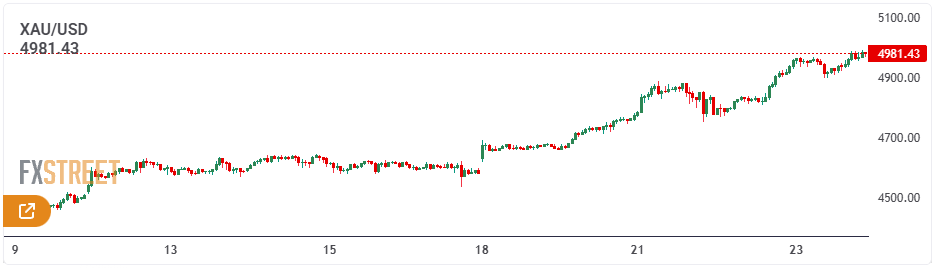
Gold saw choppy price action during Thursday’s Asian session, oscillating within a roughly $200 range. Traders are now looking to the U.S. JOLTS Job Openings report and developments on the geopolitical front—particularly U.S.–Iran tensions—for clearer directional cues.
XAU/USD Technical Analysis
The 21-, 50-, 100- and 200-day SMAs are all sloping higher, with the 21-day positioned above the longer-term averages, highlighting a well-established bullish structure. Prices remain above these indicators, confirming that buyers retain control. Initial support is seen at the 21-day SMA near $4,827.45, followed by the 50-day SMA at $4,532.68. The 14-day RSI has eased to a neutral 52.58, suggesting momentum is consolidating after retreating from overbought levels.
The positive alignment of the moving averages favours a buy-on-dips approach while prices hold above the short-term average. A more pronounced correction would bring the 100-day SMA at $4,271.21 into focus, with the 200-day SMA at $3,821.77 reinforcing the broader uptrend. As long as the RSI remains above the 50 midpoint, the bullish bias stays intact, while a sustained break below it could signal scope for a deeper retracement.
Fundamental Analysis
Gold ended Wednesday little changed near $4,950 after choppy two-way trading. The metal initially rebounded sharply, testing the $5,100 area amid uncertainty surrounding the Federal Reserve’s future policy direction under Kevin Warsh, which weighed broadly on the U.S. dollar.
Renewed geopolitical tensions in the Middle East and between Russia and Ukraine also lent support to gold prices, alongside concerns about potential economic data disruptions stemming from the U.S. partial government shutdown that concluded on Tuesday.
Sentiment shifted during the U.S. session after the ISM Services PMI signalled firmer inflation pressures, prompting a rebound in the dollar. At the same time, an intensifying tech-sector sell-off on Wall Street unsettled markets, driving demand for the greenback as a safe haven.
Additional USD strength came from renewed weakness in the Japanese yen amid rising fiscal and political concerns, which pushed USD/JPY higher and further supported the dollar.
The USD rebound triggered a sharp pullback in gold, although buyers stepped back in near the key $4,950 psychological support level.
Early Thursday, gold remains under pressure after once again failing above the $5,000 resistance zone. The U.S. dollar continues to advance, hitting fresh two-week highs against its major peers as risk sentiment deteriorates amid a global technology sell-off.
The decline in global data analytics, professional services, and software stocks followed Anthropic’s launch of plug-ins for its Claude Cowork agent, which raised fresh concerns about AI-driven disruption across these industries, according to Reuters.
Looking ahead, the delayed U.S. JOLTS Job Openings report could offer gold some relief, particularly if it reinforces expectations for two Federal Reserve rate cuts this year. Conversely, an extended sell-off in the Japanese yen could spark another wave of heavy selling pressure in gold.
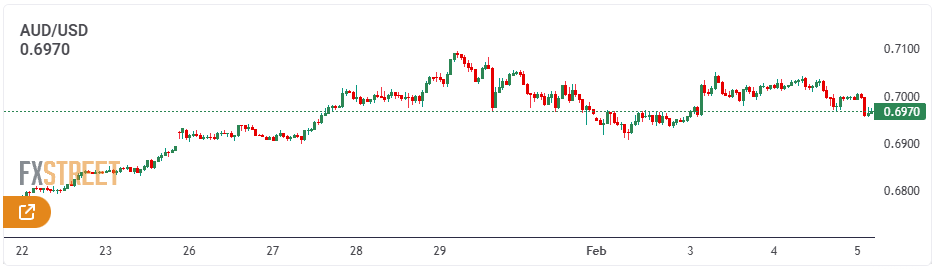
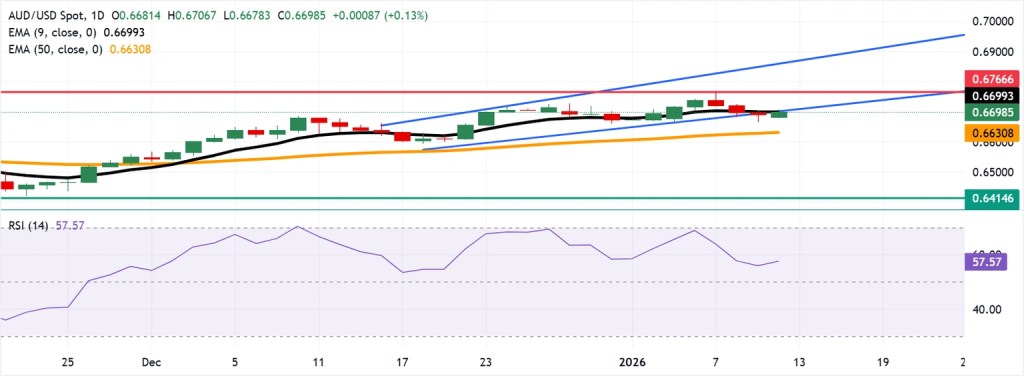
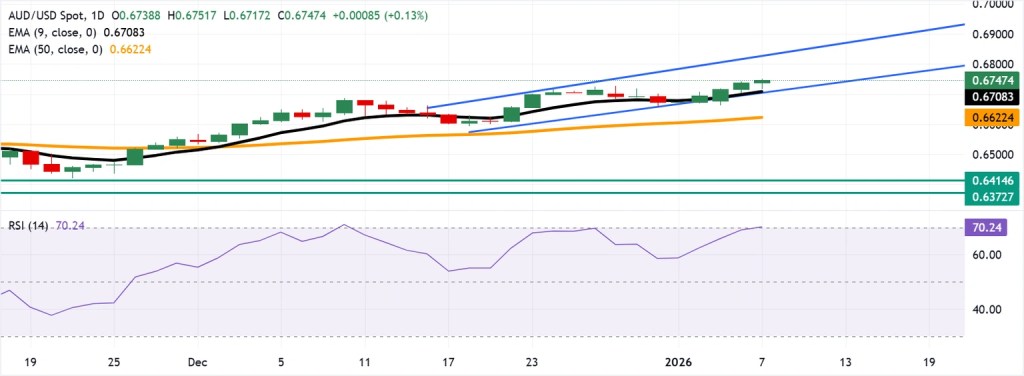
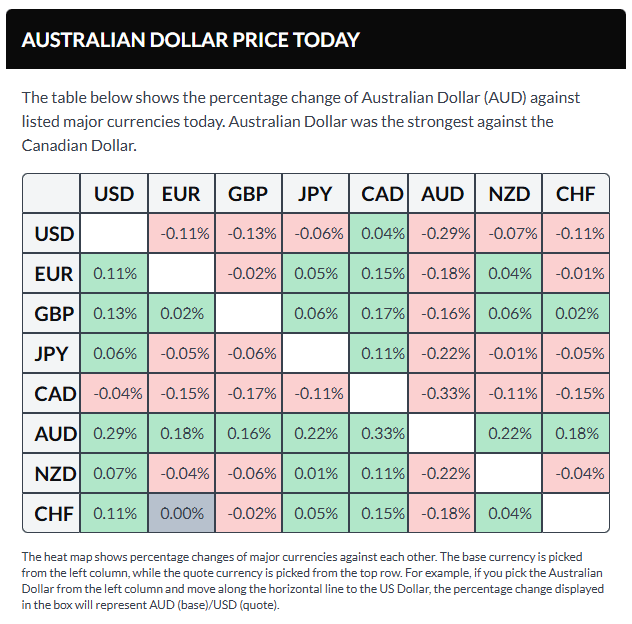
AUD/USD is trading lower below the key 0.7000 psychological level during Thursday’s Asian session, pressured by mixed Australian trade data. The pair is also weighed down by a firm U.S. dollar, which is hovering near a two-week high. With limited domestic catalysts, traders are now turning their attention to the upcoming U.S. JOLTS job openings data for fresh direction.
AUD/USD Technical Outlook
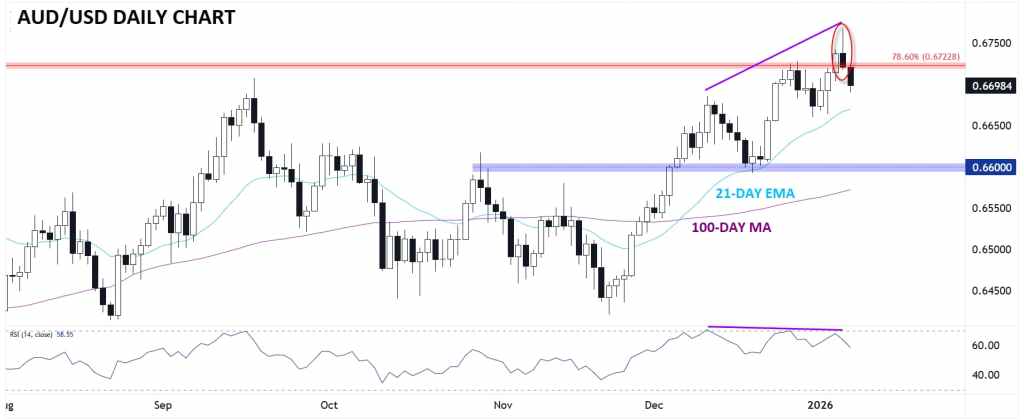
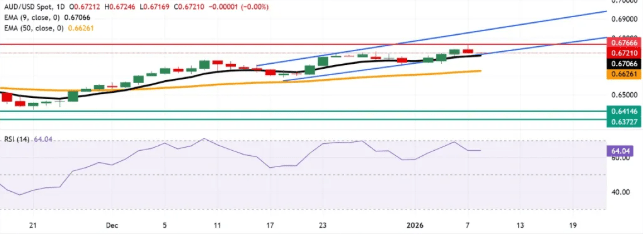
Should bullish momentum intensify, AUD/USD is likely to encounter its next resistance at the 2026 peak of 0.7093 (Jan 29), followed by the 2023 high at 0.7157 (Feb 2).
On the downside, a break below the February low at 0.6908 (Feb 2) may trigger a deeper pullback toward the interim 55-day SMA at 0.6693, ahead of the 2026 trough at 0.6663 (Jan 9). Additional downside support is seen at the 100-day SMA at 0.6628, with stronger support at the 200-day SMA at 0.6563 and the November low at 0.6421 (Nov 21).
Momentum indicators remain constructive and point to further upside potential, although the pair’s overbought readings suggest the risk of a near-term correction. The RSI hovers near 72, while the ADX around 50 continues to signal a strong underlying trend.
Bottom line
AUD/USD continues to be heavily influenced by global risk appetite and developments in China’s economy. A sustained move above the 0.7000 handle would reinforce a more credible bullish outlook.
For the time being, a weaker U.S. dollar, stable—though not particularly strong—domestic data, a still-hawkish tilt from the RBA, and modest backing from China leave the balance of risks skewed toward further upside rather than a pronounced pullback.
Fundamental Analysis
AUD/USD remains entrenched in its broader uptrend despite renewed selling pressure emerging on Wednesday. Any near-term pullbacks are expected to attract buying interest, as the Reserve Bank of Australia continues to project a clearly hawkish stance following its latest rate decision.
The Australian Dollar is struggling to extend Tuesday’s advance, easing back and once again testing the psychologically significant 0.7000 mark.
The retreat comes as the U.S. Dollar regains some traction, with markets having largely absorbed the RBA’s hawkish hike and refocusing attention on U.S. economic and monetary policy developments.
Australia: Growth Is Cooling, Not Collapsing
Recent Australian data have been underwhelming rather than alarming, reinforcing a well-established narrative. Economic activity is slowing, but in a controlled manner, with momentum easing rather than breaking down—supporting the soft-landing view.
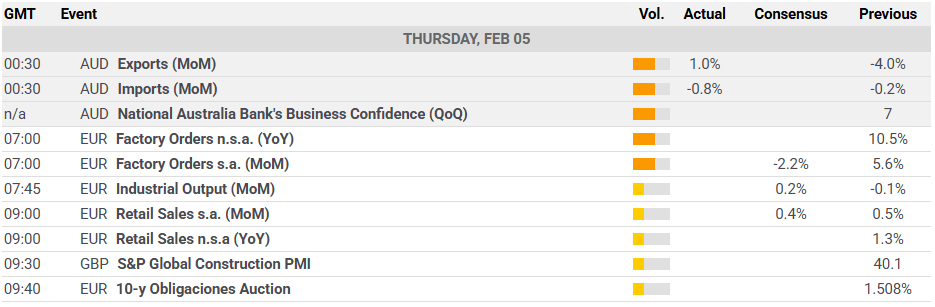
January PMI surveys align with this assessment, as both Manufacturing and Services strengthened and remained firmly in expansion territory, at 52.3 and 56.3 respectively. Retail sales continue to show resilience, and although the trade surplus narrowed to A$2.936 billion in November, it remains solidly positive.
Growth is moderating only gradually, following a 0.4% quarter-on-quarter rise in GDP in Q3. On an annual basis, output expanded by 2.1%, matching the RBA’s projections.
The labour market remains a standout performer. Employment jumped by 65.2K in December, while the unemployment rate unexpectedly edged down to 4.1% from 4.3%.
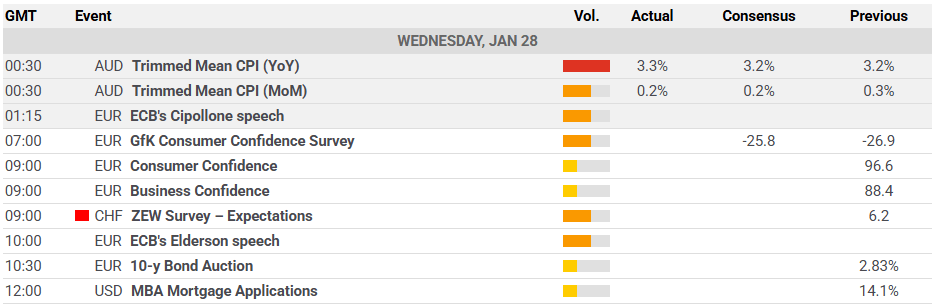
Inflation, however, continues to be the key challenge. December CPI surprised to the upside, with headline inflation accelerating to 3.8% year-on-year from 3.4%. The trimmed mean rose to 3.3%, in line with market expectations but slightly above the RBA’s 3.2% forecast. On a quarterly basis, trimmed mean inflation increased to 3.4% in the year to Q4, marking the highest level since Q3 2024.
China: A Backdrop of Support, Not a Catalyst
China continues to offer a generally supportive backdrop for the Australian dollar, though without the momentum needed to drive a sustained upswing.
Economic growth ran at an annualised 4.5% in the October–December quarter, with quarter-on-quarter expansion at 1.2%. Retail sales rose 0.9% year-on-year in December—respectable, but not particularly compelling.
More recent indicators point to a renewed loss of momentum. Both the NBS Manufacturing PMI and the Non-Manufacturing PMI slipped back into contraction territory in January, at 49.3 and 49.4 respectively.
By contrast, the Caixin surveys painted a slightly brighter picture, with the Manufacturing PMI edging up to 50.3 to remain in expansion, while the Services PMI increased to 52.3.
Trade stood out as a relative bright spot, as the surplus widened sharply to $114.1 billion in December, supported by nearly 7% growth in exports and a solid 5.7% rise in imports.
Inflation signals remain mixed. Consumer prices were unchanged at 0.8% year-on-year in December, while producer prices stayed firmly negative at -1.9%, underscoring that deflationary pressures have yet to fully fade.
For now, the People’s Bank of China is maintaining a cautious stance. Loan Prime Rates were left unchanged in January at 3.00% for the one-year and 3.50% for the five-year, reinforcing expectations that policy support will remain gradual rather than aggressive.
RBA: Leaning Hawkish, In No Hurry to Ease
The RBA raised the cash rate to 3.85% in a decisively hawkish move that largely met expectations. Upward revisions to both growth and inflation forecasts signal firmer economic momentum and increasingly broad-based price pressures. Core inflation is now projected to remain above the 2–3% target band for much of the forecast horizon, reinforcing the case for a restrictive policy stance.
The central message is that inflation is becoming more demand-driven. The RBA cited stronger-than-expected private demand as a key justification for tighter policy, even as productivity growth remains subdued. While Governor Bullock described the move as an “adjustment” rather than the beginning of a renewed hiking cycle, the signal was clear: policymakers are uneasy with the upward drift in inflation.
For markets, this implies interest rates are likely to stay higher for longer, limiting the scope for near-term easing. From an FX perspective, this provides marginal support for the Australian dollar—particularly against low-yielding peers—even as the RBA’s emphasis on full employment tempers the likelihood of an aggressive tightening phase.
In the wake of the decision, markets are now pricing in nearly 40 basis points of additional tightening by year-end.
Positioning: Shifting Sentiment Toward the AUD
The latest positioning data suggest the worst of the bearish sentiment toward the Australian dollar may have passed. CFTC figures show that non-commercial traders have returned to a net long stance for the first time since early December 2024, although the position remains modest at just over 7.1K contracts in the week ending January 27.
Open interest has also climbed to its highest level in several weeks, exceeding 252K contracts, indicating that traders are beginning to re-engage with the market. That said, the move appears tentative rather than a strong conviction call on a sustained appreciation in the AUD, at least for now.
Key Drivers Ahead
Near term: Market attention is shifting back toward the United States. Incoming economic data, tariff-related developments, and ongoing geopolitical headlines are likely to drive movements in the U.S. dollar. For the Australian dollar, the key swing factors remain domestic labour market and inflation data, and how these shape expectations for the RBA’s next policy decision.
Risks: The AUD remains highly sensitive to global risk sentiment. A sharp deterioration in risk appetite, renewed concerns over China’s outlook, or an unexpected resurgence in the U.S. dollar could quickly unwind recent gains.
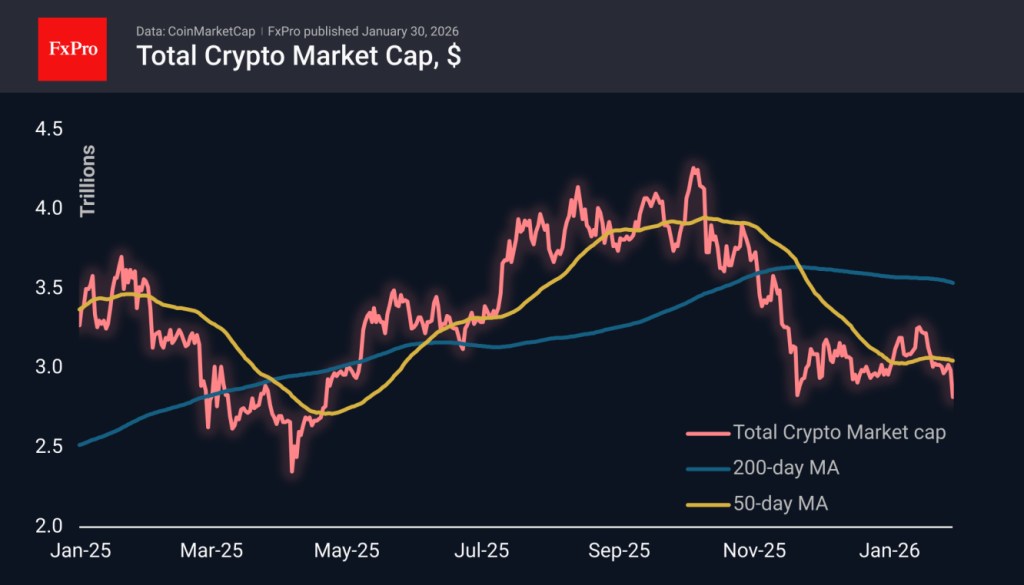
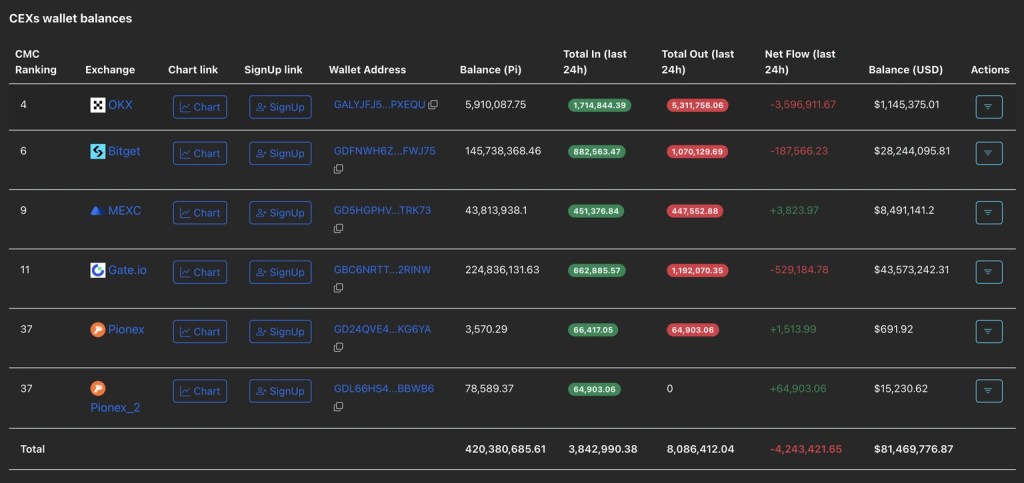
The total cryptocurrency market capitalisation dropped by about 5% to $2.82 trillion over the past 24 hours, briefly touching $2.78 trillion twice—its lowest level since April last year. As anticipated, weakness in commodity and equity markets added further pressure to crypto, triggering a sell-off on elevated volumes as traders tightened stop-loss orders after a prolonged period of consolidation. In our worst-case scenario, market cap could fall into the $1.8–2.0 trillion range, corresponding to a 161.8% extension of the initial downside move seen in October–November.
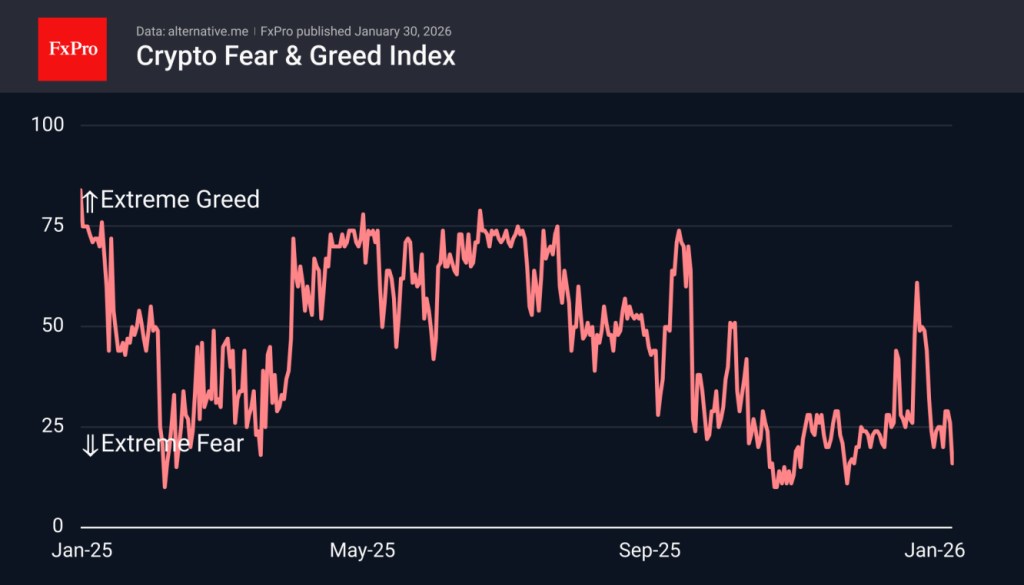
The Crypto Sentiment Index dropped to 16 by Friday, marking its lowest reading in six weeks and a return to extreme fear—a zone the market managed to escape for only two days this week. While such depressed sentiment is often viewed as a buying opportunity, we continue to stress that a more prudent strategy is to wait for a clear exit from extreme fear, helping to reduce the risk of sudden and sharp downside moves.
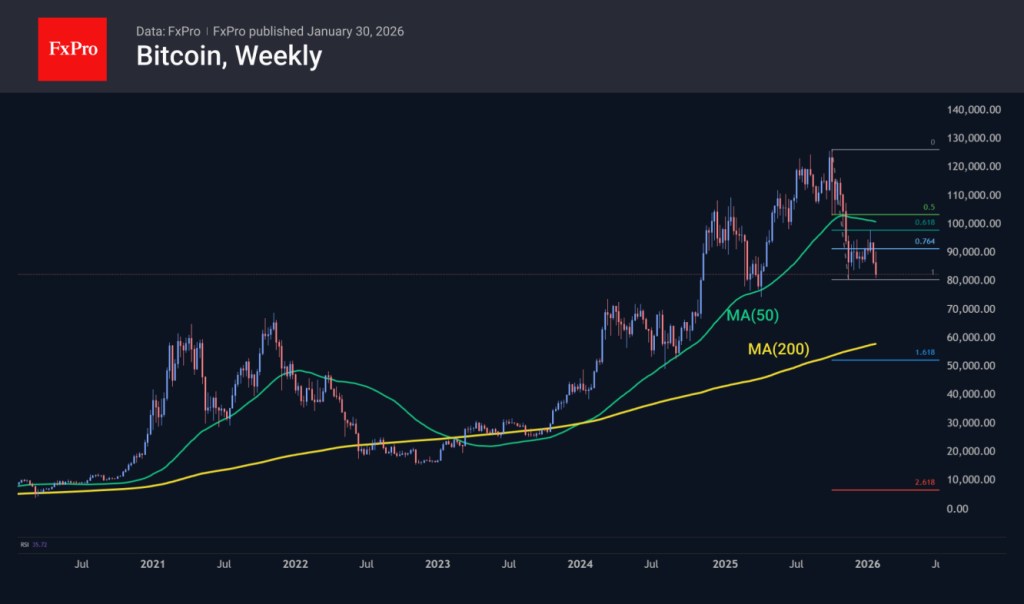
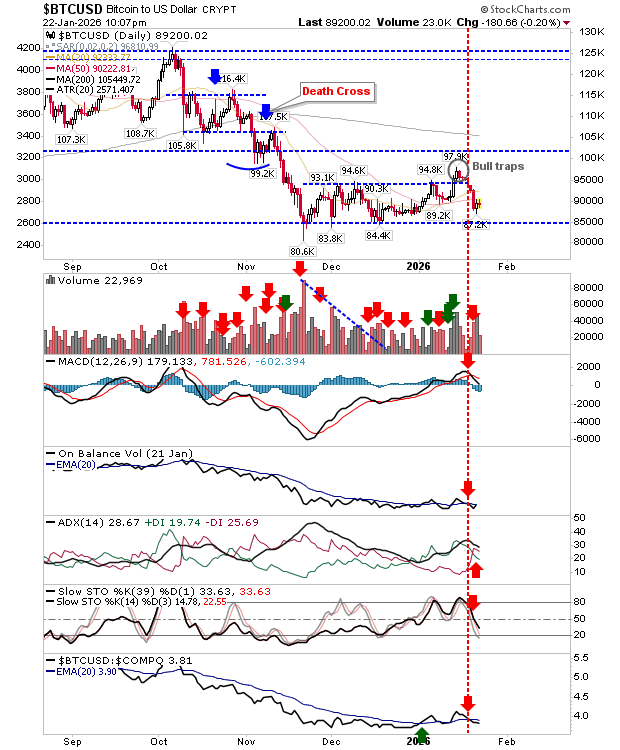
Bitcoin has fallen 6% over the past 24 hours, briefly dropping to $81K and revisiting the lows seen in late November. The market is now testing the resilience of a support level that previously absorbed heavy selling pressure last year. About $10K lower lies a zone where prior cycle highs from 2021–2022 and the first half of 2024 converge. If that area fails to hold, Bitcoin could slide toward the $52–60K range.
In the near term, however, attention should remain on BTC’s price action around $80K. This level may prove difficult to break decisively and is viewed by many market participants as an attractive buying zone.
More than 22% of Bitcoin’s circulating supply is now underwater. Glassnode identifies a key support level at $83,400; a break below this could open the door to a drop toward the “true average market price” near $80,700. A deeper decline risks pushing long-term holders into losses, potentially accelerating selling pressure.
According to Wintermute Ventures, speculative excess in crypto is likely to fade this year, with digital assets evolving into the core financial and settlement layer of the internet. In this scenario, stablecoins are expected to emerge as the primary medium of exchange in the digital economy.
Santiment reports that Ethereum balances held on exchanges have fallen for a sixth straight month, driven by strong interest in staking. Since July last year, exchange-held ETH has declined by roughly one-third to about 8.15 million tokens.
TRM Labs estimates that illegal cryptocurrency transaction volumes hit a record $158 billion in 2025, up 145% year on year. During the same period, hackers stole $2.87 billion across nearly 150 separate attacks.
Meanwhile, the USD1 stablecoin issued by World Liberty Financial, a company linked to US President Donald Trump, reached a market capitalisation of $5 billion in under a year, making it the world’s fifth-largest stablecoin.
Gold’s most recent move was sharp, chaotic, and relentless. With volatility running high and prices stretched, managing risk is just as critical as getting the direction right.
Gold shows capitulation-like price behavior
Volatility jumps to multi-year highs
Prices look stretched after a rapid upside surge
Position sizing and risk management become paramount
Gold shows meme-stock–like trading behavior
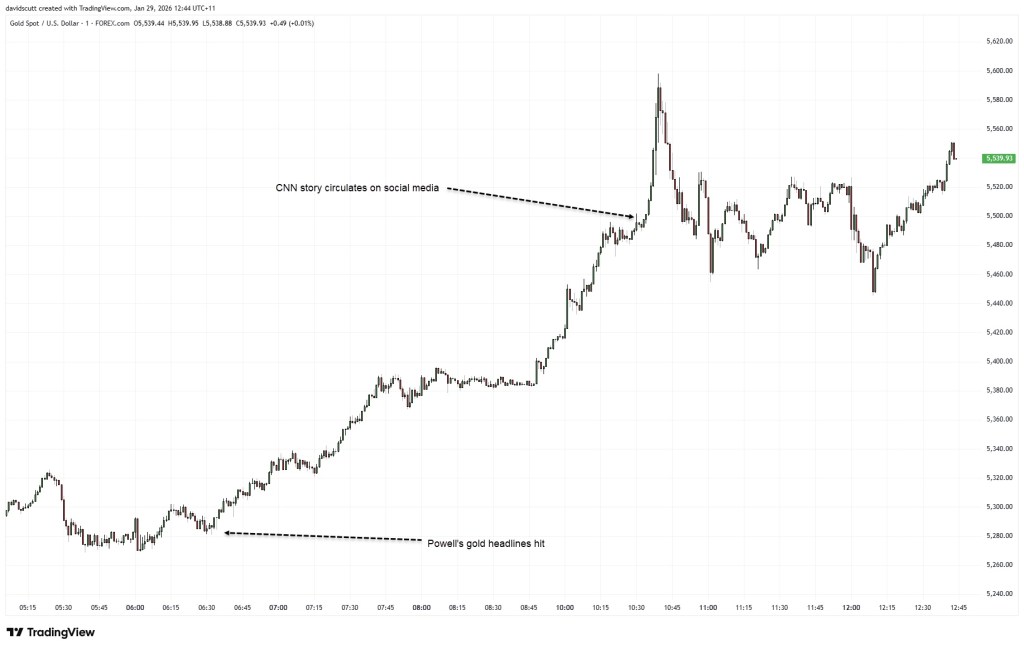
Gold behaved less like a classic safe haven and more like a meme stock on Thursday, surging nearly $100 within minutes during early Asian trading. Prices briefly spiked toward $5,600 before reversing just as quickly. The sheer speed and magnitude of the move felt like capitulation in real time, likely exacerbated by thin liquidity during the transition from North American to Asian market hours.
Although the price surge began around the same time, a CNN report later surfaced indicating that the U.S. was considering new military strikes against Iran. However, given that geopolitical tensions have been elevated for weeks rather than emerging suddenly, much of that risk was likely already priced in. In that sense, the headline appears more like a catalyst than the underlying cause of the move.
Some traders also cited comments from Fed Chair Jerome Powell after the January FOMC meeting, in which he downplayed any macroeconomic signal from gold’s record highs. Still, those remarks seem to have played only a minor role, coming several hours before the most volatile phase of the price action unfolded.
Volatility jumps sharply higher
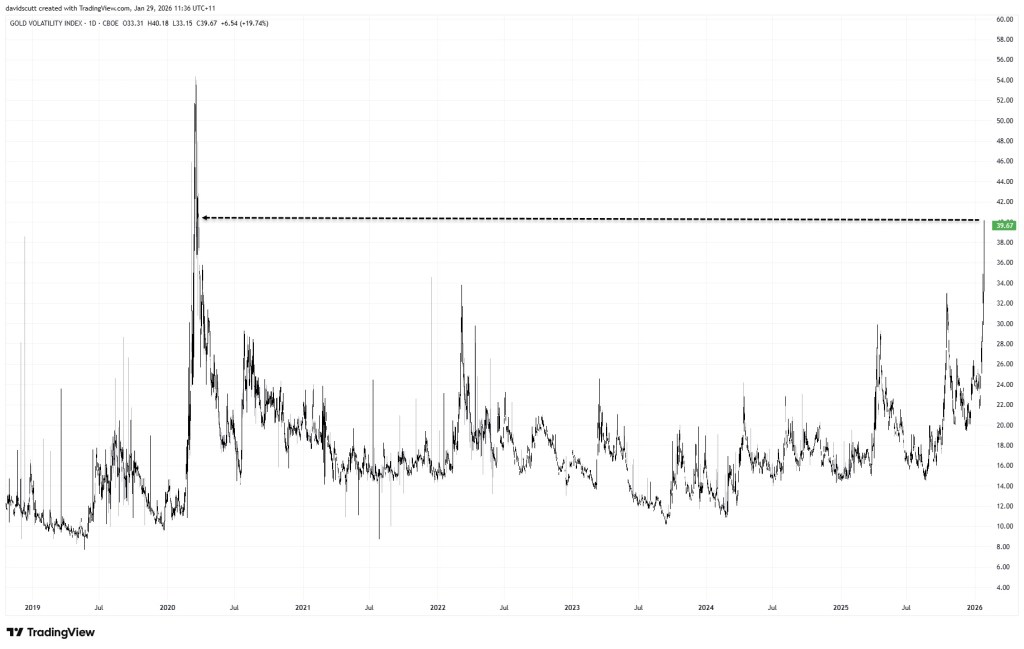
While today’s spike has understandably drawn attention, it is not an isolated event, instead forming part of a broader and accelerating expansion in volatility across the gold market.
As illustrated above, the Gold Volatility Index (GVZ) has climbed to its highest level since the early days of the COVID-19 lockdowns in 2020, highlighting just how extreme price action in the traditional safe haven has become. GVZ measures implied volatility in gold options, offering insight into the magnitude of price swings the options market is anticipating. The surge suggests the market has entered a markedly different volatility regime, one in which unusually large moves are occurring with increasing frequency.
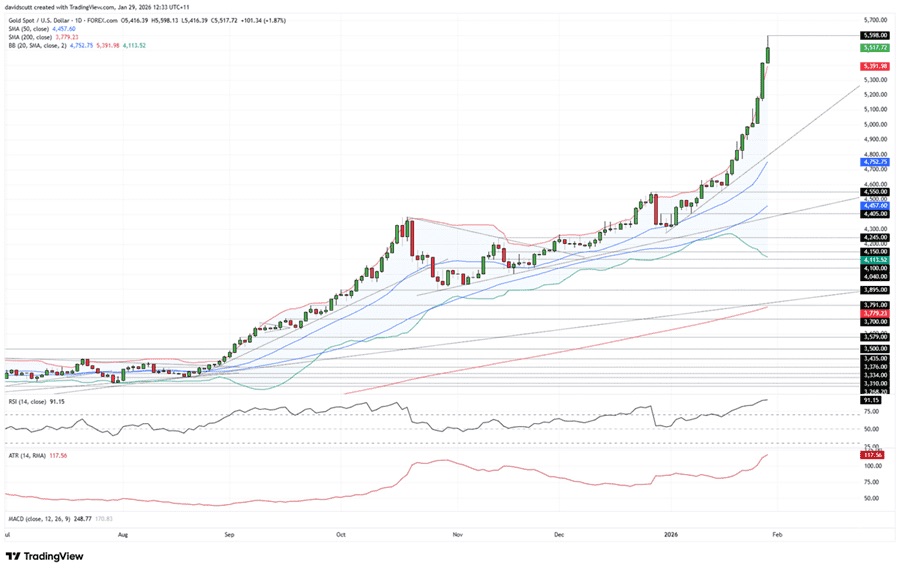
The broader volatility environment is also clearly visible on the daily chart. Gold is trading well above its upper Bollinger Band, highlighting the speed and magnitude of the recent acceleration relative to prior conditions. Daily trading ranges have expanded sharply, with the 14-day ATR elevated at 117.56—making $100-plus moves routine rather than exceptional. Meanwhile, the 14-day RSI sits deep in overbought territory at 91.15, reinforcing that while the broader uptrend remains intact, price action is increasingly stretched and unstable.
Risk management takes center stage
In short, this is an exceptionally high-volatility environment where price behavior is far from normal. Gold has surged rapidly, leaving prices highly extended and vulnerable to sharp moves in both directions, even as the broader uptrend remains in place. In such conditions, traditional technical signals often lose reliability, making risk management and position sizing especially critical—particularly with mean-reversion risks running high.
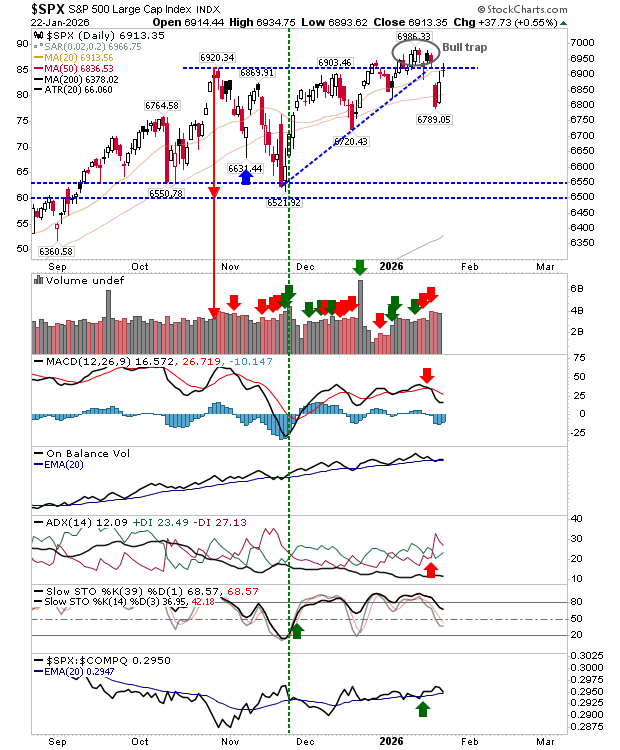
The S&P 500 ended the session largely unchanged ahead of a largely uneventful Federal Reserve meeting, which offered little new information beyond reaffirming that the U.S. economy remains in fairly solid condition. The tone of Chair Jay Powell’s press conference also suggested that, at least while he remains at the helm, there are likely to be few—if any—interest-rate cuts in the near term.
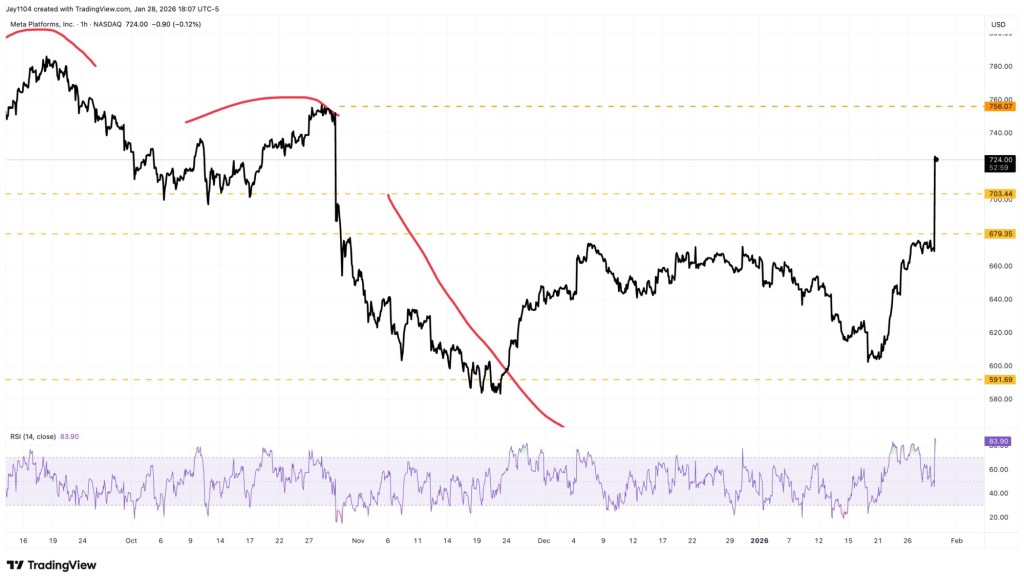
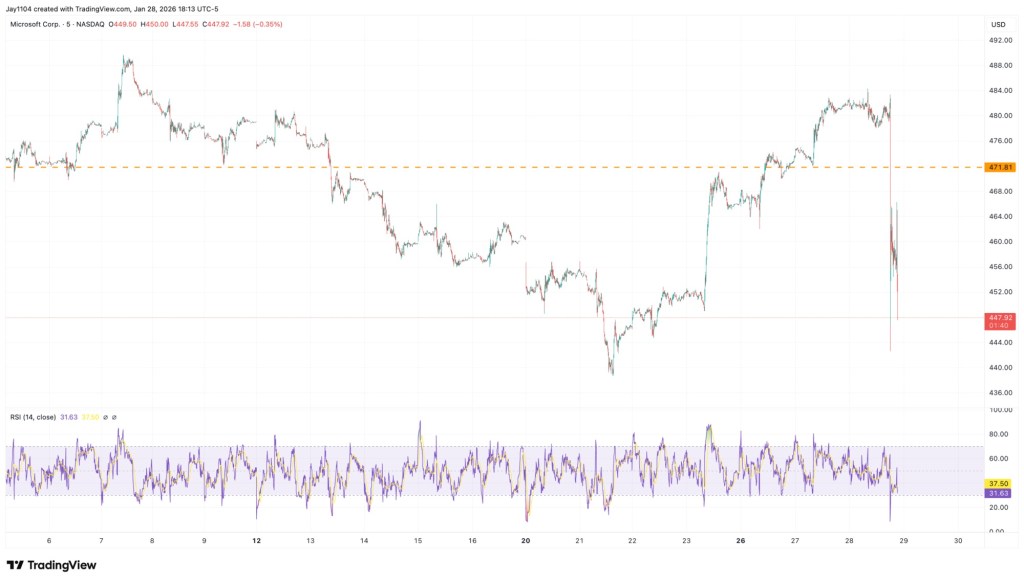
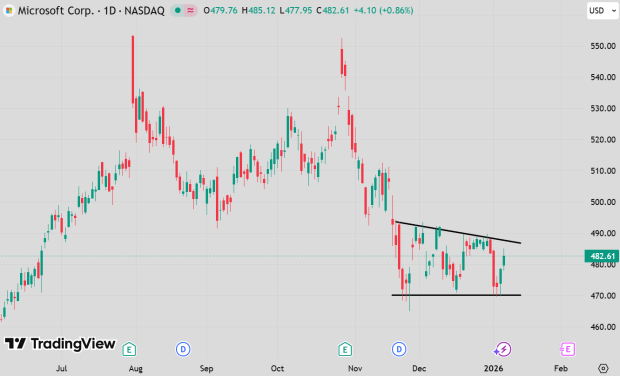
Earnings released after the close were mixed. Microsoft (NASDAQ: MSFT) fell roughly 6.5%, while Meta Platforms (NASDAQ: META) surged about 7.5%. From an options standpoint, both stocks had bearish setups heading into earnings, with elevated implied volatility and heavy call-delta positioning at higher strike levels. Following the results, implied volatility declined, causing higher-strike calls to lose value and prompting the unwinding of hedges.
For Meta, the key technical level was $700, which the stock managed to break through, at least initially. Revenue guidance significantly exceeded expectations, leading the market to overlook higher-than-expected capital expenditures for now. The key question will be whether Meta can hold above the $700 level once regular trading resumes.
For Microsoft, the key level was $500, which the stock failed to break despite reporting better-than-expected results. Investor sentiment was weighed down by weaker-than-expected growth in its Azure cloud business.
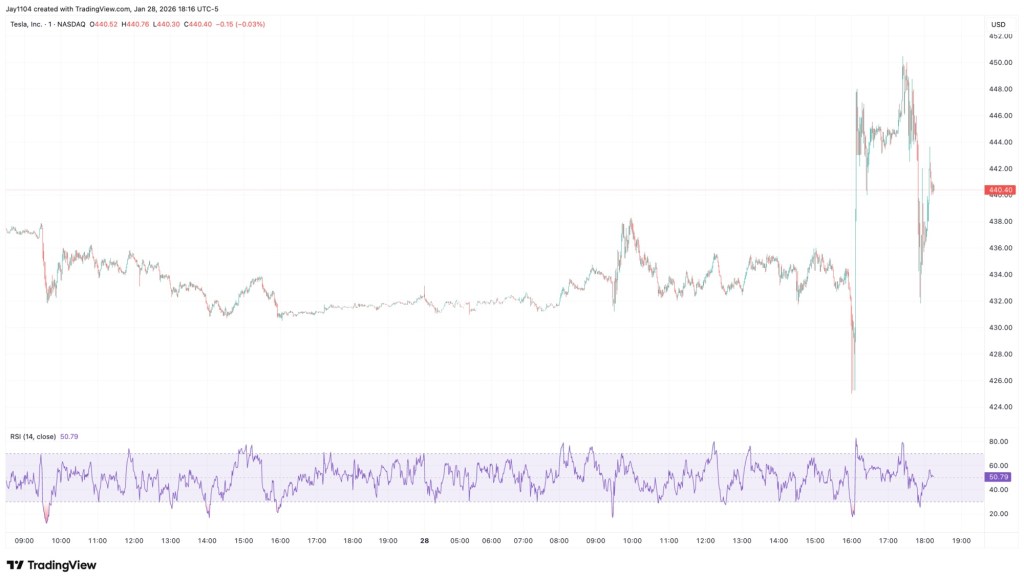
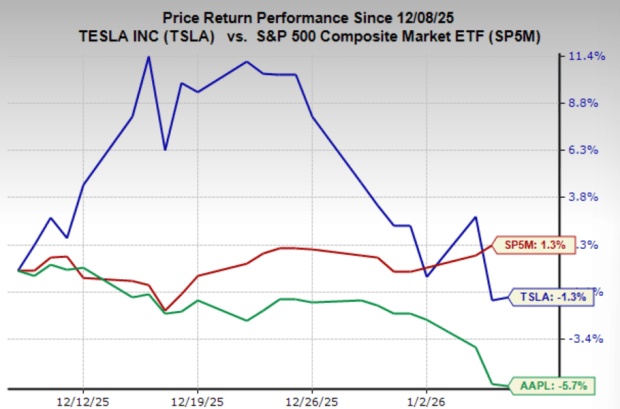
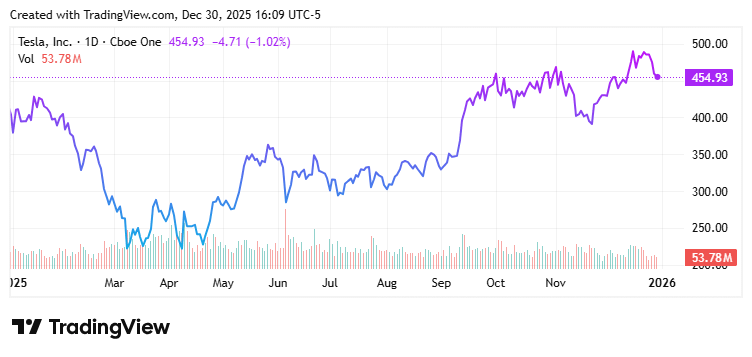
For Tesla (NASDAQ: TSLA), the setup ahead of earnings was more mixed, but $450 clearly stood out as the key level to break. So far, the stock has tested that threshold but has been unable to hold above it.
After-hours moves can be unpredictable, which is why it often makes sense to wait and see how price action develops during regular trading hours. How the CDS market trades tomorrow may be even more telling, potentially offering a clearer read on the true implications of the earnings reports.
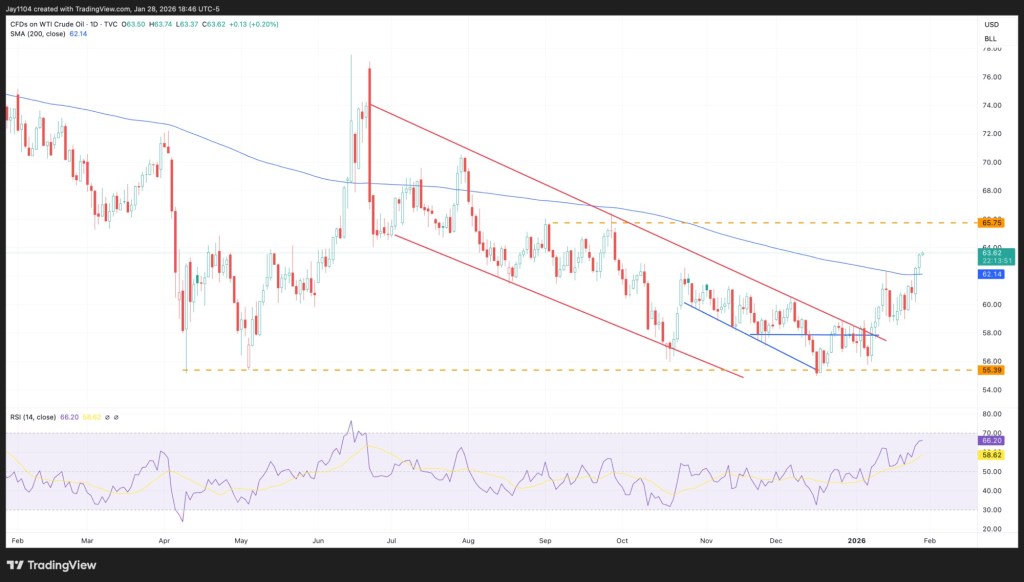
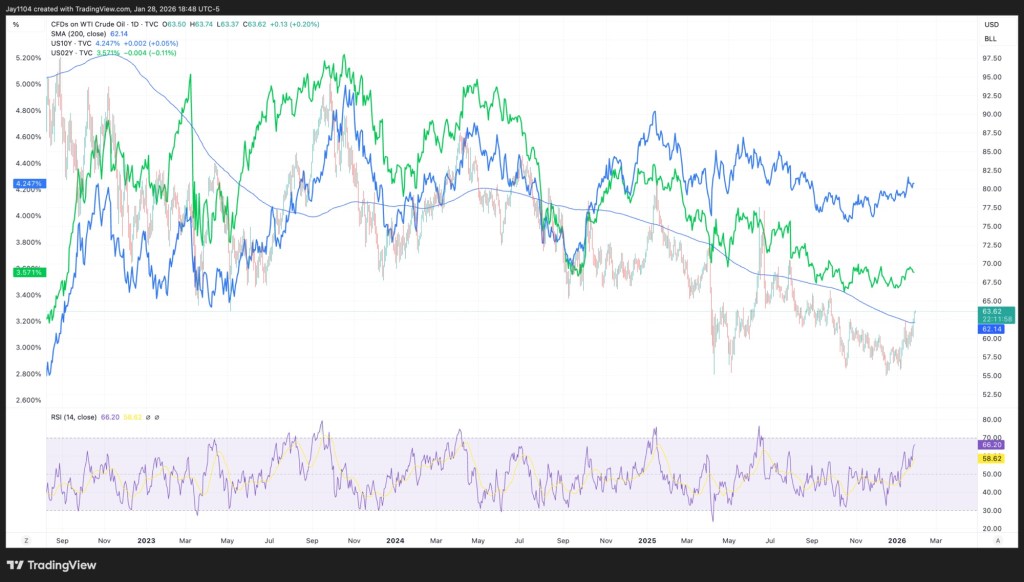
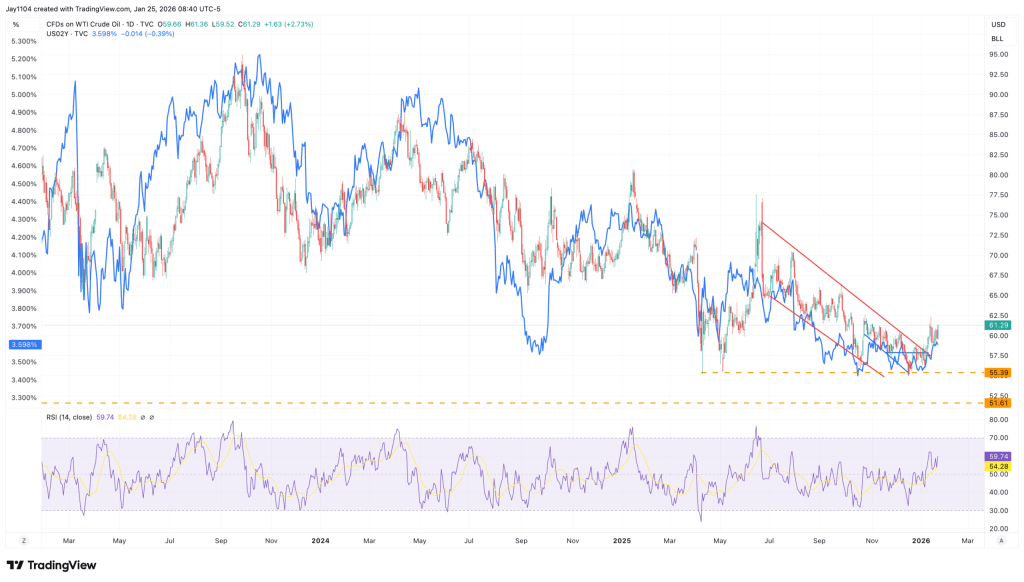
For now, near-term rate expectations appear more closely tied to oil than to any other factor. Crude has broken out and moved above its 200-day moving average, a technical development that could set the stage for a rally toward $65 in the near term.
Whether looking at the 2-year or 10-year Treasury yield, the correlation with oil prices since late 2022 has been remarkably strong. As a result, if oil continues to move higher, it would likely put upward pressure on interest rates as well. In that sense, oil may have been the final missing link in the case for higher rates.
Federal Reserve Chair Jerome Powell offered few substantive remarks during his press conference on Wednesday, sidestepping multiple questions about the upcoming leadership transition as his term ends on May 15. He declined to comment on President Donald Trump’s potential nominee to succeed him, as well as on the president’s public criticism of his tenure.
Powell also avoided addressing questions related to the Department of Justice investigation involving him and the ongoing Supreme Court case concerning the possible removal of Fed Governor Lisa Cook. In response to these issues, he repeatedly indicated that he had nothing further to add.
“I have nothing on that for you.”
He repeated that response seven times in total. On four occasions, he simply said,
“I don’t have anything on that for you.”
After the FOMC voted to keep the federal funds rate in a range of 3.50%–3.75%, Powell provided no additional forward guidance beyond reiterating the Fed’s data-dependent, meeting-by-meeting approach. He did, however, acknowledge the underlying strength of the U.S. economy.
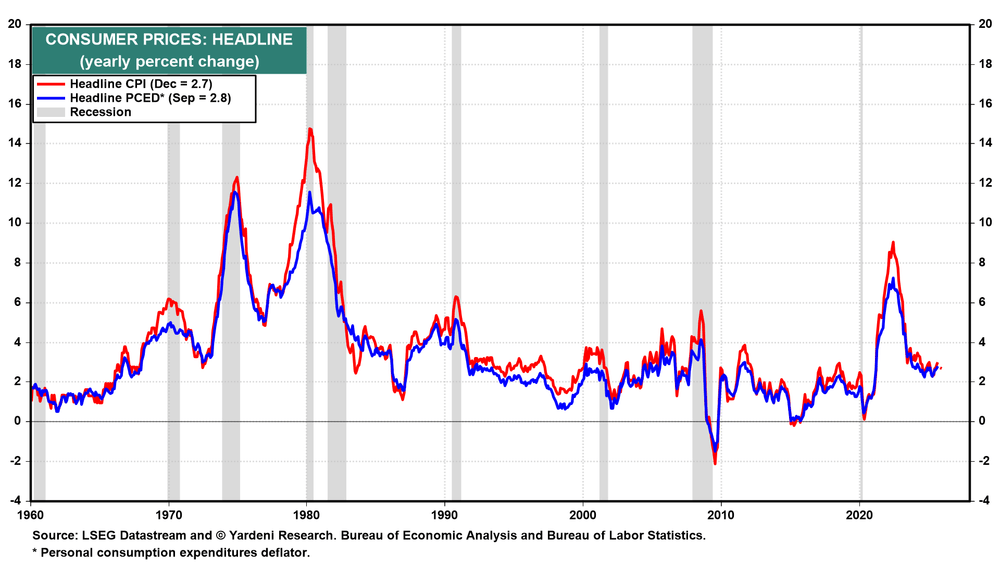
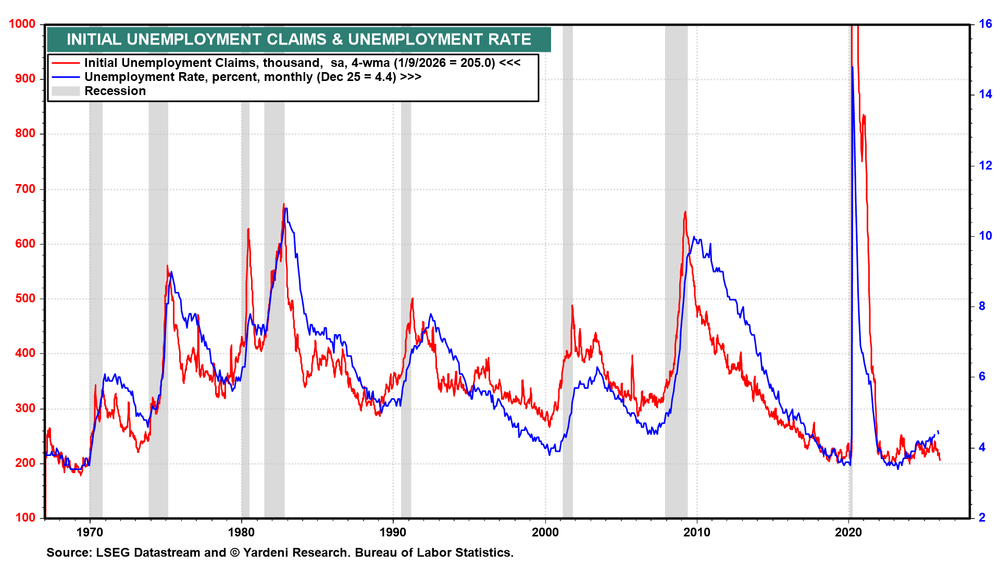
Powell noted that the unemployment rate has remained low at around 4.4% in recent months, even as job growth has slowed. He also said inflation is expected to ease as the effects of President Trump’s tariffs fade.
Overall, Powell characterized the risks of higher inflation and rising unemployment as balanced, signaling little urgency for policy action. This assessment increases the likelihood that the federal funds rate will remain unchanged at his final two meetings as FOMC chair.
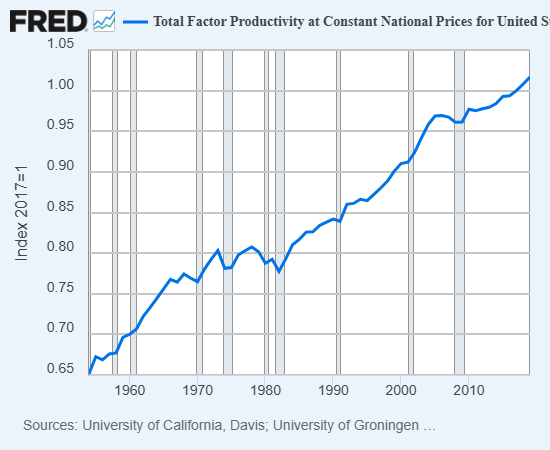
Officials in the Trump administration broadly share our “Roaring 2020s” outlook, which assumes stronger-than-expected productivity growth will lift real GDP while easing inflation pressures as unit labor cost growth falls toward zero. They argue that this expectation supports additional cuts to the federal funds rate—a view echoed by two dissenting members of the FOMC, who expressed similar reasoning at the latest meeting.
We take a different view. Cutting the federal funds rate further from current levels would heighten the risk of financial instability, particularly by fueling a melt-up in equity markets. A similar dynamic is already evident in precious metals. Additional rate cuts would also put further downward pressure on the dollar, potentially reigniting inflationary pressures.
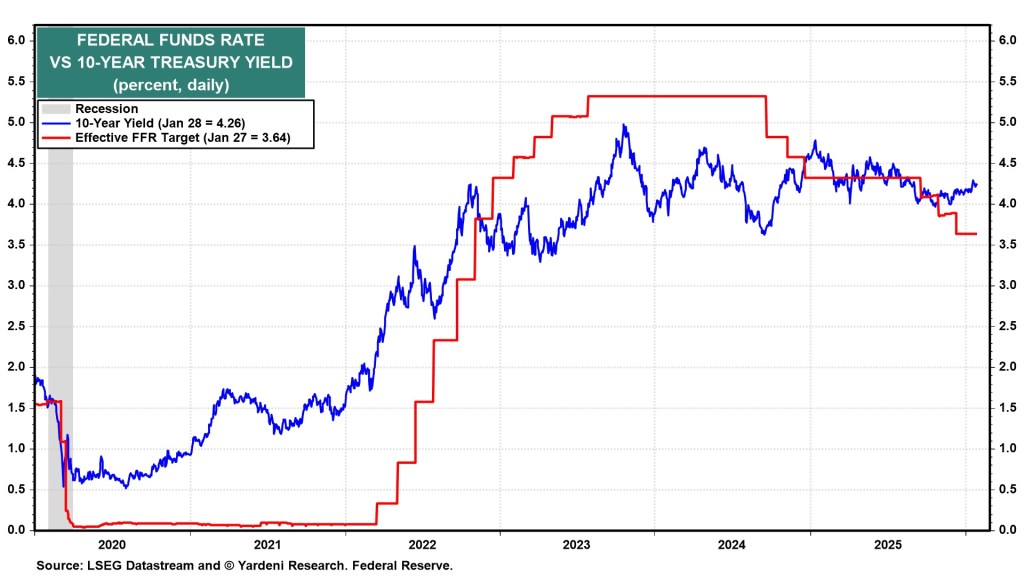
Bond markets appear to share this skepticism. When the Fed reduced the federal funds rate by 100 basis points in late 2024, the 10-year Treasury yield rose by a similar amount. Even after another 75-basis-point cut late last year, the yield held around 4.00% and has since climbed to 4.26%. We continue to expect the 10-year yield to trade largely between 4.25% and 4.75% this year—levels that were typical in the period before the Global Financial Crisis.
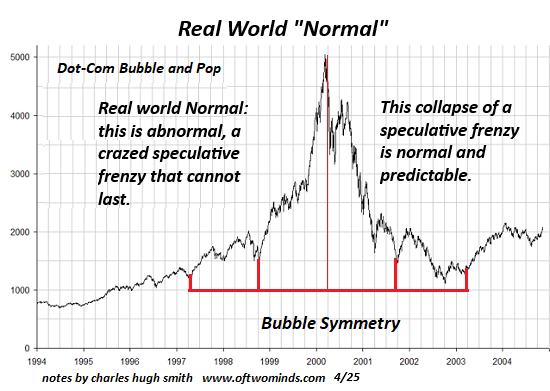
Narrative control functions by offering ready-made answers to every doubt or challenge. At its core, the prevailing narrative claims that the Federal Reserve and the central government possess sufficient tools to quickly counter any decline in GDP—otherwise known as a recession—and steer the economy back toward growth.
Implicit in this view is the assumption that recessions are inherently harmful, while uninterrupted expansion is inherently desirable. Few question the fact that this framework departs from true free-market capitalism. Instead, central banking and government intervention are justified as mechanisms to smooth out capitalism’s rough edges through a form of state capitalism—one that can create or borrow as much money as needed to neutralize economic disruptions, including recessions.
What this narrative leaves out is the role recessions play as a natural and necessary part of market dynamics. Instead, it reduces economic cycles to a simplistic binary: contraction is bad, expansion is good. Yet markets are ultimately driven by human behavior—particularly fear and greed—which express themselves through borrowing and speculation. During periods of confidence, when growth appears limitless, participants take on increasing levels of debt and channel capital into progressively riskier investments in pursuit of higher returns.
As borrowed funds flow into speculative assets, prices rise, boosting the value of collateral and enabling even more borrowing to finance further speculation. Debt, asset prices, collateral and risk-taking thus reinforce one another, creating the illusion of an endlessly self-sustaining expansion in which everyone appears to grow wealthier.
However, this layering of debt and paper wealth carries within it two forces that eventually unwind the process: interest and risk. Every loan carries an obligation to pay interest, which compensates lenders for the risks they assume. As overall debt grows—and as investments become more speculative—debt servicing costs increase accordingly, especially for higher-risk borrowers.
While central banks can attempt to suppress interest rates even as risk rises, their influence is inherently limited. They control only a portion of total outstanding debt and therefore cannot dominate the market entirely.
Their role in prolonging debt expansion and speculation relies less on absorbing most new debt and more on signaling. By projecting the message that the Federal Reserve will step in to backstop losses, recapitalize lenders, and cap interest rates below market-clearing levels, policymakers encourage continued borrowing and risk-taking. This reinforces the belief that debt and speculation can keep expanding indefinitely.
Yet signaling alone cannot solve the underlying problem. It does not increase the income required to service growing debt burdens, nor does it ensure speculative investments will deliver returns. These limitations expose the fundamental weakness of the central banking “perpetual motion” model. For most borrowers—both private and public—income does not automatically rise alongside debt. Instead, income depends on market conditions, technological change, government policy, and the broader cycle of credit expansion or contraction.
At the level of the overall economy, what ultimately matters is total factor productivity and how its gains are distributed among workers, businesses, asset owners, and the state, which extracts revenue from each through taxation. This distribution is not fixed; it shifts with changing social, political, and financial forces.
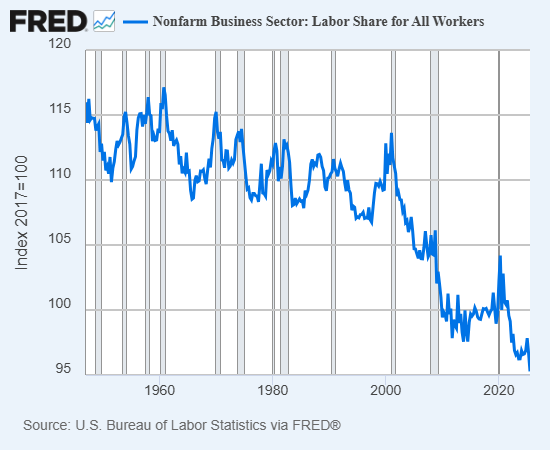
Over the past five decades, the benefits of productivity growth have increasingly accrued to capital—corporations and asset owners—rather than to workers. As a consequence, households and small businesses are left servicing debt with a diminishing share of overall economic income. This imbalance makes additional borrowing progressively more hazardous for both borrowers and lenders alike.
As a growing share of economic output accrues to corporations and asset owners, their collateral values, income streams, and perceived creditworthiness strengthen. This allows them to borrow larger sums at lower interest rates than wage earners and small businesses. Greater access to cheap credit enables further asset accumulation, which in turn generates additional income—creating a self-reinforcing cycle.
This dynamic sits at the heart of widening wealth and income inequality. Those at the top grow richer not simply because they earn more, but because they can finance income-producing assets at costs far below those faced by workers. Unlike wages, income derived from assets tends to rise alongside asset values, which can be leveraged as collateral to support even more borrowing.
At a deeper structural level, the system becomes unstable once economic growth fails to raise household incomes enough to support higher debt servicing. The entire framework of expanding credit, collateral, and speculation then comes under strain. Asset-driven income ultimately depends on one or more of three forces: continued credit expansion, increased risk-taking in financial markets, or sustained consumer spending. These forces are tightly linked, as any slowdown in borrowing, investing, or spending eventually undermines the ability to service debt and brings the credit cycle to a halt.
Because debt inherently carries default risk, an economic model reliant on ever-expanding borrowing also amplifies systemic vulnerability—particularly when household incomes stagnate while debt levels and interest obligations continue to rise.
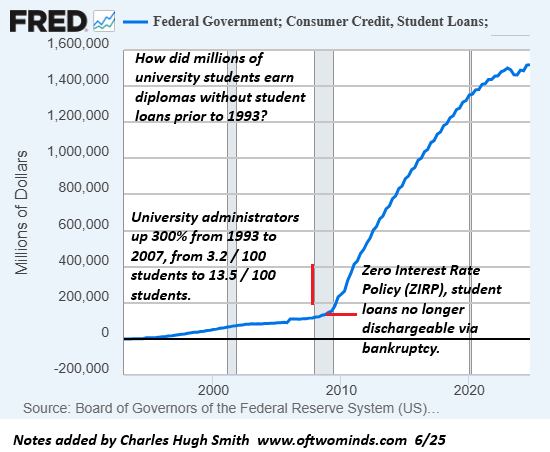
With the share of output flowing to wages declining for decades, households have increasingly relied on borrowing to sustain consumption. Before the 2000s, student debt was relatively limited; today it totals trillions of dollars. Auto loans and credit card balances have also surged, alongside less visible forms of leverage such as installment-based financing and other shadow-banking channels that are often underreported.
Speculative investments carry intrinsic risk, as there is no guarantee they will generate returns. When such speculation is financed through borrowing, failure does not only harm the investor—it also inflicts losses on the lender, as both sides are exposed when the bet collapses.
Taken together, stagnant income growth, rising reliance on debt to sustain consumption, and increasingly risky, debt-backed speculation have produced an economy dependent on credit-driven asset bubbles. Growth now hinges on the continual expansion of debt to support spending and fuel speculative activity that inflates asset prices, thereby boosting collateral values and enabling even more borrowing.
When income growth can no longer keep pace with rising debt obligations, defaults begin to ripple through the system. Households fall behind on rent, auto loans, student debt, credit cards, and mortgages, triggering a collapse in consumer spending. The resulting strain spreads to lenders and employers, who respond by tightening credit, cutting back borrowing, and laying off workers—further eroding income across the economy.
Speculative investments that appeared viable during the expansion unravel as credit conditions tighten. Lenders withdraw from riskier loans, household demand dries up, and asset prices fall as investors rush to sell risk assets in order to raise cash and reduce leverage. Collateral values deteriorate rapidly, amplifying losses.
Economies dependent on credit-fueled asset bubbles function as tightly interconnected systems. Any decline in income or asset prices, any increase in interest rates, any reduction in available credit, or any erosion of collateral feeds back into the broader structure. These shocks reinforce one another, creating a downward spiral marked by defaults, layoffs, and falling valuations.
In an economy already saturated with debt, policy stimulus no longer produces real growth; instead, it fuels inflation, which constrains central banks’ ability to respond. Once markets lose confidence in the belief that policymakers will always step in to backstop losses, both speculation and the borrowing that sustained it begin to dry up. As the flow of new, credit-funded investment slows, asset prices enter a self-reinforcing decline.
In a credit-asset-bubble-dependent system, this inevitable unwinding is often perceived not as a structural outcome, but as a sudden and unforeseen crisis.
In an economic system that permits recessions to purge unsustainable debt and excess speculation, the bursting of credit-driven asset bubbles is seen as a natural and unavoidable process rather than an aberration.
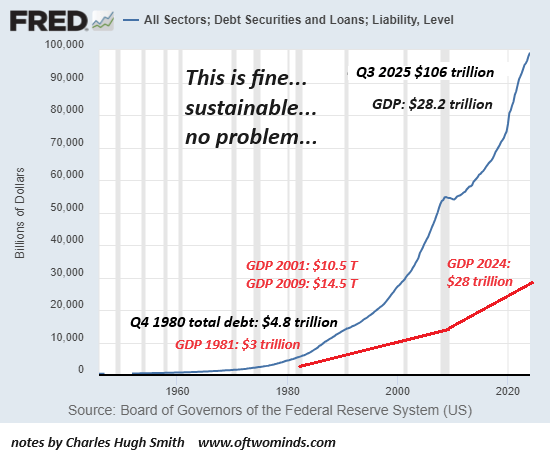
Few recognize two critical realities: first, the last true recession that meaningfully purged excess debt, leverage, and speculation occurred in 1980–82—more than four decades ago; second, the shock absorbers that enabled recovery back then no longer exist. In 1980, total debt stood at roughly 150% of GDP. Today, it is closer to three times GDP. This makes debt-driven expansion unworkable: borrowers are already struggling to service existing obligations, let alone take on more.
Nor can the Federal Reserve rescue the system simply by cutting rates to zero. The Fed holds only a small fraction of the roughly $106 trillion in outstanding debt; its primary influence is psychological, signaling that risk is low. In reality, risk continues to rise as debt burdens, interest costs, leverage, and speculation compound.
A repeat of the 2008-style bailout is equally implausible. Then, the system was stabilized by recapitalizing the financial sector—the engine of new credit creation. Today, however, the economy is saturated with debt, incomes have stagnated, and borrowers lack the capacity to sustain additional leverage. Meanwhile, housing and financial asset bubbles have expanded to historically fragile extremes.
This is why a recession that finally cleanses excess debt and speculation would leave behind an economy unable to rebound. The current system depends entirely on debt, leverage, and speculative excess not just for growth, but for basic stability. Once that structure collapses—as all bubbles eventually do—the confidence, signaling, and perceived wealth that sustained it will vanish as well.
Proposals to “save” the system by shifting fiat money into gold or cryptocurrencies offer no escape. The debt itself—and the income required to service it—would also be carried over, leaving the underlying dynamics unchanged. The collapse of credit-driven asset bubbles, and the economic activity built upon them, would still unfold.
For this reason, the next recession is likely to trigger a full-scale breakdown of a credit-asset-bubble-dependent economy. While policymakers may attempt to reflate another bubble as a solution, such an approach will no longer be sustainable. A durable recovery would instead require restructuring the economy around real productivity gains that are broadly shared, rather than concentrated among asset holders.
This transition will be slow and painful. Those who benefited most from the bubble economy will resist losing both extraordinary returns and their disproportionate share of gains. Yet neither can be preserved. The adjustment will demand time, sacrifice, and large, long-term investment in genuinely productive assets.
Ultimately, the systemic risks embedded in a credit-asset-bubble economy cannot be eliminated—only disguised or shifted elsewhere. These temporary fixes allow the bubble to grow larger, but the cost is borne by society at large when the system’s internal dynamics inevitably bring it crashing down.
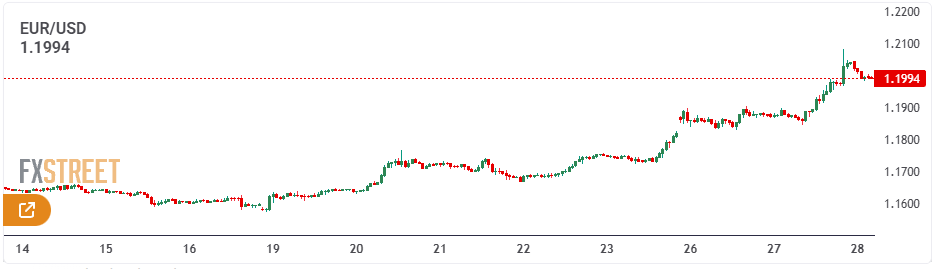
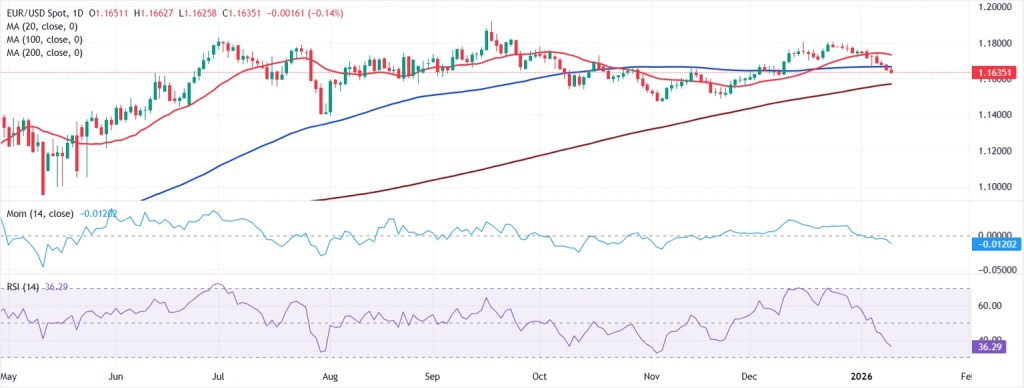
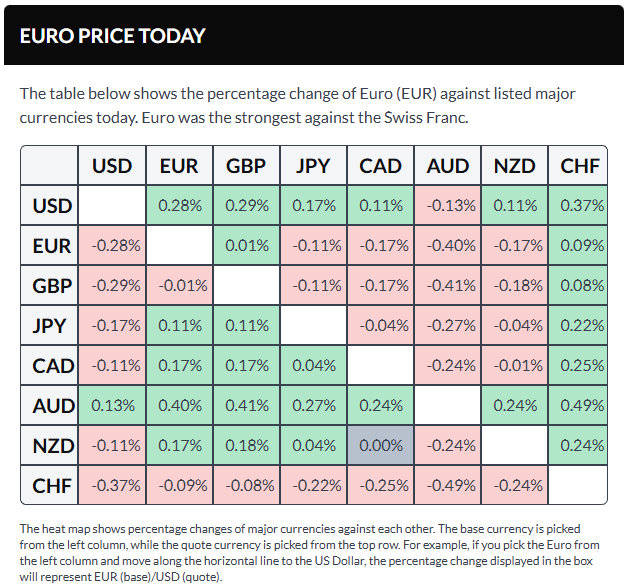
EUR/USD extended Monday’s positive momentum, pushing closer to the key 1.2000 level and reaching highs not seen since June 2021. The latest advance reflects continued selling pressure on the U.S. dollar, supported by a constructive risk backdrop and renewed investor focus on potential tariff-related risks stemming from the White House.
Macro & Fundamental Overview
EUR/USD’s bullish momentum remains firmly intact, closely mirroring persistent selling pressure on the U.S. dollar, which continues to be weighed down by concerns over trade policy, questions surrounding the Federal Reserve’s independence, and renewed shutdown risks.
The pair extended its advance for a fourth straight session on Tuesday, edging closer to the pivotal 1.2000 level for the first time since June 2021.
The latest leg higher reflects a further deterioration in the dollar’s outlook amid revived trade tensions and geopolitical uncertainty, all ahead of the Federal Reserve’s interest rate decision due on Wednesday.
Meanwhile, sentiment surrounding U.S.–European Union trade relations has improved after President Donald Trump softened his rhetoric last week regarding potential tariffs tied to the Greenland dispute. Markets have interpreted this shift positively, boosting risk appetite and lending support to the euro alongside other risk-sensitive currencies.
By contrast, the U.S. dollar continues to underperform. The Dollar Index (DXY) remains under heavy pressure, extending its decline toward the 96.00 area — levels last seen in late February 2022.
The FED: Rates on hold, politics in focus
The Federal Reserve delivered its widely anticipated December rate cut, but the key signal came from its messaging rather than the policy action itself. A divided vote and Chair Jerome Powell’s measured language suggested that additional easing is far from assured.
The Fed begins its two-day policy meeting today, with markets largely expecting rates to remain unchanged when the decision is released on Wednesday.
However, monetary policy may not be the primary focus this time. Market attention has increasingly turned to questions surrounding the Fed’s independence after reports earlier this month of a Justice Department investigation involving Chair Powell.
Compounding the uncertainty, President Trump has indicated that an announcement on his nominee for the next Fed Chair could be imminent, keeping scrutiny on the central bank well beyond the outcome of this week’s meeting.
ECB urges patience, not complacency
The European Central Bank left interest rates unchanged at its December 18 meeting, adopting a more measured and patient tone that has pushed expectations for near-term rate cuts further into the future. Modest upward revisions to growth and inflation projections helped underpin this approach.
Minutes from the meeting, released last week, showed policymakers saw little immediate need to adjust policy. With inflation hovering near target, the ECB has room to remain patient, while still retaining flexibility should risks materialize.
Governing Council members emphasized that patience does not equate to complacency. Monetary policy is viewed as appropriately calibrated for now, but not on autopilot. Markets appear to have absorbed this message, currently pricing in just over 4 basis points of easing over the coming year.
Positioning remains constructive, but confidence has softened
Speculative positioning remains tilted toward the euro, although bullish conviction appears to be easing.
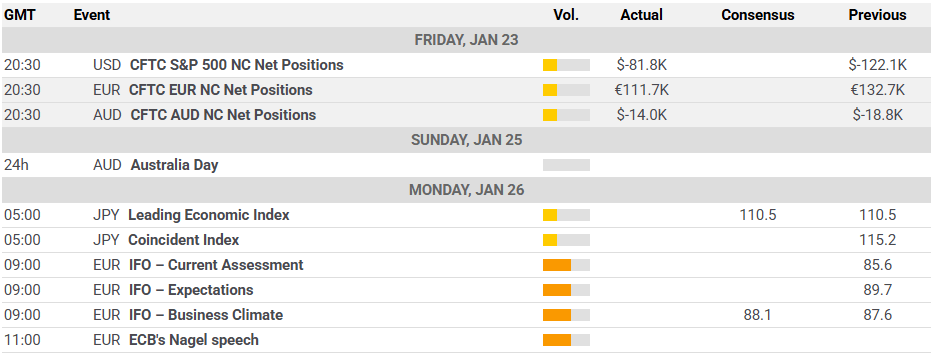
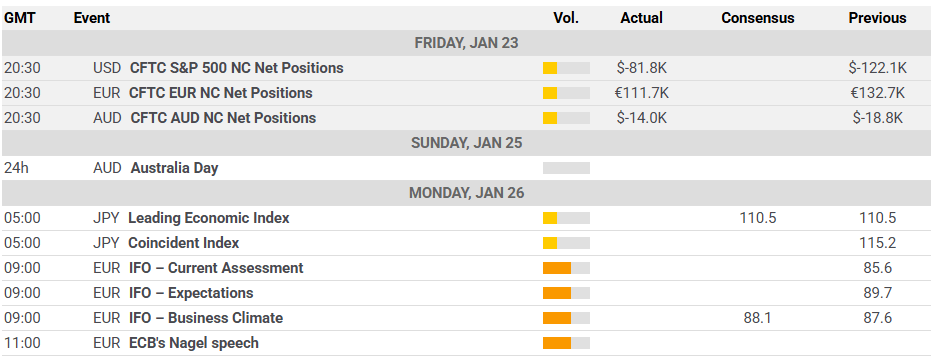
CFTC data for the week ended January 20 show non-commercial net long positions declining to a seven-week low of around 111.7K contracts. At the same time, institutional participants also reduced short positions, which now stand near 155.6K contracts.
Meanwhile, open interest slipped to approximately 881K contracts, breaking a three-week streak of increases and suggesting that market participation may be thinning alongside fading confidence.
Key Events Ahead
Near term: The FOMC meeting is set to keep attention firmly on the U.S. dollar, while flash inflation data from Germany and preliminary GDP readings for the euro area will dominate the regional data calendar later in the week.
Risk: A more hawkish-than-expected outcome from the Fed could quickly tilt momentum back in favor of the dollar. In addition, a clear break below the 200-day simple moving average would increase the risk of a deeper medium-term correction.
EUR/USD Technical Outlook
EUR/USD continues to exhibit a firm bullish bias, trading at levels last seen in mid-2021 while gradually shifting focus toward the key 1.2000 psychological handle.
On the downside, initial support is located at the 2026 low of 1.1576 (January 19), reinforced by the closely watched 200-day simple moving average. A more pronounced correction could open the door to the November 2025 trough at 1.1468, followed by the August base at 1.1391.
Momentum indicators remain broadly supportive of further gains, although elevated conditions may challenge the immediate upside. The Relative Strength Index is hovering near 75, pointing to overbought territory, while an Average Directional Index reading above 26 confirms the presence of a well-established trend.
Bottom Line
For the time being, EUR/USD continues to be influenced primarily by U.S.-centric developments rather than euro area dynamics.
Absent clearer signals from the Federal Reserve on the extent of potential policy easing, or a more compelling cyclical recovery in the eurozone, any additional upside is likely to unfold in a steady, incremental manner rather than marking the beginning of a decisive breakout.
The year ahead offers a clear divide between bullish and bearish outcomes for investors. Will 2026 deliver another period of above-average returns, or mark a turning point toward disappointment? Optimists contend that the foundations for a sustained rally remain intact. A robust technology cycle, heavy corporate investment, and supportive policy settings all suggest further upside. Pessimists, however, warn that key growth drivers are losing momentum, market leadership has become uncomfortably narrow, and underlying economic stress is increasingly evident.
After a strong 2025, investors are entering a shifting market environment. Liquidity is still plentiful, but concerns over stretched valuations, labor-market pressure, and consumer resilience are mounting. Much hinges on how long optimism can outweigh economic realities, and whether expected gains from artificial intelligence and capital spending arrive quickly enough to counteract the drag from debt burdens, interest costs, and widening inequality.
Sentiment remains broadly constructive, though far from unanimous. Equity strategists are split, while bond markets reflect expectations of rate cuts alongside rising recession risk. Fiscal stimulus may postpone a downturn, but it also exacerbates longer-term imbalances. For investors, the central challenge is maintaining objectivity. Both the bullish and bearish narratives are credible, and timing will be decisive. In fact, 2026 could validate elements of both cases, making adaptability the most valuable strategy.
Below, we examine the bullish and bearish scenarios for 2026 in detail, assessing the macroeconomic and market forces behind each view. By translating these dynamics into practical portfolio considerations, investors can prepare for either outcome. Ultimately, success in 2026 will hinge less on forecasting accuracy and more on disciplined risk management.
The Bullish Case
The bullish thesis rests on several core pillars: a fresh surge in technology-led investment, accommodative fiscal policy, improving liquidity conditions, and the ongoing strength of both corporate balance sheets and consumer activity. Together, these forces have propelled markets higher, and proponents argue they will continue to support gains through 2026.
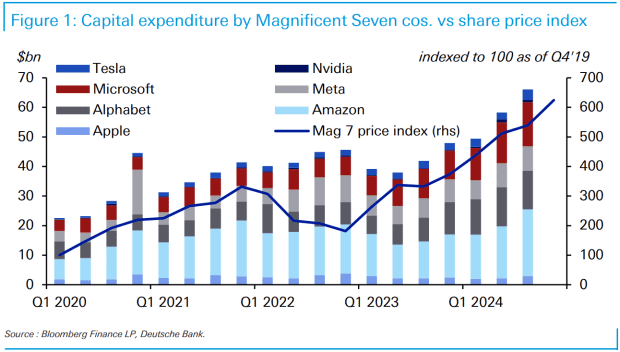
Central to the bull case is the rise of a potentially transformative technology cycle driven by artificial intelligence and large-scale infrastructure upgrades. Unlike earlier tech booms fueled primarily by optimism, this cycle is already translating into substantial capital spending. The so-called “Magnificent Seven” have collectively pledged over $600 billion toward data centers, semiconductor capacity, and AI-related services. This investment is rippling across software, energy, and industrial supply chains. Should the anticipated productivity improvements materialize, corporate earnings could accelerate, providing fundamental support for elevated valuations.
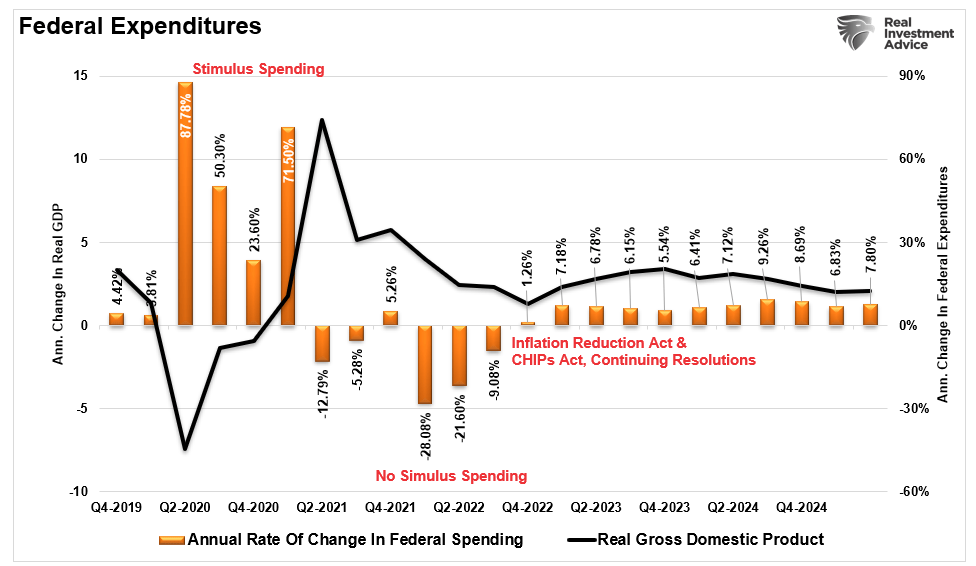
Fiscal policy is also positioned to support growth. Under a Trump-led administration, proposed tax cuts and direct transfers are expected to bolster both corporate activity and consumer spending. While $2,000 stimulus checks may not appear dramatic on their own, they can meaningfully lift short-term consumption and provide relief to small businesses. When paired with income tax reductions, these initiatives create a favorable backdrop for GDP growth and market sentiment. As recent history shows, following the 2022 market correction and widespread recession concerns, ongoing fiscal support has continued to play a stabilizing role in economic expansion.
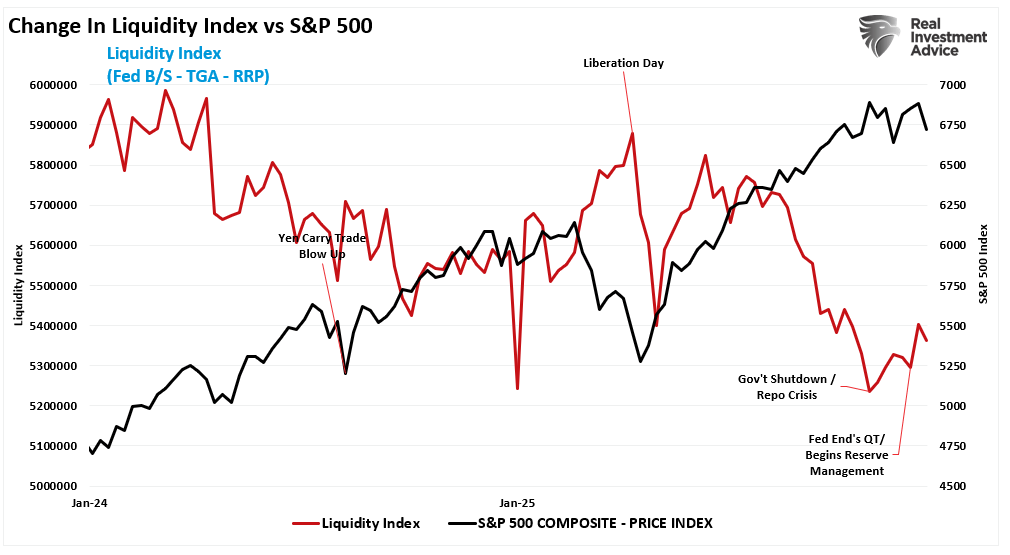
The monetary environment is also turning more supportive for bulls. Quantitative tightening concluded in December 2025, and the Federal Reserve has since shifted toward what many describe as “QE Lite,” combining rate cuts with monthly purchases of roughly $40 billion in short-term Treasuries. Officially framed as “reserve management,” the objective is to maintain ample liquidity within the financial system. As interest rates decline, credit conditions are likely to loosen, providing a favorable backdrop for risk assets. Rising liquidity has historically supported higher equity valuations, with technology and growth stocks typically benefiting the most from this dynamic.
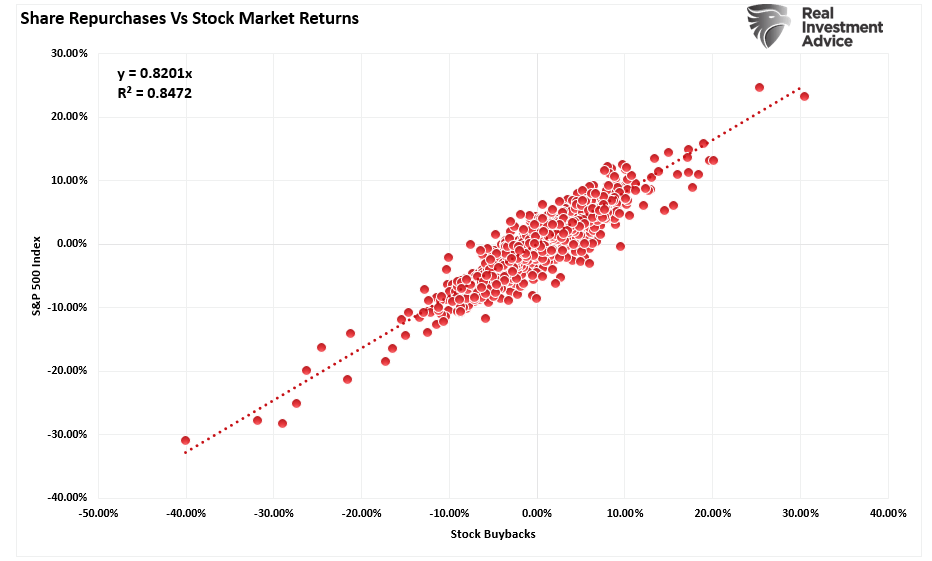
Corporate actions further reinforce the bullish narrative. Share buyback authorizations are projected to reach a new record of more than $1.2 trillion in 2026. Although often framed as a “capital return strategy”—a characterization that misses the point—buybacks have shown a strong correlation with equity market performance. Notably, since 2000, corporate repurchases have accounted for nearly all net equity demand, underscoring their outsized influence on stock prices.
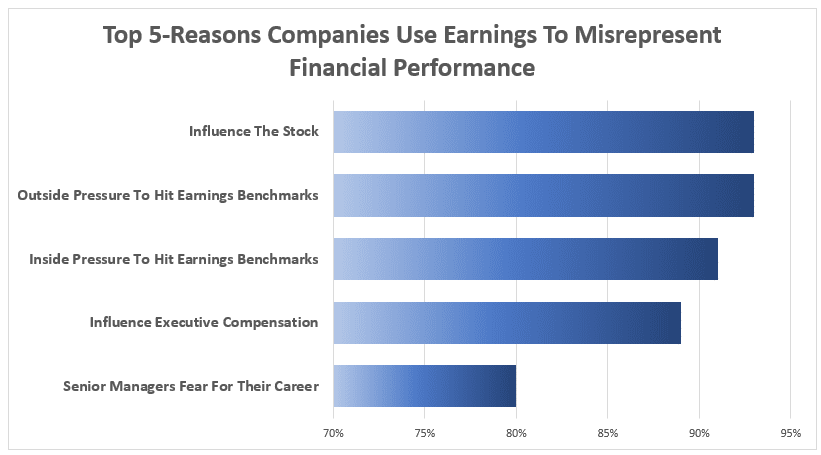
Importantly, the notion that buybacks signal management’s confidence in future earnings is misleading. In practice, repurchases are frequently used as a form of financial engineering to boost per-share results and beat Wall Street expectations. This dynamic is likely to intensify in 2026, further supporting reported earnings growth and reinforcing the bullish case.
Finally, deregulation tied to the so-called “Big Beautiful Bill” is expected to relax capital requirements for banks, enabling them to hold a greater amount of collateral. While this should support the Treasury market, it also expands overall lending capacity. Much of that capacity is likely to flow into leverage for hedge funds and Wall Street trading desks, as looser regulatory constraints encourage greater risk-taking.
The bullish thesis ultimately rests on a reinforcing feedback loop: innovation spurs capital investment, rising investment lifts earnings, policy measures inject liquidity, and investors respond by increasing risk exposure. As long as each link in this chain remains intact, the upward trend can persist.
The Bearish Case
The bearish case starts with a key observation: many of the forces that powered the 2025 rally are now fading or already fully reflected in prices. Elevated valuations, softening economic data, and rising speculative excesses suggest that current market momentum may be masking deeper structural vulnerabilities. With that in mind, it is worth examining several of these risks more closely.
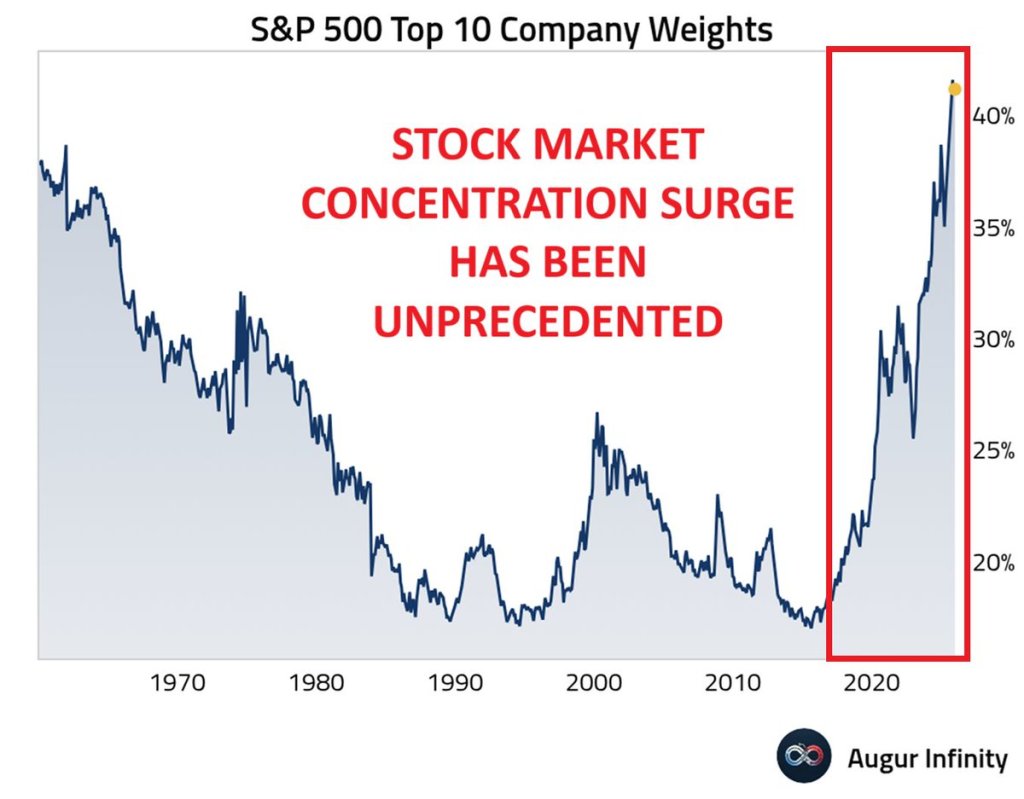
One of the most visible concerns is market concentration. In 2025, the bulk of equity gains came from just 10 companies on a market-capitalization-weighted basis, a dynamic amplified by the continued shift into passive ETF investing.
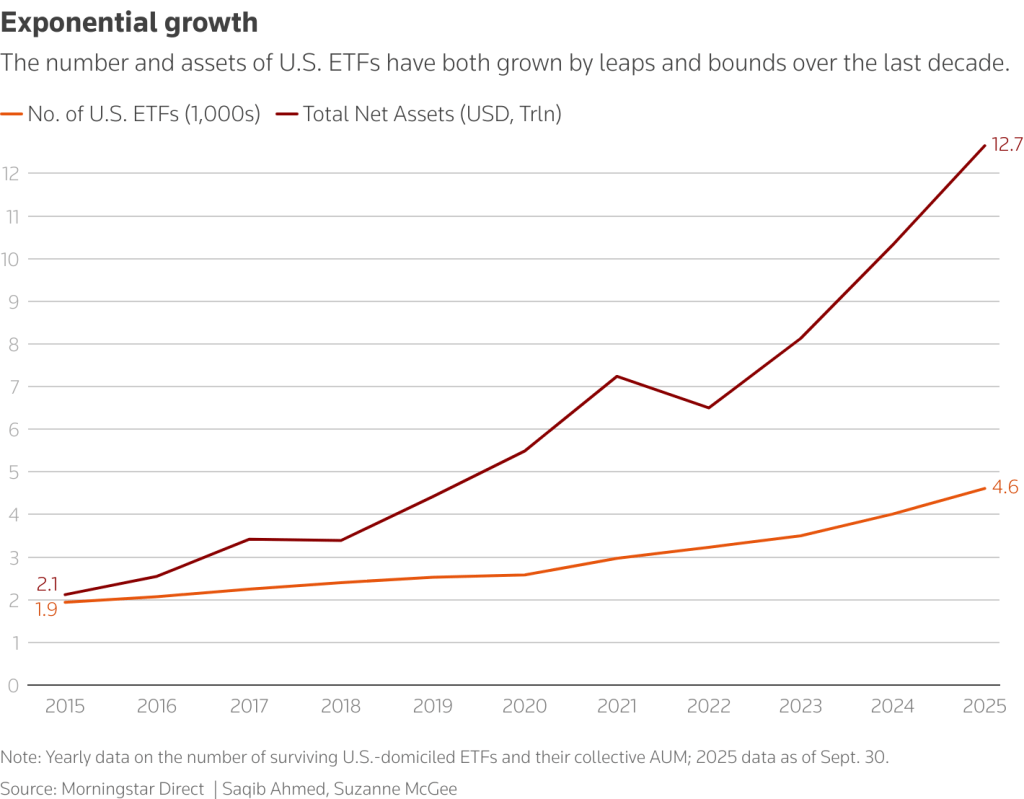
Passive investing has evolved from a niche approach into the dominant force shaping equity markets. Index funds and ETFs now represent more than half of U.S. equity ownership. Because these vehicles allocate capital according to market capitalization rather than valuation, fundamentals, or business quality, the largest companies attract a disproportionate share of inflows. This has created a powerful feedback loop in which rising prices draw in more capital, and those inflows, in turn, push prices even higher.
This narrow leadership is inherently fragile. Should investor flows into ETFs reverse, a disproportionate share of selling—roughly 40%—would be concentrated in the same 10 stocks. History shows that when market performance depends on a small handful of names, volatility tends to increase and drawdowns can be sharp.
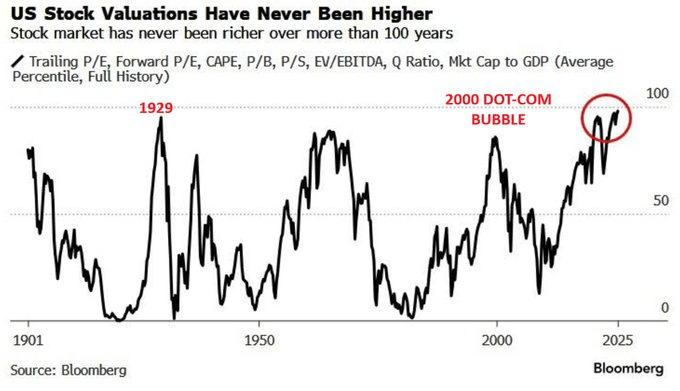
Valuations present another clear risk. Price-to-earnings multiples on the S&P 500 remain near cycle peaks, leaving little room for error. Growth assumptions are ambitious, and even modest earnings disappointments could trigger a meaningful repricing. While enthusiasm around AI has driven a surge in investment, much of this spending is circular—companies are investing in AI largely to produce and sell AI-related products. That dynamic may prove self-limiting over time, particularly if end demand weakens or costs begin to outstrip returns.
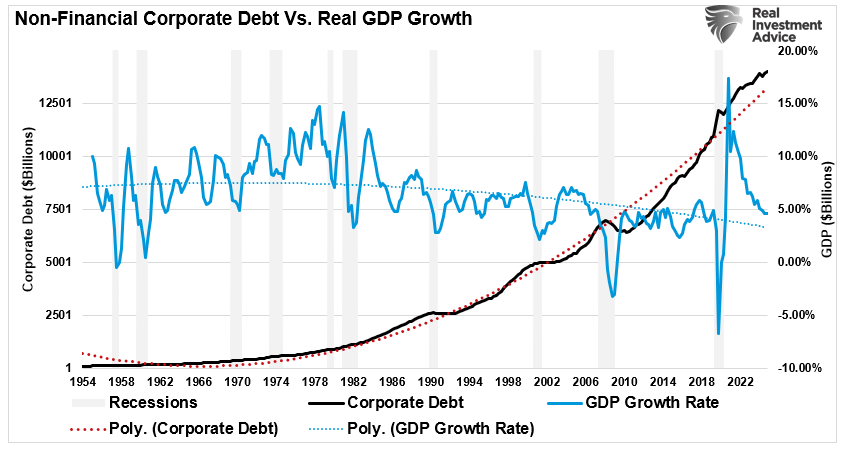
A significant portion of the current investment cycle is also being financed with debt, as companies borrow to fund capital spending, repurchase shares, and sustain dividend payouts. If interest rates remain high or credit conditions deteriorate, rising debt-servicing costs could quickly erode earnings gains.
The broader economic risk is that the reallocation of capital toward technology and automation could sideline large segments of the workforce. While the buildout of data centers may employ thousands during construction, only a fraction of those jobs—perhaps a few hundred—remain once operations begin. Over time, this dynamic could weigh on employment growth, increase the risk of demand destruction, and may already be showing early warning signs.
This dynamic underpins the concept of a “K-shaped economy.” While high-income households and asset owners continue to prosper, lower-income consumers are facing increasing strain. Consumption patterns are diverging as financially pressured households cut back, leaving the top 20% of earners responsible for nearly half of total consumer spending. Signs of stress are already emerging, with rising auto loan and credit card delinquencies, stagnant real wages for many workers, and persistently high costs for housing and essential goods.
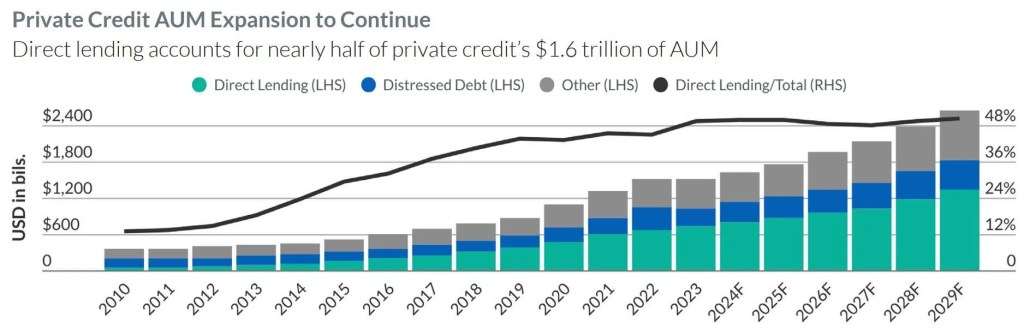
At the same time, risks within the credit system—particularly in private markets—are growing. Private credit has expanded rapidly in recent years, yet limited transparency makes it difficult to fully assess systemic vulnerabilities. Regulators have begun to pay closer attention, and default rates in middle-market lending are climbing. Should these stresses intensify, the fallout could extend across banks, hedge funds, and pension portfolios.
The bearish argument is not one of an imminent crash, but of growing fragility. Beneath the headline gains, the market appears increasingly exposed to earnings disappointments, tighter credit conditions, and weakening consumer demand.
The key takeaway is that 2026 may validate elements of both the bullish and bearish narratives. Preparation, rather than prediction, will be essential.
Navigating Whatever Comes Our Way
Investors should treat 2026 as a year in which both the bullish and bearish narratives may ultimately be validated. In the first half, bullish momentum is likely to persist, supported by strong sentiment, ample liquidity, and continued growth in corporate investment. Optimism around AI, fiscal support, and a potential pause in monetary tightening could propel equity indexes higher.
By the second half, however, underlying vulnerabilities may begin to surface. Elevated valuations increase sensitivity to earnings disappointments, while widening economic inequality could weigh on the outlook for consumer demand and corporate revenues. Should these pressures intensify, market sentiment could shift rapidly.
Navigating such a divided year will require a tactical approach—participating in early upside while avoiding excessive exposure to risks that may materialize later in the year.
Early 2026: Participate in Momentum, but Manage Exposure
Overweight sectors poised to benefit from capital spending and ample liquidity, including technology, industrials, and energy.
Prioritize high-quality growth companies with durable earnings and strong cash-flow generation, rather than momentum-driven narratives.
Implement trailing stop-loss strategies to protect gains if market sentiment shifts.
Use periods of volatility to add selectively, while scaling back position sizes as valuations become more stretched.
Avoid excessive concentration in AI-related stocks, even during strong rallies, as crowding increases dispersion and downside risk.
Mid-to-Late 2026: Emphasize Defense and Cash-Flow Stability
Gradually rotate toward defensive, value-oriented sectors such as healthcare, consumer staples, and utilities.
Increase exposure to dividend-paying companies with strong balance sheets and resilient cash flows.
Raise cash allocations or shift into short-duration Treasuries to preserve flexibility.
Allocate selectively to high-quality credit while reducing exposure to private credit and high-yield debt.
Monitor consumer credit conditions, labor-market trends, and bank earnings for early signs of financial stress.
Throughout the Year: Maintain Discipline and Objectivity
Adhere to valuation discipline regardless of shifts in market narratives.
Keep portfolios well diversified to withstand both volatility and sector rotation.
Let data—not headlines—drive allocation decisions.
Rebalance regularly, particularly if strong first-half performance leads to excessive concentration in certain sectors.
In 2026, tactical flexibility, risk awareness, and discipline are likely to matter more than adopting a purely bullish or bearish stance. It is a year in which both camps could be partially wrong. Markets rarely move in straight lines, but a sound investment process should remain consistent throughout.
The year ahead is likely to test investors with heightened volatility, as both the bullish and bearish arguments carry real weight. A new technology cycle may generate genuine economic momentum, yet it also introduces risks tied to elevated valuations, debt-fueled growth, and widening inequality. With markets effectively pricing in near-perfection, history suggests outcomes often fall short of expectations.
Whether 2026 delivers further gains or a sharp correction, performance will hinge on effective risk management. Avoid anchoring to any single narrative. Let data guide decisions, respect your signals, and remain willing to adjust as conditions evolve.
Ultimately, the objective is not to chase short-term returns, but to endure—and compound—across full market cycles.
Wednesday brings the FOMC meeting and Chair Powell’s press conference, and it wouldn’t be surprising if President Trump chose that moment—ideally around 2:30 p.m. ET—to announce his pick for the next Fed chair. Such timing would dominate headlines, catch financial media off guard, and inject maximum uncertainty into markets.
That said, the Fed is not expected to cut rates at this meeting, which should keep the event relatively uneventful. In the bigger picture, what the Fed does between now and May may prove less important, particularly if a new chair is appointed and moves quickly toward easing.
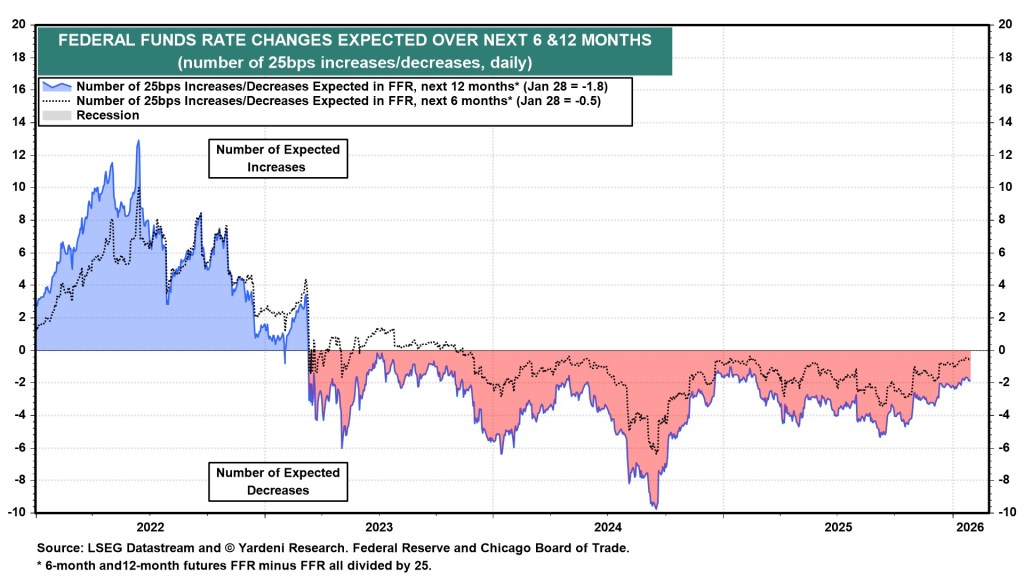
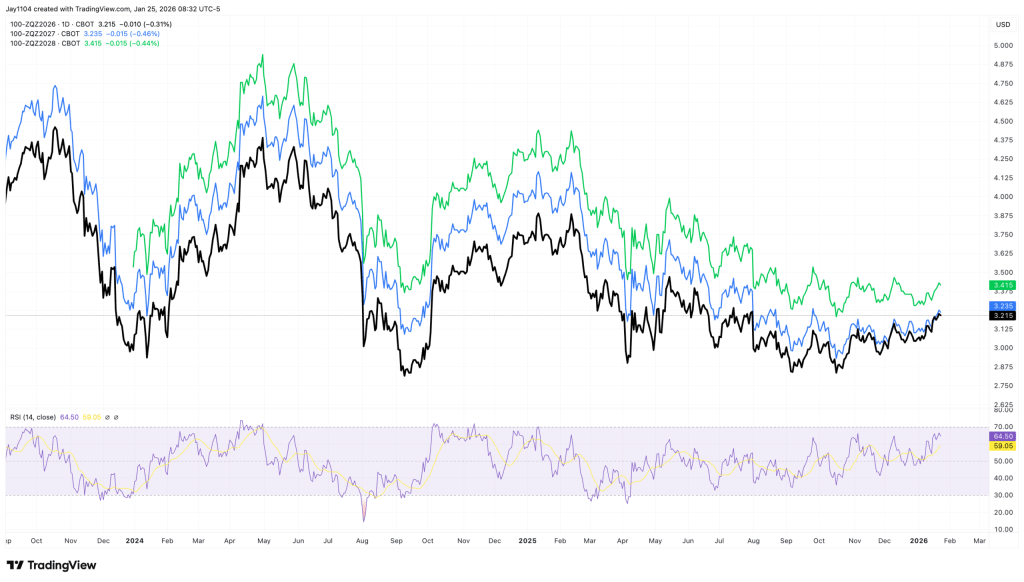
Markets appear to be dialing back expectations for aggressive rate cuts. Current pricing suggests the fed funds rate settles near 3.25% by December, with little additional easing beyond that. To meaningfully shift those expectations, the nominee would likely need to be notably dovish—something markets already anticipate, given the widespread assumption that Trump will select a policy-leaning accommodator.
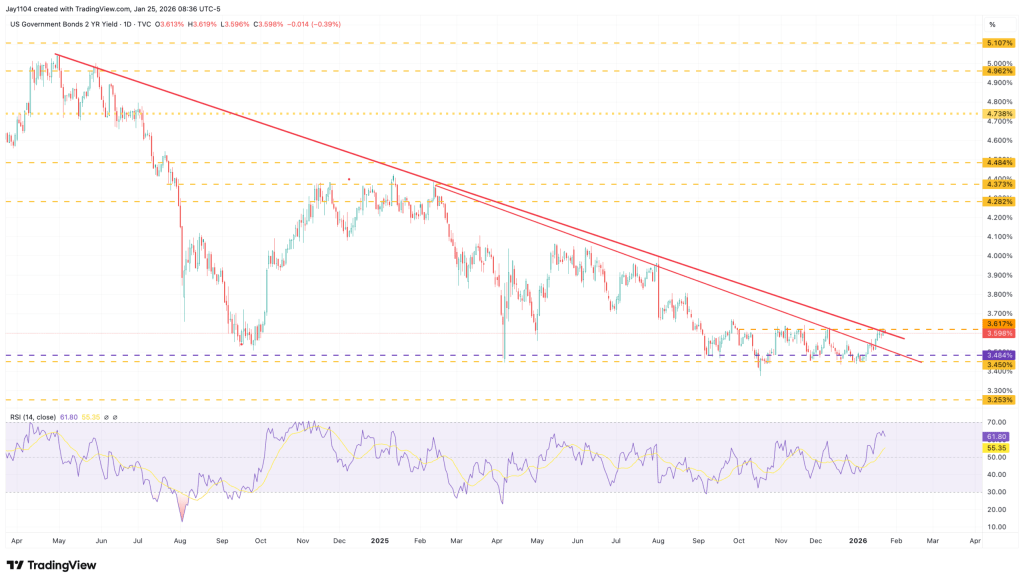
As a result, the risk of a breakout in the 2-year Treasury yield appears increasingly credible, with initial resistance near 3.62%. Beyond that, a move back toward the 4% level cannot be ruled out. From a technical perspective, the setup supports this view: the 2-year yield has formed multiple bottoms in recent months, and the RSI has begun to turn higher, signaling building upside momentum.
The direction of the 2-year yield may ultimately be more closely linked to oil prices. With inflation still hovering near 3% and crude having fallen to around $60 from highs in the $120s, the message is clear: a rebound in oil prices could quickly reignite inflation pressures. That dynamic likely explains why the price action in oil and the 2-year yield charts has begun to look strikingly similar.
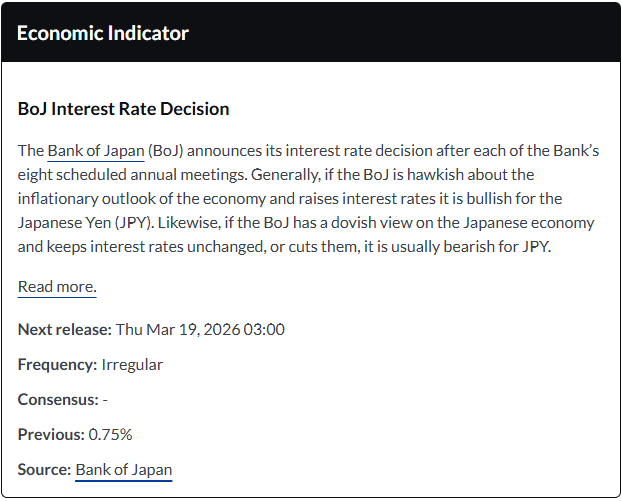
The Bank of Japan once again chose to kick the can down the road, leaving rates unchanged and, in my view, offering little in the way of a clear policy roadmap. The yen’s strength on Friday appeared to be driven solely by reports of a possible “rate check” by the New York Fed on behalf of the U.S. Treasury—widely interpreted as a warning signal that currency intervention could be imminent. Perhaps the strategy is to keep markets stable until after the snap election in February. It’s hard to say, but it should be telling to see how markets react once Japan reopens on Monday.
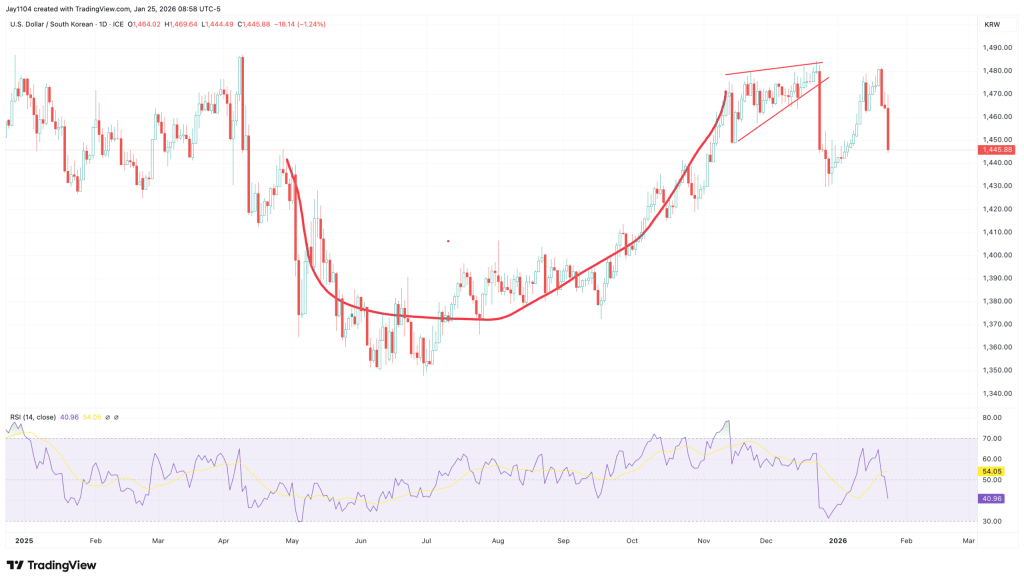
The Korean won also strengthened notably against the U.S. dollar on Friday. In recent weeks, there has been growing chatter that the KRW had become excessively weak, so it’s likely the currency took the developments around the yen as a warning signal and moved to reprice accordingly.
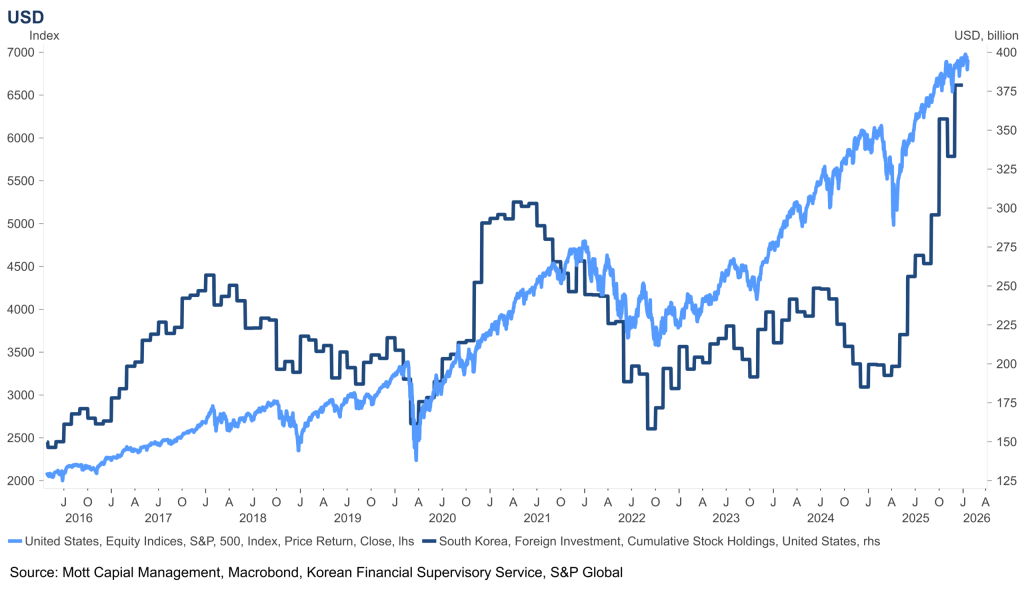
The Korean won likely matters more than many investors realize, given the sizable exposure South Korean investors have built up in U.S. equities. That dynamic is probably one of the reasons the KRW has weakened so significantly in the first place—buying U.S. stocks requires selling won for dollars.
If the KRW begins to strengthen from here, it could start to put pressure on that trade. For investors who are unhedged on the currency side, a stronger won increases the risk of FX-related losses on their U.S. equity holdings, potentially prompting position adjustments.
Of course, this week also brings major earnings reports from Microsoft, Apple, Tesla, and Meta. From what I can see, all four stocks are currently sitting in positive gamma with positive delta positioning. Implied volatility typically builds into earnings because of the event risk, which sets up a familiar dynamic: unless a company delivers truly blowout results, the reaction can easily turn into a sell-the-news move. Once earnings are released, implied volatility collapses and hedges are unwound as delta decays, potentially putting pressure on the shares.
This week’s spotlight will be on the Fed’s FOMC meeting, Chair Powell’s press conference, major Big Tech earnings, and the looming U.S. government shutdown deadline. Apple is set to report earnings after Thursday’s close, with expectations rising for a beat-and-raise quarter. Meanwhile, Starbucks looks like a sell, as profit growth continues to slow and a weaker outlook is anticipated.
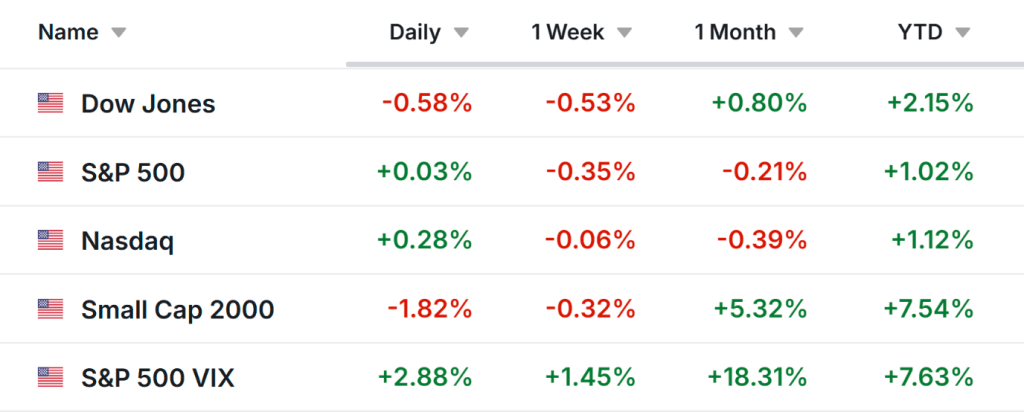
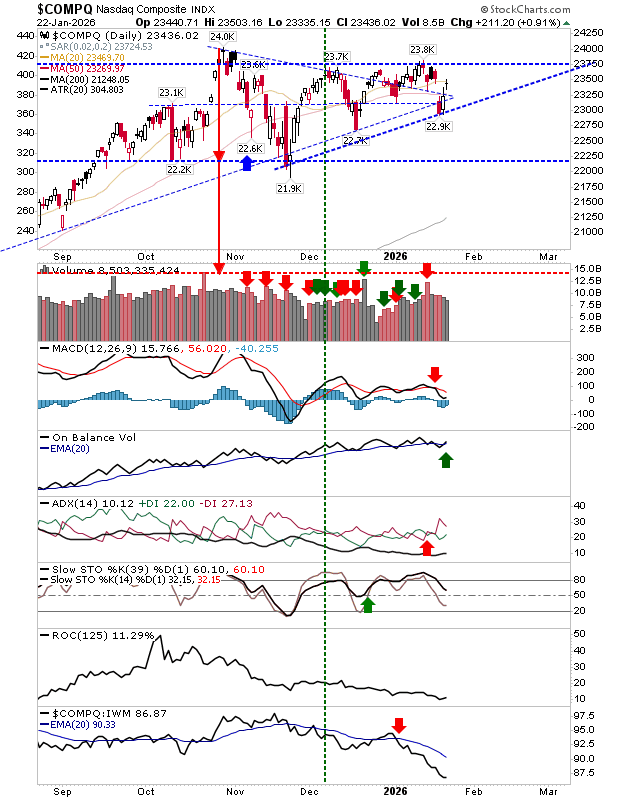
The stock market finished Friday on a mixed note, as both the S&P 500 and Nasdaq Composite recorded their second consecutive weekly declines.
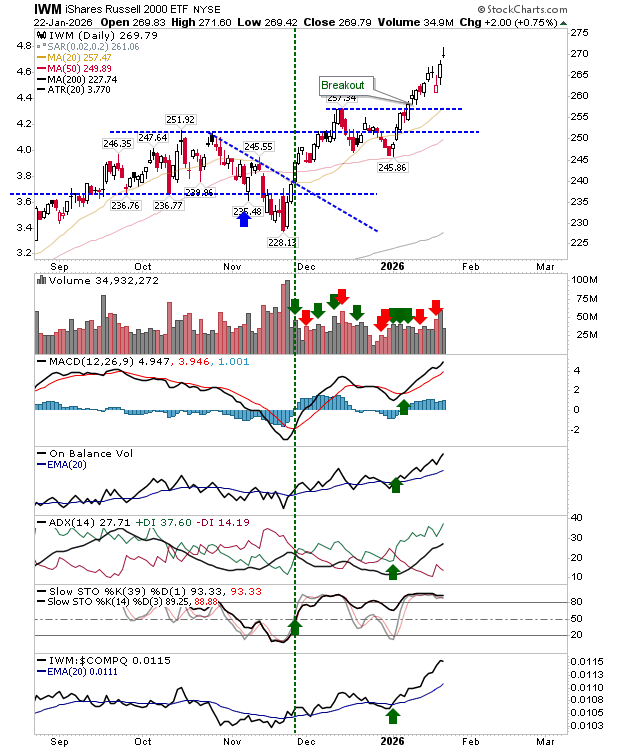
The Dow Jones Industrial Average slipped 0.5% for the week, while the S&P 500 edged down about 0.4%. The tech-heavy Nasdaq fell by less than 0.1%, and the small-cap Russell 2000 lost 0.3%.
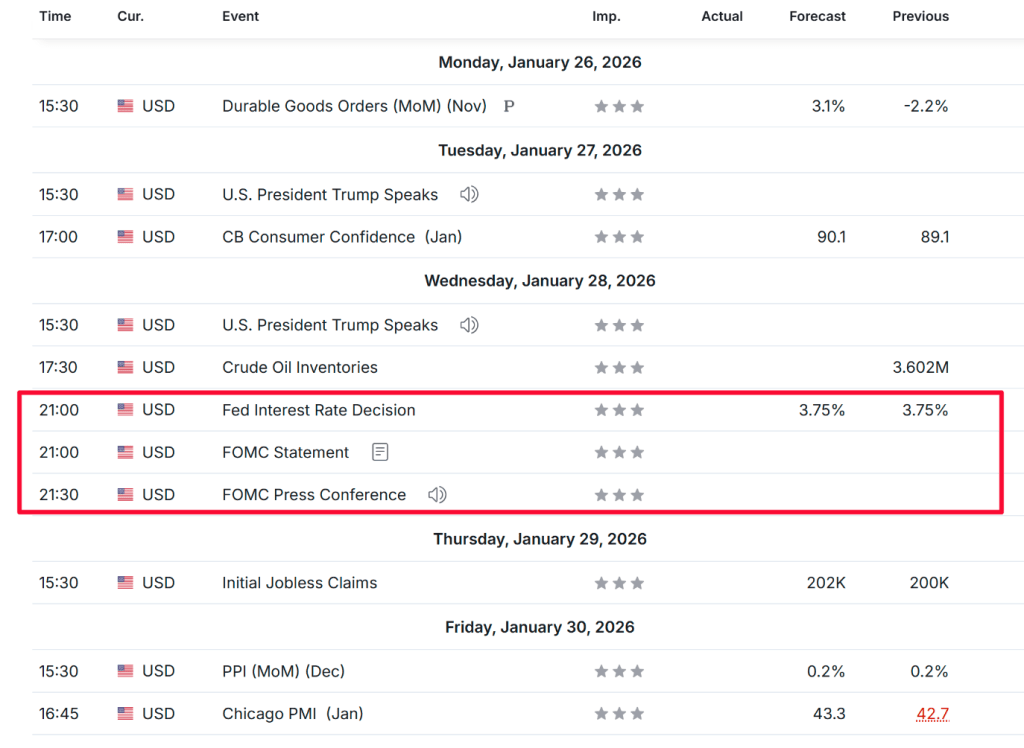
Looking ahead, the coming week is set to be a blockbuster, packed with potential market catalysts. Investors will be watching a crucial Federal Reserve policy meeting alongside a wave of earnings from major technology companies.
The Fed is widely expected to hold interest rates steady on Wednesday, though markets could see volatility as Chair Jerome Powell addresses the media in his post-meeting press conference.
Other key economic releases on the calendar include durable goods orders on Monday and The Conference Board’s Consumer Confidence Index for January on Tuesday. Friday will also bring the release of the December producer price index.
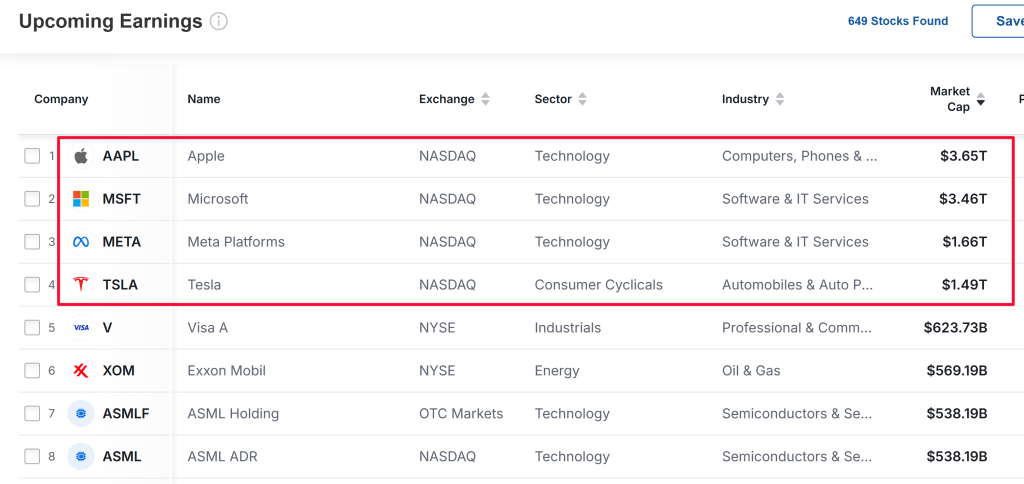
At the same time, earnings season ramps up sharply, with four members of the “Magnificent Seven” set to report this week. Microsoft (NASDAQ:MSFT), Tesla (NASDAQ:TSLA), and Meta Platforms (NASDAQ:META) are scheduled to announce results Wednesday evening, followed by Apple (NASDAQ:AAPL) after the close on Thursday.
These mega-cap names will be joined by a long list of other major companies, including IBM (NYSE:IBM), ASML (NASDAQ:ASML), SanDisk, Exxon Mobil (NYSE:XOM), Chevron (NYSE:CVX), Visa (NYSE:V), Mastercard (NYSE:MA), American Express (NYSE:AXP), SoFi Technologies (NASDAQ:SOFI), UnitedHealth Group (NYSE:UNH), Boeing (NYSE:BA), UPS (NYSE:UPS), Caterpillar (NYSE:CAT), General Motors (NYSE:GM), Verizon (NYSE:VZ), AT&T (NYSE:T), Starbucks (NASDAQ:SBUX), American Airlines (NASDAQ:AAL), RTX (NYSE:RTX), and Lockheed Martin (NYSE:LMT).
Adding to the uncertainty, Congress faces a Friday deadline to fund the government once again, with the risk of a prolonged shutdown looming.
No matter how markets ultimately move, I outline below one stock that could attract strong buying interest and another that may face renewed downside pressure. Keep in mind, this outlook is strictly for the week ahead, from Monday, January 26 through Friday, January 30.
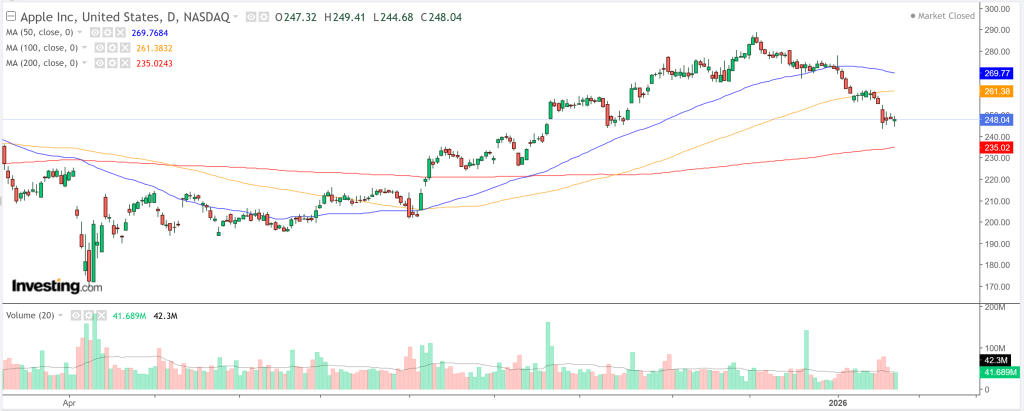
Stock to Buy: Apple
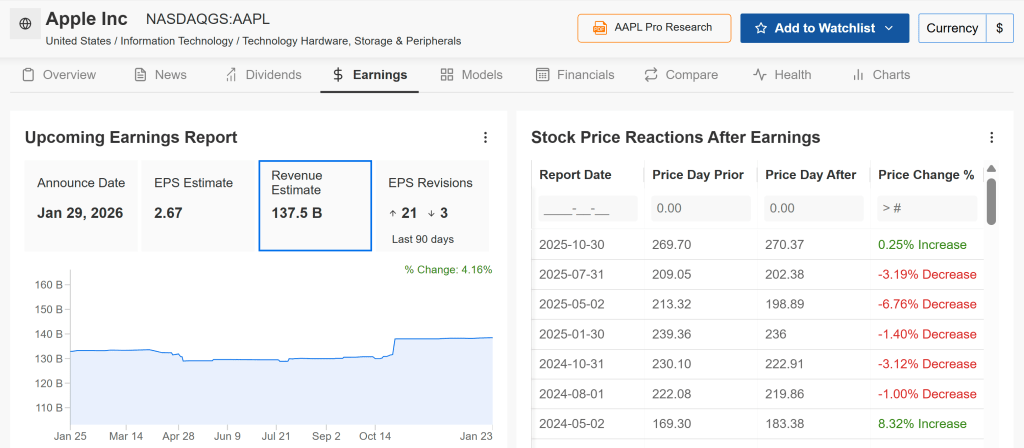
Apple is scheduled to report earnings after the market closes on Thursday, with conditions lining up for a possible upside surprise. Wall Street is increasingly calling for a beat-and-raise quarter, as consensus forecasts point to double-digit revenue growth fueled by steady iPhone demand and continued expansion in services.
Options markets are pricing in a post-earnings move of roughly plus or minus 4%. Meanwhile, earnings expectations have turned more optimistic, with profit estimates revised higher 21 times in recent weeks versus just three downward revisions, according to InvestingPro data—underscoring the growing bullish sentiment surrounding Apple’s results.
Apple is expected to post adjusted earnings of $2.67 per share, representing an 11.2% increase from a year ago, while revenue is projected to climb 10.6% year over year to $137.5 billion. Analysts are looking to the iPhone and Services segments to lead the charge, pointing to double-digit growth and a strong pipeline of upcoming products, including a foldable iPhone and an AI-enhanced Siri.
With sentiment leaning bullish, the market appears positioned for a positive surprise. Price targets reaching as high as $350—implying roughly 41% upside—suggest that even a modest earnings beat could be enough to trigger a rebound in the stock.
So far in 2026, Apple shares have struggled, falling roughly 9% year to date to finish Friday at $248.04. The decline has mirrored broader volatility across the tech sector, alongside investor concerns that Apple’s AI strategy may be lagging rivals such as Alphabet.
That said, the recent pullback is shaping up as a potential buying opportunity. The stock is trading in deeply oversold territory, and while daily technical indicators still signal a “Strong Sell,” key support sits near $247.53 (pivot S1). A decisive move above resistance at $248.87 could open the door to a rebound toward $260 or higher, particularly if earnings guidance exceeds expectations.
Trade Setup:
Entry: $248 (pre-earnings)
Target: $265 (gain ~7%)
Stop-Loss: $240 (risk ~3%)
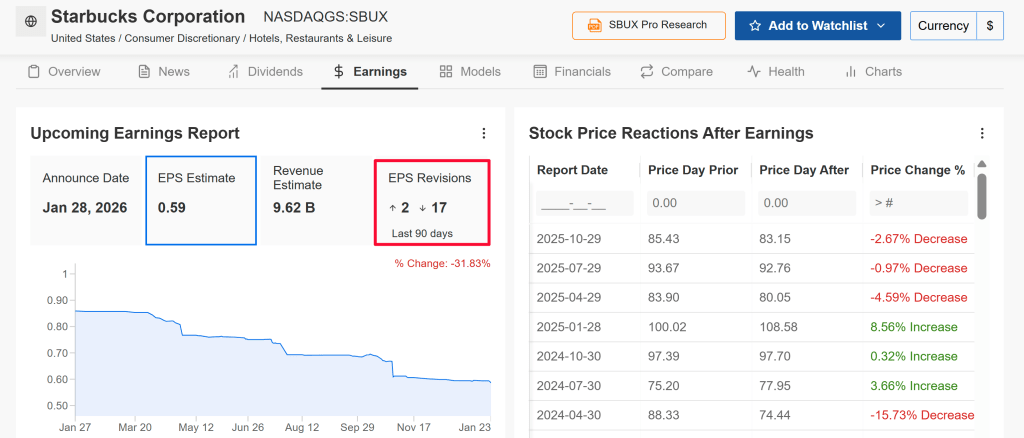
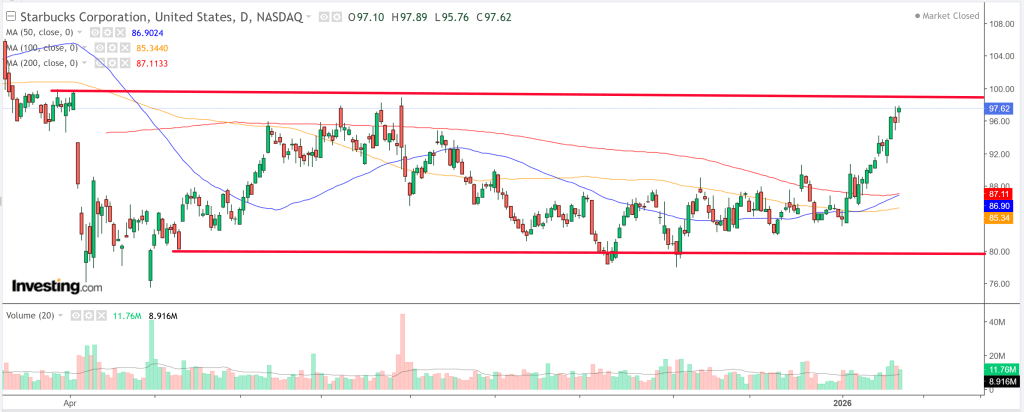
Stock to Sell: Starbucks
Starbucks is set to report earnings Wednesday morning, but unlike Apple, it heads into the week on much shakier footing. The coffee chain is grappling with slowing same-store sales in core markets, intensifying competition, changing consumer spending habits, and persistent cost pressures from labor and commodities.
Options markets are pricing in a post-earnings move of about plus or minus 6.4%, highlighting elevated downside risk. Sentiment has also turned notably bearish, with 17 of the 19 analysts tracked by InvestingPro cutting their EPS forecasts over the past three months ahead of the report.
Wall Street is bracing for a difficult quarter, with earnings per share projected to fall 15.9% year over year to $0.59, even as revenue is expected to edge up 2.5% to $9.62 billion.
Starbucks is also contending with intensifying competition from value-focused fast-food chains such as McDonald’s and Dunkin’, alongside pressure from local coffee shops. At the same time, its China growth narrative—once a major upside driver—has increasingly become a source of investor concern.
Looking ahead, expectations are building that CEO Brian Niccol may caution about continued near-term weakness, citing softer customer traffic, higher operating costs, and lingering uncertainty around the company’s turnaround efforts.
So far in 2026, Starbucks has been one of the stronger performers, climbing roughly 16% year to date and closing Friday at $97.62. However, the technical setup suggests the stock may be overextended heading into earnings.
Key pivot support lies near $96.25, with resistance around $97.84. A downside break below support could open the door to a pullback toward the $90 level if earnings or guidance disappoint.
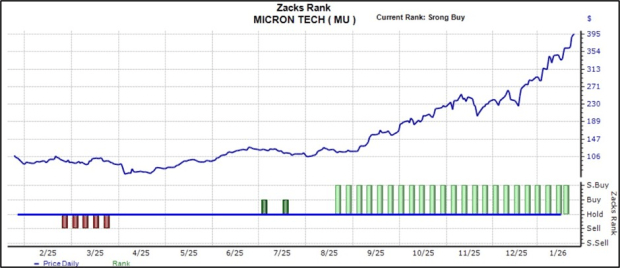
Micron (MU) is a global leader in advanced memory and storage technologies, playing a critical role in converting data into actionable intelligence. The stock has surged amid the AI-driven rally, as Micron’s products have become an essential component of AI infrastructure, particularly in addressing persistent memory bottlenecks.
The shares also highlight the effectiveness of the Zacks Rank framework. In August of last year, Micron was upgraded to the highly sought-after Zacks Rank #1 (Strong Buy) following upward revisions to earnings estimates, a shift that has since been accompanied by a strong and sustained rally in the stock price.
As illustrated above, the Zacks Rank may also have helped mitigate downside risk last March.
Why Micron Shouldn’t Be Overlooked
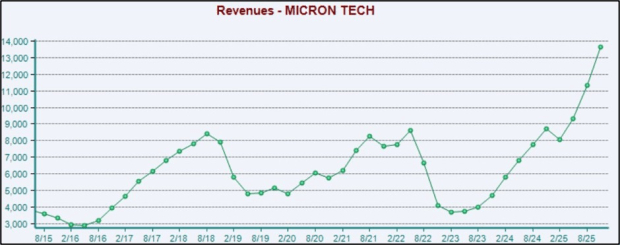
Micron delivered outstanding results in its latest earnings report, surpassing consensus expectations on both revenue and earnings, driven by rapidly accelerating demand tied to AI workloads. Revenue surged more than 55% year-over-year to a record high, while adjusted EPS jumped an impressive 185%.
The company’s cash-generation profile also strengthened significantly amid the favorable demand backdrop. Operating cash flow reached a record $8.4 billion during the period, sharply exceeding the $5.7 billion generated in the same period last year.
The positive momentum appears set to continue, with Micron’s Q2 guidance pointing to new records across revenue, margins, earnings, and free cash flow. In short, Micron plays a critical role in enabling the AI boom, as memory capacity remains a key bottleneck in advanced systems. This strategic positioning places the company in a strong overall stance and helps shield it from concerns about being an AI “also-ran” or laggard.
As illustrated below, Micron’s revenue has surged sharply in recent periods, reinforcing the strength of the current demand environment. The company’s top-line trajectory mirrors that of NVIDIA (NVDA – Research Report), widely regarded as the flagship beneficiary of the broader AI trade.
Micron vs. NVIDIA
While many AI-linked companies are likely to come under increased scrutiny in 2026, Micron represents a far more straightforward beneficiary of the broader infrastructure buildout. Memory remains a key bottleneck in AI systems, and MU has been capitalizing meaningfully on this constraint. The company recently announced its exit from the consumer memory segment, further underscoring its strategic focus on maximizing revenue from large-scale enterprise and data-center customers.
Micron noted that “AI-driven growth in the data center has led to a sharp increase in demand for memory and storage,” adding that the decision to wind down its Crucial consumer business was made to improve supply allocation and support for larger, strategic customers in faster-growing markets.
Overall, Micron stands out as one of the most compelling AI-related investment opportunities, drawing a clear parallel with NVIDIA. While NVIDIA dominates the GPU side of AI computing, Micron plays an equally critical role by supplying the high-performance memory required for those GPUs to operate efficiently.
Turning to NVIDIA, the company once again delivered a double beat versus consensus in its latest, record-setting earnings report. Revenue reached $57 billion, up 62% year-over-year, alongside a 67% surge in earnings per share. Data Center revenue climbed to $51.2 billion, representing a robust 66% annual increase and comfortably exceeding consensus expectations of $49.1 billion.
For investors looking to capitalize on the AI infrastructure buildout, both Micron (MU – Research Report) and NVIDIA (NVDA) stand out as premier choices, with each currently holding the highly sought-after Zacks Rank #1 (Strong Buy).
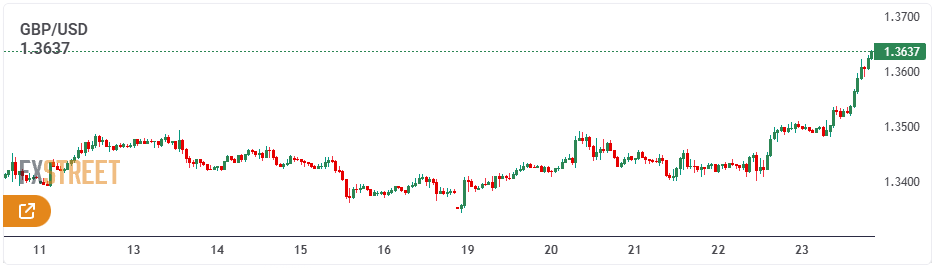
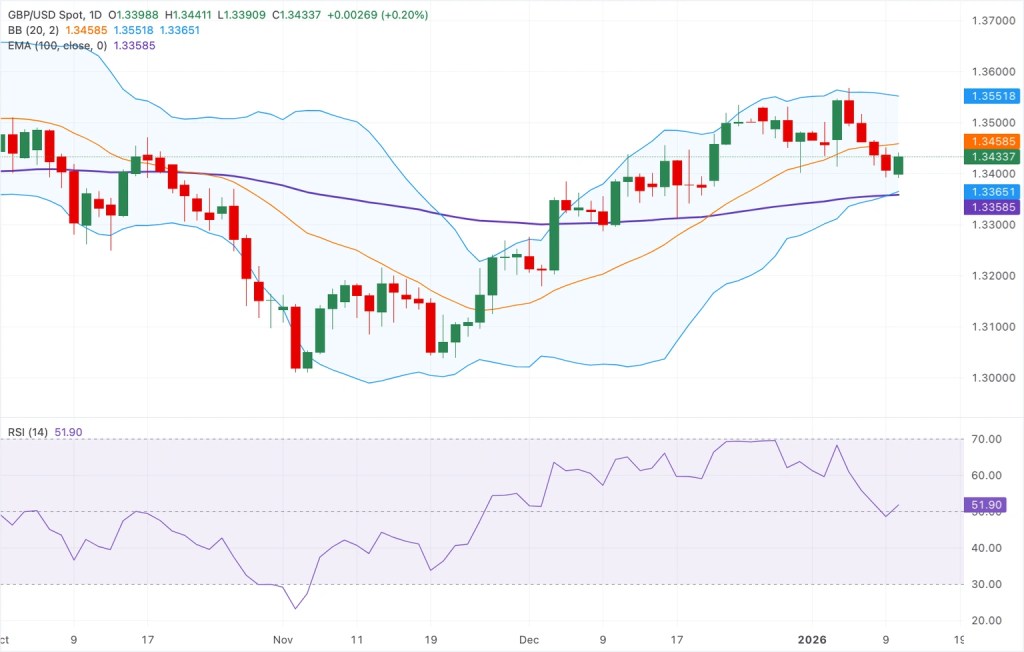
GBP/USD is extending its strong weekly rally and is edging closer to the 1.3600 handle on Friday, marking fresh four-month highs. The pair’s upside momentum is being fueled by a deepening decline in the US Dollar, while supportive UK economic data further reinforces the bullish trend.
Fundamental Analysis Overview
The latest PMI data signaled a strong expansion in overall business activity, driven by a notable pickup in both manufacturing and services. The Composite PMI surged to 53.9 in January from 51.4 in December, comfortably surpassing market expectations of 51.7.
The Services PMI climbed to 54.3, exceeding both the forecast of 51.7 and the previous reading of 51.4, while the Manufacturing PMI also improved markedly, rising to 51.6 from 50.6.
In addition, UK Retail Sales rebounded in December after two consecutive monthly declines. Data from the Office for National Statistics (ONS) showed that Retail Sales, a key gauge of consumer spending, increased by 0.4% month-over-month, defying expectations for a 0.1% contraction.
On a year-on-year basis, consumer spending rose sharply by 2.5%, well above the consensus forecast of 1% and up from a revised 1.8% in November (previously reported at 0.6%).
The stronger-than-expected Retail Sales figures are likely to reduce market expectations for near-term interest rate cuts by the Bank of England (BoE).
Looking ahead, the UK economic calendar is relatively light next week, leaving broader market sentiment and expectations surrounding the BoE’s February policy decision as the primary drivers of Pound Sterling performance.
GBP/USD Technical Outlook
GBP/USD is trading around 1.3437 at the time of writing. The 20-day Exponential Moving Average is hovering near 1.3439, with price currently testing this dynamic resistance. A daily close above the moving average would strengthen near-term momentum. The Relative Strength Index (RSI) stands at 52, edging higher but still signaling broadly neutral momentum.
Using the move from the 1.3780 peak to the 1.3006 trough, the 50% Fibonacci retracement at 1.3393 continues to act as a hurdle on rebounds, while the 61.8% retracement at 1.3485 limits upside potential. A decisive break above the latter would suggest the broader bearish bias is losing strength and could pave the way for a deeper recovery, whereas rejection at that level would likely keep the pair confined to a range.
Gold prices remain firmly in an uptrend and are poised to test the key $5,000 per troy ounce level on Friday. The precious metal’s strong rally accelerates amid mounting US Dollar weakness and mixed US Treasury yields across the curve.
Fundamental Analysis Overview
Expectations of additional monetary easing by the US Federal Reserve (Fed) continue to support demand for the non-yielding yellow metal, even as geopolitical risks have eased following US President Donald Trump’s reversal on Greenland. The bullish momentum also appears largely undeterred by extremely overbought short-term technical conditions, reinforcing the view that Gold’s path of least resistance remains upward.
On Wednesday, Trump announced the cancellation of planned tariffs on European allies related to US control over Greenland, after reaching a preliminary framework with NATO leaders on future Arctic security cooperation. He also dismissed the possibility of taking Greenland by force, encouraging risk appetite. However, the positive market response proved short-lived, as dovish Fed expectations dominated, outweighing Thursday’s US economic data and pushing the US Dollar (USD) back toward its lowest level since January 6, last seen earlier this week.
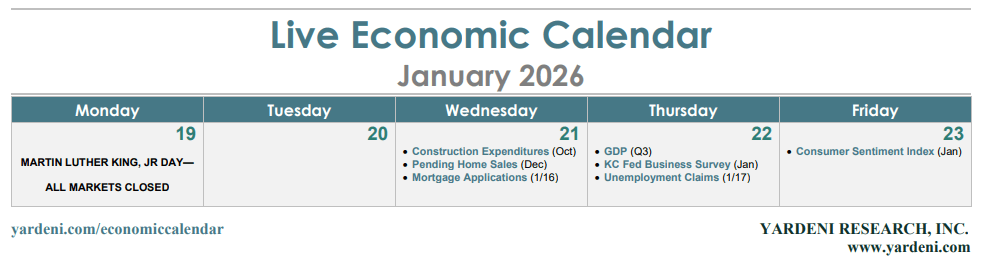
Data from the US Bureau of Economic Analysis showed that final third-quarter GDP growth came in at 4.4%, marginally above the previous estimate of 4.3% and notably stronger than the 3.8% expansion recorded in the prior quarter. Meanwhile, the Core Personal Consumption Expenditures (PCE) Price Index — the Fed’s preferred inflation measure — rose 2.8% year-on-year in November, up from 2.7%, while the monthly increase remained steady at 0.2%.
Further weighing on the USD, the US Department of Labor reported that initial jobless claims edged up by 1,000 to 200,000 for the week ending January 17, below market expectations of 212,000. Despite the better-than-expected figure, the data failed to offer meaningful support to the greenback amid the broader de-dollarization trend. Investors now turn their attention to upcoming flash PMI releases for insight into global economic conditions, which could influence risk sentiment and shape Gold’s trajectory as it heads toward solid weekly gains.
XAU/USD Technical Analysis
The broader uptrend remains supported by an ascending channel originating from $3,805.69, with XAU/USD now having decisively broken above the channel’s upper boundary around $4,742.80. The Moving Average Convergence Divergence (MACD) remains firmly above the zero line and continues to trend higher, indicating strengthening bullish momentum. Meanwhile, the Relative Strength Index (RSI) stands at 81.25, deep in overbought territory, which may limit immediate upside as momentum becomes stretched.
That said, a sustained hold above the former channel ceiling opens the door for a continuation of the rally toward new highs. On the downside, initial support is seen near the ascending channel’s lower boundary at $4,437.79 should prices consolidate. A flattening MACD would point to fading upside momentum at elevated levels, while a pullback in RSI toward the 70 mark would help ease overbought conditions and reinforce trend stability. A failure to defend the breakout zone could trigger a move back into the previous range, whereas continued momentum would keep bullish control intact.
Shares of Apple (NASDAQ: AAPL) have come under sustained selling pressure, with the stock now trading around $245—nearly 15% below the record high reached just last month. The decline has been largely one-way, which is notable given Apple’s reputation as one of the market’s most reliable large-cap names. Broader market conditions have also weighed on the stock, as escalating geopolitical tensions have fueled a sharp risk-off move across equities in recent days.
What makes the current situation particularly striking is how stretched Apple’s technical signals have become. The stock’s relative strength index (RSI) has fallen into deeply oversold territory this month, currently hovering near 18—its lowest level since September 2008. Such an extreme reading suggests that selling may have been excessive and overly rapid, especially with the company’s earnings report scheduled for next week.
Understanding the Setup as Apple Heads Toward Earnings
An RSI reading this depressed would draw attention for any stock, especially one like Apple. With the company heading into a closely watched earnings report next week, the setup becomes even more compelling.
Apple has a well-established history of beating analysts’ expectations on a quarterly basis, and viewed through that lens, the current situation raises an important question. After such an aggressive sell-off, is it possible that the market has already priced in a worst-case outcome?
Apple’s Fundamentals Still Strengthen the Bullish Case
From a business perspective, Apple’s recent share price performance appears increasingly out of step with its underlying fundamentals. The company’s consistent ability to exceed earnings expectations is something few of its peers can rival. Gross margins remain solid, and its ecosystem-based model continues to deliver dependable cash flows.
Apple’s approach to returning capital also offers a meaningful buffer for investors considering an entry. A sizable share repurchase program alongside steady dividend growth means management is a regular buyer of its own stock during periods of weakness. While this doesn’t eliminate the risk of sharp pullbacks, it often helps prevent negative sentiment from persisting for long.
That said, the concerns driving the sell-off cannot be ignored. iPhone shipment volumes have softened, and the stock’s valuation is near the upper end of its recent range. These factors help explain investor caution, but they fall short of fully justifying the speed and magnitude of the recent decline.
Analyst Confidence Grows Ahead of Apple’s Earnings
The case for buying the dip is reinforced by steadfast analyst support for Apple. This week, Evercore added the stock to its tactical outperform list ahead of next week’s earnings, reflecting confidence that the company will deliver results above expectations.
Recent analyst commentary has focused on the composition of iPhone sales, with higher-end models reportedly making up a greater share of demand. This trend supports both average selling prices and margins. Meanwhile, services revenue is expected to continue providing a stable source of growth, helping to cushion any weakness in hardware volumes.
Evercore set a new price target of $330 for Apple, implying roughly 35% upside from current levels, and that still isn’t the most optimistic view on the Street. Wedbush released a bullish update last week, assigning a $350 price target and further supporting the argument that the market’s reaction has been excessive. With momentum already deeply washed out, even a modest beat on revenue or earnings could be enough to spark a meaningful shift in sentiment.
Apple’s Risk/Reward Looks Compelling at Current Prices
None of this suggests Apple is without risk. Next week’s earnings will carry more weight than usual, and a true disappointment could drive the stock lower—particularly if geopolitical tensions intensify.
That said, the risk/reward profile is becoming increasingly asymmetric. This is the most oversold Apple has been in nearly two decades, and for a company with its balance sheet strength, margin profile, and history of delivering shareholder returns, it’s difficult to ignore the appeal of buying at these levels.
Markets managed to rebound after Tuesday’s sell-off, but the bounce—despite attracting attention—fell short of fully recouping the earlier losses. More importantly, a significant “bull trap” remains in place for the S&P 500. Technical signals for the index continue to be mixed, with momentum indicators such as stochastics failing to move back into overbought territory—a key condition needed to support a sustained rally.
Bitcoin faces more significant challenges. Yesterday’s rise alone is far from sufficient to undo what was beginning to resemble the formation of a right-hand base. That said, this still appears to be the early stages of building a new base and could represent an attractive buying opportunity for investors willing to hold through what may be a year-long process, potentially targeting a move toward $125K. For now, technical indicators remain net bearish, and a break below $85K would invalidate any bullish outlook.
The Nasdaq has mounted a counter-trend bounce following the breakdown, but the symmetrical triangle pattern has already resolved, meaning attention now shifts to identifying new support and resistance levels. There is still a potential bullish scenario if price action evolves into a bullish ascending triangle.
On the other hand, the Russell 2000 shows the potential to form a bearish “evening star” pattern, though this would require a gap lower today. Setting that possibility aside, the index remains firmly in rally mode and is far from any “bull trap” conditions. Overall, technical indicators are net bullish.
For today, bulls may want to focus on Bitcoin, while bears should monitor the Russell 2000 for signs that a bearish “evening star” pattern could emerge.
Bank of Japan (BoJ) Governor Kazuo Ueda is speaking at a press conference, outlining the rationale for keeping the benchmark interest rate unchanged at 0.75% at the January policy meeting.
Key takeaways from the BoJ press conference
Japan’s economy is showing a moderate recovery and is expected to continue growing at a steady pace.
The government’s economic stimulus package has improved the overall outlook.
Underlying inflation is projected to rise gradually and move closer to the 2% target.
Board members Takata and Tamura suggested revisions to the outlook report.
The BoJ will continue to raise interest rates if economic and price projections are realized.
Lending rates tied to the BoJ’s policy rate are already trending higher.
Financial conditions remain accommodative despite the December rate hike.
Foreign exchange movements are influenced by multiple factors.
The governor refrained from commenting on specific yen levels but emphasized close monitoring of FX developments.
Government bond yields are increasing at a rapid pace.
The BoJ stands ready to conduct bond-buying operations flexibly in exceptional circumstances.
Measures may be taken to support stable yield formation when necessary.
Currency movements, particularly the yen, may be having a stronger impact on prices.
Greater attention will be paid to foreign exchange trends going forward.
The rise in long-term yields is partly influenced by end-of-fiscal-year factors.
Price developments in April will be an important consideration when assessing the timing of future rate hikes.
The section below was published at 3:35 GMT on January 23 to cover the Bank of Japan’s monetary policy announcement and the initial market reaction.
The Bank of Japan (BoJ) board voted to keep the short-term policy rate unchanged at 0.75% at the conclusion of its two-day monetary policy meeting on Friday, a move that was widely expected.
As a result, borrowing costs remain at their highest level in roughly three decades.
Key takeaways from the BoJ’s policy statement
Japan’s economy is expected to continue a moderate recovery.
Consumer inflation is likely to pick up gradually.
The virtuous cycle in which wage growth and inflation reinforce each other is expected to be sustained.
The output gap is projected to improve over time and expand at a moderate pace.
Medium- to long-term inflation expectations are seen rising gradually.
No major imbalances are observed in Japan’s financial activity.
The overall financial system remains stable.
Firms’ moves to pass higher wages on to selling prices could strengthen more than previously anticipated.
The recent increase in food prices, including rice, mainly reflects temporary supply-side factors.
Significant uncertainty surrounds the global economic outlook, particularly due to trade policies that could push up import prices through supply-side channels.
Trade measures announced so far may weigh on global economic growth.
Regarding the US economy, close attention is needed on how tariffs could affect employment and income via weaker corporate profits.
High uncertainty persists around China’s economic outlook, especially the future pace of growth.
A sharp rise in import prices could further reinforce households’ cautious stance on spending.
Current trade policies could lead to a shift in the long-term trend of globalisation.
The Board raised its median real GDP growth forecast for fiscal 2025 to +0.9% from +0.7% in October.
The fiscal 2026 median growth forecast was revised up to +1.0% from +0.7%.
The fiscal 2027 median growth forecast was lowered to +0.8% from +1.0%.
BoJ’s Quarterly Outlook Report: Key Highlights
The Board kept its median core consumer price index forecast for fiscal 2025 unchanged at +2.7%, the same as in October.
The median real GDP growth forecast for fiscal 2025 was revised up to +0.9% from +0.7% in October.
Real interest rates remain at significantly low levels.
Risks to the economic outlook are assessed as roughly balanced.
The impact of foreign exchange volatility on prices has become more pronounced than in the past, as firms are more willing to raise prices and wages.
Core consumer inflation is expected to slow to below 2% during the first half of this year.
Companies’ efforts to pass higher wages on to selling prices could strengthen more than anticipated.
Japan’s economy is projected to continue a moderate recovery.
Market reaction following the BoJ policy announcements
USD/JPY climbed further toward 158.60 in an immediate reaction to the Bank of Japan’s (BoJ) decision to keep interest rates unchanged, rising 0.11% on the day.
The section below was published at 23:00 GMT on January 22 as a preview of the Bank of Japan’s interest rate decision.
The Bank of Japan is widely expected to leave interest rates unchanged at 0.75% on Friday.
The central bank is likely to wait and assess the effects of December’s rate hike before considering further tightening.
February’s general elections introduce an additional layer of uncertainty to the BoJ’s monetary policy outlook.
The Bank of Japan (BoJ) is widely expected to keep its benchmark interest rate unchanged at 0.75% following the conclusion of its two-day monetary policy meeting next Friday.
The Japanese central bank raised interest rates to their highest level in three decades in December and is now likely to keep policy unchanged on Friday to better evaluate the economic impact of earlier hikes.
BoJ Governor Kazuo Ueda is expected to reaffirm the bank’s commitment to continued policy normalisation. As a result, investors will closely scrutinise his press conference for clues on the timing and extent of the next phase of the tightening cycle.
What to anticipate from the Bank of Japan’s interest rate decision?
The Bank of Japan is broadly expected to leave interest rates unchanged in January while signaling the possibility of further tightening if economic conditions unfold as projected.
In December, the BoJ raised rates by 25 basis points to 0.75%, and the meeting minutes showed that some policymakers favor additional tightening, noting that real interest rates remain sharply negative once inflation is taken into account.
Markets, however, have ruled out consecutive rate hikes, especially following Prime Minister Sanae Takaichi’s surprise call for snap elections and her proposal to suspend food and beverage taxes for two years to ease the burden on households amid rising inflation.
While the implications of these political developments for monetary policy remain uncertain, the BoJ has emphasized a cautious, gradual normalization of policy, aiming to withdraw stimulus without undermining economic growth. As a result, the central bank is likely to wait for greater political clarity and for the effects of past rate increases to become clearer before moving again.
Meanwhile, the yen has weakened steadily amid speculation surrounding the snap election. This raises the question of whether the currency’s depreciation will push the BoJ to adopt a firmer stance on monetary tightening.
How might the Bank of Japan’s monetary policy decision influence the USD/JPY exchange rate?
Markets have fully priced in a Bank of Japan rate pause on Friday, but the central bank will need to clearly signal further monetary tightening to curb the Yen’s ongoing weakness.
Yen sellers have eased off in recent days, helped by broad US Dollar softness linked to the EU–US trade dispute following President Donald Trump’s threats over Greenland. Even so, USD/JPY is still up roughly 0.7% year to date and remains close to last week’s 18-month peak around 159.50.
Investors are also concerned that Prime Minister Takaichi could secure stronger parliamentary backing after the elections, allowing her to push ahead with expansionary fiscal policies such as higher spending and tax cuts. This has heightened worries about Japan’s already stretched public finances, driving the Yen lower and pushing long-term government bond yields to record highs amid fears of a potential fiscal crisis.
Meanwhile, recent remarks from BoJ Governor Ueda have reinforced the bank’s cautious tightening stance, suggesting Japan is transitioning toward a more sustainable inflation environment where wages and prices rise together. For the Yen’s recent, still-fragile rebound to continue, markets will need clearer evidence that interest rate hikes are on the horizon.
USD/JPY 4-Hour Chart
From a technical standpoint, FXStreet analyst Guillermo Alcalá views USD/JPY as undergoing a bearish correction, with an important support zone just above 157.40. He notes that while the pair has pulled back from recent highs, Yen buyers would need to push it below the 157.40–157.60 support area to invalidate the short-term bullish structure and open the door to a move toward the early-January lows near 156.20.
A cautious or non-committal message from the BoJ would likely disappoint markets and weaken the Yen. In that scenario, Alcalá expects USD/JPY to climb to new long-term highs. He points out that technical signals are improving, with the 4-hour RSI rebounding from the 50 level, indicating strengthening bullish momentum. At the time of writing, the pair is challenging resistance around 158.70 (the January 16 high), which stands as the final hurdle before the 18-month peak close to 159.50.
This is shaping up to be a highly unpredictable week for U.S. and global markets, with numerous wildcard risks—largely tied to developments from the White House.
Investors will be closely watching for any developments related to the Justice Department’s investigation into Federal Reserve Chair Jerome Powell. Attention will also turn to the Supreme Court on Wednesday, when it hears arguments concerning President Trump’s attempt to remove Fed Governor Lisa Cook.
Trade policy remains a major wildcard, with tariff headlines likely to emerge rapidly after Trump threatened over the weekend to impose a new 10% levy on imports from eight European countries opposing his push on Greenland. The Supreme Court could also rule this week on the legality of Trump’s tariffs. Meanwhile, fresh rhetoric around Iran, renewed intrigue involving Venezuela, or actions targeting other geopolitical flashpoints could further unsettle markets.
In Japan, the Bank of Japan is widely expected to keep interest rates unchanged on Friday. However, a weakening yen has revived speculation about possible intervention, leaving the future of the massive yen carry trade hanging in the balance. In China, fourth-quarter GDP growth slowed amid the ongoing property downturn, potentially prompting a policy response.
All of this sets the stage for a busy week in Davos, where global leaders and policymakers are gathering, with President Trump scheduled to address the forum.
In the United States, a slate of economic data will keep both investors and Federal Reserve officials engaged during the holiday-shortened week. A revision to third-quarter GDP could clarify whether the initially reported 4.3% growth overstated the economy’s strength or accurately reflected underlying momentum.
Below are the key data releases this week that are most likely to shape the FOMC’s outlook ahead of its January 27–28 policy meeting.
GDP Update: Growth Momentum in Focus
Overall data indicate the economy stayed resilient through the final three quarters of 2025. Despite a notable slowdown in employment growth, household demand exceeded expectations, while AI-related capital investment surged. Although a modest upward or downward revision to Q3 real GDP (Thursday) is possible, Q4 real GDP is currently tracking at a strong 5.3% annualized pace (see chart).
Personal income, consumption, and saving
Personal income data for October and November (Thu) may reinforce the view that real disposable income growth has stalled. This likely reflects demographic effects, as retiring Baby Boomers exit the labor force and no longer generate wage income. If consumer spending remains resilient, it would suggest households—particularly retirees—are increasingly drawing on retirement savings.
The personal saving rate (Thu) is likely to continue declining under our framework, particularly if household net worth keeps rising to record levels relative to disposable income (chart).
PCE inflation
The Bureau of Economic Analysis will calculate October PCE inflation (Thu) using the average of September and November CPI data. Meanwhile, the Cleveland Fed’s Inflation Nowcasting model projects headline and core PCE inflation at 2.65% y/y and 2.70% in November (chart).
Unemployment claims
Initial jobless claims (Thu) have declined in recent weeks, indicating that January’s unemployment rate likely edged lower from December’s 4.4% (chart).
Silver remains in a high-momentum price-discovery phase, holding above the Daily VCPMI mean in the upper $89–$90 area, signaling sustained bullish momentum across both short- and intermediate-term timeframes.
The current structure points to strong participation on corrective pullbacks, increasing the likelihood that dips remain brief as buyers continue to defend the Daily Buy 1 and Weekly VCPMI support zones between $85 and $87.
From a time-cycle standpoint, the dominant 30-, 60-, and 90-day harmonic cycles remain in alignment with the broader expansion phase that began in early Q4. The market is now entering a near-term inflection window projected for January 18–20, a period that historically aligns with volatility compression and subsequent directional resolution. Should price sustain closes above the Daily Sell 1 level, the probability outlook shifts toward trend continuation, with upside targets extending to the Weekly Sell 1 and Weekly Sell 2 zones.
Square of 9 price geometry identifies $93.75, $94.80, and $95.40 as key harmonic resistance levels—rotational nodes where trend acceleration or rejection is most likely to occur. A sustained acceptance above this zone would open the technical pathway toward the $98–$101 range, aligning with the upper Weekly Sell 2 projection and longer-term cycle expansion targets.
Conversely, failure to rotate higher through this resistance band would favor a mean-reversion move back toward the Daily VCPMI mean and the Weekly Buy 1 support zone near $81–$83.
From a structural perspective, silver’s resilience amid elevated volatility and margin pressure continues to validate a supported trend environment, with accumulation behavior dominating corrective phases. Rising open interest and consistent closes above the Weekly VCPMI further support the view that the broader market remains positioned for higher price discovery rather than distribution.
Looking ahead, the secondary momentum window from January 27–30 marks the next key timing convergence, where the interplay between Square of 9 resistance and cyclical factors could drive either a decisive breakout or a rotational pullback.
Traders applying the VC PMI framework should maintain discipline, executing systematically at predefined probability levels while separating emotional bias from structured risk and money management.
Pi Network rebounded about 1% on Tuesday from a key support level after falling roughly 4% on Monday.
Data from PiScan showed more than 4 million PI tokens were withdrawn over the past 24 hours, signaling retail efforts to hedge against further downside.
From a technical perspective, PI remains under heavy selling pressure, with momentum turning bearish and leaving the token vulnerable to additional losses.
Pi Network (PI) was up about 1% at press time on Tuesday, marking a modest rebound after hitting a new record low of $0.1502 on Monday. Over the past 24 hours, mainnet holders have withdrawn more than 4 million PI tokens from centralized exchanges that support Pi Network. Despite the slight recovery, the technical outlook for PI remains bearish, with momentum indicators pointing to sustained selling pressure.
Retail buying limits further downside
PiScan data shows that centralized exchange reserves fell by 4.24 million PI tokens over the past 24 hours, signaling substantial withdrawals. This points to strong buying interest, which helped cap losses and secure a daily close above $0.1900. A continued decline in exchange reserves could ease supply pressure and raise the chances of a rebound in PI.
Technical outlook: Is PI at risk of further downside?
Pi Network was holding above the $0.1900 level at the time of writing on Tuesday, roughly 30% above Monday’s low of $0.1502. The rebound coincided with sizable exchange withdrawals and helped prevent a breakdown below the $0.1919 support level.
However, the downward-sloping 20-day and 50-day Exponential Moving Averages (EMAs) continue to point to a prevailing downtrend.
Momentum indicators on the daily chart remain decisively bearish. The Moving Average Convergence Divergence (MACD) has turned lower from the zero line, crossing below the signal line with an expanding negative histogram. Meanwhile, the Relative Strength Index (RSI) sits near 30, hovering around oversold territory and reflecting the recent selloff.
A daily close below $0.1919 could deepen the bearish trend, exposing downside targets at the S1 and S2 Pivot Points of $0.1835 and $0.1632, respectively.
PI/USDT daily price chart.
Any rebound in PI is likely to encounter resistance at the falling 20-day and 50-day EMAs, currently at $0.2045 and $0.2116, respectively.
Jerome Powell’s eight-year leadership at the Federal Reserve is ending amid significant challenges for the U.S. central bank and divided opinions among policymakers about the right approach to monetary policy. So, what might Powell’s last moves as Chair look like in this environment?
The labor market is still slightly weaker than full employment. Private sector job growth has stalled recently, and although the unemployment rate dropped a bit in December, it remains above what most economists consider the long-term natural rate.
On the inflation front, recent data are more promising. Core CPI inflation fell to 2.6% year-over-year in December from 3.1% in August. Some temporary shutdown effects may be lowering this figure by about 0.1 percentage points, and the Fed’s preferred inflation gauge, the PCE deflator, likely hasn’t improved as much. However, the overall trend for core inflation entering 2026 is clearly downward.
Given this, the Federal Open Market Committee (FOMC) likely has room to continue guiding the federal funds rate toward a neutral level in the near term. The forecast remains two quarter-point rate cuts in March and June, with the rate then holding steady at 3.00%-3.25%.
However, the opportunity for further rate reductions is narrowing. Fiscal stimulus from the recent One Big Beautiful Bill Act is expected to start boosting the economy by spring or summer. Additionally, tariff risks seem to be declining, which could also spur faster growth later in the year. The recent 75 basis points of rate cuts over the past three months will likely provide some support as well.
If labor market and inflation indicators show signs of overheating in the coming months, Powell and the FOMC might opt to pause policy adjustments and leave things steady for the next Chair. This successor could face skepticism from a committee under pressure from the Trump administration. The expectation of stronger economic growth in spring and summer further supports holding rates steady.
For now, the current forecast stands, but there is growing risk that rate cuts may be delayed or reduced compared to the baseline prediction.
After reaching record highs and recording its largest four-day gain since 2008, silver’s momentum has sharply reversed. The price broke through its uptrend support from January 9, signaling a potential deeper correction.
Despite strong macroeconomic tailwinds, selling pressure has intensified, likely fueled by heavy retail trader activity, which has contributed to significant volatility.
The break of the uptrend was confirmed by a three-candle bearish reversal pattern on the hourly charts and bearish divergence in the RSI (14) indicator.
Following the trend break, silver’s price dropped sharply to a support level at $86.24 before rebounding toward $89.15. This price range has been a key area of activity recently and will be important for traders monitoring short-term movements.
If the bullish trend has ended and the price fails to climb back above $89.15 to rejoin the uptrend, traders might consider opening short positions just below this level with a tight stop-loss above it for protection. The initial target would be support at $89.24.
Should this support break, key downside levels to watch are $84.60, $83.67, and $82.76, all of which previously acted as short-term support or resistance during the upward move. Further declines could target $80.50 and $79 if the sell-off gains momentum.
However, as has often been the case with silver breakouts, bearish moves tend to be short-lived, so a strong wave of dip-buying remains possible. If buyers push the price back above $89.15, it could trigger new long positions aiming first for the previous uptrend level, followed by targets at $92 and the record high of $93.61.
While I don’t put much emphasis on the mixed signals from the RSI (14) and MACD regarding the short-term direction, the bearish divergence between RSI and price before the drop did offer an early warning that the bullish momentum was weakening. This is an important factor to consider regardless of silver’s next move.
USD/CHF declines as the Swiss franc benefits from increased safe-haven demand.
President Trump stated that Iran has expressed interest in negotiations following his military warnings, though he cautioned that action might occur prior to any talks.
Safe-haven demand intensifies amid growing concerns over the Federal Reserve’s independence.
USD/CHF declined for the second consecutive day, trading near 0.7970 during Tuesday’s Asian session. The pair weakened as the Swiss Franc gained support from safe-haven demand driven by geopolitical tensions and worries over the Federal Reserve’s independence.
On Sunday, U.S. President Donald Trump stated that Iran’s leadership had contacted him to seek negotiations following his military threats amid ongoing anti-government protests in the country. However, Trump cautioned that action might be taken before any formal meeting occurs.
Safe-haven demand has risen amid growing concerns over the Federal Reserve’s independence after federal prosecutors threatened to indict Chair Jerome Powell regarding his congressional testimony on a building renovation—an action Powell called an attempt to undermine the central bank’s autonomy.
However, downside pressure on the USD/CHF pair may be limited as the US Dollar maintains strength ahead of the December Consumer Price Index (CPI) release later in the day, which could provide new insights into the Fed’s policy direction.
Markets currently expect two rate cuts from the Federal Reserve this year, beginning in June, though a stronger-than-expected inflation report could reduce the likelihood of easing. December’s Nonfarm Payrolls (NFP) came in below expectations, supporting a more dovish Fed stance. According to the CME Group’s FedWatch tool, there is a 95% chance that the Fed will keep interest rates unchanged at its January 27–28 meeting based on fed funds futures pricing.
If economists were meteorologists, this week’s forecast would predict a data blizzard. However, clarity is expected to improve as markets receive highly anticipated reports on inflation, retail sales, and industrial production ahead of the Federal Reserve’s policy meeting on January 28.
Few economists expect Fed Chair Jerome Powell and the Federal Open Market Committee (FOMC) to ease monetary policy again later this month—and neither do we. This week’s data could either confirm or challenge that view, starting with the December consumer price index report on Tuesday.
The Fed drama intensified last week after President Donald Trump instructed Fannie Mae and Freddie Mac to purchase $200 billion in mortgage bonds—an action typically undertaken by the Fed itself. Many saw this move as an attempt to restart quantitative easing. Meanwhile, Fed Governor Stephen Miran told Bloomberg he anticipates 150 basis points of rate cuts this year.
What’s still missing, however, is significantly lower inflation and a recession that would justify such aggressive easing. This week will also feature speeches from several Fed officials, which could provide insight into the central bank’s thinking. The lineup starts with New York Fed President John Williams on Monday, followed by Governors Miran (Wednesday), Michael Barr (Thursday), Michelle Bowman (Friday), and Vice Chair Philip Jefferson (Friday).
Here’s a rundown of this week’s key data releases likely to influence the timing and scale of any future Fed rate cuts:
Inflation
Since the 43-day government shutdown in October and November, investors have struggled to gauge inflation accurately. The 2.7% year-over-year CPI rise in November, a slight dip from October’s 3.0%, was met with caution, as the shutdown likely disrupted the Bureau of Labor Statistics’ data gathering.
This increases the importance of the upcoming CPI and PPI reports, which will be key indicators before the FOMC’s January 28 interest rate decision.
The upcoming CPI report on Tuesday is expected to show a modest easing in inflation, with the Cleveland Fed’s model forecasting a 0.2% monthly increase and 2.6% year-over-year growth. The November PPI report, due Wednesday, is considered less impactful, while import and export price data for November will be released on Thursday.
Retail sales
Retail sales (Wednesday) are expected to show a slight increase in November after remaining flat in October (see chart). Overall, we believe consumer spending remains resilient despite rising living costs and soft employment figures. Additional important demand indicators this week include December existing home sales (Wednesday) and mortgage applications for the week ending January 9 (Wednesday).
Jobless claims
We anticipate layoffs will stay minimal, which has been the key insight from recent initial unemployment claims data (Thursday) (see chart). While demand for labor may be slowing in certain sectors, the feared AI-driven collapse in the job market has not materialized yet.
Composite economic indicators & business surveys
The composite cyclical indicators for December, due Thursday, are expected to show the coincident index holding at a record high, while the (mis)leading index continues its decline. Additionally, given delays in official hard data, the National Federation of Independent Business’ Small Business Optimism Index for December (Tuesday) should provide valuable insights, following its rise to 99 in November. Later in the week, the Federal Reserve banks of New York and Philadelphia will release their January business surveys (Thursday).
Our preferred coincident indicator is the S&P 500 forward earnings per share, which has accelerated in recent weeks and hit record highs (see chart).
The Australian Dollar ended its three-day slide on Monday.
ANZ reported a 0.5% decline in job advertisements for December, following a revised 1.5% drop in the previous month.
Meanwhile, the US Dollar weakened after federal prosecutors launched a criminal investigation into Federal Reserve Chair Jerome Powell.
The Australian Dollar (AUD) gained ground against the US Dollar (USD) on Monday, reversing a three-day losing streak. The AUD/USD pair rose as the Greenback weakened, partly due to growing concerns about the Federal Reserve.
Federal prosecutors have launched a criminal investigation into Fed Chair Jerome Powell, focusing on the central bank’s renovation of its Washington headquarters and allegations that Powell may have misled Congress about the project’s details, according to a New York Times report on Sunday.
ANZ Job Advertisements fell by 0.5% in December, following a revised 1.5% decline in November. Meanwhile, household spending rose 1.0% month-on-month in November 2025, slowing from a revised 1.4% increase in October, reflecting consumer caution amid high interest rates and ongoing inflation.
Australia’s mixed Consumer Price Index (CPI) report for November has left the Reserve Bank of Australia’s (RBA) policy direction uncertain. However, RBA Deputy Governor Andrew Hauser stated that the inflation data largely met expectations and indicated that interest rate cuts are unlikely in the near term. Attention now turns to the quarterly CPI report due later this month for clearer insight into the RBA’s upcoming policy decisions.
US Dollar Slides Amid Federal Reserve Uncertainty
The US Dollar Index (DXY), which tracks the Dollar against six major currencies, is weakening and trading near 98.90 amid expectations of a dovish Federal Reserve. Slower-than-anticipated US job growth in December suggests the Fed may keep interest rates steady at its upcoming January meeting.
US Nonfarm Payrolls increased by 50,000 in December, below November’s revised 56,000 and the expected 60,000. Meanwhile, the unemployment rate fell to 4.4% from 4.6%, and average hourly earnings rose to 3.8% year-over-year from 3.6%.
CME Group’s FedWatch tool shows about a 95% chance that the Fed will hold rates steady on January 27–28. Richmond Fed President Tom Barkin welcomed the unemployment drop, describing job growth as modest but steady. He noted hiring remains limited outside healthcare and AI sectors and expressed uncertainty about whether the labor market will see more hiring or layoffs going forward.
US Treasury Secretary Scott Bessent told CNBC on Thursday that the Federal Reserve should continue cutting interest rates, emphasizing that lower rates are the “only ingredient missing” for stronger economic growth and urging the Fed not to delay.
The US Department of Labor reported that Initial Jobless Claims rose slightly to 208,000 for the week ending January 3, just below expectations of 210,000 but above the previous week’s revised 200,000. Continuing claims increased to 1.914 million from 1.858 million, signaling a gradual rise in those receiving unemployment benefits.
The Institute for Supply Management (ISM) revealed that the US Services PMI climbed to 54.4 in December from 52.6 in November, surpassing expectations of 52.3.
ADP data showed a gain of 41,000 jobs in December, improving from a revised 29,000 job loss in November, though slightly below the expected 47,000. Meanwhile, JOLTS job openings dropped to 7.146 million in November from a revised 7.449 million in October, missing forecasts of 7.6 million.
China’s Consumer Price Index (CPI) increased by 0.8% year-over-year in December, up from 0.7% in November but slightly below the 0.9% forecast. On a monthly basis, CPI rose 0.2%, reversing November’s 0.1% decline. Meanwhile, China’s Producer Price Index (PPI) fell 1.9% year-over-year in December, improving from a 2.2% drop the previous month and slightly beating expectations of a 2.0% decline.
Australia’s trade surplus narrowed to 2.936 billion AUD in November, down from a revised 4.353 billion AUD in October. Exports declined 2.9% month-on-month in November, following a revised 2.8% increase the previous month. Imports edged up 0.2% in November, slowing from a revised 2.4% gain in October.
AUD rebounds, testing upper boundary of rising channel around 0.6700
On Monday, AUD/USD trades near 0.6700 as the pair attempts a rebound toward an ascending channel, indicating a renewed bullish outlook. The 14-day RSI at 58.33 remains above the neutral midpoint, supporting upward momentum.
A sustained move back into the channel would reinforce the bullish trend, potentially pushing the pair toward 0.6766—the highest level since October 2024. Further upside could target the channel’s upper resistance near 0.6860.
Immediate support is found at the nine-day EMA around 0.6700, followed by the 50-day EMA at 0.6631. A break below these levels could open the path to 0.6414, the lowest point since June 2025.
GBP/USD inched up to around 1.3430 during Monday’s early European session.
The market remains cautious as federal prosecutors launch a criminal investigation into Fed Chair Powell.
With the RSI lingering near the midline, further consolidation is possible in the short term.
Key support to watch is at 1.3358, while immediate resistance is seen near 1.3458.
The GBP/USD pair found some buying interest around 1.3430 during Monday’s early European trading session. The US Dollar weakened against the British Pound following Federal Reserve Chair Jerome Powell’s revelation that President Donald Trump threatened him with a criminal indictment, sparking concerns about the Fed’s independence.
The US Justice Department issued subpoenas and threatened criminal charges linked to Powell’s Senate testimony regarding renovations at Federal Reserve buildings. Powell described the investigation as “unprecedented” and suggested it was motivated by Trump’s frustration over his refusal to lower interest rates despite the president’s repeated public pressure.
Ray Attrill, head of currency strategy at National Australia Bank, commented, “This open conflict between the Fed and the U.S. administration clearly doesn’t bode well for the U.S. dollar.”
Traders will be paying close attention to UK jobs data due Tuesday, as the results could provide insights into market expectations for the Bank of England’s monetary policy. Weaker-than-expected figures might put short-term pressure on the British Pound (Cable).
GBP/USD Technical Analysis
On the daily chart, the 100-day EMA is trending upward, offering support at 1.3358, with the price maintaining above this key moving average to sustain the broader bullish outlook. The RSI at 51.90 is neutral but trending slightly higher, indicating momentum is stabilizing following a recent pullback. Holding above the EMA could set the stage for a retest of resistance at 1.3458, preserving the recovery trend.
The price currently trades just below the Bollinger Bands’ middle line at 1.3458, with the bands narrowing, signaling lower volatility and a consolidation phase. The RSI near 52 confirms a range-bound environment. A decisive move above the mid-band would increase upward momentum, potentially targeting the upper band at 1.3552. Conversely, a drop toward 1.3365 would bring the lower band into focus, risking a deeper correction.
USD/CAD pulls back toward 1.3890 following an unsuccessful attempt to continue its nine-day rally.
Criminal indictment threats against Fed Chair Powell have put pressure on the US Dollar.
An increasing unemployment rate in Canada is expected to weigh on the Canadian Dollar.
The USD/CAD pair declined on Monday, ending its nine-day winning streak, and corrected to around 1.3890 as the US Dollar retraced following criminal charges against Federal Reserve Chair Jerome Powell.
At the time of reporting, the US Dollar Index (DXY), which measures the Greenback against six major currencies, was down 0.22% to approximately 98.90, retreating from a fresh monthly high of about 99.26 reached last Friday.
On Friday, the U.S. Department of Justice issued a subpoena to the Federal Reserve concerning Chair Jerome Powell’s Senate testimony last June, which involved a multiyear renovation project of historic buildings with an estimated cost of $2.5 billion.
Powell responded by stating that the charges are not related to his testimony or the renovation project, but rather serve as a pretext.
Meanwhile, the Canadian Dollar (CAD) remains under pressure as the unemployment rate rose to 6.8%, exceeding estimates of 6.6% and the previous 6.5% reading. The higher jobless rate may increase expectations that the Bank of Canada (BoC) will soon resume monetary easing.
USD/CAD technical analysis
USD/CAD is trading lower around 1.3890 on Monday. The 20-day Exponential Moving Average (EMA) has started to rise, currently at 1.3806, with the price holding above this level, supporting a short-term recovery outlook.
The 14-day Relative Strength Index (RSI) stands at 61, indicating solid positive momentum after bouncing back from oversold levels.
Measured from the recent high of 1.4140 to the low at 1.3643, the 50% Fibonacci retracement at 1.3891 serves as immediate resistance. Above this, the 61.8% retracement near 1.3950 may cap further upward movement. If the pair fails to break through these resistance levels, the recovery could remain limited, with pullbacks likely to find initial support at the rising 20-day EMA around 1.3806.
Last year was another strong period for the world’s top technology firms, known as the Magnificent 7. While artificial intelligence clearly provided a boost, these companies’ core business performance remained robust even without AI-driven growth, continuing to deliver steady revenue increases and strengthening competitive advantages that few rivals can match. They remain central to some of the most powerful and lasting secular trends shaping the global economy. This strong foundation persists as we enter 2026, though individual positioning within the group has started to vary.
Interestingly, Meta Platforms (META) and Amazon (AMZN)—which were the two weakest performers in 2025—now appear to be among the best positioned for gains in the coming year, along with Alphabet (GOOGL). This doesn’t rule out further upside potential for the rest of the group, but it does indicate a shift in relative opportunities. Below, I detail the changing dynamics for each of the Magnificent 7 and share insights on how to approach trading them in 2026.
Amazon, Meta Platforms, and Alphabet Stocks Take Center Stage
After trailing the broader group in 2025, Amazon and Meta Platforms seem poised for a strong recovery in the coming year. Both companies continue to show steady revenue and earnings growth, but their stock prices have lagged, resulting in some of the most attractive valuations seen in years. Meta is currently trading at about 21.9 times forward earnings, while Amazon is around 30.7 times—both significantly below their historical averages. According to analyst ratings, Meta holds a Zacks Rank of #3 (Hold), indicating stable earnings revisions, whereas Amazon has a more favorable Zacks Rank of #2 (Buy).
Technical indicators also favor both Meta and Amazon. Meta’s shares have been trading within a narrow range recently, a pattern that often signals an impending breakout. Amazon shows a similar pattern but has already begun to move upward, breaking out on strong volume just yesterday.
From a fundamental perspective, both companies have strong bullish catalysts. Amazon is actively pursuing various AI-driven growth opportunities, particularly through AWS, where demand for cloud computing services remains strong. Meta has been one of the most effective users of AI in its advertising platform, converting technological advances into better monetization and higher margins. Additionally, Meta’s recent acquisition of Manus AI, though relatively low-profile, could be strategically important. Manus stands out among large language model (LLM) applications for its sophistication and may help Meta reestablish itself as a serious competitor in consumer-facing AI, an area where it has previously fallen behind.
In contrast, Alphabet was the best performer in the group last year as the market finally recognized its AI strengths. Its large language model is among the industry’s top, and its vertically integrated hardware ecosystem—centered on proprietary TPUs—provides a strong and unique competitive edge. Alphabet’s shares are now emerging from their own consolidation phase, indicating potential for further gains.
Together, these three companies present a well-rounded investment opportunity: two former laggards with improving technical and valuation setups, and one established leader continuing to deliver. In all cases, AI acts as a powerful catalyst, but not the sole basis for investment.
Nvidia and Microsoft Continue to Show Strong Potential
Microsoft (MSFT), a dominant force in global technology, has experienced a pause in its share price momentum in recent months, with little sustained progress since early summer and a slight decline during the fourth quarter. However, this consolidation seems to be settling. The stock has consistently tested a critical support level but has yet to break significantly below it, indicating that downward pressure may be easing.
On the fundamentals side, Microsoft’s outlook is strengthening. Earnings estimates have seen modest upward revisions, contributing to a Zacks Rank of #2 (Buy) for the stock. As long as the shares remain above the key support level around $470, the risk-to-reward ratio looks increasingly favorable.
Nvidia (NVDA) currently holds a Zacks Rank of #1 (Strong Buy), reflecting unanimous upward revisions to earnings estimates across various time frames. In just the past 60 days, analysts have increased next year’s EPS forecasts by about 16%, signaling continued positive surprises in its fundamentals.
The company’s valuation remains attractive relative to its growth prospects. Nvidia trades at roughly 40.1 times forward earnings, while its long-term EPS is expected to grow at an annualized rate of around 46% over the next three to five years. This results in a PEG ratio below 1—a rare and favorable setup for a company of this size.
Importantly, Nvidia is actively advancing despite its dominant position in the AI market. It is investing heavily across the entire AI technology stack, with a growing focus on next-generation architectures and inference optimization, which is set to become an increasingly lucrative area as AI workloads expand. This strategy was further supported by Nvidia’s recent acquisition and partnership with chip startup Groq, enhancing its capabilities in low-latency inference and performance-optimized chip design ahead of the upcoming Rubin architecture. These moves keep Nvidia firmly on investors’ radar.
Apple and Tesla Stocks Experience a Downward Trend
Although both Apple (AAPL) and Tesla (TSLA) experienced rallies late last year, their price trends remain concerning as we head into 2026. They are currently the only two stocks among the Magnificent 7 clearly trading in sustained downtrends, highlighting a shift in leadership within the group.
Tesla’s story remains ambitious, with Elon Musk emphasizing long-term prospects like autonomous driving and humanoid robots. However, investors are now focused more on near-term fundamentals, which have weakened. Tesla’s top-line growth has stalled since 2023, and its market share declined after being overtaken by BYD as the world’s largest EV producer last year. So far, there’s little sign of a meaningful rebound in vehicle demand.
Valuation also poses a major challenge for Tesla. It currently trades at over 200 times forward earnings and about 13 times forward sales—levels that surpass most high-growth, high-margin software firms. While Tesla has historically commanded premium valuations, slowing growth and changing market sentiment increase the risk of downside in the near to medium term.
Apple, on the other hand, doesn’t face the same fundamental risks but appears less attractive compared to its peers. The company has taken a cautious approach in the AI race, choosing not to match competitors’ aggressive infrastructure investments. Although this initially hurt sentiment amid fears Apple might fall behind, this strategy has proven more justifiable over time. Apple remains the world’s leading platform for mobile computing and consumer devices, positioning it as a key distribution channel for AI-powered applications in the future. Nevertheless, with fewer immediate catalysts and weaker momentum, Apple currently lags behind other Magnificent 7 stocks from a trading standpoint.
How Investors Can Position Themselves Within the Magnificent 7
As we enter 2026, the Magnificent 7 continue to present a wide range of opportunities. Variations in earnings momentum, technical trends, and near-term catalysts offer multiple ways for investors to engage—whether by riding the momentum of leaders or capitalizing on laggards poised for a rebound.
For investors, the key is to focus on areas where strong fundamentals align with positive price action. When approached thoughtfully, the Magnificent 7 should remain a central source of opportunity throughout 2026, not only as a group but also through the unique trajectories each company follows as the market cycle progresses.
Semiconductor Stocks to Consider Beyond Nvidia
The soaring demand for data is driving the next digital gold rush in the market. As data centers keep expanding and upgrading, the hardware suppliers behind these giants are set to become the NVIDIAs of the future.
One lesser-known chipmaker is uniquely poised to capitalize on this next phase of growth. It focuses on semiconductor products that industry leaders like NVIDIA don’t produce. This company is just starting to gain attention—exactly the kind of opportunity investors want to spot early.
U.S. employment figures reinforce the Federal Reserve’s cautious stance on monetary policy. Meanwhile, Europe’s economic growth remains sluggish, but policymakers appear comfortable with the current pace. As demand for the U.S. Dollar stays strong, the EUR/USD pair has potential to continue its downward move toward the 1.1470 level.
The EUR/USD pair opened the year on a weak note, declining for the second week in a row to hover near 1.1640, marking its lowest level in a month. The US Dollar gained strength across the foreign exchange market, supported by geopolitical tensions and robust US employment figures.
Geopolitical Unrest Drives Financial Markets Early in 2026
On Saturday morning, the world learned that U.S. President Donald Trump had executed a precise military operation in Venezuela, capturing then-President Nicolás Maduro and his wife, Cilia Flores, and transporting them to the United States to face charges related to narco-terrorism. Delcy Rodriguez, Maduro’s Vice-President, has now taken control of Venezuela. Although there was initial criticism of Trump’s actions, Rodriguez quickly shifted her stance and expressed willingness to cooperate with the U.S.
President Donald Trump did not hide his motives for the U.S. military action in Venezuela. At a press conference following the operation that removed Nicolás Maduro from power, Trump said the United States would exercise control over Venezuela and its oil resources and warned of further measures if the Venezuelan government resisted. He described a future “transition” for the country’s governance, but did not outline specific plans for democracy or civilian rule.
In the days after the raid, international tensions gradually eased, but the situation remained unresolved. One clear strategic factor behind the U.S. intervention was limiting Venezuela’s oil ties with major global powers, including Russia and China — a goal linked to broader geopolitical rivalry.
Meanwhile, Russia carried out a significant missile strike on Ukraine early on Friday, shortly after Ukraine and its European partners agreed on elements of postwar security guarantees. The attack was widely interpreted as Russian President Vladimir Putin challenging Western support for Kyiv and signaling that sanctions, including restrictions on Russian oil, would not deter Moscow’s military actions.
In addition, Trump reignited controversy with comments about Greenland, an autonomous territory of Denmark. He argued that the U.S. needs Greenland for national security reasons and suggested Washington might pursue control of the island — a stance that drew criticism from European leaders and sparked fears of future U.S. territorial ambitions.
Europe Maintains Ongoing Stability
News from Europe has had little impact on the Euro (EUR), which is understandable given the Eurozone’s fragile yet steady stability, with ongoing growth, manageable inflation, and no significant employment concerns.
Eurostat reported that the seasonally adjusted unemployment rate in the Euro area stood at 6.3% in November, slightly down from 6.4% in October 2025 but up from 6.2% in November 2024. The broader EU unemployment rate remained stable at 6.0% in November 2025 compared to October, though it rose from 5.8% a year earlier.
The Hamburg Commercial Bank (HCOB) released the final December figures for the Eurozone’s Services and Composite Purchasing Managers’ Indexes (PMIs). The data showed a twelfth consecutive monthly increase in private sector activity, with the Composite PMI at 51.5, down from 52.8 in November. Services output also declined to 52.4 from 53.6, marking three-month lows for both indicators.
Regarding inflation, Germany’s preliminary December Harmonized Index of Consumer Prices (HICP) increased 2% year-over-year, lower than November’s 2.6% and below the 2.2% forecast. Monthly inflation rose by 0.2%, half the expected 0.4%. The Eurozone’s overall HICP inflation matched expectations at 2% annually, with a 0.2% monthly rise following November’s 0.2% decline.
Germany reported mixed figures for November, with retail sales falling 0.6% while industrial production saw a modest 0.8% increase.
On monetary policy, European Central Bank (ECB) Vice President Luis de Guindos told Bloomberg that current interest rates are appropriate as inflation targets have been met, though uncertainty remains high. This aligns with the ECB’s current stance: pausing rate changes while maintaining vigilance.
U.S. Employment and Economic Growth Update
The U.S. macroeconomic calendar was busy with key data mostly signaling progress. The Institute for Supply Management (ISM) reported December Manufacturing PMIs, showing a contraction in manufacturing output as the index fell to 47.9 from 48.2 in November, below expectations of 48.3. However, the Employment Index improved slightly to 44.9 from 44, while the Prices Paid Index remained steady at 58.5. Meanwhile, the Services PMI rose to 54.4 from 52.6, with the employment sub-index increasing to 52 from 48.9 and the Prices Paid Index easing to 64.3 from 65.4.
The trade deficit narrowed sharply to $59.1 billion in October, down from $78.3 billion, reflecting the impact of Trump’s policies.
Employment data was mostly positive. The ADP report showed private sector job growth of 41,000 in December, a bit below the expected 47,000 but an improvement over November’s revised -29,000. The JOLTS report recorded 7.146 million job openings at November’s end, down from 7.449 million in October. Job cuts announced in December dropped 50% from November to 35,553, the lowest monthly total since July 2024.
The December Nonfarm Payrolls (NFP) report showed 50,000 new jobs added, below the 60,000 forecast, while the unemployment rate fell to 4.4%, better than the anticipated 4.5%. November’s payrolls were revised down to 56,000 from 64,000. This data put some short-term pressure on the USD but did not alter the Federal Reserve’s cautious monetary policy.
The Fed cut interest rates by 25 basis points in December as expected, signaling the possibility of one more cut in 2026—less than markets hope but consistent with a cautious stance focused on employment. Market watchers anticipate at least two rate cuts this year, especially with Chairman Jerome Powell’s term ending in May and a likely replacement aligned with Trump’s preference for more aggressive easing. Still, no immediate Fed action is expected in the first meeting of 2026.
What’s coming up next on the agenda?
In the days ahead, attention will turn to U.S. inflation data, with the December Consumer Price Index (CPI) scheduled for release on Tuesday, followed by the Producer Price Index (PPI) for October and November on Wednesday. November Retail Sales data will also be published on Wednesday. These reports are expected to influence the Federal Reserve’s future policy decisions and, consequently, the direction of the U.S. Dollar.
EUR/USD technical analysis
From a technical standpoint, the daily chart shows a bearish outlook for EUR/USD with potential for further decline. The 20-day Simple Moving Average (SMA) is trending downward but still sits above the 100- and 200-day SMAs, indicating weakening short-term momentum. The price remains below the 20-day and 100-day SMAs at 1.1733 and 1.1666 respectively, while the rising 200-day SMA at 1.1571 acts as support. The Momentum indicator has dropped below its midpoint, maintaining strong bearish momentum, and the Relative Strength Index (RSI) is falling toward 36, suggesting lower prices ahead. A close above the 100-day SMA at 1.1666 could relieve some selling pressure and target the 20-day SMA at 1.1733, but failure to break this resistance leaves the pair vulnerable to test the 200-day SMA support at 1.1571.
On a broader scale, the weekly chart also points to continued bearishness. The pair trades beneath the flattened 20-week SMA near 1.1665, with upside limited by this level. The 100- and 200-week SMAs are rising at 1.1085 and 1.0856 but remain far below the current price, so they are less relevant short term. The Momentum indicator on the weekly chart has turned downward but stays within neutral territory, while the RSI is declining around 52.
If the pair falls below the key 1.1600 level, the next significant support lies near 1.1470, a major long-term pivot. Overall, bears will maintain control as long as EUR/USD stays below the 1.1740-1.1750 resistance zone.
Leading indicators suggest this month’s NFP report could exceed expectations, with headline job growth potentially landing in the 80–120K range. Read on for a deeper breakdown.
NFP Highlights
Consensus forecast: +66K jobs, earnings up +0.3% m/m, unemployment rate at 4.5%.
Outlook: Forward-looking data point to a stronger-than-expected result, with payroll gains possibly reaching between 80K and 120K.
Market impact: A positive surprise could allow AUD/USD to continue its rebound toward the mid-0.6600s, or even retest former resistance now acting as support near 0.6600.
Release timing
The December NFP report is scheduled for Friday, January 9, at 8:30 a.m. ET.
NFP Report Expectations
Market participants anticipate the NFP report will show the U.S. economy added around 66K jobs, with average hourly earnings increasing 0.3% month-on-month (3.6% year-on-year) and the U-3 unemployment rate edging lower to 4.5%.
NFP Overview
Economic data releases are gradually normalizing after the U.S. government shutdown disrupted—and in some cases eliminated—Q4 statistics. Ahead of the latest labor market update, economists expect conditions in December to reflect a continued “low hiring, low firing” environment.
As illustrated in the graphic below, traders are largely confident that the Federal Reserve will hold off on further rate cuts this month. Only a significant downturn in the labor market—such as a clear drop in job numbers or unemployment climbing above 4.7%—would likely undermine this confidence.
Consequently, market reactions to the NFP release may be muted, particularly since the anticipated Supreme Court ruling on President Trump’s “emergency” tariffs—due about 90 minutes later—is likely to dominate attention.
Another factor dampening trader response is the long-term decline in survey response rates for the NFP. As the chart below illustrates, the Bureau of Labor Statistics (BLS) has experienced a significant drop in response rates over the past decade, increasing uncertainty around the accuracy of the jobs data compared to previous years.
Looking ahead into 2026 and beyond, readers are advised to approach all survey-based economic data with greater skepticism and to rely on a diverse range of data sources when drawing robust conclusions about the U.S. economy.
Nonfarm Payrolls Outlook
As our regular readers know, we rely on four historically dependable leading indicators to assess each month’s NFP report:
The ISM Services Employment subindex rose to 52.0 from 48.9 last month.
The ISM Manufacturing Employment subindex increased slightly to 44.9 from 44.0.
The ADP Employment report showed 41K jobs added, improving from last month’s -29K but still below economists’ forecast of 49K.
The 4-week moving average of initial unemployment claims dropped to 212K from 217K last month.
Considering these data points and our internal models, the indicators suggest that this month’s NFP report could exceed expectations, with job gains potentially in the 80–120K range. However, a wide margin of uncertainty remains due to declining survey response rates.
That said, month-to-month variations in the NFP report are notoriously unpredictable, so it’s wise not to place too much confidence in any forecast—even ours. As always, other components of the release, such as the closely monitored average hourly earnings and the unemployment rate, will also influence market reactions.
Possible Market Response to NFP
From a technical perspective, the US dollar is trading close to one-month highs against several major currencies but remains near the midpoint of its three-month range, resulting in a balanced risk outlook ahead of the release.
Technical Overview of the US Dollar: AUD/USD Daily Chart
From a technical standpoint, AUD/USD finds itself in a notable position ahead of the jobs report. Earlier this week, the pair reached a 15-month high near 0.6800 but then formed a “Dark Cloud Cover” pattern on Wednesday, indicating an intraday shift from buying to selling pressure. This reversal is further supported by a triple bearish divergence on the 14-day RSI, suggesting waning bullish momentum and reinforcing the possibility of a near-term peak.
Should the jobs data surpass expectations, it may diminish the likelihood of a January Fed rate cut and raise doubts about March, thereby strengthening the US dollar. In that case, AUD/USD could continue its decline toward the mid-0.6600s or revisit the former resistance level, now acting as support, near 0.6600. Conversely, a strong report pushing the pair back above the 78.6% Fibonacci retracement at 0.6725 would negate the near-term bearish outlook.
Yes, scams exist in every market, including traditional ones. This happens because scammers see opportunities to make illegal money by exploiting market demand.
What scamming cases are common in this market?
Case 1: Following a signal provider’s instructions to open large positions with a small account, resulting in quick losses.
Case 2: Leading investors to invest in assets that are not available or do not exist in the market.
Case 3: Convincing people to deposit funds with a broker or financial institution that lacks a financial services license.
Case 4: Forging company’s financial documents and records to deceive investors.
How to avoid scam in this market?
Suggestion 1: Verify the financial service license of the broker or financial institution.
Suggestion 2: Verify the educational background of the signal provider.
Suggestion 3: Verify which company provides the asset and confirm its legal business activities.
What knowledge is needed to speculate (trade) or invest in the financial market?
Once you have a foundation, the knowledge you need to focus on is fundamental and technical analysis to trade or invest effectively.
Fundamental knowledge helps you forecast the market’s future direction and protect your funds effectively.
Technical knowledge helps you execute positions more precisely.
For a complete understanding, please refer to the Knowledge section.
Does having knowledge mean I can speculate (trade) or invest effectively?
No, having knowledge without practice makes it difficult to speculate and invest effectively. You will need a team or advisor to help you make informed decisions through market analysis and practical education.
Therefore, you can see that from small to large financial institutions, they always have teams or advisors to support decision-making.
What are the benefits of news and analysis (opinions and analysis) in the financial market?
Stay Informed: Keeps you updated on market events, trends, and economic changes.
Better Decision-Making: Helps you understand market sentiment and potential impacts on assets.
Identify Opportunities: Spot emerging trends or risks early through expert insights.
Diversify Perspectives: Gain different viewpoints to avoid biased decisions.
Improve Timing: News and analysis can guide when to enter or exit positions.
If I have many other questions, requests, or issues that need to be addressed, what should I do?
You can contact us anytime to resolve your issues. Our advice and consulting services are free of charge. Please don’t hesitate to reach out.
Oil prices weakened yesterday after President Trump said Venezuela would supply large volumes of sanctioned crude to the United States.
Energy
Developments in Venezuela remain in the spotlight, adding further downside pressure to oil prices. President Trump said Venezuela is prepared to sell up to 50 million barrels of sanctioned crude to the United States, a move that could also immediately weigh on Canadian crude exports to the U.S.
Such a deal would effectively open a release channel for Venezuelan oil, which has struggled to reach global markets due to a U.S. blockade on sanctioned tankers entering and leaving the country. Redirecting these barrels to the U.S. could ease storage constraints and reduce the need for Venezuela to curb production.
The U.S. Department of Energy confirmed that Venezuelan crude is already being marketed internationally, while Trump’s energy secretary stated that Washington intends to maintain long-term control over future Venezuelan oil sales. This strategy is reinforced by the continued tanker blockade, with two additional vessels reportedly seized yesterday.
Washington’s growing influence over Venezuela’s oil sector also raises uncertainty about the country’s future role within OPEC.
Meanwhile, Energy Information Administration (EIA) data showed U.S. crude inventories fell by 3.83 million barrels last week, the sharpest draw since late October. However, product balances were more bearish, as gasoline stocks rose by 7.7 million barrels and distillate inventories increased by 5.6 million barrels.
These inventory builds point to refinery utilization remaining firm, while implied demand for both products softened somewhat over the past week.
European gas prices moved higher yesterday, with TTF closing more than 2.5% up on the day. Colder conditions across parts of Europe, along with forecasts for below-average temperatures in the days ahead, are supporting the market. The current cold spell has also accelerated storage drawdowns, with EU gas inventories now at 58% of capacity, compared with a five-year average of 72%.
The latest positioning data show that investment funds cut their net short exposure in TTF for a third straight week. Funds purchased 6.2 TWh during the latest reporting period, reducing their net short position to 72.4 TWh.
The Australian Dollar weakens after the trade surplus narrowed to 2,936M MoM in November.
The Australian Dollar weakens after the trade surplus narrowed to 2,936M MoM in November.
The US ISM Services PMI climbed to 54.4 in December, up from 52.6 and above the 52.3 forecast.
The Australian Dollar (AUD) edges lower against the US Dollar (USD) on Thursday following Australia’s Trade Balance data, which showed that the trade surplus narrowed to 2,936M MoM in November versus 4,353M (revised from 4,385M) in the previous reading.
The Australian Bureau of Statistics (ABS) reported on Thursday that Exports fell by 2.9% MoM in November from a rise of 2.8% (revised from 3.4%) seen a month earlier. Meanwhile, Imports grew by 0.2% MoM in November, compared to a rise of 2.4% (revised from 2.0%) seen in October.
Australia’s mixed November Consumer Price Index (CPI) has left the Reserve Bank of Australia’s (RBA) policy path unclear, shifting attention to the quarterly CPI release later this month for stronger direction.
RBA Deputy Governor Andrew Hauser commented Thursday that November’s inflation figures were broadly in line with expectations, and noted that rate cuts are unlikely in the near term.
Data from the Australian Bureau of Statistics (ABS) on Wednesday showed annual inflation easing to 3.4% in November from 3.8% in October. The figure came in below the 3.7% forecast but remained above the RBA’s 2–3% target band. It was the lowest print since August, with housing costs rising at their weakest pace in three months.
US Dollar steadies amid market caution
The US Dollar Index (DXY), which tracks the Greenback against six major peers, is holding steady near 98.70 at the time of writing.
The Dollar is firm as soft recent data highlights a fragile US economy ahead of Friday’s pivotal jobs release, keeping sentiment subdued.
Traders are watching Thursday’s Initial Jobless Claims data, with focus shifting to Friday’s Nonfarm Payrolls report, expected to show a slowdown to 55,000 new jobs in December from 64,000 in November.
The ISM reported Wednesday that the US Services PMI strengthened to 54.4 in December from 52.6, beating forecasts of 52.3.
ADP data showed private payrolls increased by 41,000 in December, following a revised drop of 29,000 in November and slightly below the 47,000 consensus.
Fed Governor Stephen Miran said Tuesday the Federal Reserve may need to cut rates aggressively this year to sustain economic momentum, while Minneapolis Fed President Neel Kashkari cautioned that unemployment could “pop” higher.
Richmond Fed President Tom Barkin, who is not voting on policy this year, said Tuesday that rate adjustments will need to be carefully calibrated to incoming data, highlighting risks to both inflation and employment, per Reuters.
CME FedWatch pricing suggests an 88.9% chance the Fed will leave rates unchanged at its January 27–28 meeting.
China’s RatingDog Services PMI slipped to 52.0 in December from 52.1, while last week’s Manufacturing PMI ticked up to 50.1 from 49.9. Shifts in the Chinese economy are closely watched due to Australia’s deep trade ties with China.
November CPI in Australia was flat month-on-month, matching October. The RBA’s Trimmed Mean rose 0.3% MoM and 3.2% YoY. Seasonally adjusted Building Permits surged 15.2% MoM to nearly four-year highs of 18,406 units, rebounding sharply from October’s revised 6.1% drop. Annual permits climbed 20.2%, overturning a revised 1.1% decline.
The Australian Financial Review reported that the RBA may still have tightening ahead, with economists expecting sticky inflation and penciling in at least two further rate hikes.
The Australian Dollar is holding close to 0.6700 after retreating from its 15-month peak, with AUD/USD trading near 0.6720 on Thursday
Daily chart signals show the pair staying inside an ascending channel, maintaining a bullish structure. The 14-day RSI at 64.42 reinforces positive momentum.
On the upside, AUD/USD could retest 0.6766 — its highest level since October 2024 — and possibly climb toward the channel’s upper boundary near 0.6840.
Initial support is located around 0.6720 at the channel’s lower boundary, followed by the nine-day EMA at 0.6706. A break beneath that confluence area could expose downside toward the 50-day EMA at 0.6626.
The USD/CAD pair strengthened as the commodity-linked Canadian dollar struggled amid growing concerns over demand for Canadian oil.
Canada’s Prime Minister Mark Carney stated that Canadian crude remains low risk and competitive despite increasing Venezuelan exports.
Meanwhile, the U.S. dollar held steady as cautious market sentiment prevailed ahead of Friday’s key jobs report, influenced by fragile economic data.
USD/CAD extended its winning streak to a fifth consecutive day, trading near 1.3860 during Asian session on Thursday. The pair strengthened as the commodity-linked Canadian dollar faced pressure following U.S. President Donald Trump’s indication of plans to resume Venezuelan crude imports, raising concerns about increased supply and intensified competition for Canadian oil demand.
Despite this, Prime Minister Mark Carney affirmed that Canadian crude remains low risk and competitive even amid potential growth in Venezuelan exports. Carney’s office also announced his upcoming visit to China from January 13–17, aiming to diversify Canada’s export markets beyond the United States amid ongoing uncertainty over U.S. trade policy.
Canada’s seasonally adjusted Ivey Purchasing Managers’ Index (PMI) rose to 51.9 in December 2025 from 48.4 in November, exceeding the expected 49.5 and marking a return to expansion after a month of contraction. Canada’s Trade Balance data for October is scheduled for release on Thursday.
The U.S. dollar (USD) remained steady amid a fragile U.S. economic outlook ahead of Friday’s key jobs report, which has moderated market sentiment. The U.S. Nonfarm Payrolls (NFP) for December are forecasted to show a gain of 55,000 jobs, down from 64,000 in November.
On Wednesday, the Institute for Supply Management (ISM) reported the U.S. Services PMI increased to 54.4 in December from 52.6 in November, beating the expected 52.3. Additionally, the Automatic Data Processing (ADP) Employment Change showed an increase of 41,000 jobs in December, following a revised loss of 29,000 jobs in November, though this was slightly below market expectations of 47,000.
Expect a wave of higher gold-price forecasts to dominate headlines in the near future, while the metal continues to rebuild positions along the way. Not because strategists have suddenly become bullish, but because the market itself is forcing a reassessment. Price action has led. Positioning is simply following the trend. Conviction, as always, comes last.
Gold did not merely break through $4,500. It paused, consolidated, and is now poised to resume its advance once the current round of technically driven profit-taking fades. This has never been a momentum-driven rally. Instead, it has unfolded through a steady sequence of advances, orderly consolidations, and renewed accumulation.
Each pullback has drawn in fresh buyers rather than triggering forced liquidation—an unmistakable feature of a durable trend. Viewed through that lens, $4,800 appears less like an ambitious bank upgrade and more like the next logical level of support. $5,000 is no longer a distant target; it is increasingly taking on a structural character.
The primary force behind this move is monetary gravity. As the Federal Reserve progresses further into its easing cycle, the traditional opportunity-cost argument against holding gold continues to weaken. Gold does not require aggressive rate cuts—it only needs persistent uncertainty around real returns. When policy becomes conditional and forward guidance loses clarity, gold becomes a place where capital waits rather than withdraws.
The White House–backed shift toward more dovish Fed leadership is therefore important, not for political reasons but for its mechanical implications. Questioning central bank independence may be the most underpriced risk in the gold market today, and markets will adjust accordingly. They trade anticipated reaction functions, not individual personalities.
A clearer shift toward policy accommodation is reshaping expectations about both the depth and duration of easing. That adjustment filters through real yields, term premia, and currency assumptions—and gold tends to react well before these changes are fully reflected in interest-rate markets.
The second force is structural demand, which is where the rebuilding becomes self-reinforcing. For the first time since the mid-1990s, gold has surpassed U.S. Treasuries as a share of global central-bank reserves. This is not cyclical accumulation; it is balance-sheet reallocation. Reserve managers are reducing concentration risk in a system that feels increasingly politicized and less predictable. Demand of this kind does not fade on pullbacks—it intensifies.
ETF flows and private capital then follow, adding exposure gradually rather than chasing price surges.
Geopolitics provides the backdrop rather than the trigger. Venezuela is not the catalyst—it is the reminder. Energy security, trade frictions, and political alignment are no longer episodic shocks; they are enduring conditions. Gold performs well in such an environment because it does not require crisis to justify ownership. It thrives on the steady build-up of uncertainty, encouraging investors to maintain positions and rebuild as volatility subsides.
The U.S. dollar completes the feedback loop. Its near double-digit decline over the past year reflects more than a typical cycle; it points to a subtle reassessment of dollar primacy. Capital is no longer assuming permanence. Gold naturally absorbs that hesitation, functioning less as an inflation hedge and more as balance-sheet insurance. Dollar strength tends to stall gold; dollar weakness reignites it. The cadence itself invites repeated re-entry.
What lends credibility to this cycle is that gold is not moving in isolation. Silver has already repriced on the back of genuine supply constraints layered onto sustained industrial demand. Copper, now at record levels, is not a product of speculative excess—it reflects the physical market asserting itself. Aluminum and nickel echo the same signal more quietly. Together, they point to a broader shift across metals, with gold at the core.
In simple terms, gold is likely to keep rebuilding positions throughout the year because the market structure supports it. Rallies are absorbed rather than rejected. Pullbacks are met with demand, not fear. Analysts will continue to raise their targets because price action is already pulling them in that direction.
$5,000 is not an audacious forecast. It represents the market sketching out a new equilibrium—and repeatedly inviting capital to re-enter, one rebuilt position at a time.
After months of rising tensions, the United States launched a major military operation in Venezuela on 3 January 2026, resulting in the capture of President Nicolás Maduro and his wife, Cilia Flores. U.S. President Donald Trump confirmed the operation, saying Washington would administer Venezuela until a stable transition government could be established. This marks one of the most dramatic U.S. interventions in Latin America in decades, with Maduro removed from power and taken into U.S. custody.
Maduro, long a focal point of U.S. sanctions and foreign policy pressure, was transported to the United States to face federal charges—such as narco‑terrorism and drug trafficking—filed in the Southern District of New York.
Venezuela holds the world’s largest proven oil reserves, and the sudden change in leadership carries significant geopolitical and economic implications well beyond its borders.
Why Did the US Capture Maduro?
Nicolás Maduro rose through the Venezuelan political system under socialist leader Hugo Chávez and became president in 2013. His time in power was widely criticized domestically and internationally, with opponents accusing him of suppressing dissent, restricting freedoms, and holding elections that lacked credibility.
Relations with Washington deteriorated sharply, especially under the Trump administration. U.S. officials accused Maduro’s government of involvement in drug trafficking and creating conditions that fueled migration toward the United States. They also branded elements of his regime—including the Cartel of the Suns—as a terrorist organization.
Tensions escalated in 2025 when the U.S. increased the bounty for Maduro’s arrest to $50 million and expanded military pressure in the region, including strikes on vessels the U.S. claimed were tied to drug smuggling.
On 3 January 2026, after months of military buildup and diplomatic pressure, U.S. forces launched a major operation in Venezuela—code‑named Operation Absolute Resolve—that resulted in the capture of Maduro and his wife. The U.S. government framed the intervention as a law‑enforcement action tied to longstanding criminal charges against Maduro, including narcoterrorism.
The United States claims that Venezuelan officials were engaged in government‑backed drug trafficking, asserting links with the so‑called Cartel of the Suns, which Washington has designated as a terrorist organization—a claim Maduro vehemently rejects. He argues that U.S. actions were aimed at forcing regime change and securing control over Venezuela’s vast oil riches.
Only hours before his detention, Maduro made his final public appearance as president when he hosted China’s special envoy, Qiu Xiaoqi, at the Miraflores Palace to discuss bilateral relations—an event that highlighted Caracas’s reliance on foreign partnerships for political support. Shortly after that meeting, explosions were reported across Caracas.
The event went beyond a simple arrest; it sent a broader strategic message, particularly to countries like China and Iran, undermining the belief that the U.S. would refrain from acting against governments supported by foreign adversaries.
Drill, Baby, Drill
A major strategic factor behind U.S. actions in Venezuela appears to be securing access to its vast energy resources. Venezuela sits on the largest proven oil reserves on the planet, with estimates from Wood Mackenzie suggesting roughly 241 billion barrels of recoverable crude, making it a uniquely significant player in global oil markets.
Top Countries by Proven Oil Reserves (Billion Barrels)
However, Venezuela’s track record of oil output underscores just how challenging it has been to tap into its vast reserves. In the late 1990s and early 2000s, the nation was capable of producing close to 3 million barrels per day—a level that made it one of the world’s top crude exporters. But political turmoil, labor strikes, and the restructuring of the oil sector under Hugo Chávez triggered a prolonged decline. The downturn was steepened further by U.S. sanctions starting in 2017, which restricted investment, technology, and exports, driving production down sharply. After bottoming out around 374,000–500,000 bpd during the worst of the crisis, output has only modestly recovered in recent years and remains in the range of approximately 800,000–900,000 bpd.
Historical Total Venezuelan Supply
Expectations that Venezuelan oil output could quickly rebound may overstate what’s realistically achievable. History shows that even after major disruptions, rebuilding oil production takes many years and vast investment. For example, Iraq needed almost a decade and well over $200 billion in capital to restore its output after the Iraq War, while Libya still has not returned to its pre‑2011 production levels.
Venezuela’s challenges are even more severe. Most of its reserves are extra‑heavy crude that demands upgrading and blending with diluents before it can be transported and refined, a costly and technical process. Years of underinvestment, international sanctions, the erosion of PDVSA’s workforce, and the deterioration of infrastructure have compounded these production hurdles. Pipelines, upgraders, and refineries have been left in poor condition, and limited access to modern technology continues to restrict any rapid recovery.
While PDVSA has claimed that facilities were not physically damaged in recent events—suggesting limited short‑term disruption—oil markets appear capable of absorbing this uncertainty for now. Inventories remain ample, and OPEC+ has signalled that its voluntary cuts of around 1.65 million bpd could be reversed if necessary to balance markets.
In a scenario where a pro‑U.S. government enables sanctions relief and attracts foreign investment, Venezuelan exports could gradually recover. But bringing production back to around 3 million bpd would take many years and substantial infrastructure upgrades. U.S. leadership has indicated that American oil companies would play a role in operating and developing Venezuela’s oil sector, though analysts note that the heavy crude’s technical challenges and investment risks remain significant.
Meanwhile, global oil markets are structurally tightening, with world consumption exceeding 101 million bpd driven by demand growth in the U.S., China, and India. Any short‑term impact on supply may show up as a modest increase in geopolitical risk premiums, but over time, the sidelined Venezuelan barrels—currently producing around 800,000–900,000 bpd—could eventually add supply and influence prices if output scales up gradually.
In addition to oil, Venezuela sits on a wealth of mineral resources. Large deposits of iron ore, bauxite, gold, nickel, copper, zinc and other metallic minerals are concentrated mainly in the southern Guayana Shield region. The country also ranks among Latin America’s largest holders of gold, and geological assessments identify significant iron and bauxite resources alongside reserves of coal, antimony, molybdenum and other base metals.
Despite this geological potential, commercial mining activity remains very limited. Most non‑oil mineral sectors contribute only a tiny fraction of Venezuela’s economic output, and substantial foreign investment has largely been absent, meaning much of the nation’s mineral wealth has yet to be developed into large‑scale production.
The Ongoing Economic Battle Between the United States and China
Competition between modern empires today is no longer about direct confrontation but about control over key inputs. Energy, metals, and critical materials form the foundation of the modern world. When leaders signal a willingness to secure these resources directly, markets should interpret this not as mere rhetoric, but as a concrete resource strategy.
The rivalry between the United States and China is fundamentally structural rather than ideological. The U.S. is rich in energy but dependent on imported metals and rare earths. China dominates metals processing but imports around 70% of its crude oil. Each side is strong where the other is vulnerable, and both seek to turn this imbalance into strategic advantage.
Control over energy flows also carries monetary implications. Influence over Venezuelan oil is not only about supply, but also about reinforcing the petrodollar and preventing the rise of the petroyuan.
There is also a regional dimension to this rivalry. China has steadily increased its presence in Latin America through infrastructure projects and commodity-backed financing. Recent U.S. moves indicate an effort to reassert dominance in the Western Hemisphere, compelling Beijing to compete on less advantageous terms. The Trump administration’s 2025 National Security Strategy elevated the region to a core priority, effectively reviving the logic of the Monroe Doctrine—rebranded as the “Donroe Doctrine.” The aim is to bring strategically important natural resources, especially critical minerals and rare earths, under U.S.-aligned corporate control while building a hemisphere-wide supply chain that reduces dependence on China.
Across much of South America, governments are edging closer to Washington, leaving Brazil increasingly isolated. This is significant given President Lula’s openly left-leaning stance and his consistent alignment with Russia, China, and Iran. Following Trump’s capture of Maduro, betting markets on Kalshi assign a 90% probability that the presidents of Colombia and Peru will be out of office before 2027. At the same time, President Trump has again stated that Greenland should become part of the United States, reinforcing a broader strategy centered on securing critical assets.
Which Assets Could Gain from “Nation Building” in Venezuela?
A political transition in Venezuela would most directly benefit assets tied to sovereign debt restructuring, energy infrastructure, and the oil supply chain.
Venezuelan bonds are currently priced at roughly 25–35 cents on the dollar, reflecting the impact of sanctions and ongoing legal uncertainty. Under a regime-change scenario, several analysts project potential recoveries in the 30–55 cent range, supported by the prospects of debt restructuring and the easing or removal of sanctions.
Ashmore continues to rank among the largest institutional holders of Venezuelan sovereign debt. Advisory firms such as Houlihan Lokey—financial adviser to the Venezuela Creditor Committee—and Lazard, a veteran of major sovereign restructurings (including Greece and Ukraine), would likely stand to gain from the sheer scale and complexity of any debt workout. In such processes, advisers typically earn success-based fees and function as the “picks and shovels” of restructuring. Venezuela’s debt structure is widely regarded as one of the most intricate ever assembled.
Reviving Venezuela’s oil industry would demand swift rehabilitation of aging infrastructure. Technip, which historically designed much of the country’s core oil facilities, is well placed to play a leading role given its proprietary expertise—particularly if emergency repairs are fast-tracked through sole-source or no-bid contracts. Graham Corporation, a supplier of vacuum ejector systems used in heavy-oil upgrading and refining, could also benefit, since Venezuela’s crude requires vacuum distillation to prevent it from solidifying into coke.
Before exports can meaningfully increase, Venezuela will need to import substantial volumes of diluent (such as naphtha or natural gasoline) to transport its heavy crude through pipelines. Targa Resources, operator of the Galena Park Marine Terminal in Houston—a major LPG and naphtha export hub—would be a natural beneficiary if Venezuela pivots back to U.S. diluent supplies, replacing current inflows from Iran.
The clearest corporate beneficiary of regime change and nation-building in Venezuela is Chevron (NYSE: CVX). Unlike other U.S. energy majors that exited the country, Chevron has maintained an on-the-ground presence. It retains the workforce, regulatory approvals (through OFAC), and operational assets—most notably Petroboscan and Petropiar—that position it to scale up production quickly. Exxon Mobil (NYSE: XOM) and ConocoPhillips (NYSE: COP), both of which hold legacy claims and arbitration awards stemming from past expropriations, could also regain market access or pursue compensation under a revised legal and political framework.
Refiners along the U.S. Gulf Coast—such as Valero Energy (NYSE: VLO), Phillips 66 (NYSE: PSX), and Marathon Petroleum (NYSE: MPC)—were purpose-built to handle heavy, sour crude like that produced in Venezuela. Since the imposition of sanctions, these companies have had to rely on costlier substitute feedstocks. A resumption of Venezuelan supply would reduce input costs and support refining margins, assuming end-product demand remains stable.
At the sector level, a significant increase in Venezuelan output would likely weigh on oil prices, which would be negative for crude producers but positive for consumer-oriented equities. Lower energy prices are inherently deflationary and could translate into lower bond yields—conditions that are generally supportive of risk assets, all else equal.
Note: This section is for analytical purposes only and does not constitute investment advice.
Venezuela: What Comes Next for the Economy and Markets?
In a characteristically Trump-like approach, President Trump initially stated that the United States would “administer” Venezuela during the transition period. U.S. officials later confirmed that approximately 15,000 troops would remain stationed in the Caribbean, with the option of further intervention if the interim authorities in Caracas failed to comply with Washington’s demands.
Venezuela’s Supreme Court subsequently named Vice President Delcy Rodríguez as interim president. A close ally of Maduro since 2018, Rodríguez previously oversaw much of the oil-dependent economy and the country’s intelligence structures, placing her firmly within the existing power framework. She signaled a willingness “to cooperate” with the Trump administration, hinting at a potentially dramatic reset in relations between the two long-hostile governments.
International observers, including the United Nations and the Carter Center, have concluded that Venezuela’s 2024 elections lacked legitimacy and fell short of international standards. Independently verified tally sheets reviewed by analysts indicated that opposition candidate Edmundo González secured around 67% of the vote, compared with roughly 30% for Maduro.
At the same time, María Corina Machado—Nobel Peace Prize laureate and a leading figure in Venezuela’s opposition—is expected to return to the country later this month and has said the opposition is ready to take power. President Trump, however, has publicly cast doubt on the breadth of her support among the Venezuelan population.
In this context, three potential scenarios appear likely, as outlined by Gavekal Research:
“Soft” Military Rule
In the near term, the most probable outcome is the continuation of the current power structure under Rodríguez and the armed forces. For this arrangement to endure, it would likely require a pragmatic shift toward U.S. priorities—embracing a more business-friendly approach and loosening ties with traditional partners such as Russia, China, and Iran. Washington may be willing to accept this scenario if it ensures political stability and reliable access to energy supplies.
Democratic Transition
A negotiated move toward civilian governance would hinge largely on how new elections are structured. Allowing participation from the Venezuelan diaspora could significantly reshape the results, whereas restricting voting to residents inside the country would be more likely to benefit factions linked to the existing regime.
“Libya Redux” (State Breakdown)
The most destabilizing scenario would involve the collapse of central authority, triggering internal military conflict and the proliferation of armed groups. Such an outcome would heighten the risk of civil strife, renewed migration pressures, and severe disruptions to oil production and global energy markets.
Markets are increasingly overlooking geopolitical issues—including developments in Venezuela and Greenland—while economic data is set to reclaim its role as the primary market driver in the latter half of the week. Today’s releases of ADP, JOLTS, and ISM services carry downside risks for the US dollar. Expectations of further rate cuts also point to softer FX performance in Central and Eastern Europe.
USD: Data May Weigh on Momentum
The impact of the Venezuela shock has largely dissipated. Although oil prices eased yesterday, they remain close to pre-4 January levels, equities continued to advance, and FX markets have shifted focus away from geopolitics. This reflects a post-“Liberation Day” tendency to ignore headlines and adopt a more measured outlook.
The dollar recovered modestly yesterday, likely supported by seasonal inflows and a slight rise in front-end swap rates rather than geopolitical factors. Unless the US intensifies its stance on Greenland or intervenes again in Venezuela, markets are expected to re-center on macro data in the second half of the week.
Today’s ISM services index is anticipated to be weak, but price action will likely be driven more by ADP (consensus: 50k) and the JOLTS job openings data. Notably, ADP has undershot expectations in seven of the past ten releases. Given our dovish view on the US labor market, we see upcoming employment data as carrying asymmetric downside risks for the dollar.
Looking beyond today, our near-term outlook remains neutral to slightly constructive on the greenback.
EUR: Inflation Risks to the Downside, but ECB Outlook Largely Unchanged
German inflation undershot consensus yesterday, decelerating to 1.8% YoY (2.0% in EU harmonised terms). As our economist notes here, the disinflation appears broad-based – i.e., beyond the base effect – with prices falling in leisure, clothing, and food.
That raises the chance of a sub-2.0% print today (consensus is at 2.0%) for the eurozone CPI flash estimate. Expectations are for the core CPI to remain unchanged at 2.4%, though; that is a measure that needs to start trending lower more decisively to revive any dovish dissent within the ECB.
For now, implications for ECB rate expectations are likely to be limited unless inflation starts undershooting materially and consistently. By extension, the euro may not be taking many cues from the print and will remain almost entirely driven by the US dollar leg.
The Australian Dollar gains ground amid a hawkish outlook on the Reserve Bank of Australia (RBA).
Australia’s CPI slowed to 3.4% year-over-year in November, below expectations but still above the RBA’s target range.
Traders now turn their attention to Wednesday’s US ISM Services PMI and JOLTs job openings reports for further market cues.
The Australian Dollar (AUD) extended its winning streak for the fourth consecutive session on Wednesday, gaining against the US Dollar (USD) despite easing inflation figures for November. Traders are now focused on the upcoming full fourth-quarter inflation report due later this month. Analysts caution that a core inflation increase of 0.9% or more could prompt the Reserve Bank of Australia (RBA) to consider further tightening at its February meeting.
Meanwhile, the Australian Financial Review (AFR) highlighted that the RBA may not be finished with its rate hikes this cycle. A recent poll suggests inflation is likely to remain persistently high over the coming year, supporting expectations for at least two more rate increases.
The Australian Bureau of Statistics (ABS) reported on Wednesday that Australia’s Consumer Price Index (CPI) rose 3.4% year-over-year (YoY) in November, easing from 3.8% in October. This figure missed market expectations of 3.7% but stayed above the Reserve Bank of Australia’s (RBA) target range of 2–3%. It marked the lowest inflation rate since August, with housing costs rising at their slowest pace in three months.
Month-on-month (MoM), Australia’s CPI remained flat at 0% in November, matching October’s reading. Meanwhile, the RBA’s Trimmed Mean CPI increased 0.3% MoM and 3.2% YoY. In a separate report, seasonally adjusted building permits surged 15.2% MoM to a near four-year high of 18,406 units in November 2025, bouncing back from a downwardly revised 6.1% decline the previous month. Annual approvals jumped 20.2%, reversing a revised 1.1% drop in October.
US Dollar declines ahead of ISM Services PMI
The US Dollar Index (DXY), which tracks the US Dollar’s value against six key currencies, is slightly declining after posting small gains in the previous session, currently hovering near 98.50. Market participants are awaiting US economic releases that may influence Federal Reserve (Fed) policy outlooks. Later today, attention will be on the ISM Services Purchasing Managers’ Index (PMI) and JOLTs job openings data. The upcoming US Nonfarm Payrolls (NFP) report, due Friday, is forecasted to show an increase of 55,000 jobs in December, a decrease from 64,000 in November.
Fed Governor Stephen Miran stated on Tuesday that the central bank should pursue aggressive interest rate cuts this year to bolster economic growth. Conversely, Minneapolis Fed President Neel Kashkari cautioned that unemployment could unexpectedly rise. Richmond Fed President Tom Barkin, who is not voting on this year’s rate decisions, emphasized that rate changes will need to be carefully calibrated to incoming data, pointing to risks affecting both employment and inflation targets, per Reuters.
According to CME Group’s FedWatch tool, futures markets assign roughly an 82.8% chance that the Fed will keep rates steady at the January 27–28 meeting.
On the geopolitical front, the US launched a significant military strike on Venezuela last Saturday. President Donald Trump announced that Venezuelan President Nicolas Maduro and his wife were captured and removed from the country. However, Maduro pleaded not guilty on Monday to US narcotics-terrorism charges, signaling a high-stakes legal confrontation with wide geopolitical consequences, Bloomberg reports.
Traders anticipate two more Fed rate cuts in 2026. Markets also expect Trump to nominate a new Fed chair to succeed Jerome Powell when his term expires in May, potentially steering monetary policy toward lower rates.
In China, the Services PMI from RatingDog fell slightly to 52.0 in December from 52.1 in November, while Manufacturing PMI rose to 50.1 from 49.9 the previous month. Given China’s close trade ties with Australia, shifts in the Chinese economy may affect the Australian Dollar.
The Reserve Bank of Australia’s December meeting minutes revealed readiness to tighten monetary policy further if inflation does not ease as expected. Greater attention is now on the Q4 Consumer Price Index report scheduled for January 28, with analysts warning that a stronger-than-anticipated core inflation figure could prompt a rate hike at the RBA’s February 3 meeting.
The Australian Dollar has reached new 14-month highs, climbing above the 0.6750 level
On Wednesday, AUD/USD is trading near 0.6750. Technical analysis of the daily chart shows the pair moving upward within an ascending channel, indicating a continued bullish trend. However, the 14-day Relative Strength Index (RSI) at 70 signals that the pair may be overbought.
Since October 2024, AUD/USD has hit new highs and is now aiming for the upper boundary of the ascending channel around 0.6830.
Initial support is found at the nine-day Exponential Moving Average (EMA) near 0.6708, followed by the lower boundary of the ascending channel at about 0.6700. A drop below this combined support zone could push the pair down toward the 50-day EMA level at approximately 0.6625.
Japanese Yen bulls stay cautious amid fiscal concerns and a generally positive risk environment.
Diverging expectations between the Bank of Japan and the Federal Reserve help contain further losses for the lower-yielding yen.
Meanwhile, subdued follow-through buying of the US dollar keeps USD/JPY capped ahead of upcoming US economic data.
The Japanese Yen (JPY) remains under pressure against the US dollar during Wednesday’s Asian session, though significant depreciation remains limited. Key factors weighing on the yen include Japan’s fiscal concerns, a broadly risk-on market sentiment, and uncertainty around the timing of the Bank of Japan’s (BoJ) next rate hike.
Despite this, the BoJ is expected to continue its policy normalization, creating a notable divergence from growing expectations of additional interest rate cuts by the US Federal Reserve (Fed). This divergence helps cap gains in the US dollar and offers some support to the lower-yielding yen. Additionally, speculation about possible intervention by authorities to support the yen calls for caution among those betting on further yen weakness.
The Japanese Yen struggles to attract buyers as a mix of factors counterbalance expectations for Bank of Japan rate hikes.
Japan’s fiscal outlook remains a concern, especially after the cabinet approved Prime Minister Sanae Takaichi’s record ¥122.3 trillion budget. Meanwhile, uncertainty persists over the timing of the next Bank of Japan (BoJ) rate hike, as expectations that energy subsidies, stable rice prices, and low petroleum costs will keep inflation subdued through 2026.
BoJ Governor Kazuo Ueda stated on Monday that the central bank will continue raising rates if economic and price trends align with forecasts. He emphasized that adjusting monetary support will help sustain growth, and moderate, synchronized rises in wages and prices leave room for further policy tightening.
This outlook pushed yields on Japan’s rate-sensitive two-year and benchmark 10-year government bonds to their highest levels since 1996 and 1999, respectively. The narrowing yield gap between Japan and other major economies has discouraged aggressive bearish bets on the yen, especially amid speculation of possible intervention.
The US dollar has struggled to build on gains from the previous day due to dovish Federal Reserve expectations and concerns about the Fed’s independence under President Donald Trump’s administration. Traders are also holding back, awaiting key US economic data for clearer signals on the Fed’s rate cut trajectory.
Wednesday’s US economic calendar includes the ADP private-sector employment report, ISM Services PMI, and JOLTS Job Openings. However, attention will largely focus on Friday’s Nonfarm Payrolls (NFP) report, which is expected to be crucial in shaping the next directional move for the dollar ahead of Tuesday’s US consumer inflation data.
USD/JPY’s mixed technical signals call for caution, with the key 156.15 confluence level serving as a crucial test for bullish momentum.
The USD/JPY pair’s overnight rally confirmed support at the 156.15 confluence zone, which combines the 100-period Simple Moving Average (SMA) on the 4-hour chart with the lower boundary of a short-term ascending channel. This level is crucial—if decisively broken, it could trigger renewed bearish momentum and open the door to deeper declines.
The Moving Average Convergence Divergence (MACD) histogram is slightly negative but contracting near the zero line, indicating weakening bearish pressure. Meanwhile, the Relative Strength Index (RSI) stands at 52, showing a neutral stance with a slight bullish bias. The rising SMA favors a buy-on-dips approach, though the subdued MACD suggests limited follow-through at this stage. RSI near the midpoint reinforces a consolidative phase within the channel.
Initial support remains at the 156.15 confluence, while resistance is positioned at 157.15—the channel’s upper boundary. A close above 157.15 could trigger further upside, whereas failure to break this level would keep USD/JPY range-bound within the rising corridor.
EUR/USD retreats toward 1.1710 after being rejected near 1.1740, giving back recent gains as downward revisions to Eurozone PMIs and softer German inflation renew selling pressure on the euro. With investors now awaiting key US labor market data, expectations for Federal Reserve monetary policy remain a major driver for the euro dollar exchange rate.
EUR/USD trades in a volatile market on Tuesday, hovering around 1.1710 at the time of writing, down 0.15% on the day. The pair has surrendered earlier gains as weaker Eurozone economic data revives concerns over the region’s growth outlook.
Selling pressure on the euro intensified after the downward revision of the Eurozone HCOB Services Purchasing Managers Index (PMI). The index was revised to 52.4 for December, below the preliminary estimate of 52.6 and down from 53.1 in November, signaling a slowdown in services sector activity—one of the main drivers of the European economy.
Meanwhile, German inflation data released on Tuesday point to a clear easing in price pressures. Annual CPI inflation slowed to 1.8% in December from 2.3% in November, while the Harmonized Index of Consumer Prices (HICP) dropped to 2.0% from 2.6%, coming in below market expectations. These readings reinforce expectations of a more subdued inflation environment across the Eurozone, limiting near-term upside for the euro.
On the US front, economic releases have also added to volatility in EUR/USD trading. The Services PMI was revised down to 52.5 in December, its lowest level in eight months, while the Composite PMI slipped to 52.7. According to S&P Global, softer demand, weaker new orders, and slower employment growth signal that the US economy is losing momentum, even as cost pressures remain elevated.
As a result, expectations for US monetary policy remain a key driver of the euro-dollar pair. Fed Governor Stephen Miran said on Tuesday that upcoming data are likely to support further interest rate cuts, arguing that the Federal Reserve could lower rates by more than 100 basis points this year as current policy remains restrictive and continues to weigh on economic growth.
Overall, EUR/USD continues to trade amid mixed macroeconomic signals from both sides of the Atlantic. With no clear near-term catalyst, price action remains uneven, while investors now turn their focus to upcoming US labor market data to better gauge the timing of potential Federal Reserve easing and the short-term direction of the US dollar.
The entire crypto market, tracking over 18,000 tokens across centralized and decentralized exchanges, is currently valued at nearly $3 trillion. This represents a 31% decline from the all-time high of $4.37 trillion recorded in early October, just before the recent crypto market crash.
Bitcoin, the largest cryptocurrency by market cap, is hovering around $88,000, accounting for more than half of the total market value at $1.77 trillion. Despite its dominant position, Bitcoin is poised to end the year with a negative annual return.
Since 2012, this marks the fourth year Bitcoin has underperformed, albeit by a significantly smaller margin compared to previous down years. For context, Bitcoin’s annual losses were -50.2% in 2014, -72.1% in 2018, and -62% in 2022. If Bitcoin maintains its current price level near $88,000, its annual underperformance in 2025 would be the “best of the worst” at around -6%.
Compared to Bitcoin, traditional asset classes like stocks and gold/silver have delivered substantially better returns this year on average. This contrast raises important questions about crypto’s position and outlook heading into 2026.
Is the Crypto Market Mature Enough for Significant Exposure?
The core purpose of the blockchain ecosystem is to transform the traditional money system through trustless finance. In simple terms, it leverages advances in cryptography combined with a full software stack to make transacting value as seamless as sending a message on an app.
While online banking and payment processors like PayPal have long provided similar convenience, the blockchain ecosystem offers a fundamental overhaul. Instead of relying on a single intermediary that acts as a bottleneck, automated smart contracts on an immutable ledger—the blockchain—execute all value transfers autonomously.
This decentralized approach eliminates single points of failure, increases transparency, and enhances security, paving the way for a new era of financial innovation.
This newly reinvented financial system—decentralized finance (DeFi)—has shown tremendous promise. Its total value locked (TVL) skyrocketed from $600 million in 2020 to $176 billion by late 2021, marking an astonishing growth of over 29,000%. Such rapid expansion is a clear indicator of a nascent industry emerging.
However, following the FTX collapse in late 2022 and a wave of bankruptcies among overleveraged crypto ventures, DeFi’s TVL has stabilized around $50 billion for the past two years. It was only after President Trump’s second term and the removal of the previously antagonistic SEC Chair Gary Gensler that DeFi began to recover, reaching approximately $168 billion TVL in early October.
Looking at this entire period from 2020 to now, several key conclusions emerge:
Without active institutional and legislative support, blockchain finance risks remaining confined to the enthusiast fringe. Like many cultural phenomena, mass adoption tends to be top-down driven, as exemplified by Elon Musk’s influence on Dogecoin’s surge.
One major hurdle to crypto’s wider adoption is the inflation of new tokens, which fuels recurring boom-and-bust cycles. This token oversupply undermines investor attention, market legitimacy, and overall capital efficiency.
The current ecosystem—where tokens are staked to earn more tokens in a closed-loop, casino-like economy—must give way to real utility derived from external value rather than internal dilution.
Moreover, Web3 crypto usage remains far from user-friendly and secure, with frequent incidents like bridge hacks and wallet incompatibility. According to Chainalysis, over $3.4 billion in crypto funds were stolen in 2025 alone. Ideally, blockchain finance should be so seamless that users are unaware they’re interacting with decentralized technology.
Notably, the market rally following the removal of SEC Chair Gary Gensler signals that blockchain’s underlying value hinges on how well it integrates with the broader, compliance-driven economy. As such, 2026 is shaping up to be a pivotal year for crypto’s maturity and mainstream acceptance.
Bitcoin and Stablecoin-Based Institutional Integration: The 2026 Catalyst
While DeFi protocols sought to establish dominance, new intermediaries such as foundations, early adopters, venture capitalists, and miners quickly asserted control. Despite the promise of decentralization, the ease of creating new tokens generated persistent dilution pressure across the crypto ecosystem.
Bitcoin, however, avoided this recursive dilution trap by imposing a physical energy barrier through its proof-of-work algorithm. This barrier limits token creation ex-nihilo, allowing Bitcoin’s network effect to remain robust. Following the October market crash, Bitcoin’s mining difficulty held steady, even increasing before stabilizing at pre-crash levels as the price hovered around $88,000 towards year-end.
Amid rising inflation fears, geopolitical tensions, and trade conflicts, gold and silver have regained their status as trusted hedges. Nevertheless, Bitcoin’s deterministic scarcity and digital-native nature position it uniquely for the modern economy, contrasting with gold’s pseudoscarcity.
Although many financial institutions underestimated Bitcoin’s 2025 price — with forecasts from Standard Chartered ($200k), VanEck ($180k), JPMorgan ($165k), Bernstein ($200k), and Fundstrat ($250k) — these projections may be delayed signals for 2026. As of early December, JPMorgan analysts suggested Bitcoin could reach $170k in 2026, assuming it begins to trade similarly to gold.
Moreover, recent research from K33 indicates that selling pressure from long-term holders (LTH) is nearing exhaustion. If this holds true, Bitcoin is poised to lead a renewed altcoin market rally in 2026, but with some notable distinctions:
The full implementation of the EU’s Markets in Crypto-Assets (MiCA) regulation will channel the majority of European crypto trading volume into regulated entities, while simultaneously triggering a flight of activity to less restrictive jurisdictions.
Meanwhile, tokenized stocks are poised for wider adoption as the US clears key regulatory hurdles. Notably, SEC Chair Paul Atkins issued a no-action letter to the Depository Trust Company (DTC) to facilitate the rollout of tokenized securities. However, offerings from platforms like Robinhood, Kraken, and Dinari remain heavily geo-restricted.
As the EU seeks to curb USD-based stablecoin flows—evidenced by Kraken’s fiat-only tokenized stock trading—the US stands to gain renewed competitive advantage.
Institutional oversight in the US is becoming increasingly crypto-friendly, likely aiming to solidify USD dominance via stablecoins. For example, the Basel Committee on Banking Supervision (BCBS) is revising its rules on banks’ exposure to cryptocurrencies. Together with more accommodating regulators such as the FDIC and OCC, it is now highly likely that US banks will hold cryptocurrencies in 2026.
Following the passage of the GENIUS Act, stablecoin flows are expected to significantly boost the broader crypto market. On one side, Circle’s upcoming Arc blockchain—backed by Blackrock, Visa, and Amazon—will support institutional stablecoin settlements. On the other, stablecoins are rapidly becoming the primary consumer-facing crypto product.
While MiCA’s vague definition of “decentralization on a spectrum” may hinder true DeFi innovation, it nonetheless accelerates capital formation around compliant crypto primitives.
The Bottom Line
Since 2020, the crypto ecosystem has created transformative wealth but also faced setbacks due to excessive experimentation. The strict regulatory stance under SEC Chair Gary Gensler cooled early enthusiasm, turning much of crypto activity into speculative trading rather than real financial innovation.
Following President Trump’s SEC repeal of SAB 121, crypto entered a new phase of integration under traditional finance (TradFi) rules. Despite macroeconomic and geopolitical headwinds, crypto moves into 2026 on its most stable footing yet.
Unlike prior cycles dominated by retail sentiment, institutional investors — pension funds, insurers, and endowments — are expected to reduce volatility through spot ETFs and altcoin trusts on high-performance chains like Solana and Sui.
The rise of Real World Assets (RWA) will foster a unified liquidity layer, linking tokenized stocks, RWAs, and TradFi blockchain networks with DeFi protocols. In this emerging hybrid finance, stablecoins will be the backbone, enabling DeFi’s transformation into a regulated, compliant capital market.
Shares of auto giant Tesla Inc. closed lower for the fourth consecutive session on December 29, signaling a notable shift in momentum just days after the stock reached a fresh all-time high. Since that peak just before Christmas, Tesla shares have declined nearly 8%, marking a sharp reversal after a hard-fought rally.
The timing of Tesla’s recent pullback makes it particularly notable. In a market hovering near record highs, Tesla’s sudden loss of momentum just as it enters blue sky territory raises a critical question: is this a healthy pause or an early sign that the rally is losing steam?
Let’s explore the arguments on both sides.
A Pullback Was Always Possible Amid Tesla’s Rapid Rally
Tesla has surged more than 100% since April, with its longer-term uptrend remaining firmly intact. Even after the recent decline, the stock has not broken any major trend structures—it simply looks more pronounced coming off a record high. Many investors had anticipated the rally to accelerate after Tesla finally cleared long-term resistance, rather than pull back.
From a technical perspective, a pullback of this magnitude is normal and consistent with previous corrections the stock has experienced this year. The latest rally phase was largely one-directional, making profit-taking after major milestones expected.
Tesla’s shares could fall another 8% and still remain within the rising trend channel that has supported the stock since spring. Viewed this way, the recent selloff represents a period of digestion rather than a breakdown. Healthy uptrends rarely move in straight lines—something Tesla investors are all too familiar with.
This outlook is further supported by Tradesmith’s Health Indicator, a volatility-based measure of stock price strength. According to this indicator, Tesla (TSLA) stock has remained in the green zone for four consecutive months, signaling a healthy underlying trend despite recent pullbacks.
A Change in Tone Marks Shift in Market Sentiment Around Tesla Stock
While a pullback is normal after reaching an all-time high, four consecutive lower closes suggest there is more at play than just short-term profit-taking. The sustained selling pressure indicates that bears have firmly taken control from the bulls, with little defense visible so far.
The critical question now is whether buyers will quickly re-enter the market. If they do, this pullback may be seen as a buying opportunity for long-term investors. If not, the market could begin to reassess the remaining upside potential ahead of the next major catalyst—January’s earnings report.
Analyst Support Remains Strong as Tesla Navigates Recent Price Decline
Despite recent weakness, analyst conviction in Tesla remains firm. Over the past week, both RBC and Canaccord Genuity reaffirmed their Buy ratings on the stock. Canaccord Genuity even raised its price target to $551, implying roughly 20% upside from current levels.
These positive calls suggest that the recent selloff is a minor pullback within a larger, ongoing uptrend that still has significant room to grow, even if near-term price action appears uncomfortable. While Sell ratings, such as one from UBS Group last week, persist, they remain rare exceptions in an otherwise solid analyst consensus.
This broader trend of sustained analyst support is particularly important during periods of market uncertainty like the current one.
Why the Next Few Trading Sessions Are Crucial for Tesla Stock
Despite the ongoing pullback, it would be a mistake to dismiss the recent price action entirely. Runs of consecutive red days like this are rare for Tesla, especially so soon after hitting new highs. The fact that this is occurring while the broader market remains strong adds an extra layer of concern.
Tesla’s high valuation intensifies this tension. Trading with a price-to-earnings ratio above 300, the stock leaves little margin for error. Any sign of disappointment in the company’s upcoming earnings report at the end of January could lead to a swift selloff. Confidence, not just momentum, is now a crucial factor.
This makes the upcoming sessions particularly important. How Tesla performs through the remainder of the holiday week and into early January will provide vital clues about the health of the rally. Stabilization or a quick rebound would suggest the pullback is routine. Continued weakness, however, would encourage bearish sentiment and shift the narrative from consolidation to growing doubt.