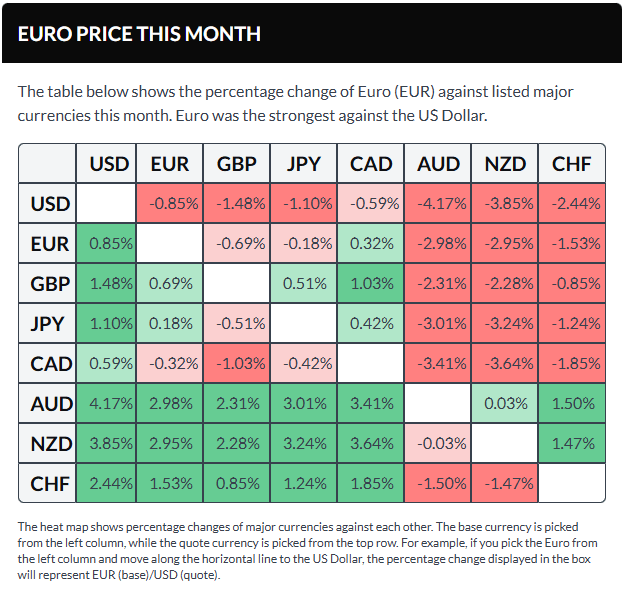
EUR/USD drops 0.75% as Kevin Warsh’s Fed nomination lifts US yields and fuels Dollar demand.
Hot US producer inflation reinforces expectations for a steady Fed, pushing Treasury yields above 4.25%.
Solid German and Eurozone GDP figures fail to counter Dollar strength driven by policy repricing.
EUR/USD slid 0.75% in the North American session as broad US Dollar strength followed Trump’s mildly hawkish Fed nominee and an inflation report supporting a steady-rate stance. The pair was trading at 1.1882 at the time of writing, down from a session high of 1.1974.
Euro sinks below 1.19 as hawkish Fed leadership signals and sticky inflation crush rate-cut hopes
Kevin Warsh has been named by President Trump as the next Chair of the Federal Reserve, confirming rumors that surfaced late Thursday. Financial markets reacted swiftly, sending precious metals sharply lower while the US Dollar climbed nearly 1%, as measured by the US Dollar Index (DXY), which tracks the greenback against six major peers. The DXY is on course to close above the 97.00 mark.
US Treasury yields also advanced, with the 10-year yield rising toward 4.25%. Meanwhile, US producer-side inflation edged higher, moving further away from the Federal Reserve’s 2% target and reinforcing the case for keeping interest rates unchanged. In addition to the December Producer Price Index (PPI) release, comments from Federal Reserve officials remained in focus.
Separately, breaking news reported that the US Senate reached an agreement to pass a government funding package later tonight, averting a potential shutdown, according to Politico.
Rising Treasury yields suggest investors see reduced odds that Warsh would pursue aggressive rate cuts to appease the White House. At the time of writing, the US 10-year Treasury yield was up around 1.5 basis points at 4.247%.
In Europe, Germany’s economy expanded by 0.4% year-on-year, beating expectations. However, stronger-than-forecast GDP readings for Germany and the Eurozone, along with an uptick in German inflation, failed to offer meaningful support to EUR/USD.
Looking ahead, the US economic calendar will feature a batch of labor market data, speeches from Fed officials, and January ISM Manufacturing and Services PMIs. In Europe, HCOB flash PMIs for the Eurozone, Germany, and France, alongside the European Central Bank’s monetary policy meeting, could inject volatility into EUR/USD.
Daily market movers: Dollar comeback sends Euro tumbling
St. Louis Fed President Alberto Musalem said there is no need for further rate cuts at present, noting that the current 3.50%–3.75% policy range is broadly neutral. He added that easing would only be warranted if the labor market weakens significantly or inflation falls materially.
Fed Governor Stephen Miran backed Kevin Warsh as a strong candidate for Fed Chair, attributing the recent rise in producer prices largely to housing costs and portfolio management fees. Meanwhile, Fed Governor Christopher Waller said the labor market remains soft despite steady growth, arguing inflation would be closer to 2% without tariffs, which he said are keeping price growth near 3%. Waller added that policy should be closer to neutral, around 3%.
Atlanta Fed President Raphael Bostic called for patience, stressing that interest rates should remain somewhat restrictive. He warned that the full inflationary impact of tariffs has yet to be felt and expects price pressures to persist.
US producer inflation data reinforced the cautious tone. The Producer Price Index (PPI) held steady at 3.0% YoY in December, missing expectations for a slowdown to 2.7%. Core PPI accelerated to 3.3% YoY from 3.0%, defying forecasts for a decline and highlighting ongoing upstream price pressures.
In Europe, EU GDP grew 1.4% YoY in Q4, unchanged from Q3 but above expectations. Germany’s economy expanded 0.4% YoY, beating forecasts and improving from the prior quarter. German inflation, measured by the HICP, edged up to 2.1% in January from 2.0%, remaining within the ECB’s target range.
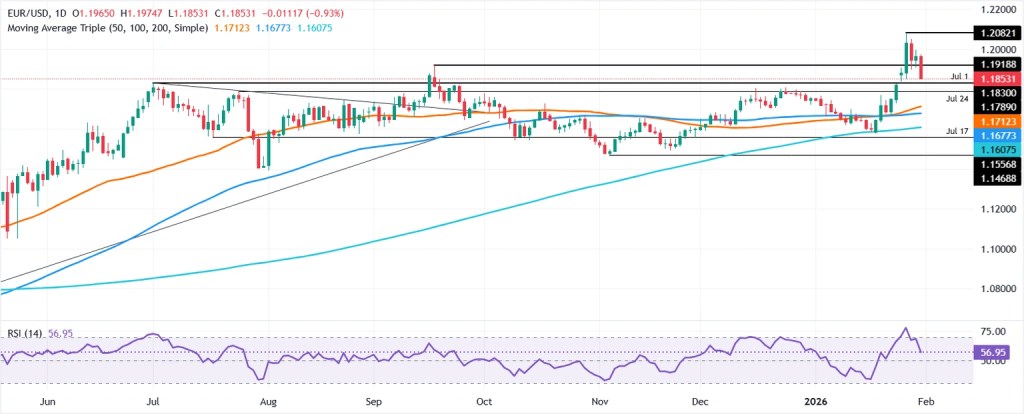
Technical outlook: EUR/USD uptrend under threat after break below 1.1850
The EUR/USD technical outlook suggests the uptrend is under threat after the pair failed to sustain gains above the 2025 high at 1.1918, accelerating the decline below 1.1850. The Relative Strength Index (RSI) has turned mildly bearish, indicating a shift in momentum that could open the door to further downside.
On the downside, initial support is seen at 1.1800. A decisive break below this level could expose the 20-day simple moving average (SMA) at 1.1743.
On the upside, immediate resistance stands at 1.1900. A move back above this level would bring 1.1950 into focus, followed by the yearly high at 1.2082.
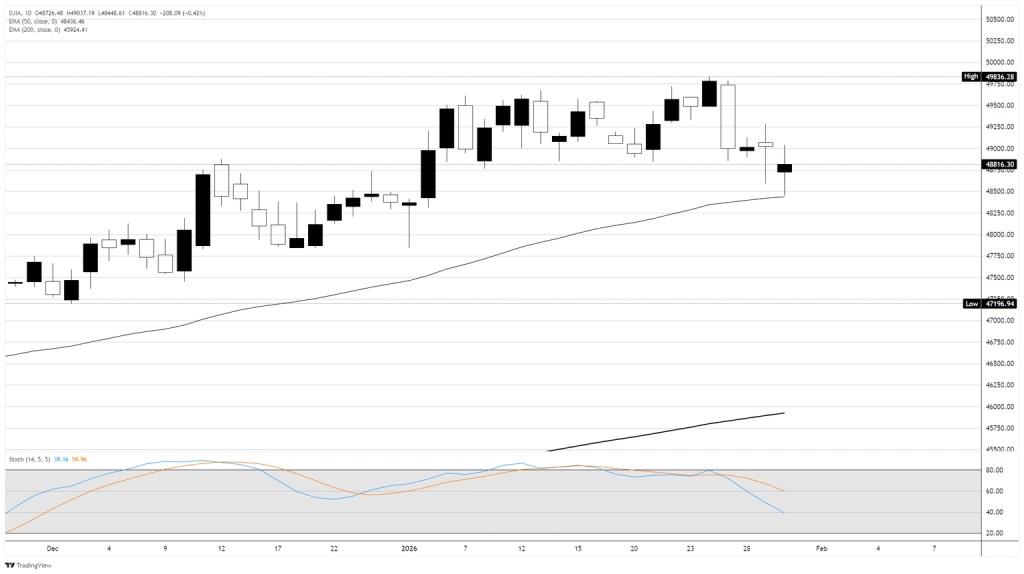
Major stock indexes slipped slightly as markets weighed President Trump’s pick of Kevin Warsh to replace Fed Chair Jerome Powell in May.
Verizon jumped on robust subscriber additions and optimistic guidance for 2026, while American Express declined even after topping revenue expectations.
Silver tumbled more than 17% in a sharp reversal from record levels, sparking broad profit-taking across precious metals.
Even with Friday’s retreat, the three main benchmarks still delivered solid gains for January, rounding off a strong opening to 2026.
The Dow Jones Industrial Average fell about 200 points on Friday, down 0.2%, as investors assessed President Donald Trump’s nomination of former Fed Governor Kevin Warsh to replace Jerome Powell as Federal Reserve Chair when his term ends in May. The S&P 500 also slipped 0.2%, while the Nasdaq Composite declined 0.3%.
Even so, January ended on a strong note overall, with all three major indexes posting solid monthly gains: the Dow climbed 2.1%, the S&P 500 rose 1.8%, and the Nasdaq advanced 1.9%.
Warsh nomination puts an end to months of Fed leadership speculation
President Trump announced on Friday morning that Kevin Warsh would be his choice to lead the Federal Reserve, bringing an end to months of uncertainty over who would succeed Jerome Powell. Warsh, 55, served on the Fed’s Board of Governors from 2006 to 2011 and played a prominent advisory role during the 2008 financial crisis.
Investors generally see Warsh as a relatively hawkish nominee who would favor lower interest rates, though likely with more restraint than some other contenders. His nomination now heads to what could be a difficult Senate confirmation process, as Republican Senator Thom Tillis has warned he will block Fed nominees until a Justice Department investigation into Powell is concluded.
Verizon jumps after posting record subscriber additions
Verizon Communications Inc. (VZ) stood out among Dow stocks, jumping 6.6% after reporting its strongest quarterly subscriber growth since 2019. The telecom operator added 616,000 postpaid wireless phone customers in the fourth quarter, well above forecasts of about 417,000.
The surge was driven by new CEO Dan Schulman’s aggressive promotions, including offers such as four phone lines for $100 a month, which proved popular with holiday shoppers. Investors were further encouraged by Verizon’s 2026 outlook, as the company projected adjusted earnings of $4.90 to $4.95 per share, comfortably exceeding consensus estimates of $4.76.
Financial shares pull back amid mixed earnings results
American Express Company (AXP) slid 3.1% after posting fourth-quarter results that broadly met expectations but failed to excite investors. The payments firm reported earnings of $3.53 per share on revenue of $18.98 billion, marking a 10.5% year-over-year increase. However, sentiment was dampened by higher credit loss provisions and rising costs, despite management lifting its 2026 outlook above consensus and announcing a 16% dividend hike.
Elsewhere in the sector, Visa Inc. (V) fell 2.3% even after beating both revenue and earnings forecasts, while International Business Machines (IBM) declined 1.6%, giving back part of its roughly 5% rally following earnings the previous day.
Big oil companies top forecasts as production hits record levels
Chevron Corporation (CVX) edged up 0.5% after delivering quarterly earnings that topped expectations, despite weaker oil prices weighing on the broader energy sector. The company highlighted record output from the Permian Basin and its offshore Guyana assets.
ExxonMobil Corporation (XOM) also surpassed profit estimates but slipped 0.8% as both oil majors faced pressure from a global supply surplus that has driven crude prices lower. Management at both companies stressed strong cost discipline and resilience, noting they can remain profitable even with oil at $35 a barrel, although full-year profits have fallen from prior peaks.
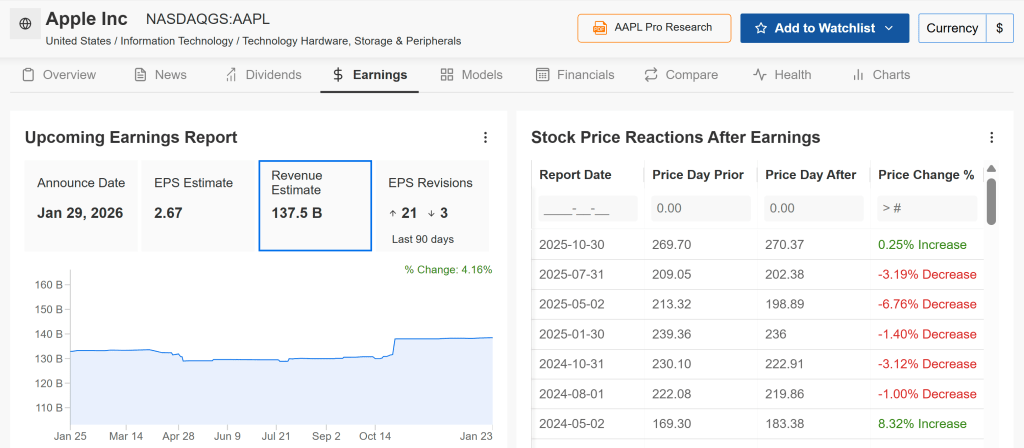
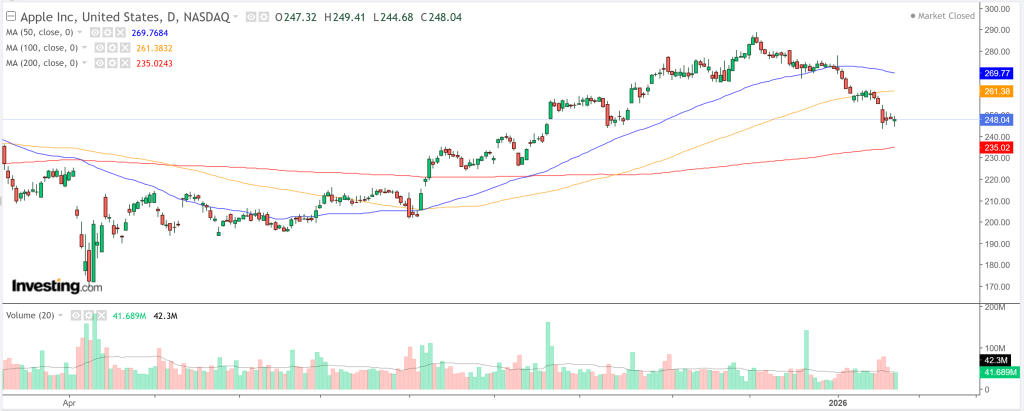
Apple slips even after posting a blockbuster iPhone quarter
Apple Inc. (AAPL) slipped 1.2% on Friday even after delivering fiscal first-quarter results that far exceeded expectations. The company reported revenue of $143.8 billion, a 16% year-over-year increase, fueled by a 23% surge in iPhone sales to $85.27 billion. CEO Tim Cook described demand for the iPhone 17 lineup as “simply staggering,” with Apple setting record revenues across all geographic regions. The company’s installed base climbed to more than 2.5 billion devices, up from 2.35 billion a year earlier.
Despite the standout performance, some investors chose to lock in profits after Apple’s recent rally. Broader weakness in the technology sector also weighed on the stock, following a sharp 10% drop in Microsoft shares a day earlier after the company issued disappointing cloud guidance.
Silver tumbles sharply in a dramatic pullback from record highs
Silver prices plunged as much as 21% on Friday, pulling back sharply from record highs in what analysts described as the metal’s steepest one-day decline in 14 years. After surging to an all-time peak of $122 an ounce on Thursday, heavy profit-taking sparked a broad selloff across precious metals.
Even with the abrupt correction, silver was still poised to finish the month up more than 30%, underpinned by heightened geopolitical risks, a weaker dollar, and tight physical supply. Trading volumes in the iShares Silver Trust (SLV) spiked as retail investors who had chased the rally rushed to exit positions. Gold also eased, retreating from recent record levels above $5,500 an ounce.
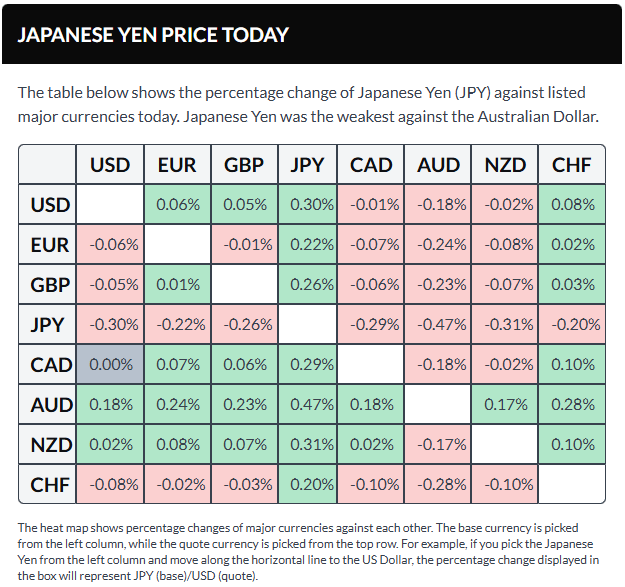
The US Federal Reserve experienced an eventful week. On Monday, it contacted New York–based banks to assess their USD/JPY exposure, sparking speculation that Washington could be coordinating with Japan to address the Japanese Yen’s weakness. This development prompted a sharp sell-off in the US Dollar early in the week.
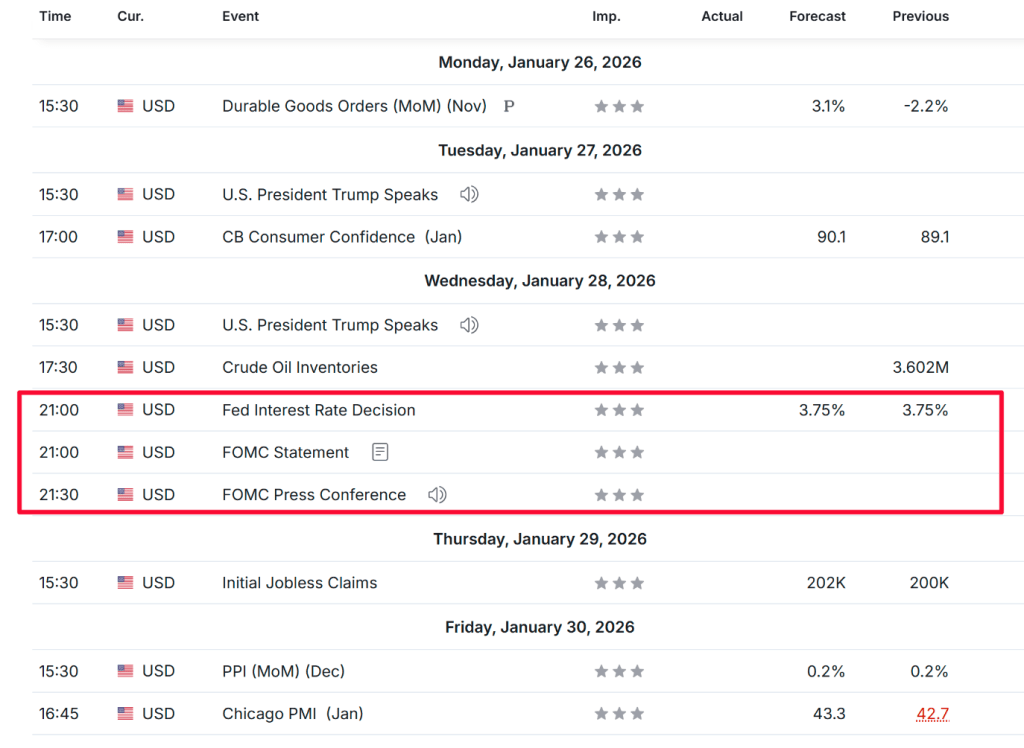
The Fed’s midweek policy meeting resulted in no change to the federal funds rate, which was kept within the 3.50%–3.75% range, in line with expectations. During his press conference, Chair Jerome Powell avoided questions related to politics, his tenure, and the subpoena. However, he pointed to improving economic momentum and reduced risks to both inflation and the labor market.
The US Dollar Index (DXY) has since rebounded toward the 96.90 level, recovering most of its weekly losses after President Donald Trump nominated former Fed Governor Kevin Warsh as the next Fed Chair on Friday. The nomination now awaits Senate approval. Looking ahead, the US is set to release several key data points next week, including the ISM Manufacturing PMI for January, MBA mortgage applications, Challenger job cuts, and weekly initial jobless claims.
EUR/USD is hovering around the 1.1880 area after the US Dollar rebounded and recovered nearly all of its weekly losses. In the coming week, Hamburg Commercial Bank (HCOB) will release Manufacturing, Services, and Composite PMIs for both Germany and the Eurozone. Additional Eurozone data include the ECB Bank Lending Survey and December Producer Price Index (PPI), while Germany will publish December Factory Orders and Industrial Production figures.
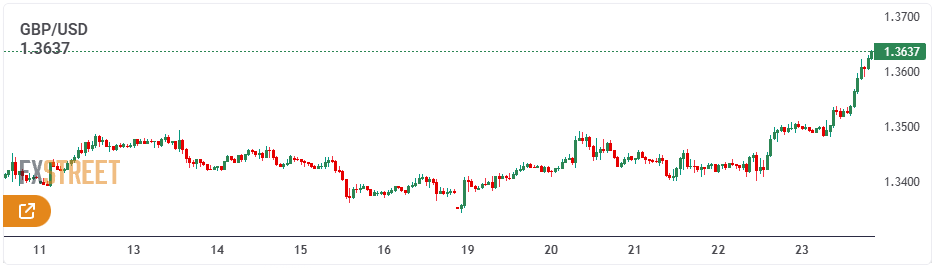
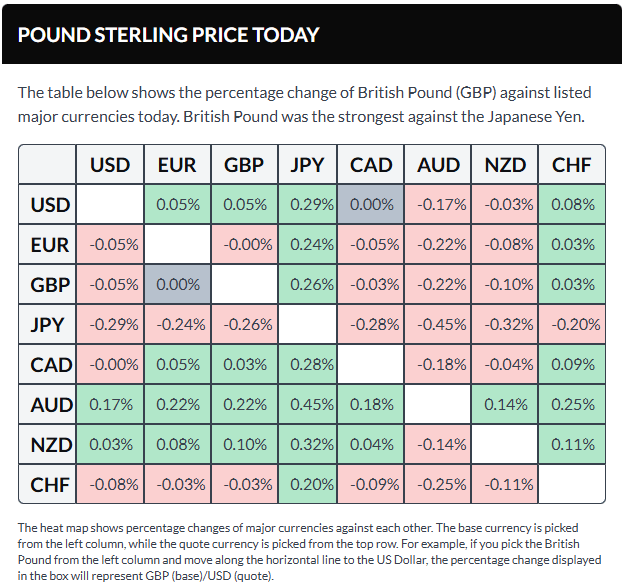
GBP/USD is trading near 1.3600 ahead of the Bank of England’s monetary policy announcement on Thursday. Governor Andrew Bailey’s subsequent press conference is expected to shed further light on the central bank’s outlook for interest rates. UK data releases include the final January S&P Global PMIs and the Halifax House Price Index.
USD/JPY is holding close to the 154.50 level, paring earlier gains after Tokyo CPI data indicated easing inflation in January. Headline inflation slowed to 1.5% year-over-year from 2% in December, while core measures eased to 2%, undershooting forecasts. The softer inflation profile reduces pressure on the Bank of Japan to tighten policy.
USD/CAD is trading around 1.3580, with the Canadian Dollar maintaining a slight edge against the greenback despite data showing economic stagnation in November. Monthly GDP was flat following a 0.3% contraction in the prior month and fell short of expectations for modest growth. Upcoming Canadian releases include January S&P Global PMIs and the Ivey PMI.
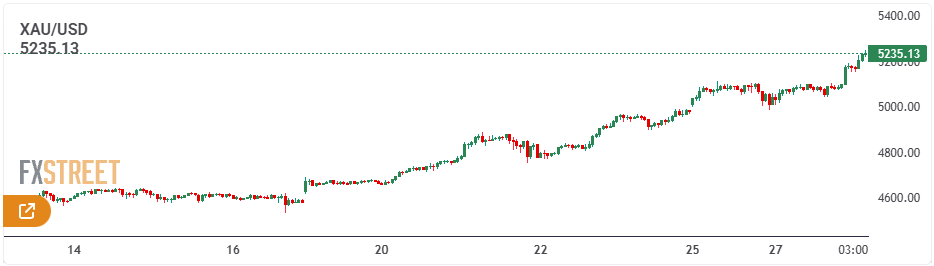
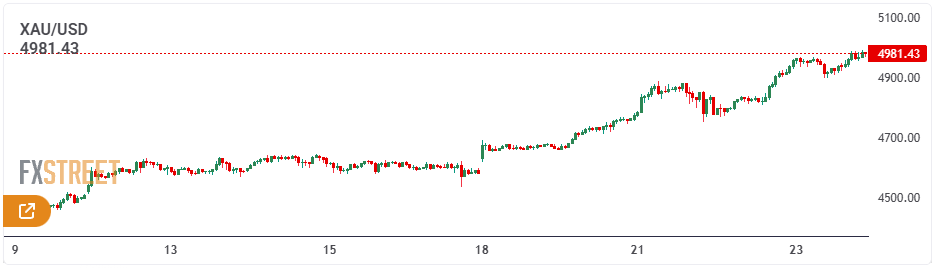
Gold is trading near the $4,880 area after surrendering all weekly gains. Prices retreated from a record high of $5,598 as profit-taking emerged and the US Dollar strengthened sharply.
Looking ahead: Emerging views on the economic outlook
Scheduled central bank speakers for the week:
Monday, February 2: – Bank of England’s Breeden – Federal Reserve’s Bostic
Tuesday, February 3: – Federal Reserve’s Barkin
Wednesday, February 4: – Federal Reserve’s Cook
Thursday, February 5: – Bank of England Governor Andrew Bailey – Federal Reserve’s Bostic – Bank of Canada Governor Tiff Macklem
Friday, February 6: – European Central Bank’s Cipollone – European Central Bank’s Kocher – Bank of England’s Pill – Federal Reserve’s Jefferson
Central bank meetings and upcoming data set to influence monetary policy decisions
Key economic data and policy events for the week:
Monday, February 2: – Germany’s December Retail Sales – US ISM Manufacturing PMI
Tuesday, February 3: – Reserve Bank of Australia monetary policy decision – US December JOLTS job openings
Wednesday, February 4: – Eurozone January Harmonized Index of Consumer Prices (HICP) – US January ADP employment report
Thursday, February 5: – Australia’s December trade balance – Eurozone December retail sales – Bank of England monetary policy decision – European Central Bank monetary policy decision
Friday, February 6: – Canada’s January employment change – US January nonfarm payrolls – US February Michigan consumer sentiment
Here is what you need to know on Friday, January 30:
Markets were driven early Friday by the latest political and geopolitical developments linked to US President Donald Trump, as investors focused on the announcement of his pick for Federal Reserve Chair. Bloomberg reported that the Trump administration is preparing to nominate former Fed Governor Kevin Warsh for the role as early as Friday morning in the US.
At the same time, the Wall Street Journal noted that President Trump and Senate Democrats have reached an agreement to avoid a government shutdown.
Together with profit-taking and the Federal Reserve’s recent decision to keep interest rates unchanged, these developments helped revive demand for the US Dollar (USD), pushing it up from four-year lows against its major counterparts.
Despite the rebound, the US Dollar remains on course for a second consecutive weekly decline, weighed down by concerns over President Trump’s unpredictable foreign policy stance and repeated challenges to the Federal Reserve’s independence.
On Thursday, Trump threatened to levy a 50% tariff on all aircraft exported from Canada to the United States, accusing Ottawa of unfairly restricting the certification of Gulfstream business jets.
Reuters also reported that Trump plans to hold talks with Iran, even as the Pentagon readies for potential military action and the US steps up its naval presence in the Middle East.
In addition, the White House confirmed that Trump signed an executive order authorizing tariffs on countries that supply oil to Cuba.
Looking ahead, market attention remains firmly on Trump’s nomination of the next Fed Chair, along with the upcoming US Producer Price Index (PPI) release, which could shape the Dollar’s next move.
Before that, preliminary fourth-quarter 2025 GDP data from Germany and the Eurozone are expected to draw investor interest.
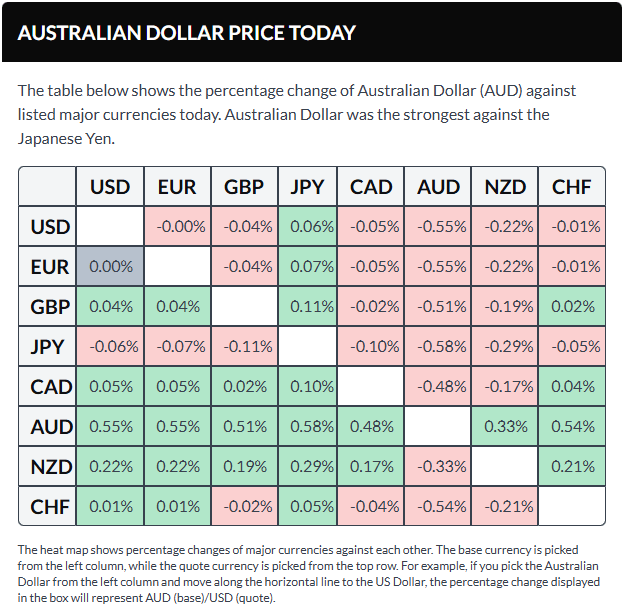
In G10 currencies, AUD/USD remains under heavy pressure below the 0.7000 mark amid profit-taking ahead of a likely Reserve Bank of Australia (RBA) rate hike next week. USD/JPY hovers near 154.00, with the Japanese Yen staying weak after softer Tokyo CPI data reduced expectations for an early Bank of Japan (BoJ) rate increase.
EUR/USD pares losses to reclaim the 1.1900 level, though downside risks persist ahead of key German and Eurozone GDP releases. GBP/USD continues to consolidate around 1.3750, weighed down by the ongoing recovery in the US Dollar.
In commodities, Gold slides nearly 4% to trade around $5,200 in early European hours after briefly testing the $5,100 level during the Asian session. Meanwhile, WTI crude oil extends its retreat from five-month highs near $66.25, trading close to $64 as Trump signals openness to talks with Iran.
Germany’s Federal Statistics Office will publish preliminary fourth-quarter GDP figures at 09:00 GMT on Friday, followed by Eurostat’s release of flash Eurozone GDP data at 10:00 GMT for the same period.
Germany’s economy is expected to expand by 0.2% quarter-over-quarter in Q4, rebounding from stagnation in the previous quarter, while annual growth is forecast to remain unchanged at 0.3%. At the Eurozone level, seasonally adjusted GDP is projected to grow by 0.2% QoQ in the fourth quarter, down from 0.3% previously, with year-over-year growth seen moderating to 1.2% from 1.4%.
How might Germany and the Eurozone’s Q4 GDP data influence the EUR/USD exchange rate?
The EUR/USD pair may face downside pressure if Germany and Eurozone GDP figures come in line with forecasts. Investors will also closely monitor December unemployment data from both regions, as well as Germany’s Consumer Price Index (CPI for January).
ECB policymaker Martin Kocher cautioned that additional strength in the Euro could lead the central bank to restart interest-rate cuts. After his remarks, market expectations for a summer rate reduction edged higher, with the implied probability of a July cut increasing to roughly 25% from around 15%. The ECB is set to meet next week and is broadly expected to leave interest rates unchanged.
Meanwhile, EUR/USD is under strain as the US Dollar gains traction amid speculation that US President Donald Trump may nominate former Federal Reserve Governor Kevin Warsh as the next Fed Chair. Trump indicated late Thursday that he would reveal his decision on Friday morning, with markets leaning toward Warsh, who is perceived as relatively hawkish.
From a technical perspective, EUR/USD is hovering near 1.1920 at the time of writing. Daily chart analysis continues to point to a bullish bias, with the pair holding within an ascending channel. A move toward the upper channel boundary near 1.2050 is possible, followed by 1.2082, the highest level since June 2021. On the downside, initial support is seen at the nine-day Exponential Moving Average (EMA) around 1.1870, with further support near the lower boundary of the channel at approximately 1.1840.
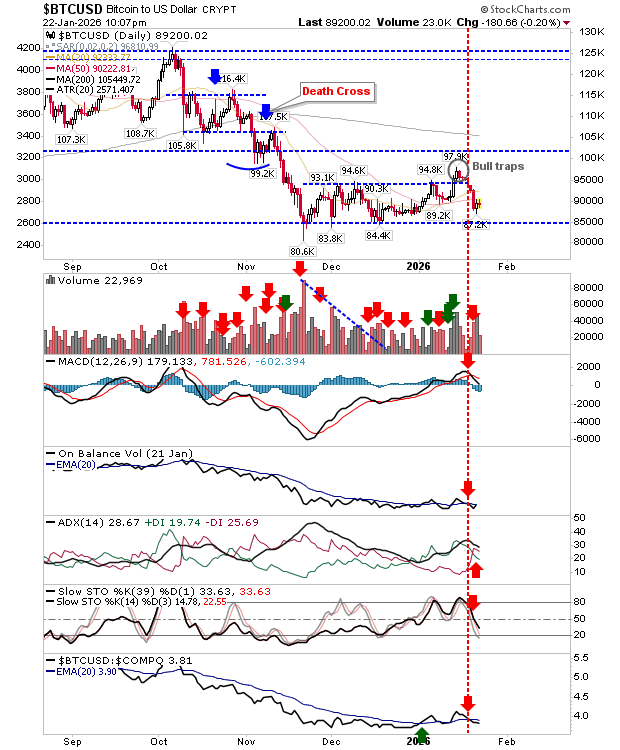
Bitcoin tumbled sharply on Friday, sliding to its lowest level in more than two months as forced liquidations swept through leveraged positions and investors assessed the potential implications of a change in U.S. Federal Reserve leadership.
The world’s largest cryptocurrency was last down 6.4% at $82,620.3 as of 02:15 ET (07:15 GMT). Prices touched an intraday low of $81,201.5, coming close to breaching the April lows had the selloff extended further.
Crypto Markets See $1.7 Billion in Liquidations
Data from CoinGlass showed that roughly $1.68 billion in leveraged positions were liquidated over the past 24 hours amid the selloff, with about 93% of those losses coming from long positions—traders positioned for higher prices.
Approximately 270,000 traders saw their positions forcibly closed, intensifying the decline across Bitcoin and the broader digital asset market.
Liquidations occur when exchanges automatically shut leveraged positions that fail to meet margin requirements as prices move against traders, a dynamic that often amplifies volatility and accelerates downside moves in risk-on markets.
Traders Watch Trump’s Pick for Fed Chair
Friday’s selloff coincided with rising market unease over U.S. monetary policy leadership. President Donald Trump said he would announce his choice to replace Federal Reserve Chair Jerome Powell on Friday morning, fueling speculation that former Fed Governor Kevin Warsh could be nominated for the role. Reports indicate the White House is preparing to put Warsh forward as the next Fed chair.
Warsh is widely viewed as favoring a tighter approach to the Fed’s balance sheet and overall policy stance, a shift that could drain liquidity that has supported risk assets, including cryptocurrencies.
Markets have responded with broader risk-off positioning, a firmer U.S. dollar, and rising yields, while crypto prices have come under renewed pressure. Central bank policy direction plays a crucial role in shaping interest rates, liquidity, and risk-asset valuations—key drivers for high-beta assets such as Bitcoin.
Altcoins Slide as Ether and XRP Fall 7%
Most altcoins also slumped on Friday as liquidation-driven selling rippled through the market.
Ethereum, the world’s second-largest cryptocurrency, fell more than 7% to $2,749.92, while XRP, the third-largest, also dropped 7% to $1.75.
Elsewhere, Solana slid 6.5%, Cardano plunged 8%, and Polygon retreated by more than 5%.
Among meme tokens, Dogecoin declined 6%, while $TRUMP fell 3.5%.
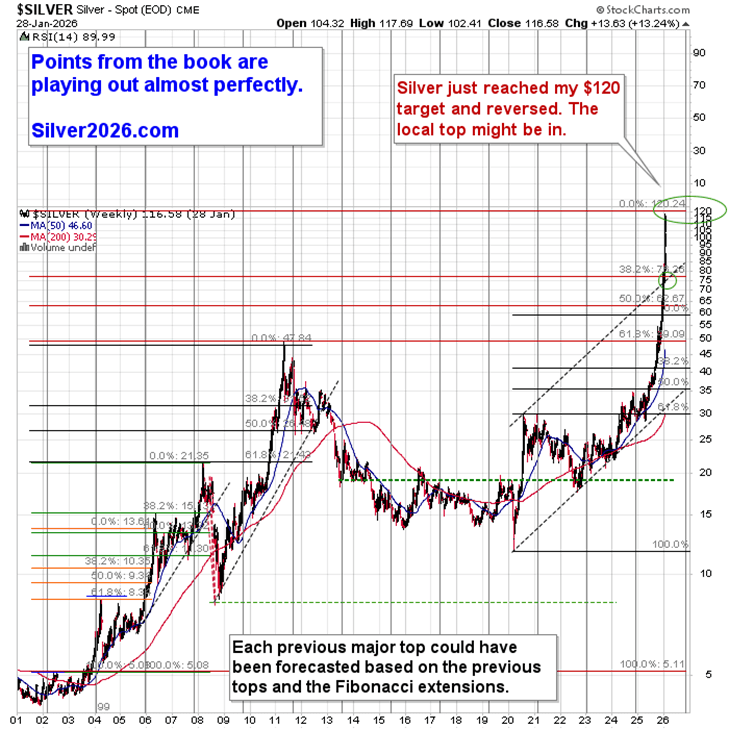
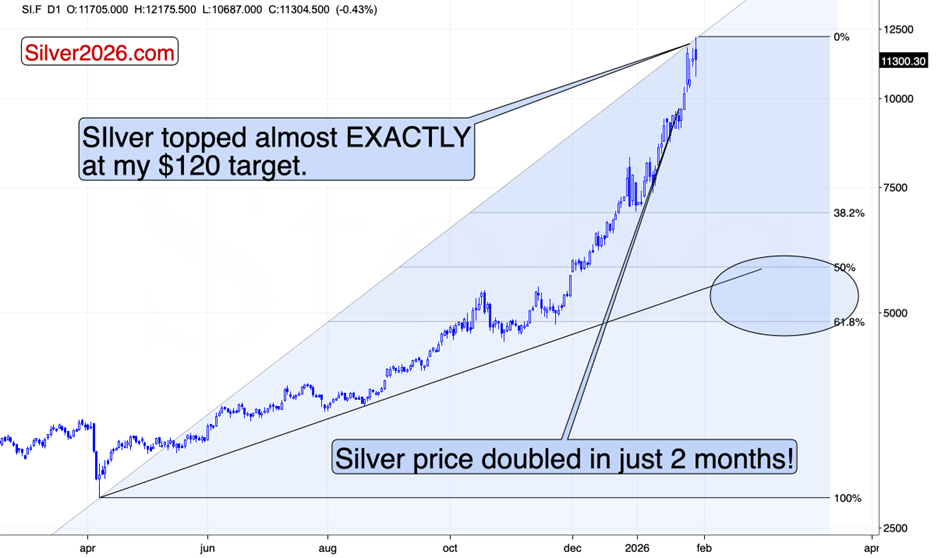
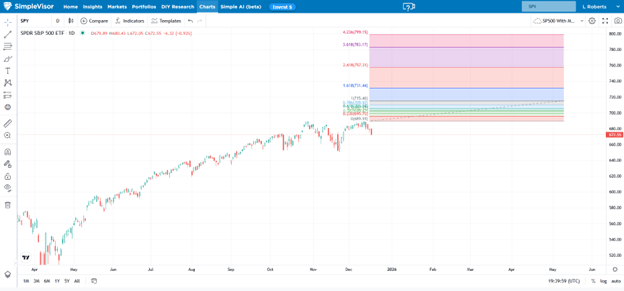
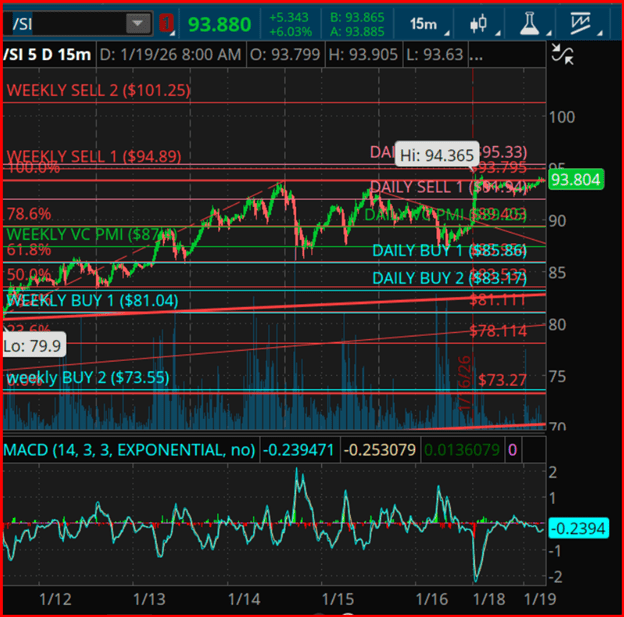
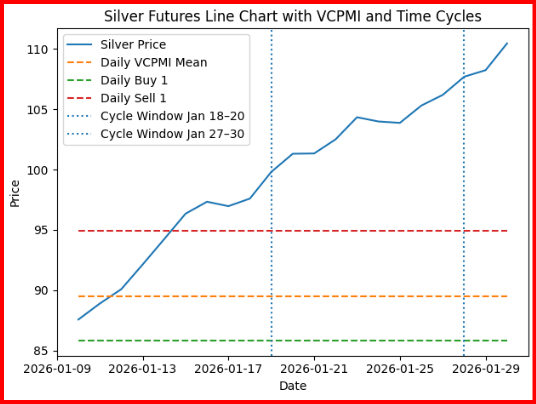
I’ve been highlighting a $120 target for silver for months, most recently again on Monday. In fact, the first time I presented the chart projecting $120 as a long-term objective was years ago. That level has now been reached.
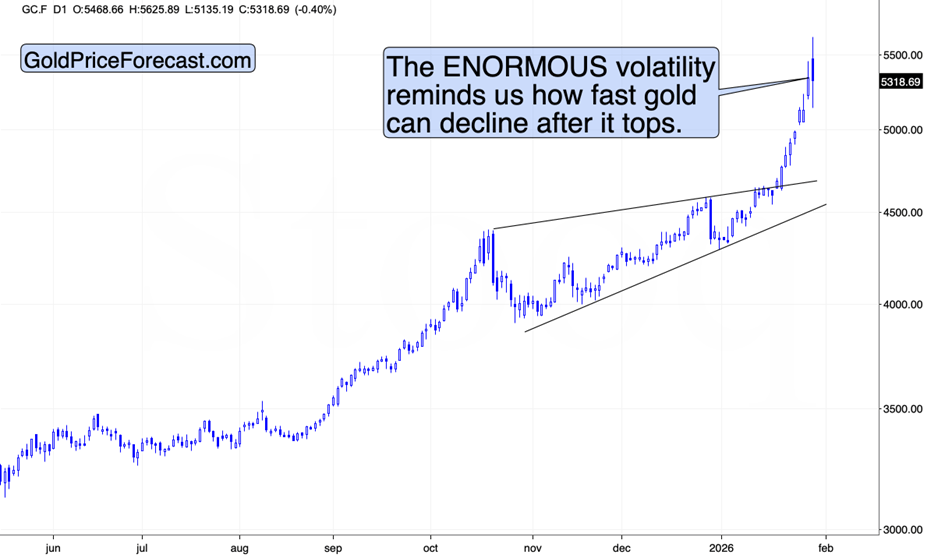
Silver futures peaked at $121.75 before plunging below $107, eventually stabilizing near $110. The magnitude of the intraday reversal is a stark reminder that the white metal can fall even faster than it rises.
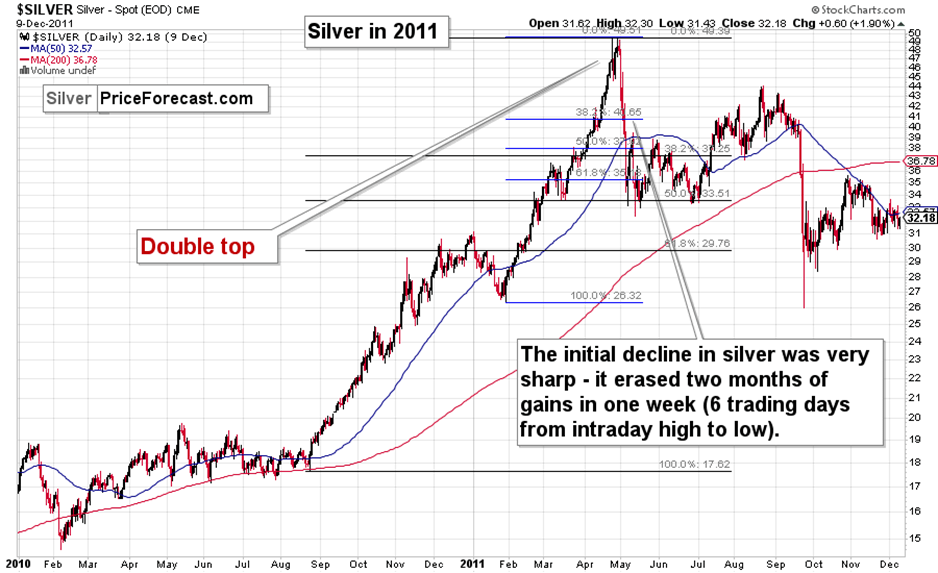
Recall that in 2011, silver erased two months of gains in just six trading days. If history were to repeat, prices would be sitting just above $50 before Valentine’s Day. Possible? Yes—but the decline doesn’t need to be nearly as violent.
A Potential Top Forming in Silver
That said, it’s still possible silver pushes higher in the near term. The metal didn’t collapse by tens of dollars—it was simply extremely volatile earlier today. However, with the long-term target now achieved, and considering conditions in the U.S. Dollar Index and the broader equity market, there’s a growing case that silver may have just put in a top.
The equity market may be especially critical in this context. The recent rebound in the U.S. Dollar Index failed to spark meaningful declines in precious metals, but today’s selloff in equities triggered much sharper downside moves. That contrast is an important signal.
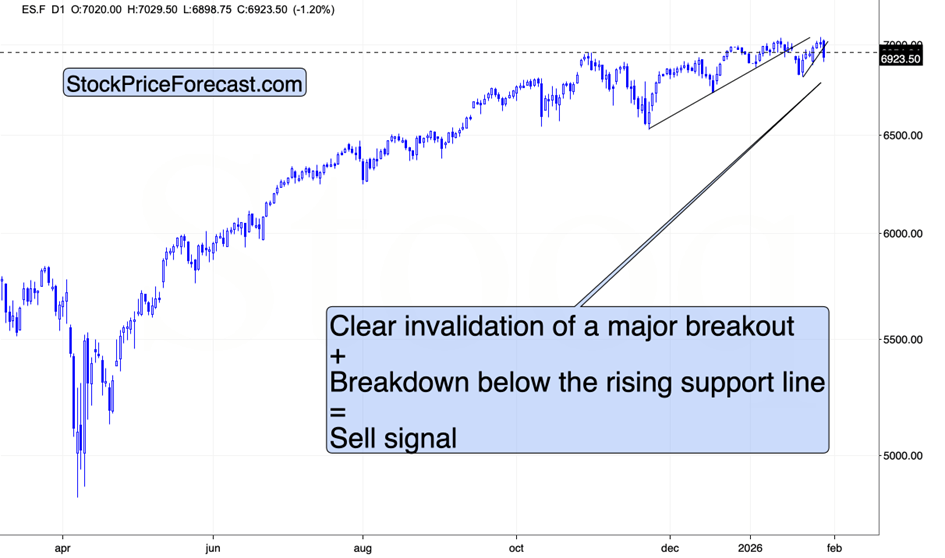
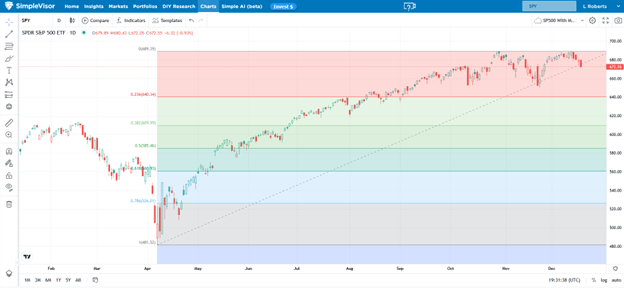
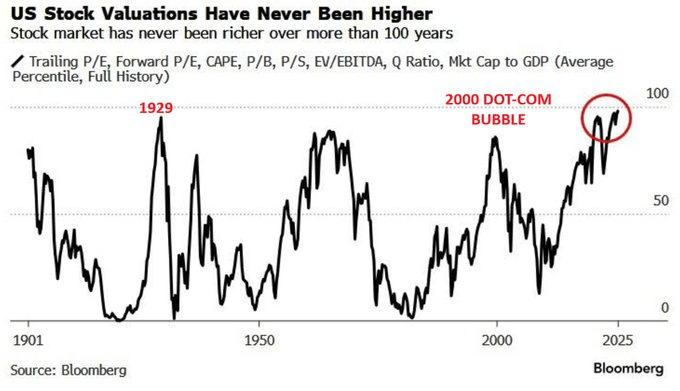
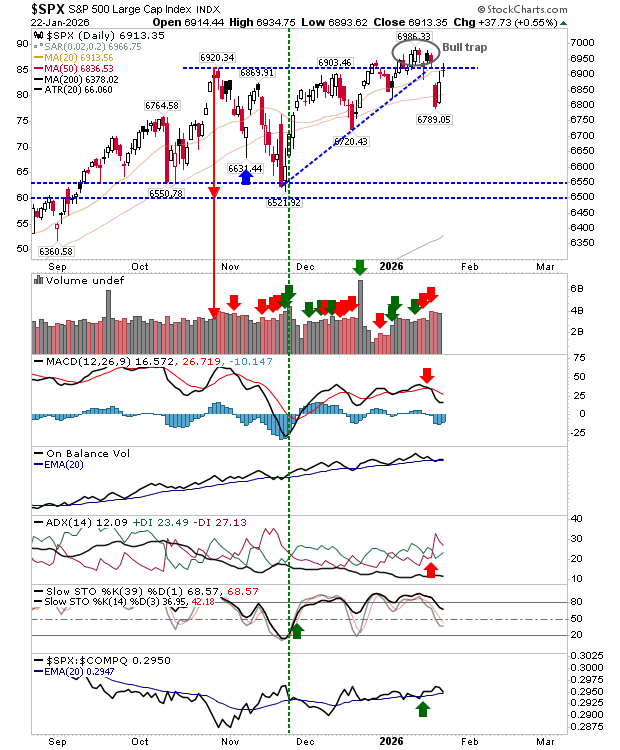
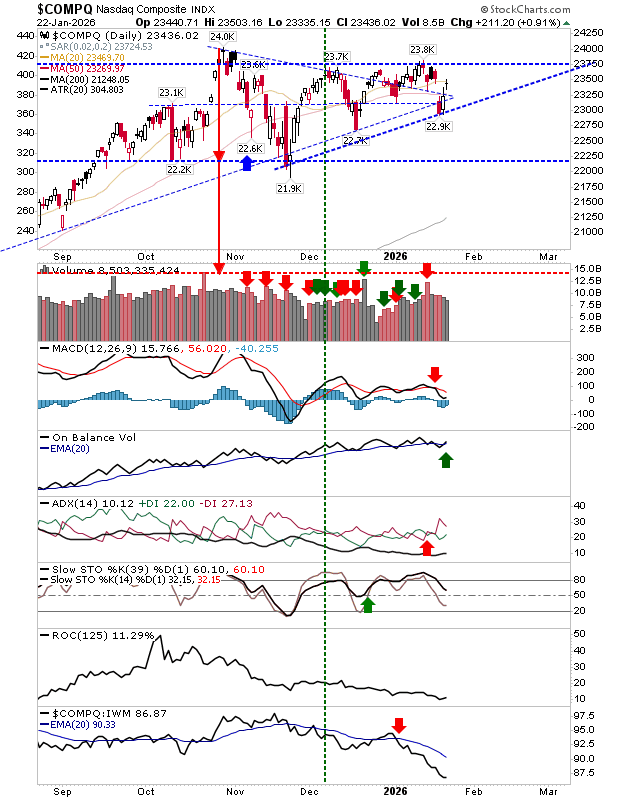
Stocks have once again been unable to hold above their 2025 highs, suggesting the rally may be exhausted. While this is another in a series of similar invalidations, the magnitude of today’s intraday decline in precious metals hints that this episode could be different.
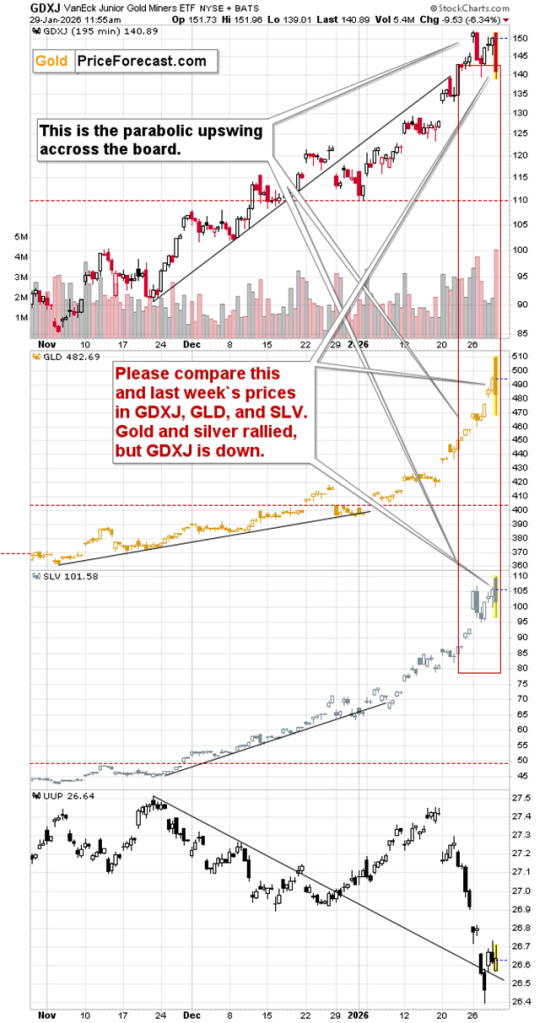
Adding to the cautionary tone, short-term weakness in mining stocks is also notable.
I highlighted the red rectangle to illustrate how current prices in GLD, SLV, and GDXJ compare with last week’s levels. In short, gold and silver are higher, while miners are lower—exactly the type of divergence that often marks the end of a rally.
Bitcoin Selloff Gains Momentum
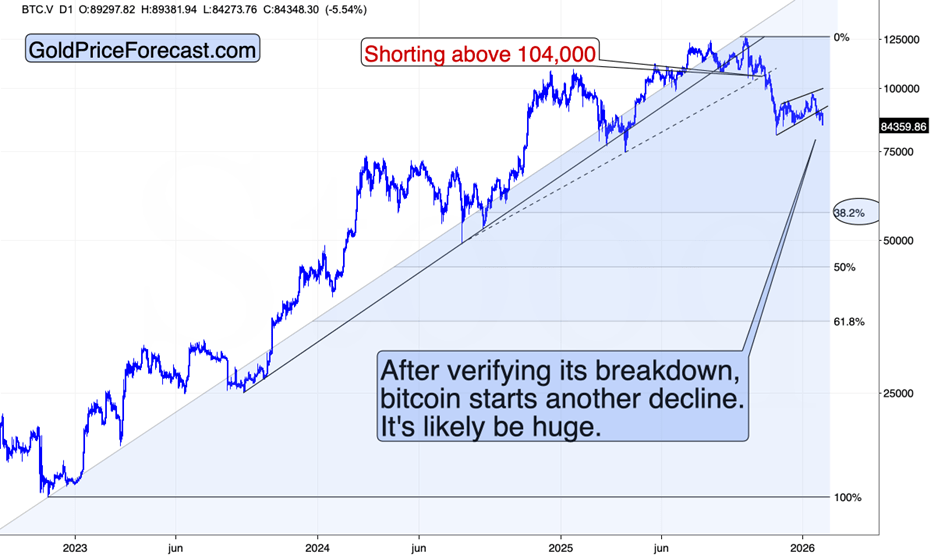
Another important signal is the accelerating decline in Bitcoin.
After confirming its breakdown below the flag pattern, Bitcoin fell roughly 5% today.
I previously noted that for those not yet short Bitcoin, this represented an attractive opportunity to initiate or add to positions if sizing felt insufficient. From a risk–reward perspective, that view still stands. The so-called “new gold” was perched at the edge—and has now taken its first decisive step lower.
Last but not least—gold. The yellow metal initially surged, only to reverse sharply, plunging nearly $500 on an intraday basis. When I first became interested in the precious metals market many years ago, gold’s entire nominal price was well below that amount. Time flies—and so has the price of gold. That said, it appears gravity may be about to reassert itself once again.
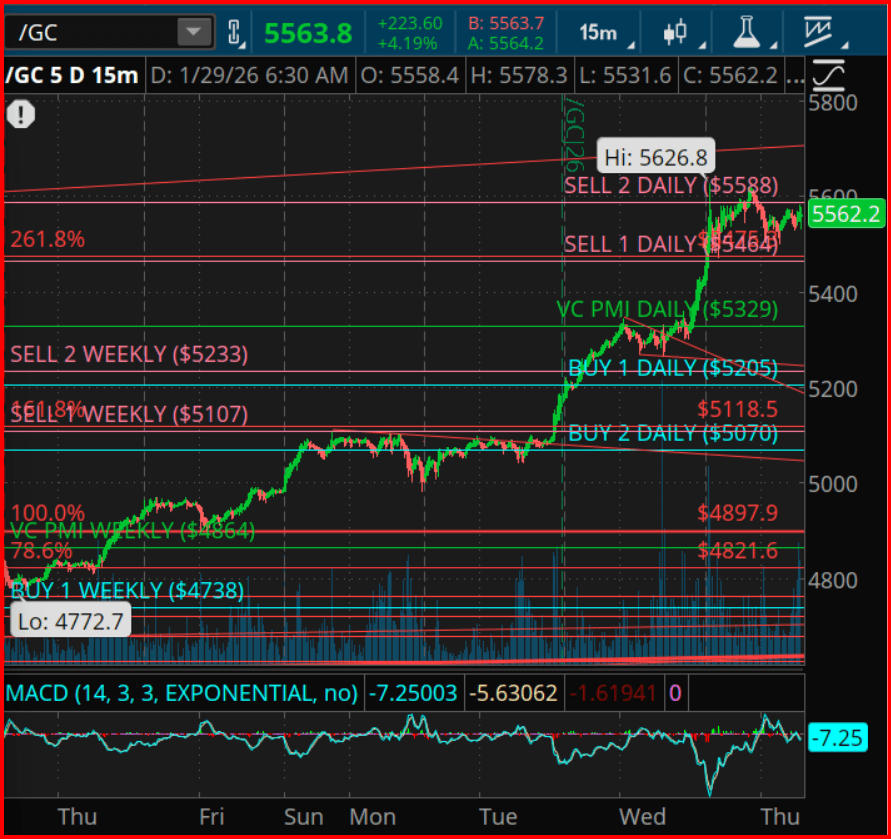
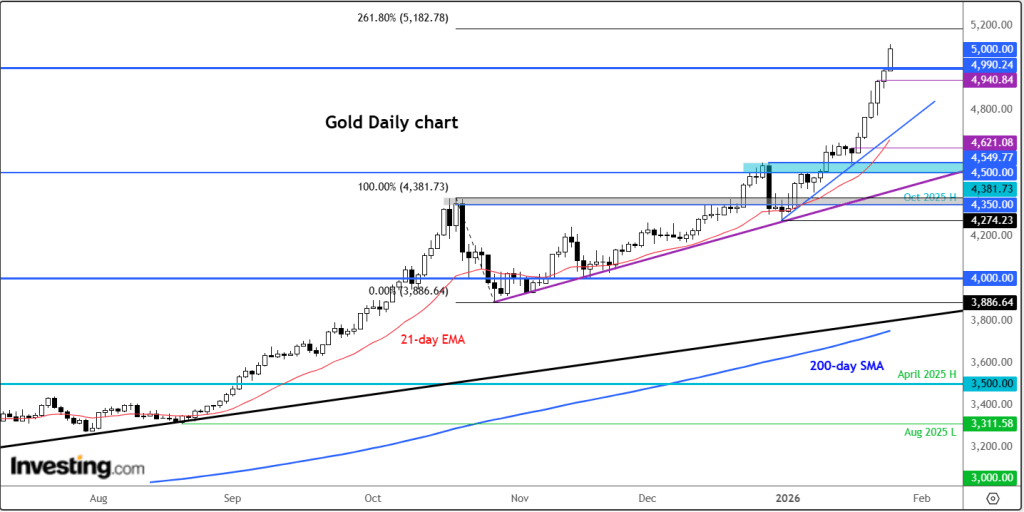
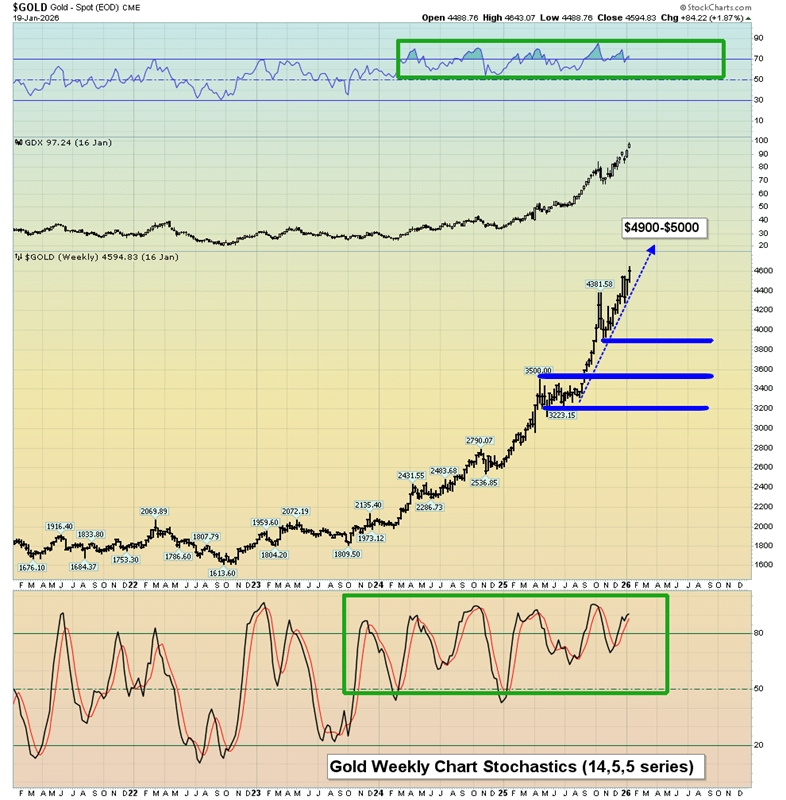
Gold futures continue to show strong bullish momentum, holding well above the VC PMI Daily Pivot near $5,329, reinforcing higher-timeframe trend alignment across both daily and weekly cycles. The sharp, near-vertical advance that began earlier this week is characteristic of classic “escape velocity” behavior, with price accelerating away from the mean during a synchronized time-and-price harmonic window.
Within the VC PMI framework, price is now rotating inside the upper volatility band. Daily Sell 1 near $5,465 defines the first layer of structural resistance, while Daily Sell 2 around $5,588 marks the outer boundary of the current expansion envelope. The recent intraday peak near $5,626.8 indicates price is pressing into a late-stage extension phase, where probabilities begin to shift toward consolidation or orderly mean reversion rather than continued vertical advance.
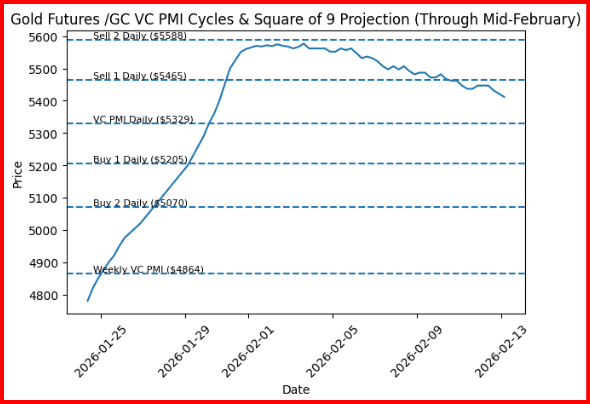
Square of 9 geometry supports this view. Angular projections from the latest weekly VC PMI Pivot near $4,864 project resistance harmonics into the $5,560–$5,620 region, closely overlapping with the Daily Sell 2 band. This confluence of time, price, and geometric resistance elevates the likelihood of a near-term inflection window.
On the downside, rotational support remains layered at Daily Buy 1 near $5,205 and Daily Buy 2 near $5,070, with deeper mean support at the weekly VC PMI Pivot around $4,864 should downside volatility expand.
Cycle analysis further identifies a key timing cluster between January 29 and February 2, derived from overlapping 30-day and 60-day harmonics. Historically, such windows tend to resolve momentum conditions via either range compression or a counter-trend rotation back toward the VC PMI mean. Momentum indicators, including MACD divergence behavior, suggest upside efficiency is fading, reinforcing the risk of a pause or rotational pullback rather than immediate continuation.
From a strategic standpoint, trend-following participants may continue to trail protective stops below $5,205, while mean-reversion traders will look for rejection signals within the $5,560–$5,620 Square of 9 resistance arc. A sustained close above $5,588 would negate the near-term mean-reversion risk and reopen the path toward higher geometric extensions.
Markets absorbed last night’s FOMC decision without much surface reaction, but the takeaway was straightforward: the Fed is content to keep financial conditions accommodative. That stance weighed on the U.S. dollar and pushed yields lower, while gold and equities edged higher on solid earnings. In essence, the Fed did nothing to challenge the prevailing market narrative. Attention now shifts back to the charts, which are beginning to tell a compelling story.
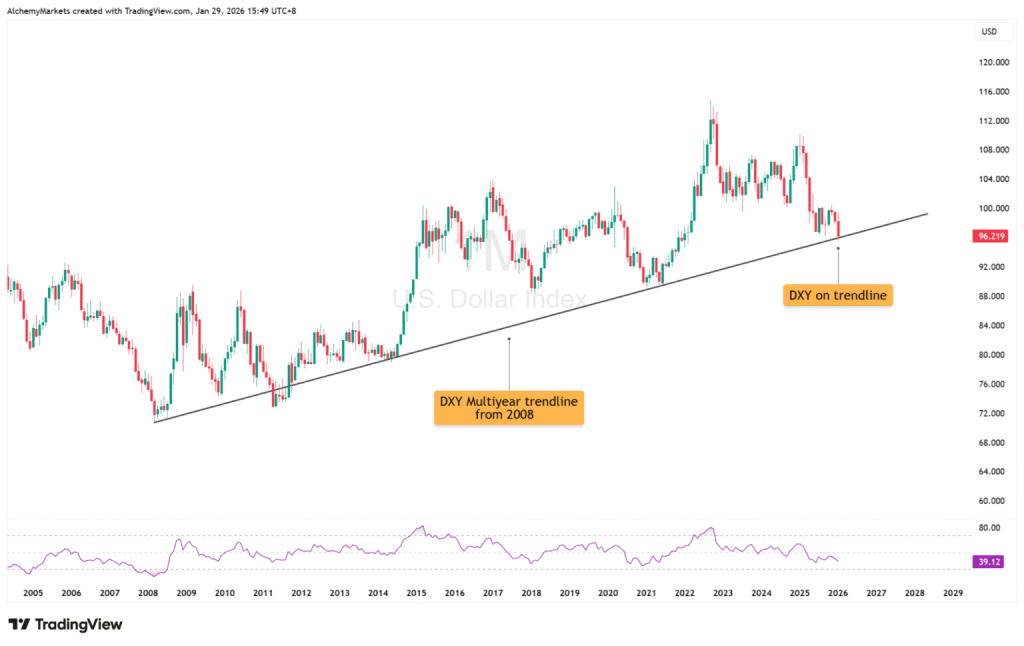
Is It Possible? DXY Slips Back to Its 2008 Trendline
The DXY has drifted back into a long-term monthly trendline zone that has previously served as a key structural floor. For now, this move represents a test rather than a confirmed breakdown.
What matters next:
A decisive weekly close below this support area would confirm a genuine structural breakdown. Conversely, if the DXY stabilizes and rebounds, it would be an early signal that the crowded “short USD” trade may be vulnerable to a squeeze.
This is precisely the kind of setup where long-term sentiment can be right, yet short-term positioning gets punished.
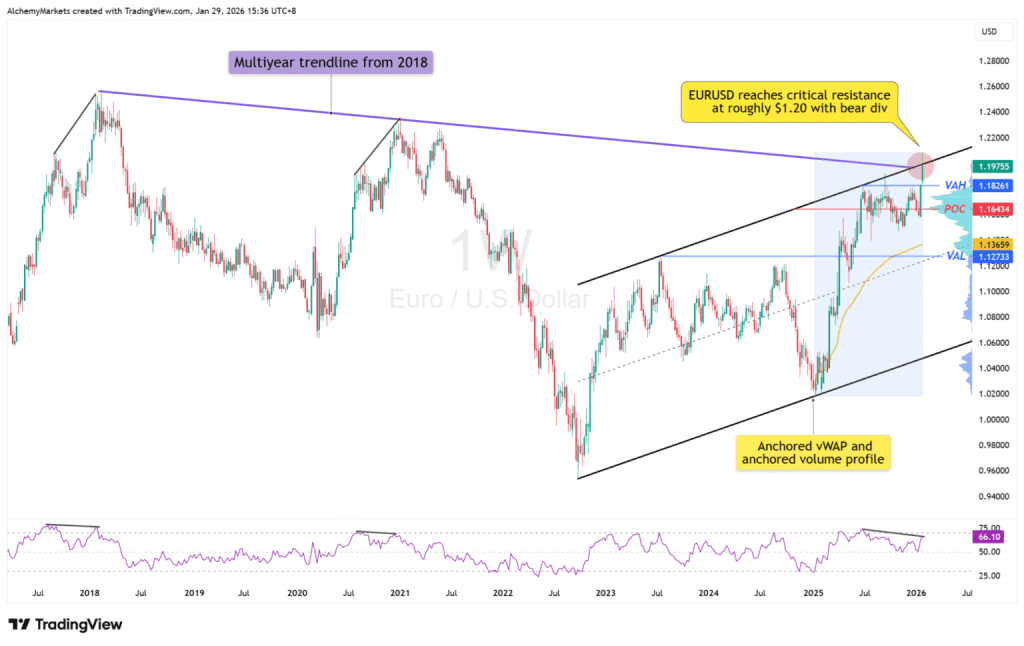
EUR/USD Points to a Near-Term Pause as the Dollar Regains Some Strength
EUR/USD is pushing into a dense resistance cluster, including the 1.20 psychological level, a multi-year trendline, channel alignment, and a bearish divergence on the weekly RSI.
That combination typically leads to at least a pause or pullback, even if the longer-term bias remains bullish for EUR/USD (and bearish for the dollar). If EUR/USD does roll over, it would offer the cleanest “risk-on USD bounce” setup without having to guess.
Key takeaway: A stall in EUR/USD here gives the DXY room to breathe.
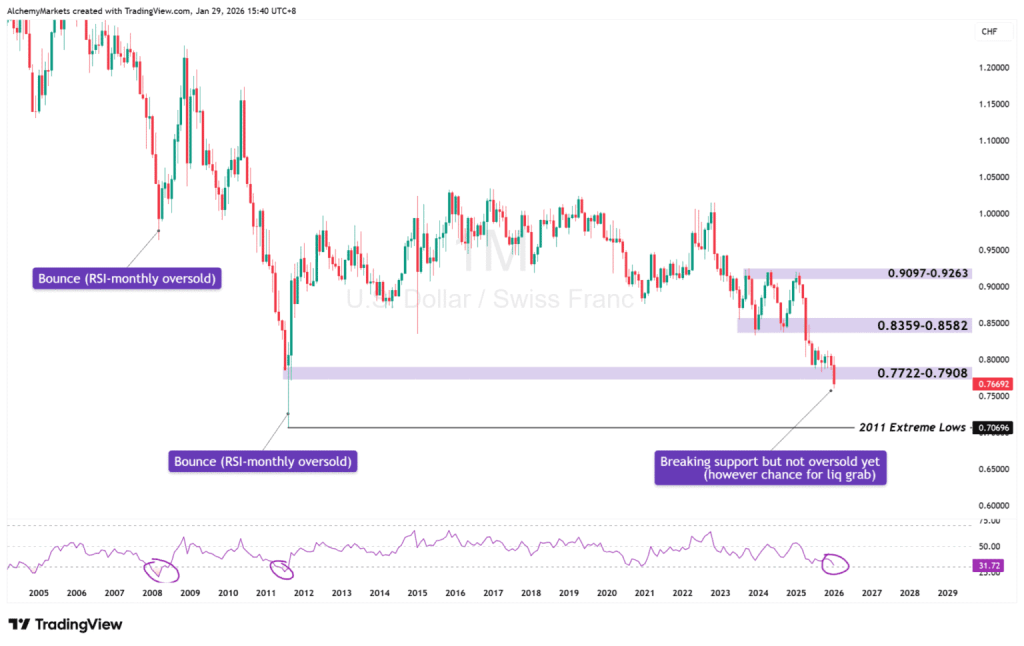
USD/CHF Is Also Trading at Extreme Levels
USD/CHF is one of the clearest expressions of U.S. dollar pessimism. When it reaches extreme levels, two patterns typically emerge: downside momentum begins to fade as the trade becomes crowded, and volatility increases as even minor catalysts trigger repositioning.
Even if dollar weakness persists, this is a zone where smooth continuation should no longer be assumed.
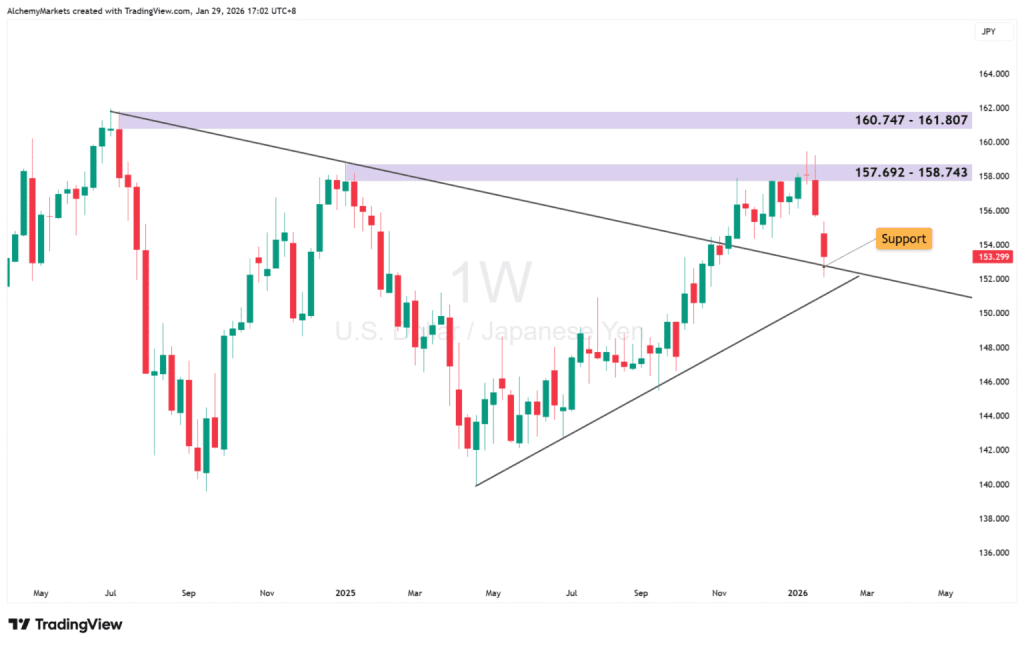
USD/JPY: A Key Pressure Zone for a Potential Dollar Reversal
USD/JPY is where macro theory collides with market reality. If a meaningful USD squeeze is going to materialize, this pair is almost certain to play a role.
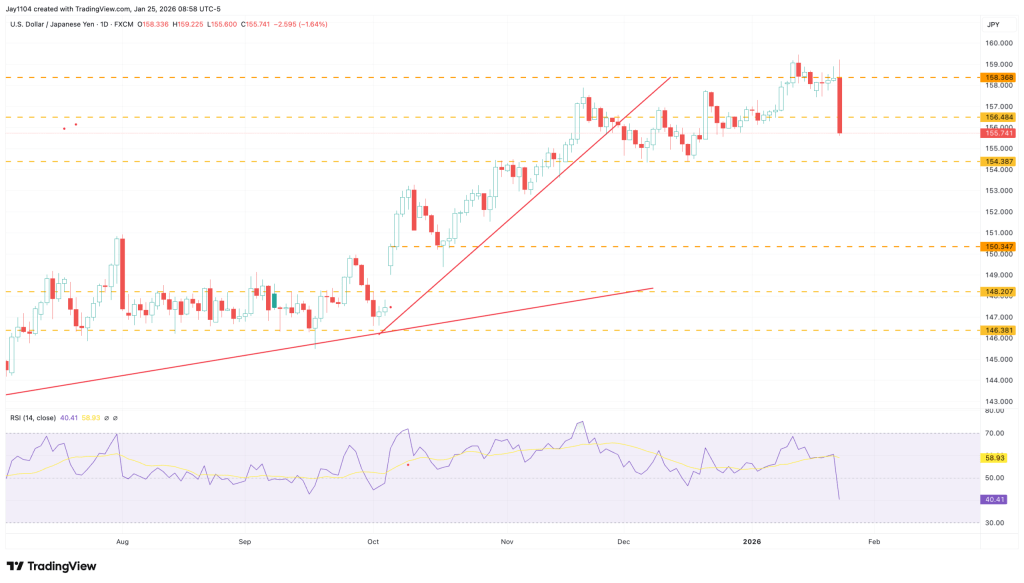
On the weekly chart, USD/JPY is interacting with a major structural pivot, pulling back into a former resistance area that is now attempting to act as support around 151–153. For now, price has printed a wick at this support zone, suggesting USD/JPY may pause here before any further downside acceleration.
If this support holds, a rotation higher becomes increasingly plausible, with upside targets back toward the prior supply zones at 157.7–158.7, followed by 160.7–161.8.
That wouldn’t imply the start of a new USD bull market, but rather a crowded-trade unwind, especially with the current consensus loudly focused on a yen carry unwind and broad USD bearishness.
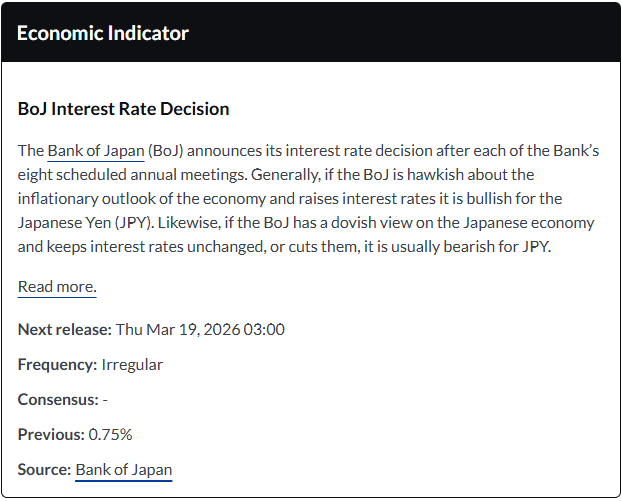
Bank of Japan Policy Decision
The next Bank of Japan policy meeting is scheduled for 18–19 March 2026, with market expectations largely aligned:
No rate hike is expected in March
Attention will center on guidance, messaging, and any indications of follow-through later in 2026
A continued bias toward verbal intervention and tactical signaling, rather than immediate or aggressive FX action
In short, the BOJ meeting is unlikely to be the catalyst itself. More often, it serves as the narrative justification after price has already picked a direction.
That’s why USD/JPY should be viewed as a leading indicator rather than a reactive trade. Focus on the key levels, and let positioning and price action do the talking.
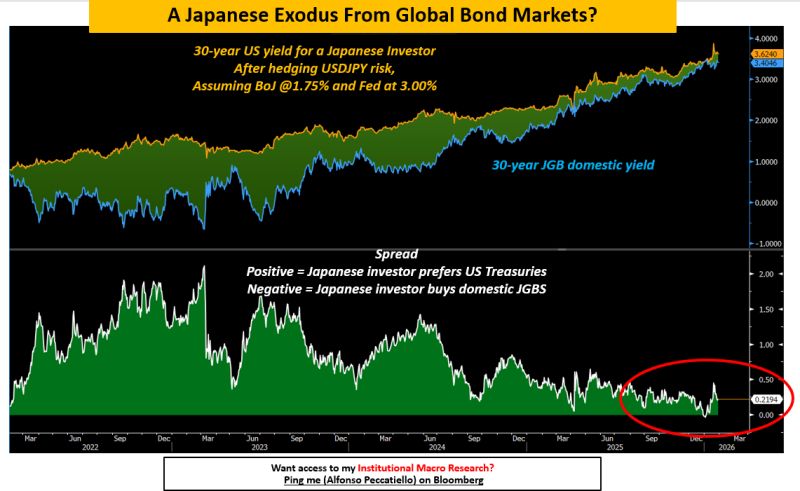
This may be the single most important chart in global bond markets right now.
Japanese investors rank among the world’s largest exporters of capital. Collectively, they hold a substantial share of European sovereign debt and U.S. Treasuries, with ownership running into the trillions of dollars. However, the economics underpinning these investments may soon begin to break down.
If that happens, Japan could see a meaningful repatriation of capital—away from foreign bond markets and back into domestic fixed-income assets.
The consequences for both global bond yields and currency markets would be significant. To understand why, it helps to look at the basic math.
The chart compares the 30-year Japanese government bond yield (blue) with the hedged yield on the 30-year U.S. Treasury (orange), adjusted for USD/JPY currency-hedging costs. The scenario assumes the Bank of Japan gradually lifts policy rates toward 1.75%, while the Federal Reserve cuts rates to around 3% over time.
Note how the two yields are now converging.
At current levels, Japanese investors gain little—if any—advantage from purchasing 30-year U.S. Treasuries on a currency-hedged basis versus simply holding long-dated Japanese government bonds at home. The picture becomes even more compelling when considering a longer-standing behavior.
For years, Japanese investors have also allocated heavily to foreign bonds without hedging currency risk—and for a clear reason.
The prevailing assumption was that the yen would continue to depreciate, allowing Japanese investors to benefit not only from higher foreign yields but also from favorable FX moves.
Earn higher yields in foreign bond markets
Gain additional returns from yen depreciation
With the United States signaling its willingness to prevent further yen weakness, and Japanese bond yields having risen sharply, this long-standing equation no longer holds.
Should Japanese investors begin to scale back capital outflows to overseas bond markets, the ripple effects across global bond yields and currency markets could be substantial.
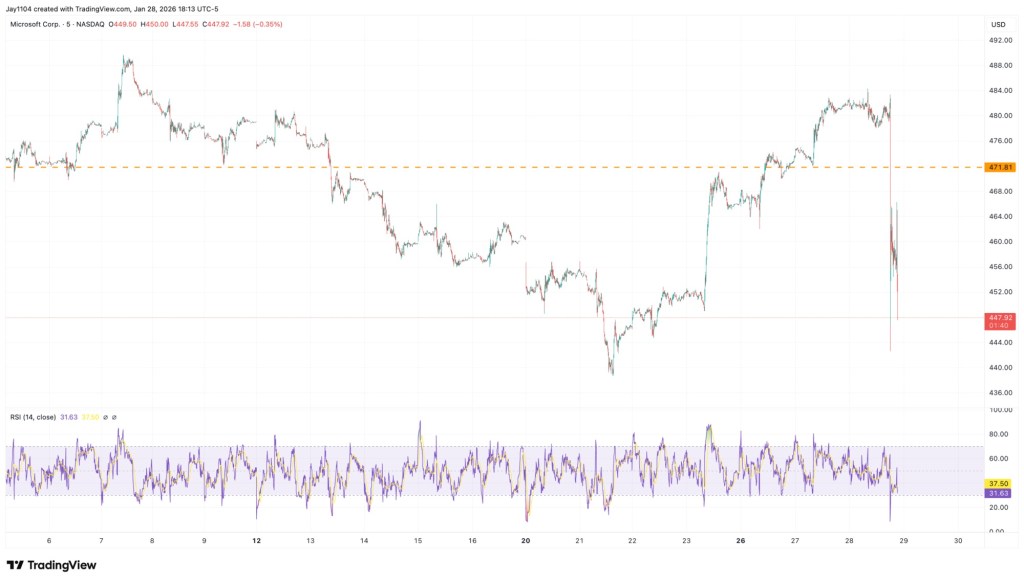
A sharp pullback in Microsoft (MSFT) has cascaded into a broader market correction. While the company beat earnings expectations on both the top and bottom lines, investors were disappointed by slower cloud performance and higher-than-anticipated capital expenditure plans. Microsoft shares have fallen 11.8% on the day (-12.3% YTD, -4.1% LTM), dragging the broader technology sector lower.
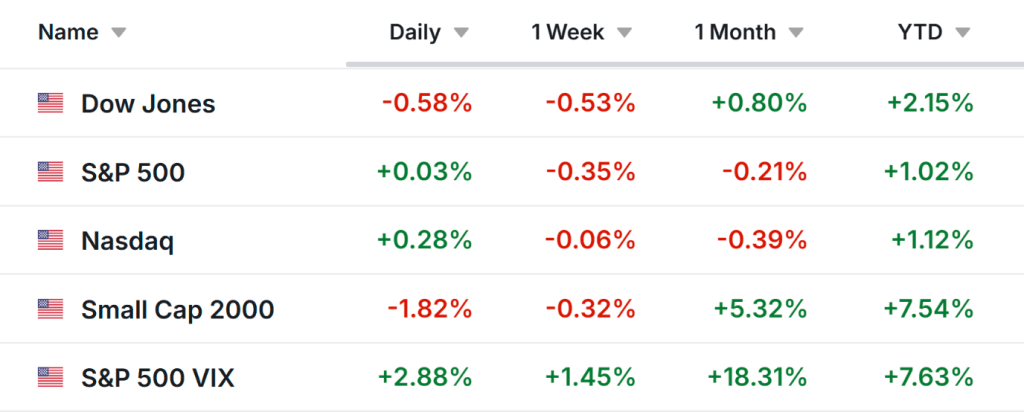
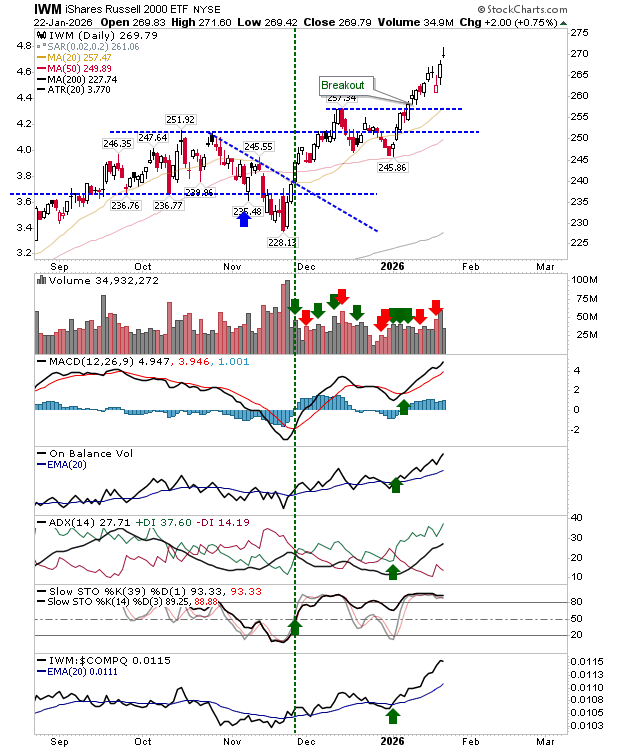
The NASDAQ slid 2.3%, with semiconductor stocks posting similar losses. The Magnificent Seven index declined 1.6%, pulling the S&P 500 down 1.3%, although the equal-weighted S&P slipped just 0.3%. The Dow Jones Industrial Average fell 0.4%, while the Russell 2000 dropped 1.1% in sympathy. Market volatility picked up, with the VIX jumping to 19.4.
Adding to the pressure, precious metals sold off, with gold down 2.2% and silver falling 3.5%. By contrast, copper surged 3.4% to a fresh all-time high of $6.58. Crude oil rallied 3.7% to $65.20 per barrel—after briefly touching $66.50—marking a gain of more than 10% over the past week amid rising risks of conflict involving Iran, the highest level since June 2025. Natural gas and gasoline prices also moved higher.
Risk-off sentiment was further evident in cryptocurrencies, with Bitcoin sliding 5% to below $85,000, its lowest level in a year.
Bond markets remained relatively calm. The U.S. 2-year yield eased 2 basis points to 3.55%, while the 10-year slipped 1 basis point to 4.23%. International yields, including those in Japan, were largely unchanged, and the U.S. dollar index was flat on the session.
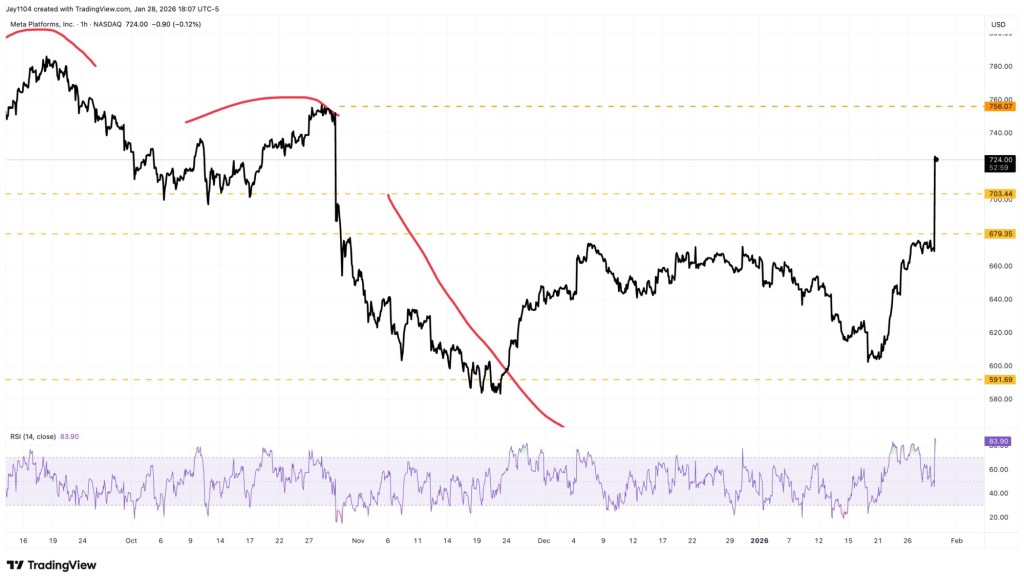
Overall, the market damage remained concentrated in technology and basic materials. Energy stocks advanced, and communication services outperformed, supported by strength in Meta Platforms (META). Meta shares jumped 7.6% following solid earnings beats and a well-received conference call, lifting the stock to gains of 9% year-to-date and 6.3% over the past 12 months. Meanwhile, consumer staples, utilities, industrials, financials, and real estate sectors all traded in positive territory.
This selloff increasingly looks like a textbook buying opportunity, with early signs of a rebound already emerging across the major equity indexes. Another factor weighing on sentiment is the renewed risk of a government shutdown, which is especially challenging given the ongoing data blackout following last year’s record-length shutdown.
While the recent swing—from the S&P 500 touching 7,000 just yesterday to bottoming near 6,870 today—represents a level of volatility that has unsettled some investors, the fundamental backdrop of the economy remains solid. Volatility has clearly picked up, but the broader trend continues to point higher.
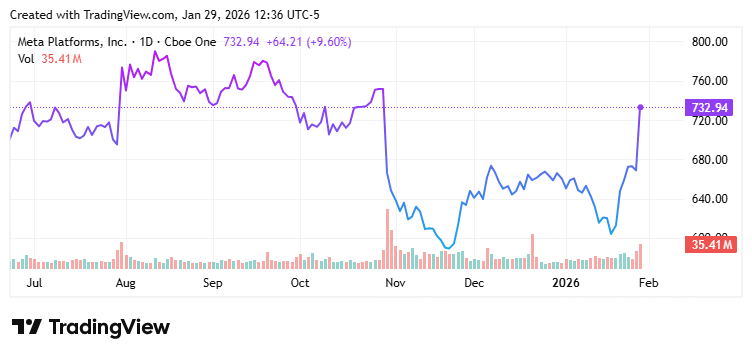
After spending months in the doldrums, Meta Platforms appears to have reshaped the narrative around its business. The Magnificent Seven stock slumped 11% in October following its third-quarter earnings release, as investors grew increasingly concerned about runaway spending on artificial intelligence.
That skepticism now looks to be fading after Meta’s fourth-quarter 2025 earnings report, released on Jan. 28. Shares climbed roughly 8% in after-hours trading by 7:00 p.m. ET, prompting investors to rethink the company’s outlook, with growth prospects increasingly overshadowing prior worries about spending.
Meta delivers strong earnings beat and upbeat guidance
In the fourth quarter, Meta reported revenue of $59.9 billion, representing growth of about 24% and comfortably exceeding expectations of $58.3 billion, or 21% growth. Adjusted earnings per share (EPS) came in at an impressive $8.88, up nearly 11% year over year and well above the consensus estimate of $8.16.
The standout highlight, however, was Meta’s guidance for the first quarter of fiscal 2026. At the midpoint, the company forecasts revenue of $55 billion, far surpassing analysts’ expectations of $51.3 billion.
This outlook implies quarterly revenue growth of roughly 30%, which would mark Meta’s fastest expansion rate since the third quarter of 2021. Such an acceleration is precisely what investors had been hoping for and offers further confirmation that the company’s investments in artificial intelligence are beginning to pay off.
Among Meta’s underlying performance metrics, growth in ad impressions delivered was particularly notable. The measure, which tracks the number of ads shown across Meta’s platforms, rose 18% during the quarter—its strongest pace in nearly two years. Chief Financial Officer Susan Li attributed this performance to robust user engagement and growth, highlighting that watch time on Instagram Reels increased 30% year over year, signaling a meaningful rise in platform engagement.
Stronger engagement is an encouraging signal for Meta, indicating that its AI-driven recommendation and ranking algorithms—responsible for determining what content users see and when—are becoming more effective. As these systems improve, users spend more time across Meta’s platforms, enabling the company to serve a greater volume of advertisements.
Markets shrug off higher-than-expected spending outlook
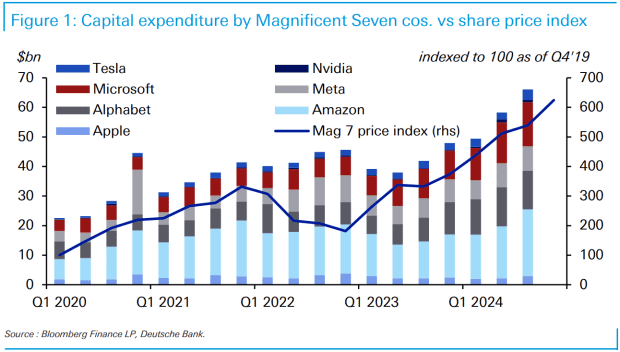
Expectations of sharply higher capital spending have been the key drag on Meta’s shares in recent months. Against that backdrop, the company’s latest CapEx guidance came in well above even elevated market expectations.
Meta now projects capital expenditures of $115 billion to $135 billion in 2026, compared with Wall Street estimates of roughly $110 billion. At the midpoint, this implies a 73% jump from 2025 CapEx of $72.2 billion.
In addition, Meta guided for total expenses of $162 billion to $169 billion in 2026, materially higher than consensus forecasts of around $150 billion.
Reading between the lines, however, reveals a crucial detail in Meta’s 2026 outlook. Management stated that “despite the meaningful step up in infrastructure investment, in 2026, we expect to deliver operating income that is above 2025 operating income.”
Since revenue equals operating income plus total expenses, this guidance allows for an implied revenue estimate. Meta generated $83.3 billion in operating income in 2025, and using the upper end of its 2026 expense guidance at $169 billion implies potential full-year revenue of roughly $252.3 billion.
That figure would represent about 25.5% growth from Meta’s 2025 revenue of $201 billion—well above the approximately 18.3% growth rate analysts had been projecting for 2026.
Growth eclipses spending concerns as Meta’s AI strategy gains traction
Although Meta’s expense guidance initially appeared to be the primary concern for investors, the company ultimately rose above those figures with exceptionally strong growth projections. While critics continue to argue that Meta has yet to produce a best-in-class general-purpose AI model, the company’s financial performance tells a compelling story.
Meta’s AI strategy is proving effective, driving faster growth in its core business of social media advertising. After a challenging stretch, Meta Platforms appears to have delivered precisely what was needed to restore investor confidence.
The Japanese yen edged lower after softer-than-expected Tokyo CPI data dampened expectations for an imminent Bank of Japan rate hike.
Persistent fiscal challenges and political uncertainty continued to pressure the currency, although fears of official intervention helped limit losses.
Meanwhile, concerns over the Federal Reserve’s independence could restrain any rebound in the U.S. dollar and cap gains in the USD/JPY pair.
The Japanese yen (JPY) came under renewed selling pressure during Asian trading on Friday after data showed consumer inflation in Tokyo, Japan’s capital, slid sharply to a near four-year low in January. The weaker inflation reading reduces urgency for the Bank of Japan (BoJ) to move toward near-term rate hikes. In addition, concerns over Japan’s fiscal outlook, linked to Prime Minister Sanae Takaichi’s reflationary agenda, along with political uncertainty ahead of the February 8 snap election, continue to weigh on the currency. Coupled with modest U.S. dollar (USD) strength, these factors pushed USD/JPY toward the 154.00 level and the key 100-day Simple Moving Average (SMA) resistance.
That said, expectations of coordinated intervention by U.S. and Japanese authorities to support the yen may discourage aggressive bearish positioning. At the same time, lingering trade uncertainty stemming from President Donald Trump’s tariff threats and broader geopolitical risks is tempering risk appetite, as reflected in the cautious tone across equity markets, which could help limit downside in the safe-haven JPY. Meanwhile, the USD may struggle to gain sustained traction amid expectations of further Federal Reserve rate cuts and ongoing concerns over the central bank’s independence, potentially capping further upside in USD/JPY.
Japanese yen comes under pressure from soft Tokyo CPI, fiscal concerns and political uncertainty
A government report released earlier on Friday showed that Tokyo’s headline Consumer Price Index (CPI) fell to 1.5% in January from 2.0% previously, marking its lowest level since February 2022. Core inflation, which strips out fresh food prices, also softened to 2.0% from 2.3% in December, while a broader measure excluding both food and energy eased to 2.4% from 2.6% the month before.
The data signals easing demand-driven inflation pressures and diminishes the urgency for further monetary tightening by the Bank of Japan, following its December rate hike that lifted the policy rate to 0.75%, the highest level in three decades.
Meanwhile, concerns over Japan’s fiscal outlook persist as Prime Minister Sanae Takaichi has anchored her snap election campaign on expanded stimulus measures and pledged to suspend the consumption tax on food, raising questions about fiscal sustainability.
Adding another layer of complexity, reports of an unusual rate check by the New York Federal Reserve last Friday, following a similar move by Japan’s Ministry of Finance, have fueled speculation about potential coordinated U.S.-Japan intervention to curb yen weakness.
On the geopolitical front, U.S. President Donald Trump announced plans on Thursday to decertify all Canada-made aircraft and threatened to impose 50% tariffs unless U.S.-built Gulfstream jets receive certification in Canada. The move marks a fresh escalation in U.S.-Canada trade tensions.
These developments, alongside rising U.S.-Iran frictions and the prolonged Russia-Ukraine conflict, could help limit downside pressure on the safe-haven yen. The United States continues to deploy warships and fighter jets across the Middle East, while Secretary of War Pete Hegseth stated that Washington stands ready to act decisively under President Trump’s directives.
Russia has also reiterated its invitation for Ukrainian President Volodymyr Zelensky to travel to Moscow for peace talks, although prospects for a deal remain slim amid deep divisions between the two sides.
Meanwhile, the U.S. dollar received a modest boost amid speculation that Kevin Warsh may be appointed as the next Federal Reserve chair, lending additional support to the USD/JPY pair. President Trump is expected to announce his choice for Fed chair on Friday morning.
Looking ahead, traders will take further cues from the release of the U.S. Producer Price Index (PPI), which, alongside comments from Federal Reserve officials, is likely to influence dollar demand and provide direction for USD/JPY into the weekend.
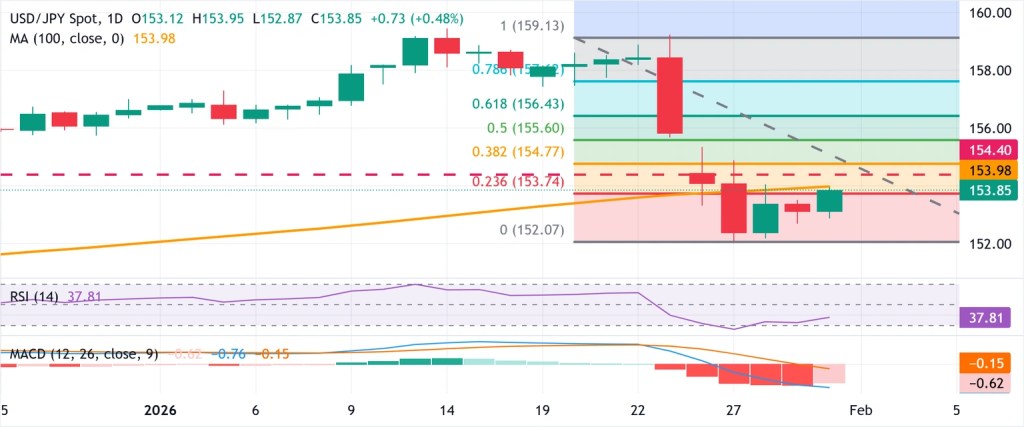
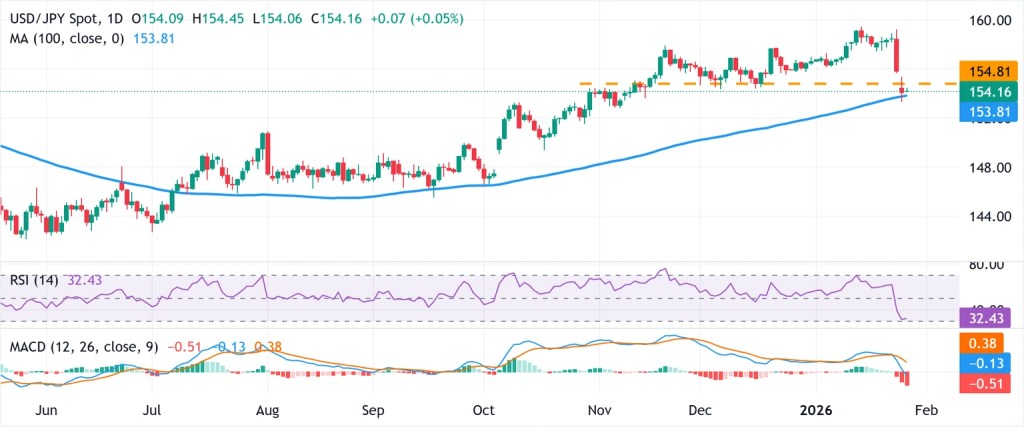
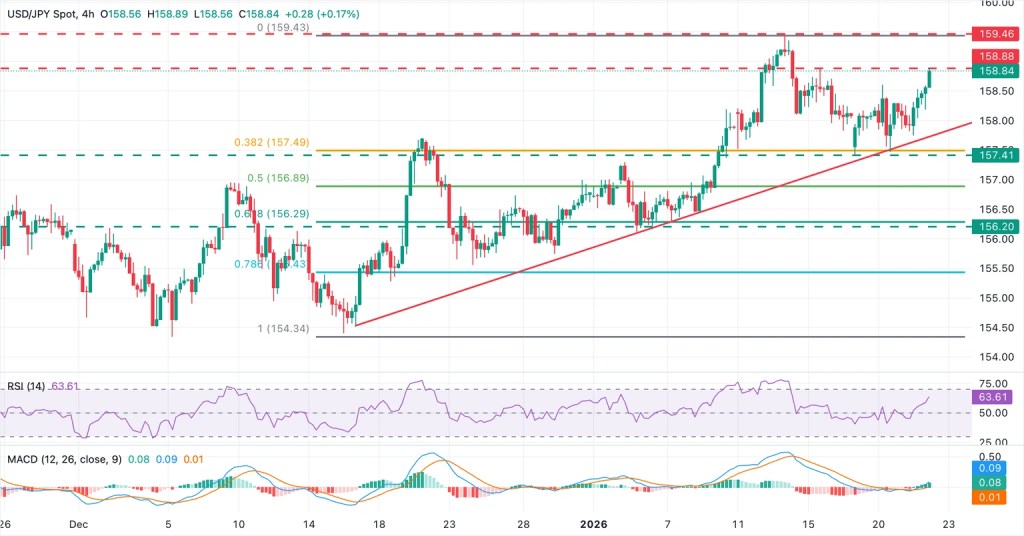
USD/JPY bulls look for a sustained break above the 100-day SMA before adding new positions
The 100-day Simple Moving Average (SMA) continues to trend higher and is currently located near 153.98, with USD/JPY trading just below this level. This keeps near-term sentiment on the heavy side, despite the broader uptrend suggested by the rising trend filter. A sustained move back above this dynamic resistance would help steady the short-term outlook.
Momentum indicators show tentative signs of stabilization. The Moving Average Convergence Divergence (MACD) remains in negative territory, although its recent narrowing points to fading downside pressure. Meanwhile, the Relative Strength Index (RSI) stands at 37.81, below the neutral 50 mark but rebounding from oversold levels, indicating that bearish momentum is beginning to ease.
On the upside, the 38.2% Fibonacci retracement of the 159.13–152.07 decline, located at 154.77, is likely to act as initial resistance. A daily close above this level would enhance the recovery setup and open the door to further gains as momentum improves. Conversely, failure to break above this barrier would keep rebounds limited and reinforce a cautious near-term bias.
WTI prices slipped but were still on course for roughly 12% monthly gains, underpinned by elevated geopolitical risk premiums.
Iran warned of an unprecedented response following renewed threats from President Trump over nuclear negotiations.
Meanwhile, the Trump administration loosened some sanctions on Venezuela’s oil sector on Thursday to attract U.S. investment.
West Texas Intermediate (WTI) crude edged lower after three consecutive sessions of gains, trading near $64.00 a barrel during Asian hours on Friday. Still, the benchmark remained on track for about a 12% monthly increase, supported by a strengthening geopolitical risk premium.
Geopolitical tensions stayed elevated after Iran warned it would “defend itself and respond like never before” following renewed threats from U.S. President Donald Trump, who urged Tehran to engage in nuclear negotiations. Iranian officials cautioned that any provocation would be met with retaliation.
Tensions escalated further after the European Union designated Iran’s Islamic Revolutionary Guard Corps as a terrorist organization. Concerns were compounded by reports that the United States was bolstering its military presence near Iran, while Tehran announced live-fire military exercises in the strategically vital Strait of Hormuz, heightening worries over regional security.
Markets are closely watching the potential impact of these developments on shipping through the Strait of Hormuz, a critical chokepoint between Iran and the Arabian Peninsula that handles daily flows of crude oil and LNG. According to Dow Jones Newswires, Westpac Strategy Group warned that any regime change in Iran would likely be disorderly, unlike the U.S-backed removal of Venezuela’s Nicolas Maduro or targeted strikes such as those on Fordow.
Separately, the Trump administration eased certain sanctions on Venezuela’s oil sector on Thursday to attract U.S. investment following President Nicolas Maduro’s removal earlier this month. The U.S. Treasury authorized transactions involving Venezuela’s government and state-run PDVSA, allowing U.S. firms to produce, transport, sell, and refine Venezuelan crude.
Earlier this month, oil prices also drew support from supply disruptions in Kazakhstan, freeze-offs in the United States, and tighter U.S. restrictions on Russian oil purchases, helping underpin prices this year despite lingering expectations of global oversupply.
U.S. stock index futures slipped slightly on Thursday evening after Wall Street ended mostly lower, as weaker-than-expected results from Microsoft rekindled doubts over the returns on heavy AI spending, while investors absorbed a wave of other corporate earnings.
S&P 500 futures dipped 0.3% to 6,975.0 points, Nasdaq 100 futures declined 0.3% to 25,916.75 points, and Dow Jones futures also fell 0.3% to 49,049.0 points by 19:36 ET (00:36 GMT).
Wall Street dips as Microsoft’s slide weighs; Apple earnings take center stage
The S&P 500 and NASDAQ Composite closed Thursday’s regular session on a weak note, with technology stocks among the session’s biggest laggards.
Shares of Microsoft Corporation (NASDAQ:MSFT) plunged 10% after the company’s quarterly earnings highlighted slower cloud revenue growth and record AI-related spending, failing to reassure investors about near-term returns.
Microsoft’s selloff dragged down broader technology sentiment, with software peers including ServiceNow Inc (NYSE:NOW) and SAP (NYSE:SAP) also posting steep declines following disappointing earnings and outlooks.
Investors were also focused on Apple Inc.’s (NASDAQ:AAPL) earnings released after the close, which topped expectations as strong iPhone demand and a recovery in Greater China boosted both revenue and profit.
Apple reported roughly $143.8 billion in revenue and earnings per share well above consensus estimates, sending its shares up nearly 1% in after-hours trading.
SanDisk jumps on earnings beat; Trump backs spending agreement
Elsewhere on the earnings front, shares of SanDisk Corporation (NASDAQ:SNDK) jumped 16% in after-hours trading after the storage-chip maker posted a strong profit beat and lifted its outlook, driven by stronger-than-expected demand for data-center and AI-focused memory products.
By contrast, Visa (NYSE:V) shares edged lower despite surpassing first-quarter earnings and revenue forecasts, as investors focused on weaker-than-expected transaction volumes and ongoing caution surrounding broader consumer spending.
On the political side, President Donald Trump voiced support for a bipartisan spending agreement crafted by Senate Republicans and Democrats aimed at avoiding an imminent government shutdown, expressing his backing on Truth Social and calling for cooperation.
The deal would provide funding for most federal agencies while deferring divisive immigration issues for future negotiations.
Gold’s most recent move was sharp, chaotic, and relentless. With volatility running high and prices stretched, managing risk is just as critical as getting the direction right.
Gold shows capitulation-like price behavior
Volatility jumps to multi-year highs
Prices look stretched after a rapid upside surge
Position sizing and risk management become paramount
Gold shows meme-stock–like trading behavior
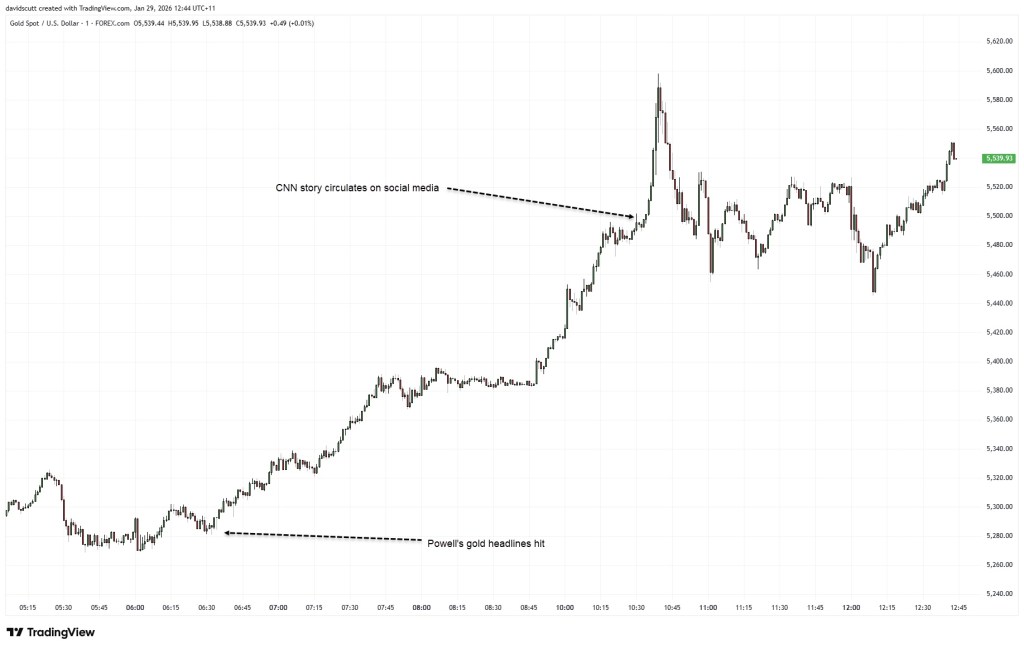
Gold behaved less like a classic safe haven and more like a meme stock on Thursday, surging nearly $100 within minutes during early Asian trading. Prices briefly spiked toward $5,600 before reversing just as quickly. The sheer speed and magnitude of the move felt like capitulation in real time, likely exacerbated by thin liquidity during the transition from North American to Asian market hours.
Although the price surge began around the same time, a CNN report later surfaced indicating that the U.S. was considering new military strikes against Iran. However, given that geopolitical tensions have been elevated for weeks rather than emerging suddenly, much of that risk was likely already priced in. In that sense, the headline appears more like a catalyst than the underlying cause of the move.
Some traders also cited comments from Fed Chair Jerome Powell after the January FOMC meeting, in which he downplayed any macroeconomic signal from gold’s record highs. Still, those remarks seem to have played only a minor role, coming several hours before the most volatile phase of the price action unfolded.
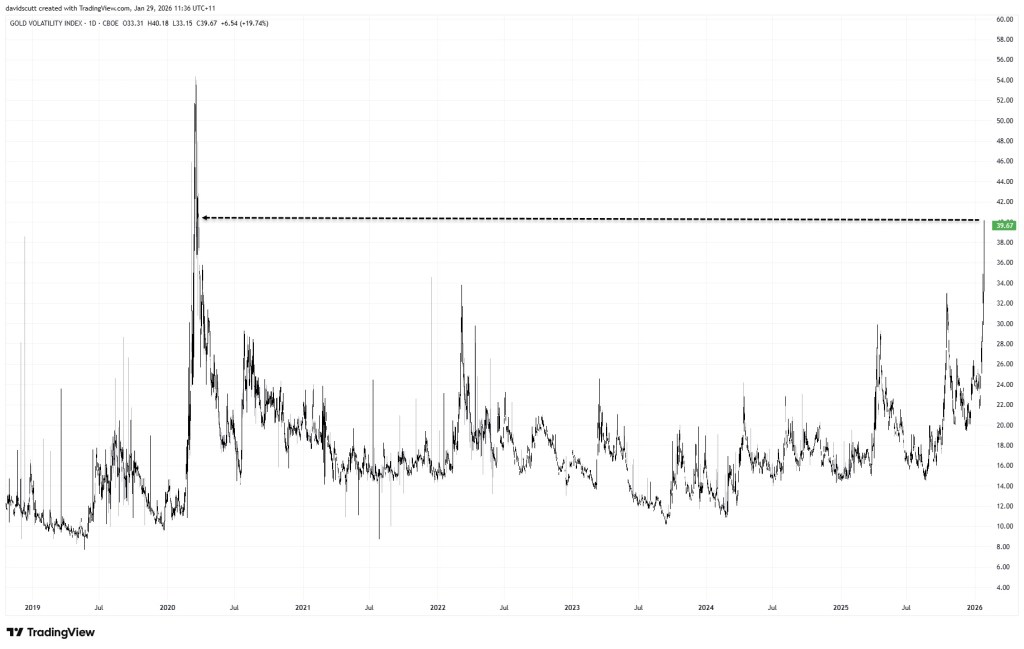
Volatility jumps sharply higher
While today’s spike has understandably drawn attention, it is not an isolated event, instead forming part of a broader and accelerating expansion in volatility across the gold market.
As illustrated above, the Gold Volatility Index (GVZ) has climbed to its highest level since the early days of the COVID-19 lockdowns in 2020, highlighting just how extreme price action in the traditional safe haven has become. GVZ measures implied volatility in gold options, offering insight into the magnitude of price swings the options market is anticipating. The surge suggests the market has entered a markedly different volatility regime, one in which unusually large moves are occurring with increasing frequency.
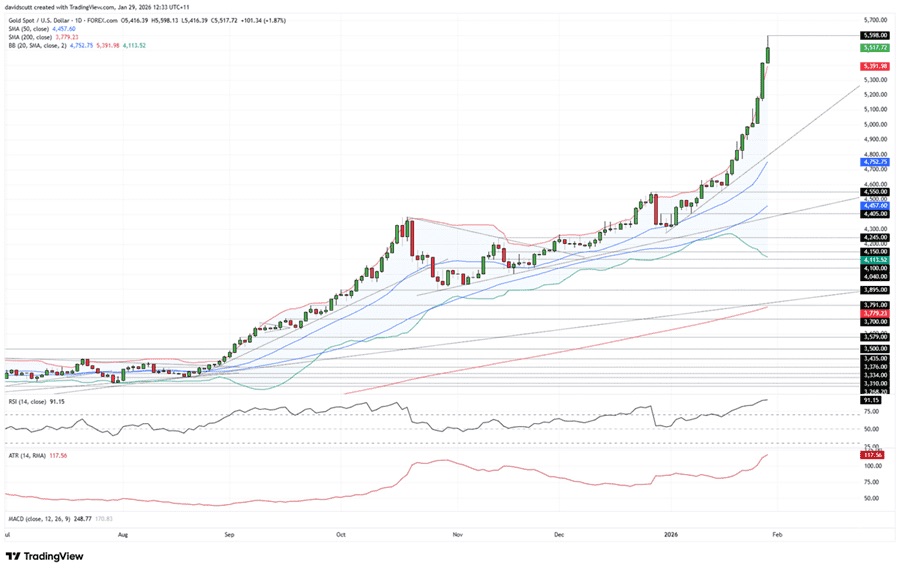
The broader volatility environment is also clearly visible on the daily chart. Gold is trading well above its upper Bollinger Band, highlighting the speed and magnitude of the recent acceleration relative to prior conditions. Daily trading ranges have expanded sharply, with the 14-day ATR elevated at 117.56—making $100-plus moves routine rather than exceptional. Meanwhile, the 14-day RSI sits deep in overbought territory at 91.15, reinforcing that while the broader uptrend remains intact, price action is increasingly stretched and unstable.
Risk management takes center stage
In short, this is an exceptionally high-volatility environment where price behavior is far from normal. Gold has surged rapidly, leaving prices highly extended and vulnerable to sharp moves in both directions, even as the broader uptrend remains in place. In such conditions, traditional technical signals often lose reliability, making risk management and position sizing especially critical—particularly with mean-reversion risks running high.
The S&P 500 ended the session largely unchanged ahead of a largely uneventful Federal Reserve meeting, which offered little new information beyond reaffirming that the U.S. economy remains in fairly solid condition. The tone of Chair Jay Powell’s press conference also suggested that, at least while he remains at the helm, there are likely to be few—if any—interest-rate cuts in the near term.
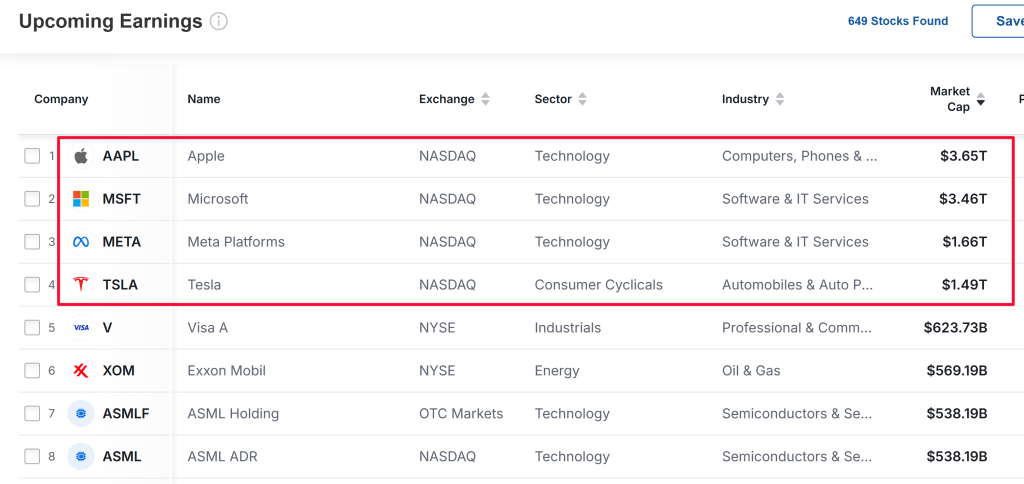
Earnings released after the close were mixed. Microsoft (NASDAQ: MSFT) fell roughly 6.5%, while Meta Platforms (NASDAQ: META) surged about 7.5%. From an options standpoint, both stocks had bearish setups heading into earnings, with elevated implied volatility and heavy call-delta positioning at higher strike levels. Following the results, implied volatility declined, causing higher-strike calls to lose value and prompting the unwinding of hedges.
For Meta, the key technical level was $700, which the stock managed to break through, at least initially. Revenue guidance significantly exceeded expectations, leading the market to overlook higher-than-expected capital expenditures for now. The key question will be whether Meta can hold above the $700 level once regular trading resumes.
For Microsoft, the key level was $500, which the stock failed to break despite reporting better-than-expected results. Investor sentiment was weighed down by weaker-than-expected growth in its Azure cloud business.
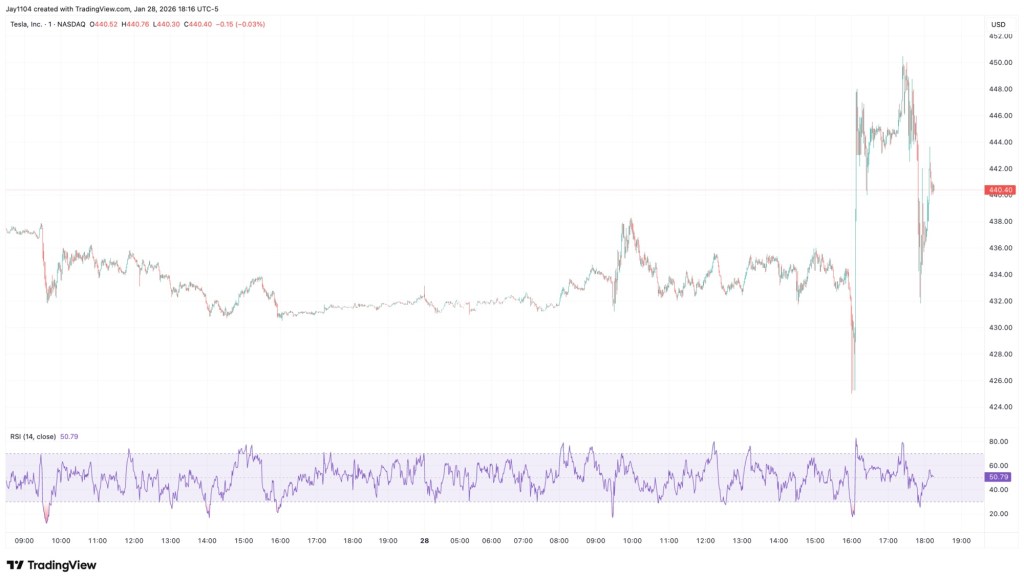
For Tesla (NASDAQ: TSLA), the setup ahead of earnings was more mixed, but $450 clearly stood out as the key level to break. So far, the stock has tested that threshold but has been unable to hold above it.
After-hours moves can be unpredictable, which is why it often makes sense to wait and see how price action develops during regular trading hours. How the CDS market trades tomorrow may be even more telling, potentially offering a clearer read on the true implications of the earnings reports.
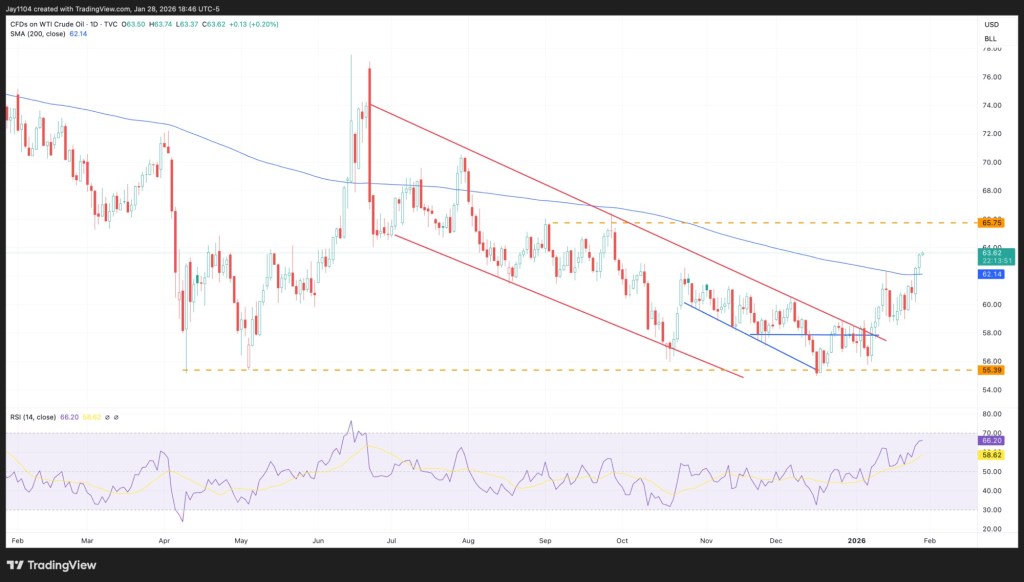
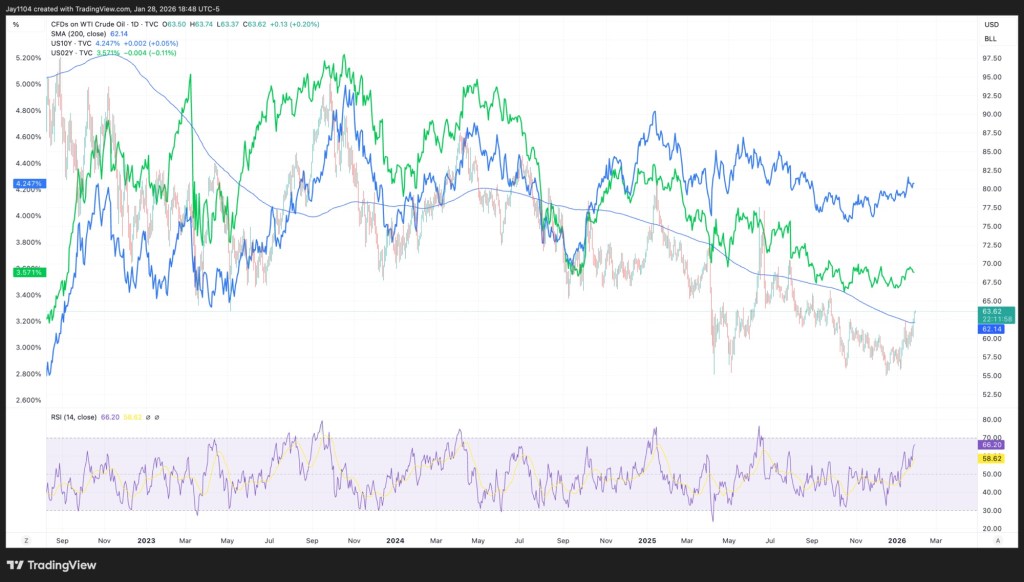
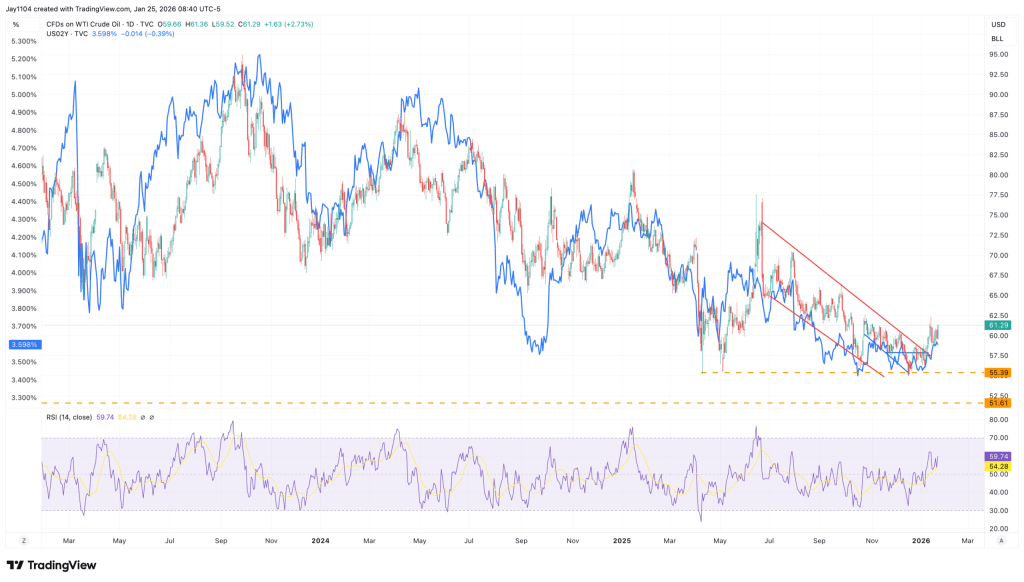
For now, near-term rate expectations appear more closely tied to oil than to any other factor. Crude has broken out and moved above its 200-day moving average, a technical development that could set the stage for a rally toward $65 in the near term.
Whether looking at the 2-year or 10-year Treasury yield, the correlation with oil prices since late 2022 has been remarkably strong. As a result, if oil continues to move higher, it would likely put upward pressure on interest rates as well. In that sense, oil may have been the final missing link in the case for higher rates.
Federal Reserve Chair Jerome Powell offered few substantive remarks during his press conference on Wednesday, sidestepping multiple questions about the upcoming leadership transition as his term ends on May 15. He declined to comment on President Donald Trump’s potential nominee to succeed him, as well as on the president’s public criticism of his tenure.
Powell also avoided addressing questions related to the Department of Justice investigation involving him and the ongoing Supreme Court case concerning the possible removal of Fed Governor Lisa Cook. In response to these issues, he repeatedly indicated that he had nothing further to add.
“I have nothing on that for you.”
He repeated that response seven times in total. On four occasions, he simply said,
“I don’t have anything on that for you.”
After the FOMC voted to keep the federal funds rate in a range of 3.50%–3.75%, Powell provided no additional forward guidance beyond reiterating the Fed’s data-dependent, meeting-by-meeting approach. He did, however, acknowledge the underlying strength of the U.S. economy.
Powell noted that the unemployment rate has remained low at around 4.4% in recent months, even as job growth has slowed. He also said inflation is expected to ease as the effects of President Trump’s tariffs fade.
Overall, Powell characterized the risks of higher inflation and rising unemployment as balanced, signaling little urgency for policy action. This assessment increases the likelihood that the federal funds rate will remain unchanged at his final two meetings as FOMC chair.
Officials in the Trump administration broadly share our “Roaring 2020s” outlook, which assumes stronger-than-expected productivity growth will lift real GDP while easing inflation pressures as unit labor cost growth falls toward zero. They argue that this expectation supports additional cuts to the federal funds rate—a view echoed by two dissenting members of the FOMC, who expressed similar reasoning at the latest meeting.
We take a different view. Cutting the federal funds rate further from current levels would heighten the risk of financial instability, particularly by fueling a melt-up in equity markets. A similar dynamic is already evident in precious metals. Additional rate cuts would also put further downward pressure on the dollar, potentially reigniting inflationary pressures.
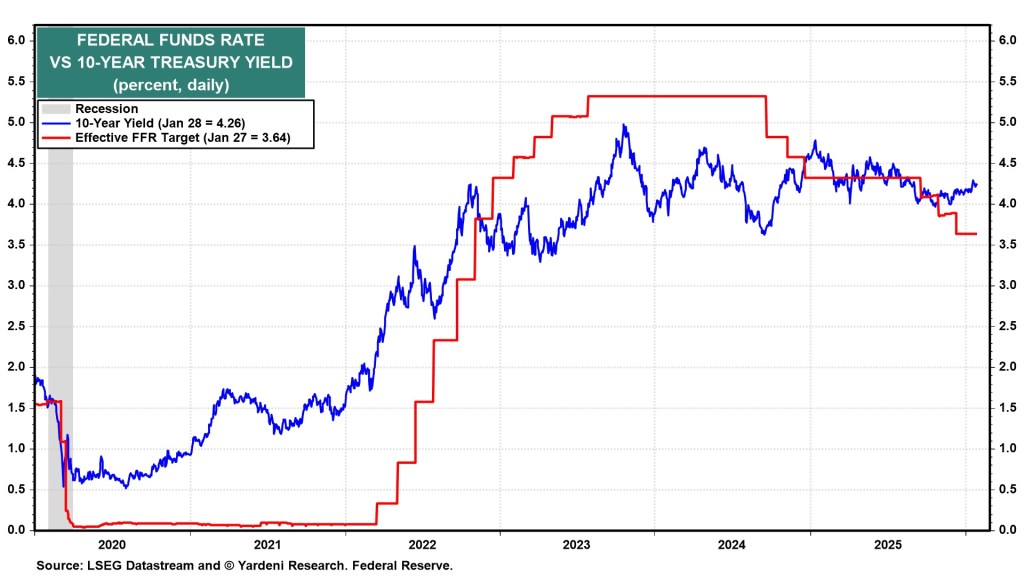
Bond markets appear to share this skepticism. When the Fed reduced the federal funds rate by 100 basis points in late 2024, the 10-year Treasury yield rose by a similar amount. Even after another 75-basis-point cut late last year, the yield held around 4.00% and has since climbed to 4.26%. We continue to expect the 10-year yield to trade largely between 4.25% and 4.75% this year—levels that were typical in the period before the Global Financial Crisis.
The U.S. dollar showed a limited reaction to the latest Federal Reserve meeting, with EUR/USD pushing toward the 1.20000 level. While the Fed’s messaging pointed to a low likelihood of a key rate cut in March—given that economic growth is now characterized as “solid”—market attention during the press conference shifted toward political issues.
This focus, according to Commerzbank analysts Volkmar Baur and Michael Pfister, suggests a growing change in how investors perceive the Federal Reserve’s independence.
Fed meeting weighs on US dollar
Overall, the market appeared to place greater emphasis on the Fed’s slightly hawkish tone and policy tweaks. Expectations for additional rate cuts were trimmed marginally, but the adjustment was too small to have a meaningful impact on the currency.
“The perception that political considerations are gradually influencing the Fed—or at least that markets believe this to be the case—was also reflected in Christopher Waller’s vote in favor of another cut to the key policy rate.
Ultimately, even if the Fed remains capable of conducting an independent monetary policy, this perception alone could become problematic. If markets lose confidence in that independence, the U.S. dollar is likely to come under pressure.”
Bitcoin gave up part of its earlier gains on Wednesday after the Federal Reserve left interest rates unchanged, as widely anticipated, slipping back below the $90,000 level after briefly reclaiming it for the first time since last Friday.
The world’s largest cryptocurrency was last trading 1.3% higher at $89,564.1 as of 14:29 ET (19:29 GMT).
Bitcoin climbs back above $90,000 as dollar rebounds
Bitcoin’s advance this week was underpinned by broad weakness in the U.S. dollar, after President Donald Trump sought to ease concerns over the currency’s recent decline.
The Dollar Index snapped a four-day losing streak, while gold extended its sharp rally to fresh record highs above $5,300 per ounce, further strengthening demand for alternative stores of value.
After several sessions of rangebound trading, bitcoin set its sights once again on the key psychological $90,000 level and reached that mark on Wednesday.
“Bitcoin needs to decisively break back above $90,000 and then hold that level on any pullback to attract new buying interest,” said David Morrison, senior market analyst at Trade Nation. “If that happens, $100,000 would become the next bullish target. But it’s still early, and bitcoin needs to create more distance from key support levels.”
He added that, for now, a move below $85,000 remains a clear possibility. Meanwhile, the Federal Reserve concluded its two-day policy meeting on Wednesday by keeping interest rates unchanged, in line with expectations.
Investors are paying close attention to the Fed’s accompanying statement and comments from Chair Jerome Powell for clues on the timing of potential rate cuts, especially as inflation appears to be cooling while economic growth remains solid.
Lower interest rates generally favor non-yielding assets like bitcoin, as they reduce the opportunity cost of holding them.
Adding to the uncertainty, markets are also closely monitoring developments around President Trump’s expected nomination of a new Federal Reserve chair. Investors are evaluating how increased political influence could alter the central bank’s policy approach and its tolerance for inflation.
Tether increases gold exposure, targets up to 15% portfolio allocation
Tether plans to dedicate a significant share of its investment portfolio to physical gold, expanding on bullion reserves that already underpin some of its products, CEO Paolo Ardoino told Reuters.
The stablecoin issuer currently holds roughly 130 metric tons of physical gold, having added 27 tons in the fourth quarter alone. Ardoino said the company has recently been buying about two tons per week.
“For our own portfolio, it makes sense to allocate around 10% to bitcoin and about 10% to 15% to gold,” Ardoino said, while declining to disclose the total size of Tether’s investment portfolio or the precise portion currently held in bullion.
“It’s difficult to choose which one I prefer,” he added. “It’s almost like having two children and deciding which one is more beautiful.”
Tether will maintain direct ownership of the gold, which is stored in Switzerland, and has not set a fixed target for future purchases. Buying decisions will be reviewed on a quarterly basis. Ardoino noted that the company began accumulating gold in 2020 during the COVID-19 pandemic and has steadily increased exposure as geopolitical risks have risen.
“The world isn’t in a good place right now. Gold is hitting record highs day after day. Why? Because people are afraid,” he said.
Gold prices have surged over the past year, rising 64% in 2025 and continuing their rally into 2026, with gains of 22% so far this year. The metal hit a record high of $5,311 per troy ounce on Wednesday, supported by weakening confidence in the U.S. dollar and concerns about the independence of the Federal Reserve.
Crypto prices today: altcoins post modest gains
Most major altcoins also moved higher on Wednesday, following gains in bitcoin.
Ethereum, the world’s second-largest cryptocurrency, rose 1% to $3,008.75, while third-ranked XRP added 0.4% to trade at $1.91.
Gold prices jumped to a record near $5,600 per ounce on Thursday, extending recent gains after reports that U.S. President Donald Trump was weighing a new strike on Iran. Silver also climbed to a record above $119 per ounce, supported by strong safe-haven demand.
Metal prices continued to climb with little sign of easing, driven by escalating global geopolitical tensions that boosted demand for physical assets and traditional safe havens. Additional support came from a weaker U.S. dollar and uncertainty surrounding U.S. policy, while copper prices also reached a new all-time high on Thursday.
Spot gold jumped more than 2% to a record $5,595.41 per ounce, and April gold futures peaked at $5,625.89 per ounce. Although prices later retreated from these highs, gold was still trading comfortably above $5,500 per ounce by 00:45 ET (05:45 GMT).
Spot silver also rose sharply, gaining over 1% to a record $119.4280 per ounce.
“Gold is no longer viewed solely as a hedge against crises or inflation,” OCBC analysts noted. “It is increasingly seen as a neutral, dependable store of value that also offers diversification across a broad range of macroeconomic environments.”
They added that this shift in perception helps explain why recent pullbacks have been limited and well-supported. OCBC has recently raised its 2026 gold price forecast to $5,600 per ounce.
Trump considering major strike on Iran
Former President Donald Trump is reportedly weighing a “major new strike” against Iran after talks over Tehran’s nuclear program and missile development broke down, CNN reported Wednesday night.
The report follows Trump’s decision to deploy multiple U.S. naval vessels to the Middle East, alongside earlier threats of military action that he framed as backing nationwide protests in Iran.
Earlier on Wednesday, Trump posted on social media urging Iran to reach a “fair and equitable” agreement with Washington and to abandon its nuclear ambitions. He also warned that any future U.S. strike would be significantly more severe than the mid-2025 attack, when American forces targeted Iran’s key nuclear facilities.
According to CNN, Trump is now considering airstrikes aimed at Iranian political leaders and security officials accused of killing protesters, as well as additional attacks on nuclear sites.
Any further U.S. military action could sharply escalate tensions in the Middle East, with Iran having pledged strong retaliation against such moves.
U.S.-centric geopolitical risks have continued to support gold and other safe-haven assets, particularly after Washington launched a military incursion in Venezuela earlier this month. Trump’s demands related to Greenland also added to these tensions, though his rhetoric on that issue has eased in recent weeks.
Meanwhile, gold prices showed little reaction to the U.S. Federal Reserve’s widely expected decision to keep interest rates unchanged, as the central bank also offered an optimistic assessment of the U.S. economic outlook.
However, Chair Jerome Powell refrained from responding to questions regarding the Federal Reserve’s independence amid an ongoing Department of Justice investigation.
Platinum gains ground as copper reaches a record high
Strength in gold prices spilled over into the wider metals complex, supported by a weaker dollar and growing investor demand for safe-haven, physical assets viewed as neutral stores of value.
Spot platinum climbed 2.6% to $2,775.73 per ounce, staying near recent highs. The precious metal remained close to record levels reached earlier this month, after largely moving in step with gold through late 2025.
Copper also joined the broader metals rally, with benchmark futures on the London Metal Exchange surging more than 6% to a record $14,123.95 per tonne.
Prices were further lifted by reports pointing to additional policy support for China’s struggling property sector. As the world’s largest copper importer, China’s real estate industry represents a significant share of global copper demand.
Economic behavior refers to the way individuals, households, businesses, or organizations make decisions and take actions related to the production, distribution, exchange, and consumption of economic resources such as money, time, labor, and natural resources.
Simply put, it is how people choose when resources are limited but needs are unlimited.
Key characteristics of economic behavior
1. Based on choice
Because resources are scarce, people must choose one option over another.
2. Benefit-oriented
Decisions usually aim to maximize benefits (profit, satisfaction) and minimize costs.
3. Influenced by many factors
Income and prices
Information and expectations
Psychology, habits, and culture
Government policies and the social environment
4. Not always perfectly rational
Behavioral economics shows that people often make decisions influenced by emotions, cognitive biases, or personal beliefs.
Examples of economic behavior
Consumers compare prices and quality before buying tea
Businesses expand production when demand increases
Investors choose gold as a safe-haven asset during market volatility
People save more when they fear an economic downturn
Types of economic behavior
Consumption behavior
Consumption behavior refers to how individuals or households decide what goods and services to buy, how much to buy, and when to buy in order to satisfy their needs and wants.
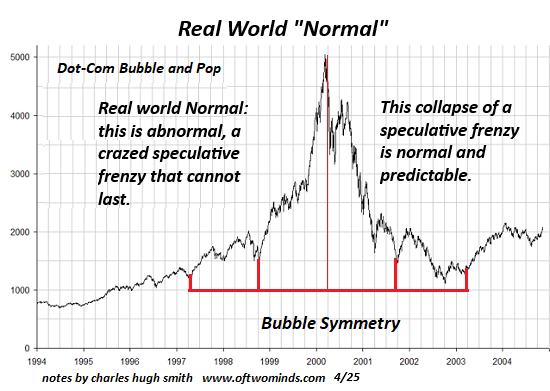
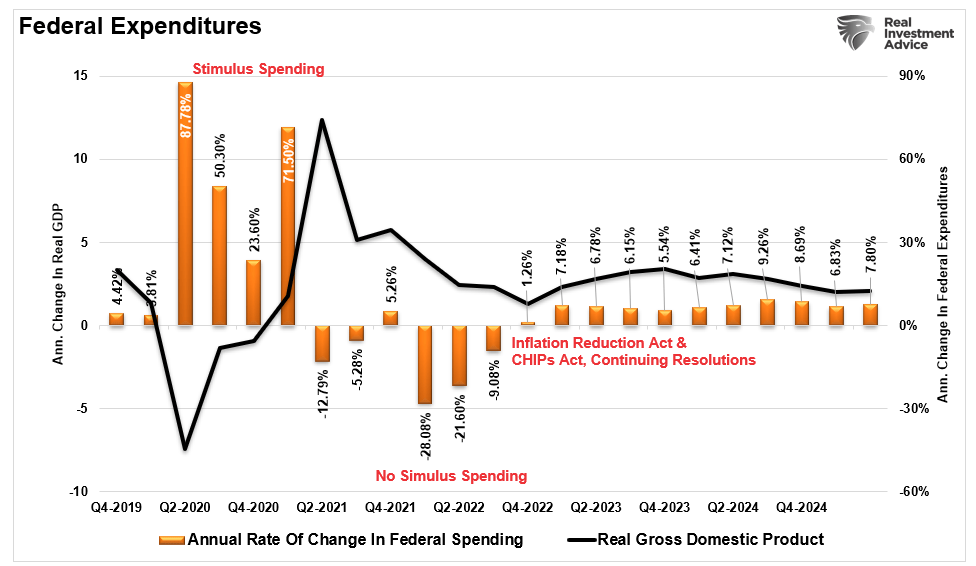
Narrative control functions by offering ready-made answers to every doubt or challenge. At its core, the prevailing narrative claims that the Federal Reserve and the central government possess sufficient tools to quickly counter any decline in GDP—otherwise known as a recession—and steer the economy back toward growth.
Implicit in this view is the assumption that recessions are inherently harmful, while uninterrupted expansion is inherently desirable. Few question the fact that this framework departs from true free-market capitalism. Instead, central banking and government intervention are justified as mechanisms to smooth out capitalism’s rough edges through a form of state capitalism—one that can create or borrow as much money as needed to neutralize economic disruptions, including recessions.
What this narrative leaves out is the role recessions play as a natural and necessary part of market dynamics. Instead, it reduces economic cycles to a simplistic binary: contraction is bad, expansion is good. Yet markets are ultimately driven by human behavior—particularly fear and greed—which express themselves through borrowing and speculation. During periods of confidence, when growth appears limitless, participants take on increasing levels of debt and channel capital into progressively riskier investments in pursuit of higher returns.
As borrowed funds flow into speculative assets, prices rise, boosting the value of collateral and enabling even more borrowing to finance further speculation. Debt, asset prices, collateral and risk-taking thus reinforce one another, creating the illusion of an endlessly self-sustaining expansion in which everyone appears to grow wealthier.
However, this layering of debt and paper wealth carries within it two forces that eventually unwind the process: interest and risk. Every loan carries an obligation to pay interest, which compensates lenders for the risks they assume. As overall debt grows—and as investments become more speculative—debt servicing costs increase accordingly, especially for higher-risk borrowers.
While central banks can attempt to suppress interest rates even as risk rises, their influence is inherently limited. They control only a portion of total outstanding debt and therefore cannot dominate the market entirely.
Their role in prolonging debt expansion and speculation relies less on absorbing most new debt and more on signaling. By projecting the message that the Federal Reserve will step in to backstop losses, recapitalize lenders, and cap interest rates below market-clearing levels, policymakers encourage continued borrowing and risk-taking. This reinforces the belief that debt and speculation can keep expanding indefinitely.
Yet signaling alone cannot solve the underlying problem. It does not increase the income required to service growing debt burdens, nor does it ensure speculative investments will deliver returns. These limitations expose the fundamental weakness of the central banking “perpetual motion” model. For most borrowers—both private and public—income does not automatically rise alongside debt. Instead, income depends on market conditions, technological change, government policy, and the broader cycle of credit expansion or contraction.
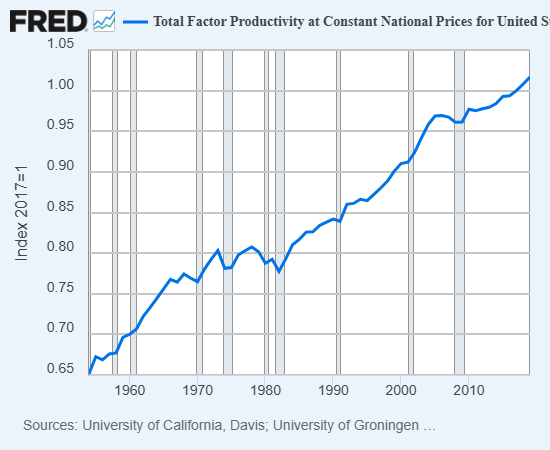
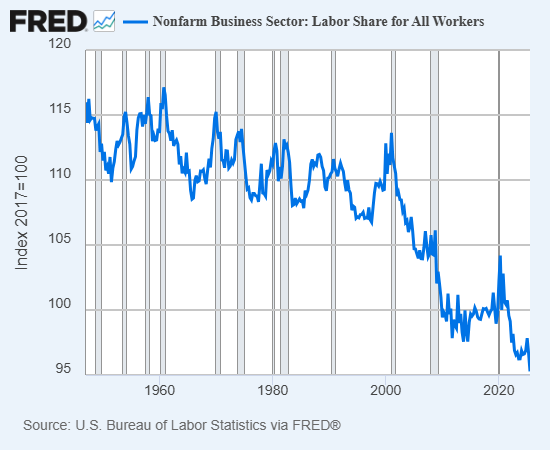
At the level of the overall economy, what ultimately matters is total factor productivity and how its gains are distributed among workers, businesses, asset owners, and the state, which extracts revenue from each through taxation. This distribution is not fixed; it shifts with changing social, political, and financial forces.
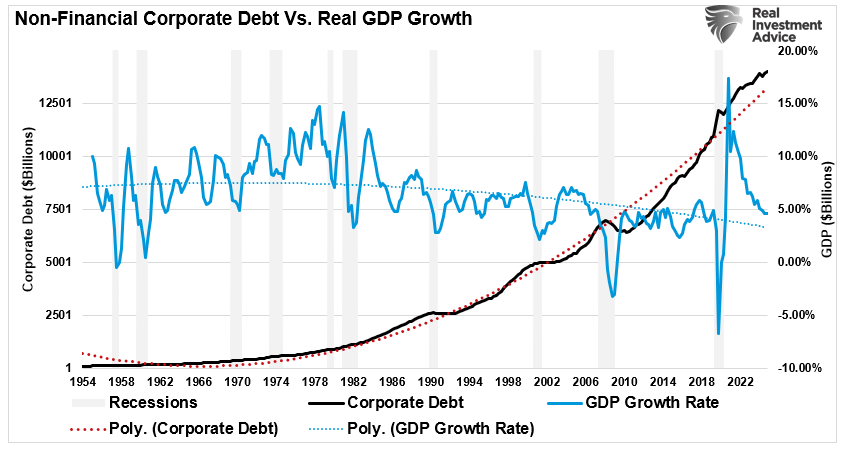
Over the past five decades, the benefits of productivity growth have increasingly accrued to capital—corporations and asset owners—rather than to workers. As a consequence, households and small businesses are left servicing debt with a diminishing share of overall economic income. This imbalance makes additional borrowing progressively more hazardous for both borrowers and lenders alike.
As a growing share of economic output accrues to corporations and asset owners, their collateral values, income streams, and perceived creditworthiness strengthen. This allows them to borrow larger sums at lower interest rates than wage earners and small businesses. Greater access to cheap credit enables further asset accumulation, which in turn generates additional income—creating a self-reinforcing cycle.
This dynamic sits at the heart of widening wealth and income inequality. Those at the top grow richer not simply because they earn more, but because they can finance income-producing assets at costs far below those faced by workers. Unlike wages, income derived from assets tends to rise alongside asset values, which can be leveraged as collateral to support even more borrowing.
At a deeper structural level, the system becomes unstable once economic growth fails to raise household incomes enough to support higher debt servicing. The entire framework of expanding credit, collateral, and speculation then comes under strain. Asset-driven income ultimately depends on one or more of three forces: continued credit expansion, increased risk-taking in financial markets, or sustained consumer spending. These forces are tightly linked, as any slowdown in borrowing, investing, or spending eventually undermines the ability to service debt and brings the credit cycle to a halt.
Because debt inherently carries default risk, an economic model reliant on ever-expanding borrowing also amplifies systemic vulnerability—particularly when household incomes stagnate while debt levels and interest obligations continue to rise.
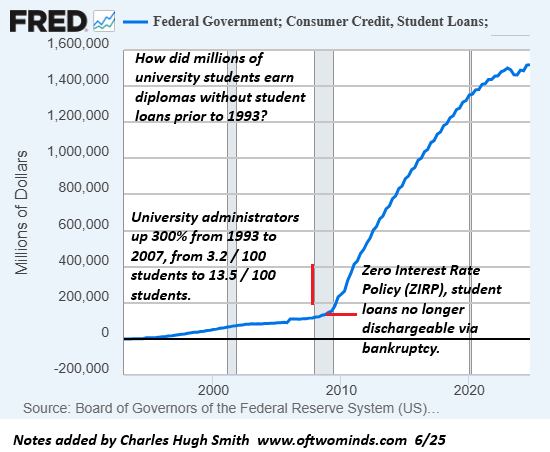
With the share of output flowing to wages declining for decades, households have increasingly relied on borrowing to sustain consumption. Before the 2000s, student debt was relatively limited; today it totals trillions of dollars. Auto loans and credit card balances have also surged, alongside less visible forms of leverage such as installment-based financing and other shadow-banking channels that are often underreported.
Speculative investments carry intrinsic risk, as there is no guarantee they will generate returns. When such speculation is financed through borrowing, failure does not only harm the investor—it also inflicts losses on the lender, as both sides are exposed when the bet collapses.
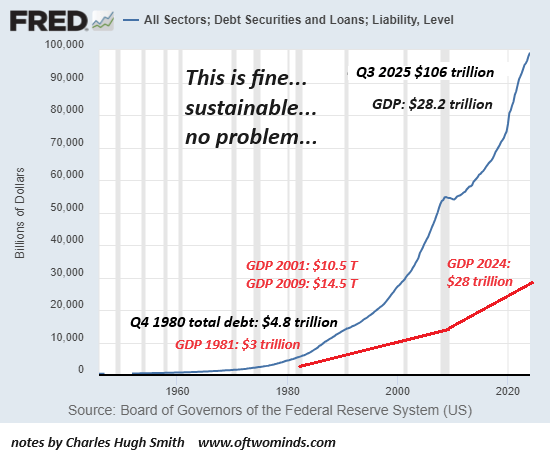
Taken together, stagnant income growth, rising reliance on debt to sustain consumption, and increasingly risky, debt-backed speculation have produced an economy dependent on credit-driven asset bubbles. Growth now hinges on the continual expansion of debt to support spending and fuel speculative activity that inflates asset prices, thereby boosting collateral values and enabling even more borrowing.
When income growth can no longer keep pace with rising debt obligations, defaults begin to ripple through the system. Households fall behind on rent, auto loans, student debt, credit cards, and mortgages, triggering a collapse in consumer spending. The resulting strain spreads to lenders and employers, who respond by tightening credit, cutting back borrowing, and laying off workers—further eroding income across the economy.
Speculative investments that appeared viable during the expansion unravel as credit conditions tighten. Lenders withdraw from riskier loans, household demand dries up, and asset prices fall as investors rush to sell risk assets in order to raise cash and reduce leverage. Collateral values deteriorate rapidly, amplifying losses.
Economies dependent on credit-fueled asset bubbles function as tightly interconnected systems. Any decline in income or asset prices, any increase in interest rates, any reduction in available credit, or any erosion of collateral feeds back into the broader structure. These shocks reinforce one another, creating a downward spiral marked by defaults, layoffs, and falling valuations.
In an economy already saturated with debt, policy stimulus no longer produces real growth; instead, it fuels inflation, which constrains central banks’ ability to respond. Once markets lose confidence in the belief that policymakers will always step in to backstop losses, both speculation and the borrowing that sustained it begin to dry up. As the flow of new, credit-funded investment slows, asset prices enter a self-reinforcing decline.
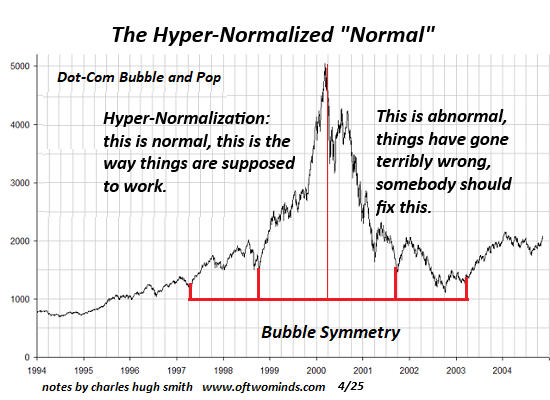
In a credit-asset-bubble-dependent system, this inevitable unwinding is often perceived not as a structural outcome, but as a sudden and unforeseen crisis.
In an economic system that permits recessions to purge unsustainable debt and excess speculation, the bursting of credit-driven asset bubbles is seen as a natural and unavoidable process rather than an aberration.
Few recognize two critical realities: first, the last true recession that meaningfully purged excess debt, leverage, and speculation occurred in 1980–82—more than four decades ago; second, the shock absorbers that enabled recovery back then no longer exist. In 1980, total debt stood at roughly 150% of GDP. Today, it is closer to three times GDP. This makes debt-driven expansion unworkable: borrowers are already struggling to service existing obligations, let alone take on more.
Nor can the Federal Reserve rescue the system simply by cutting rates to zero. The Fed holds only a small fraction of the roughly $106 trillion in outstanding debt; its primary influence is psychological, signaling that risk is low. In reality, risk continues to rise as debt burdens, interest costs, leverage, and speculation compound.
A repeat of the 2008-style bailout is equally implausible. Then, the system was stabilized by recapitalizing the financial sector—the engine of new credit creation. Today, however, the economy is saturated with debt, incomes have stagnated, and borrowers lack the capacity to sustain additional leverage. Meanwhile, housing and financial asset bubbles have expanded to historically fragile extremes.
This is why a recession that finally cleanses excess debt and speculation would leave behind an economy unable to rebound. The current system depends entirely on debt, leverage, and speculative excess not just for growth, but for basic stability. Once that structure collapses—as all bubbles eventually do—the confidence, signaling, and perceived wealth that sustained it will vanish as well.
Proposals to “save” the system by shifting fiat money into gold or cryptocurrencies offer no escape. The debt itself—and the income required to service it—would also be carried over, leaving the underlying dynamics unchanged. The collapse of credit-driven asset bubbles, and the economic activity built upon them, would still unfold.
For this reason, the next recession is likely to trigger a full-scale breakdown of a credit-asset-bubble-dependent economy. While policymakers may attempt to reflate another bubble as a solution, such an approach will no longer be sustainable. A durable recovery would instead require restructuring the economy around real productivity gains that are broadly shared, rather than concentrated among asset holders.
This transition will be slow and painful. Those who benefited most from the bubble economy will resist losing both extraordinary returns and their disproportionate share of gains. Yet neither can be preserved. The adjustment will demand time, sacrifice, and large, long-term investment in genuinely productive assets.
Ultimately, the systemic risks embedded in a credit-asset-bubble economy cannot be eliminated—only disguised or shifted elsewhere. These temporary fixes allow the bubble to grow larger, but the cost is borne by society at large when the system’s internal dynamics inevitably bring it crashing down.
EUR/USD extended Monday’s positive momentum, pushing closer to the key 1.2000 level and reaching highs not seen since June 2021. The latest advance reflects continued selling pressure on the U.S. dollar, supported by a constructive risk backdrop and renewed investor focus on potential tariff-related risks stemming from the White House.
Macro & Fundamental Overview
EUR/USD’s bullish momentum remains firmly intact, closely mirroring persistent selling pressure on the U.S. dollar, which continues to be weighed down by concerns over trade policy, questions surrounding the Federal Reserve’s independence, and renewed shutdown risks.
The pair extended its advance for a fourth straight session on Tuesday, edging closer to the pivotal 1.2000 level for the first time since June 2021.
The latest leg higher reflects a further deterioration in the dollar’s outlook amid revived trade tensions and geopolitical uncertainty, all ahead of the Federal Reserve’s interest rate decision due on Wednesday.
Meanwhile, sentiment surrounding U.S.–European Union trade relations has improved after President Donald Trump softened his rhetoric last week regarding potential tariffs tied to the Greenland dispute. Markets have interpreted this shift positively, boosting risk appetite and lending support to the euro alongside other risk-sensitive currencies.
By contrast, the U.S. dollar continues to underperform. The Dollar Index (DXY) remains under heavy pressure, extending its decline toward the 96.00 area — levels last seen in late February 2022.
The FED: Rates on hold, politics in focus
The Federal Reserve delivered its widely anticipated December rate cut, but the key signal came from its messaging rather than the policy action itself. A divided vote and Chair Jerome Powell’s measured language suggested that additional easing is far from assured.
The Fed begins its two-day policy meeting today, with markets largely expecting rates to remain unchanged when the decision is released on Wednesday.
However, monetary policy may not be the primary focus this time. Market attention has increasingly turned to questions surrounding the Fed’s independence after reports earlier this month of a Justice Department investigation involving Chair Powell.
Compounding the uncertainty, President Trump has indicated that an announcement on his nominee for the next Fed Chair could be imminent, keeping scrutiny on the central bank well beyond the outcome of this week’s meeting.
ECB urges patience, not complacency
The European Central Bank left interest rates unchanged at its December 18 meeting, adopting a more measured and patient tone that has pushed expectations for near-term rate cuts further into the future. Modest upward revisions to growth and inflation projections helped underpin this approach.
Minutes from the meeting, released last week, showed policymakers saw little immediate need to adjust policy. With inflation hovering near target, the ECB has room to remain patient, while still retaining flexibility should risks materialize.
Governing Council members emphasized that patience does not equate to complacency. Monetary policy is viewed as appropriately calibrated for now, but not on autopilot. Markets appear to have absorbed this message, currently pricing in just over 4 basis points of easing over the coming year.
Positioning remains constructive, but confidence has softened
Speculative positioning remains tilted toward the euro, although bullish conviction appears to be easing.
CFTC data for the week ended January 20 show non-commercial net long positions declining to a seven-week low of around 111.7K contracts. At the same time, institutional participants also reduced short positions, which now stand near 155.6K contracts.
Meanwhile, open interest slipped to approximately 881K contracts, breaking a three-week streak of increases and suggesting that market participation may be thinning alongside fading confidence.
Key Events Ahead
Near term: The FOMC meeting is set to keep attention firmly on the U.S. dollar, while flash inflation data from Germany and preliminary GDP readings for the euro area will dominate the regional data calendar later in the week.
Risk: A more hawkish-than-expected outcome from the Fed could quickly tilt momentum back in favor of the dollar. In addition, a clear break below the 200-day simple moving average would increase the risk of a deeper medium-term correction.
EUR/USD Technical Outlook
EUR/USD continues to exhibit a firm bullish bias, trading at levels last seen in mid-2021 while gradually shifting focus toward the key 1.2000 psychological handle.
On the downside, initial support is located at the 2026 low of 1.1576 (January 19), reinforced by the closely watched 200-day simple moving average. A more pronounced correction could open the door to the November 2025 trough at 1.1468, followed by the August base at 1.1391.
Momentum indicators remain broadly supportive of further gains, although elevated conditions may challenge the immediate upside. The Relative Strength Index is hovering near 75, pointing to overbought territory, while an Average Directional Index reading above 26 confirms the presence of a well-established trend.
Bottom Line
For the time being, EUR/USD continues to be influenced primarily by U.S.-centric developments rather than euro area dynamics.
Absent clearer signals from the Federal Reserve on the extent of potential policy easing, or a more compelling cyclical recovery in the eurozone, any additional upside is likely to unfold in a steady, incremental manner rather than marking the beginning of a decisive breakout.
Gold prices climbed toward a fresh record near $5,220 during Asian trading on Wednesday, extending gains on a weaker U.S. dollar, persistent geopolitical tensions and ongoing economic uncertainty. Investors are now awaiting the Federal Reserve’s interest rate decision later in the day for further direction.
Fundamental Analysis Overview
Expectations of further policy easing by the U.S. Federal Reserve, persistent selling pressure on the U.S. dollar, continued central bank purchases, and record inflows into exchange-traded funds have provided strong support for gold prices.
Although U.S. President Donald Trump stepped back from a tariff threat after saying a framework agreement had been reached on a future Greenland deal with NATO, the brief episode raised concerns about the reliability of global alliances. These doubts, combined with the prolonged Russia–Ukraine conflict, continue to fuel safe-haven demand for gold. Russia launched another large-scale drone and missile assault on Ukraine during the second day of U.S.-mediated peace talks in Abu Dhabi over the weekend, which concluded without an agreement. While trilateral discussions are set to resume on February 1, expectations for a breakthrough in the nearly four-year conflict remain low, keeping geopolitical risks elevated.
Further weighing on market sentiment, Trump warned on Saturday that the U.S. could impose a 100% tariff on Canada should it proceed with a trade agreement with China. The possibility of renewed tensions over Greenland and other unpredictable policy moves from the Trump administration has undermined confidence in the U.S. dollar. As a result, the Dollar Index (DXY) has fallen to its lowest level since September 2025, pressured further by market expectations that the Fed could cut rates twice more in 2025. This environment continues to favor non-yielding assets such as gold, particularly as attention turns to the two-day FOMC meeting that began on Tuesday.
The Federal Reserve is set to announce its policy decision on Wednesday and is widely expected to keep interest rates unchanged. As such, investor focus will center on the accompanying statement and Fed Chair Jerome Powell’s press conference for signals on the future policy path. Any guidance on the timing and pace of potential rate cuts will be critical in shaping near-term dollar movements and determining gold’s next directional move. In the shorter term, U.S. Durable Goods Orders data due later Monday could generate trading opportunities during the North American session.
On the demand side, the People’s Bank of China extended its gold-buying streak for a fourteenth consecutive month in December. Other emerging market central banks, including those of Poland, India, and Brazil, were also active buyers in late 2025 and early 2026. Meanwhile, global investment demand through gold ETFs rose 25% in 2025, with total holdings increasing to 4,025.4 tonnes from 3,224.2 tonnes a year earlier. Assets under management climbed to $558.9 billion, reinforcing gold’s bullish case and supporting expectations for a continuation of the well-established uptrend amid a favorable fundamental backdrop.
XAU/USD Technical Outlook
The rising channel originating from $4,464.07 continues to support the broader uptrend, with upside currently constrained near $5,101.21. The MACD remains in positive territory, although the histogram is starting to narrow, indicating fading momentum even as the MACD line stays above the signal line. Meanwhile, the RSI is elevated around 78, signaling overbought conditions that may limit near-term gains and favor consolidation near the upper boundary of the channel.
Should prices fail to break decisively above the channel top, a corrective move toward support at $4,934.92 could develop. Further contraction in the MACD histogram would strengthen the case for a pullback, while a downturn in the RSI from overbought levels would point to mean reversion within the channel. On the other hand, if bullish momentum persists and MACD remains supportive, the prevailing uptrend would stay intact, maintaining the upside bias defined by the ascending channel.
Oil prices climbed in Asian trading on Wednesday, extending the previous session’s gains after severe cold weather disrupted U.S. production, signaling tighter supply conditions.
Crude was also supported by a weaker dollar, which slid to near a four-year low this week, while markets continued to monitor heightened tensions between the United States and Iran following comments from President Donald Trump that a second armada was heading to the Middle East.
Brent futures for March edged up 0.1% to $67.66 a barrel, hovering near a four-month high, while U.S. West Texas Intermediate futures rose 0.2% to $62.53 a barrel by 20:49 ET (01:49 GMT).
Oil prices jump as U.S. snowstorm disrupts supply
Oil’s advance this week was largely fueled by a powerful winter storm sweeping across the United States, which disrupted crude output in several producing regions.
Exports from the U.S. Gulf Coast were also brought to a standstill, as heavy snowfall and sub-zero temperatures blanketed large parts of the country. According to Reuters estimates, roughly 2 million barrels per day of production were affected over the weekend.
These supply interruptions have prompted traders to brace for sharp drawdowns in U.S. crude inventories in the weeks ahead, signaling tighter supply conditions in the world’s largest oil-consuming market.
API data points to declining U.S. inventories
Figures from the American Petroleum Institute released late Tuesday showed an unexpected decline in U.S. crude inventories last week. Stockpiles fell by roughly 250,000 barrels, according to the API, defying expectations for a 1.45 million-barrel build.
The API report often foreshadows a similar trend in the official inventory data, which is scheduled for release later on Wednesday.
Oil gains on softer dollar ahead of Fed rate call
A weaker dollar also lent support to oil prices, as declines in the greenback tend to boost demand for commodities priced in the U.S. currency.
The dollar index fell to near a four-year low on Tuesday, weighed down by investor concerns over U.S. economic uncertainty, the impending Federal Reserve interest rate decision, and intermittent trade and geopolitical policy moves under President Donald Trump.
The Fed is broadly expected to keep interest rates unchanged at the end of its meeting later in the day, with markets focused on signals from Chair Jerome Powell regarding the policy outlook for the year ahead.
Gold prices climbed to a record above $5,200 an ounce on Wednesday, supported by robust safe-haven demand and persistent weakness in the U.S. dollar. Other precious metals also stayed firm, with silver and platinum trading near recent record highs.
Spot gold edged lower to $5,179.41 an ounce by 19:55 ET (00:55 GMT) after briefly touching a record peak of $5,202.06. Meanwhile, April gold futures jumped 1.8% to $5,215.46 an ounce.
Safe-haven demand remained strong after U.S. President Donald Trump said a second armada was heading toward Iran, while expressing hope that Tehran would agree to a deal with Washington.
Gold’s rally this year has been largely driven by uncertainty surrounding U.S. policy, with heightened geopolitical tensions fueled by developments in Venezuela and a dispute over Greenland.
A weaker dollar also provided support to gold and broader metals markets, as investor concerns grew over elevated fiscal spending and the Federal Reserve’s independence under the Trump administration. Policy uncertainty pushed the dollar to multi-year lows earlier this week.
Trump said on Tuesday that he was close to naming a successor to Fed Chair Jerome Powell, adding that interest rates would decline under new leadership. Ongoing friction between the White House and the Federal Reserve has further underpinned gold prices, as markets remain wary of political pressure on the central bank.
Elsewhere in metals markets, spot silver gained 1.2% to $113.4325 an ounce, while spot platinum climbed 0.6% to $2,669.61. Both were trading near record levels.
U.S. stock index futures were largely unchanged late Tuesday as investors remained cautious ahead of the Federal Reserve’s interest rate decision and a busy earnings schedule featuring major technology leaders.
S&P 500 futures edged up 0.1% to 7,017.50, while Nasdaq 100 futures rose 0.3% to 26,155.75 by 20:10 ET (00:10 GMT). Dow Jones futures were flat at 49,154.0.
S&P 500 closes at a record as Dow edges lower on Medicare concerns
During Tuesday’s regular session, the S&P 500 climbed 0.4% to a record closing high, extending its advance as investors rotated back into growth stocks and responded positively to broadly solid earnings results. Gains in technology shares led the move, pushing the benchmark to a fresh peak.
The Nasdaq Composite jumped 0.9%, driven by strength in megacap stocks.
Meanwhile, the Dow Jones Industrial Average fell 0.8%, weighed down by steep declines in healthcare and insurance shares. Major health insurers came under pressure after the U.S. government released a Medicare Advantage payment plan that the market perceived as less favorable than anticipated.
Markets focus on Fed decision and megacap earnings
Investor focus has shifted squarely to the Federal Reserve, which kicked off its two-day policy meeting on Tuesday. The central bank is widely expected to leave interest rates unchanged when it delivers its decision on Wednesday, with markets pricing in a pause as policymakers assess easing but still-elevated inflation alongside signs of steady economic growth and a resilient labor market.
Close attention will be paid to Fed Chair Jerome Powell’s remarks for indications on how long rates may remain at current levels and when eventual cuts could begin.
“The key will be any dissent and the Fed’s communication, particularly around questions of central bank independence,” ING analysts said, adding that the decision will also be overshadowed by President Trump’s upcoming nomination of a new Fed chair.
Corporate earnings are another major catalyst this week, with four members of the so-called “Magnificent Seven” technology group set to report. Tesla, Meta Platforms and Microsoft are scheduled to post results on Wednesday, followed by Apple on Thursday.
Given their heavy weighting in major equity indexes, guidance from these companies on artificial intelligence investment, cloud demand and consumer trends is expected to play a key role in shaping near-term market direction.
President Donald Trump once again surprised markets by announcing an increase in tariffs on South Korea to 25% from 15%, citing Seoul’s failure to implement a trade agreement reached last July. The move targets sectors such as autos, lumber, and pharmaceuticals, yet South Korean equities ended up surging 2% to fresh record highs. The KOSPI initially slid more than 1%, but the dip quickly attracted buyers seeking exposure to Asia’s strongest-performing equity market of 2025.
With South Korea’s industry minister set to travel to Washington, investors appear to be betting on a negotiated climbdown, reviving the popular “TACO” trade—Trump Always Chickens Out. Few are surprised that Seoul has been reluctant to commit massive U.S. investments while the risk of abrupt tariff threats remains a defining feature of the administration.
Tariff uncertainty also boosted demand for precious metals, pushing gold and silver back toward record levels. Gold rose 1% to $5,063 an ounce, while silver jumped 5% to $109 an ounce.
Asian equities were broadly firmer, supported by optimism that blockbuster earnings from the U.S. “Magnificent Seven,” beginning with Meta, Microsoft and Tesla later this week, will help sustain the global equity rally into 2026. MSCI’s Asia-Pacific index excluding Japan climbed 1% to a new high, while Japan’s Nikkei added 0.7%, even as the yen hovered near a two-month peak—normally a headwind for exporters.
European equities are poised for a firmer open, with EURO STOXX 50 futures up 0.3%. U.S. futures are also higher, as Nasdaq futures climb nearly 0.6% and S&P 500 futures rise 0.3%. The global economic calendar remains relatively quiet ahead of Wednesday’s Federal Reserve policy decision, at which interest rates are widely expected to be left unchanged. Nevertheless, the meeting is likely to be dominated by the Justice Department’s investigation into Fed Chair Jerome Powell, adding extra scrutiny to his post-meeting press conference. Any indication that Powell may choose to remain on the Fed’s board after his term ends in May—a move permitted under Fed rules—could provoke an unpredictable reaction from President Trump.
A crucial Federal Reserve interest rate decision is set to dominate attention this week, especially after news of a criminal investigation into Chair Jerome Powell heightened concerns about the central bank’s independence. At the same time, several major technology firms are scheduled to release quarterly earnings, with investors watching closely for evidence that heavy investments in artificial intelligence are beginning to pay off. Adding to market uncertainty, President Donald Trump has issued a renewed tariff threat against Canada, keeping geopolitical risks firmly in focus.
Fed decision ahead
This week’s agenda is expected to be led by the Federal Reserve’s interest rate decision on Wednesday, following a two-day policy meeting focused on setting borrowing costs as the U.S. economy remains broadly resilient. While employment—previously a key driver of rate cuts in 2025—appears stable amid subdued hiring and limited layoffs, inflation has held steady but remains above the Fed’s 2% target. Some analysts caution that economic growth is becoming increasingly “K-shaped,” with stronger performance among higher-income households and corporations, while lower-income earners face rising living costs. Against this backdrop, the Fed is widely expected to leave rates unchanged at 3.5%–3.75%, with CME FedWatch indicating that the next rate cut is unlikely before June.
Attention shifts to who could replace Powell
January’s Federal Reserve meeting takes place amid repeated calls from President Trump for swift and aggressive rate cuts to stimulate economic growth, alongside his criticism of officials for resisting such moves. Long-standing concerns over the Fed’s political independence intensified earlier this month after the Justice Department launched a criminal investigation into Chair Jerome Powell. In an unusual public response, Powell condemned the probe, characterizing it as an attempt to pressure monetary policy in line with the White House’s preferences.
Appointed during Trump’s first term, Powell now has only a few months remaining as Fed chair, and markets are closely watching whether tensions with the administration could influence his decision to remain on the Fed’s rate-setting board after his term ends. Adding to the uncertainty is the question of who will succeed him. Prediction markets currently favor BlackRock executive Rick Rieder as the leading contender, overtaking former Fed Governor Kevin Warsh, while Trump has suggested he has narrowed his choice to a single candidate.
Major tech earnings in the spotlight
The earnings calendar this week will be dominated by results from major technology companies, including Meta Platforms, Microsoft, and Apple. Driven partly by excitement over advanced artificial intelligence applications, these firms have led equity markets in recent years. Their push to secure leadership in the AI race has prompted a sharp rise in capital spending, particularly on data centers and the semiconductors required to support AI workloads. While investors have largely been willing to overlook these heavy investments, expectations for meaningful revenue returns are now rising, with analysts describing 2026 as a “prove-it” year for big tech. This wave of earnings may provide the first clues as to whether those expectations are being fulfilled.
ASML to report
In Europe, attention will turn to ASML, the world’s leading supplier of chipmaking equipment, which is due to report earnings on Wednesday. The Dutch group’s market capitalization crossed the $500 billion mark earlier this month after key customer TSMC announced larger-than-expected capital spending plans to meet surging demand for AI chips. This milestone has cemented ASML’s position as Europe’s most valuable company, with analysts watching closely to see whether the AI boom can further accelerate its growth. However, ASML has so far issued a cautious outlook for the year ahead, with sales projected at best to remain flat, prompting concerns that the pace of new fab construction may be trailing the rapid expansion in AI-driven demand.
New tariff threat from Trump rattles markets
After seemingly backing away from earlier claims that he would impose punitive tariffs on several European countries unless the United States was permitted to buy Greenland, President Trump issued a fresh trade warning over the weekend, saying he would levy a 100% tariff on Canadian imports if Ottawa were to strike a trade agreement with China. In social media posts, Trump cautioned that Prime Minister Mark Carney—who recently visited China for trade discussions and spoke in Davos about the need for smaller economies to push back against coercion by global powers—could put Canada at risk by pursuing closer ties with Beijing.
Trump warned that China would severely damage Canada’s economy and society, stating that all Canadian goods entering the U.S. would face a 100% duty should such a deal be reached. Carney responded that Canada has no plans to seek a free trade agreement with China, stressing that Ottawa remains committed to its obligations under the USMCA and would consult both the U.S. and Mexico before pursuing any new trade arrangements. Analysts at Vital Knowledge noted that while the likelihood of the tariff threat being enacted appears low, Trump’s repeated and abrupt warnings are gradually weighing on investor sentiment.
OCBC has raised its end-2026 gold price target to $5,600 per ounce from $4,800, citing recent sharp gains and enduring structural demand rather than a shift in its core market view. Gold has climbed about 17% so far in 2026 and has stayed elevated despite periodic pullbacks.
The bank said prices are now supported less by isolated event risks and more by a prolonged environment of uncertainty that is driving diversification into non-sovereign assets. OCBC highlighted a persistent pricing premium that cannot be fully accounted for by traditional factors such as yields, the US dollar, ETF flows, volatility, or policy uncertainty. This premium reflects a geopolitical and uncertainty component increasingly embedded in gold prices, fueled by ongoing geopolitical tensions, policy unpredictability, and concerns over confidence in the dollar. OCBC added that the broader uptrend remains intact, underpinned by structural geopolitical risks, accommodative monetary conditions, and continued support from official sector and ETF demand.
Did you know that a form of technical analysis shares structural patterns with hurricanes, nautilus shells, sunflowers, music, and even human proportions? These phenomena—along with countless others—adhere to ratios derived from a numerical sequence: 0, 1, 1, 2, 3, 5, 8, 13, 21, 34, 55, 89… Known as the Fibonacci sequence, these numbers generate ratios that are widely used as a technical framework for analyzing and managing financial markets.
Before it sounds like we’re turning to biology—or worse, mysticism—to forecast stock prices, let’s explain how this concept is applied in a practical, market-driven way.
Fibonacci Patterns Are Everywhere
As shown in the diagram, drawing quarter-circle arcs across adjacent squares whose side lengths follow the Fibonacci sequence (1, 1, 2, 3, 5, 8, 13, 21, and so on) creates an expanding spiral that closely resembles the shape of a nautilus shell.
Each number in the sequence is the sum of the two numbers before it. Importantly, the ratios between consecutive Fibonacci numbers converge toward the golden ratio, 1.618, often referred to as Phi. Its inverse—obtained by dividing the smaller number by the larger—approaches 0.618, a relationship that underpins many Fibonacci-based applications in both nature and financial markets.
Below are several examples of natural and human-made phenomena that reflect the Fibonacci sequence and the golden ratio:
Spiral Galaxies: The arms of some galaxies expand outward in patterns that closely resemble a Fibonacci spiral.
Sunflowers: The arrangement of seeds often forms intersecting spirals—commonly 34 in one direction and 55 in the other, or sometimes 55 and 89—consistent with Fibonacci numbers.
Cauliflower: The spiraling florets frequently appear in counts such as five, eight, or thirteen per cluster, reflecting Fibonacci-based growth patterns.
Piano Keys: A standard octave contains 13 keys—8 white and 5 black—with the black keys grouped in sets of two and three.
The Mona Lisa: As noted by Math Central, the painting contains multiple golden rectangles. When a rectangle is drawn around the subject’s face, its proportions closely align with the golden ratio. Dividing this rectangle at eye level creates another golden rectangle, and similar proportions can be observed from her neck to the top of her hands.
It is widely believed that the Fibonacci sequence and the golden ratio underpin aspects of the brain’s structure and cognitive processes.
According to Professor Adrian Bejan of Duke University, as cited in The Atlantic:
“This represents the most efficient flow of visual information from the eye to the brain, which is why it so often appears in human-made designs that seem to be intentionally structured around the golden ratio.”
Market Prices and Fibonacci Relationships
Human brains are naturally inclined to search for, recognize, and react to patterns. As a result, we subconsciously gravitate toward Fibonacci relationships and the golden ratio. This tendency helps explain why many works of art, music, and poetry incorporate Fibonacci structures. It also sheds light on why Fibonacci-based tools can be effective for market technicians in identifying support and resistance levels, as well as projecting potential breakout targets.
Retracements/Support
Fibonacci sequences—particularly the golden ratio—are commonly used by technicians to identify potential support and resistance levels within a defined price range.
In the example shown, the selected range starts from the early April 2025 lows and extends to the highs formed in October and December. Once this range is established, Fibonacci retracement levels are applied to identify likely areas of support. The percentages referenced represent the portion of the total price range where Fibonacci-based support is expected to emerge.
78.6% – Derived from the square root of the golden ratio (61.8%). While not part of the Fibonacci sequence itself, this level is widely used in Fibonacci analysis.
61.8% – The golden ratio, calculated from the relationship between 55 and 34 (34 ÷ 55).
50% – Not a true Fibonacci retracement, but the midpoint of a range is a key psychological level and is commonly included in Fibonacci studies.
38.2% – A two-step retracement from 55 to 21 (21 ÷ 55), often viewed as a secondary support or resistance level.
23.6% – A three-step retracement from 55 to 13 (13 ÷ 55), typically representing shallow pullbacks within strong trends.
In the example above, the S&P 500 (SPY) is expected to find initial support near 640.34, which represents the first Fibonacci retracement level. The next key support area lies around 609.99, aligning with the 61.8% golden ratio retracement.
The Fibonacci chart referenced above was generated using SimpleVisor’s charting platform.
Fibonacci Extension/Profit Targets
Fibonacci analysis can also be used to project potential resistance levels once prices move to new highs. The main limitation of this approach is that it requires estimating where the trend is likely to peak, making it less reliable than the prior resistance analysis discussed earlier.
As illustrated in the chart, the same Fibonacci ratios are applied by extending the bullish trend from the recent high toward the 800 level.
Summary
You should never depend on a single form of technical analysis. The most effective insights come from combining multiple patterns and indicators. No method is infallible, but when several approaches point to the same conclusion, the probability of a favorable outcome increases.
Although skeptics argue that Fibonacci analysis is simply pattern recognition, its widespread use across financial markets highlights its lasting value as a tool that sits at the intersection of mathematics, investor psychology, and market behavior.
The year ahead offers a clear divide between bullish and bearish outcomes for investors. Will 2026 deliver another period of above-average returns, or mark a turning point toward disappointment? Optimists contend that the foundations for a sustained rally remain intact. A robust technology cycle, heavy corporate investment, and supportive policy settings all suggest further upside. Pessimists, however, warn that key growth drivers are losing momentum, market leadership has become uncomfortably narrow, and underlying economic stress is increasingly evident.
After a strong 2025, investors are entering a shifting market environment. Liquidity is still plentiful, but concerns over stretched valuations, labor-market pressure, and consumer resilience are mounting. Much hinges on how long optimism can outweigh economic realities, and whether expected gains from artificial intelligence and capital spending arrive quickly enough to counteract the drag from debt burdens, interest costs, and widening inequality.
Sentiment remains broadly constructive, though far from unanimous. Equity strategists are split, while bond markets reflect expectations of rate cuts alongside rising recession risk. Fiscal stimulus may postpone a downturn, but it also exacerbates longer-term imbalances. For investors, the central challenge is maintaining objectivity. Both the bullish and bearish narratives are credible, and timing will be decisive. In fact, 2026 could validate elements of both cases, making adaptability the most valuable strategy.
Below, we examine the bullish and bearish scenarios for 2026 in detail, assessing the macroeconomic and market forces behind each view. By translating these dynamics into practical portfolio considerations, investors can prepare for either outcome. Ultimately, success in 2026 will hinge less on forecasting accuracy and more on disciplined risk management.
The Bullish Case
The bullish thesis rests on several core pillars: a fresh surge in technology-led investment, accommodative fiscal policy, improving liquidity conditions, and the ongoing strength of both corporate balance sheets and consumer activity. Together, these forces have propelled markets higher, and proponents argue they will continue to support gains through 2026.
Central to the bull case is the rise of a potentially transformative technology cycle driven by artificial intelligence and large-scale infrastructure upgrades. Unlike earlier tech booms fueled primarily by optimism, this cycle is already translating into substantial capital spending. The so-called “Magnificent Seven” have collectively pledged over $600 billion toward data centers, semiconductor capacity, and AI-related services. This investment is rippling across software, energy, and industrial supply chains. Should the anticipated productivity improvements materialize, corporate earnings could accelerate, providing fundamental support for elevated valuations.
Fiscal policy is also positioned to support growth. Under a Trump-led administration, proposed tax cuts and direct transfers are expected to bolster both corporate activity and consumer spending. While $2,000 stimulus checks may not appear dramatic on their own, they can meaningfully lift short-term consumption and provide relief to small businesses. When paired with income tax reductions, these initiatives create a favorable backdrop for GDP growth and market sentiment. As recent history shows, following the 2022 market correction and widespread recession concerns, ongoing fiscal support has continued to play a stabilizing role in economic expansion.
The monetary environment is also turning more supportive for bulls. Quantitative tightening concluded in December 2025, and the Federal Reserve has since shifted toward what many describe as “QE Lite,” combining rate cuts with monthly purchases of roughly $40 billion in short-term Treasuries. Officially framed as “reserve management,” the objective is to maintain ample liquidity within the financial system. As interest rates decline, credit conditions are likely to loosen, providing a favorable backdrop for risk assets. Rising liquidity has historically supported higher equity valuations, with technology and growth stocks typically benefiting the most from this dynamic.
Corporate actions further reinforce the bullish narrative. Share buyback authorizations are projected to reach a new record of more than $1.2 trillion in 2026. Although often framed as a “capital return strategy”—a characterization that misses the point—buybacks have shown a strong correlation with equity market performance. Notably, since 2000, corporate repurchases have accounted for nearly all net equity demand, underscoring their outsized influence on stock prices.
Importantly, the notion that buybacks signal management’s confidence in future earnings is misleading. In practice, repurchases are frequently used as a form of financial engineering to boost per-share results and beat Wall Street expectations. This dynamic is likely to intensify in 2026, further supporting reported earnings growth and reinforcing the bullish case.
Finally, deregulation tied to the so-called “Big Beautiful Bill” is expected to relax capital requirements for banks, enabling them to hold a greater amount of collateral. While this should support the Treasury market, it also expands overall lending capacity. Much of that capacity is likely to flow into leverage for hedge funds and Wall Street trading desks, as looser regulatory constraints encourage greater risk-taking.
The bullish thesis ultimately rests on a reinforcing feedback loop: innovation spurs capital investment, rising investment lifts earnings, policy measures inject liquidity, and investors respond by increasing risk exposure. As long as each link in this chain remains intact, the upward trend can persist.
The Bearish Case
The bearish case starts with a key observation: many of the forces that powered the 2025 rally are now fading or already fully reflected in prices. Elevated valuations, softening economic data, and rising speculative excesses suggest that current market momentum may be masking deeper structural vulnerabilities. With that in mind, it is worth examining several of these risks more closely.
One of the most visible concerns is market concentration. In 2025, the bulk of equity gains came from just 10 companies on a market-capitalization-weighted basis, a dynamic amplified by the continued shift into passive ETF investing.
Passive investing has evolved from a niche approach into the dominant force shaping equity markets. Index funds and ETFs now represent more than half of U.S. equity ownership. Because these vehicles allocate capital according to market capitalization rather than valuation, fundamentals, or business quality, the largest companies attract a disproportionate share of inflows. This has created a powerful feedback loop in which rising prices draw in more capital, and those inflows, in turn, push prices even higher.
This narrow leadership is inherently fragile. Should investor flows into ETFs reverse, a disproportionate share of selling—roughly 40%—would be concentrated in the same 10 stocks. History shows that when market performance depends on a small handful of names, volatility tends to increase and drawdowns can be sharp.
Valuations present another clear risk. Price-to-earnings multiples on the S&P 500 remain near cycle peaks, leaving little room for error. Growth assumptions are ambitious, and even modest earnings disappointments could trigger a meaningful repricing. While enthusiasm around AI has driven a surge in investment, much of this spending is circular—companies are investing in AI largely to produce and sell AI-related products. That dynamic may prove self-limiting over time, particularly if end demand weakens or costs begin to outstrip returns.
A significant portion of the current investment cycle is also being financed with debt, as companies borrow to fund capital spending, repurchase shares, and sustain dividend payouts. If interest rates remain high or credit conditions deteriorate, rising debt-servicing costs could quickly erode earnings gains.
The broader economic risk is that the reallocation of capital toward technology and automation could sideline large segments of the workforce. While the buildout of data centers may employ thousands during construction, only a fraction of those jobs—perhaps a few hundred—remain once operations begin. Over time, this dynamic could weigh on employment growth, increase the risk of demand destruction, and may already be showing early warning signs.
This dynamic underpins the concept of a “K-shaped economy.” While high-income households and asset owners continue to prosper, lower-income consumers are facing increasing strain. Consumption patterns are diverging as financially pressured households cut back, leaving the top 20% of earners responsible for nearly half of total consumer spending. Signs of stress are already emerging, with rising auto loan and credit card delinquencies, stagnant real wages for many workers, and persistently high costs for housing and essential goods.
At the same time, risks within the credit system—particularly in private markets—are growing. Private credit has expanded rapidly in recent years, yet limited transparency makes it difficult to fully assess systemic vulnerabilities. Regulators have begun to pay closer attention, and default rates in middle-market lending are climbing. Should these stresses intensify, the fallout could extend across banks, hedge funds, and pension portfolios.
The bearish argument is not one of an imminent crash, but of growing fragility. Beneath the headline gains, the market appears increasingly exposed to earnings disappointments, tighter credit conditions, and weakening consumer demand.
The key takeaway is that 2026 may validate elements of both the bullish and bearish narratives. Preparation, rather than prediction, will be essential.
Navigating Whatever Comes Our Way
Investors should treat 2026 as a year in which both the bullish and bearish narratives may ultimately be validated. In the first half, bullish momentum is likely to persist, supported by strong sentiment, ample liquidity, and continued growth in corporate investment. Optimism around AI, fiscal support, and a potential pause in monetary tightening could propel equity indexes higher.
By the second half, however, underlying vulnerabilities may begin to surface. Elevated valuations increase sensitivity to earnings disappointments, while widening economic inequality could weigh on the outlook for consumer demand and corporate revenues. Should these pressures intensify, market sentiment could shift rapidly.
Navigating such a divided year will require a tactical approach—participating in early upside while avoiding excessive exposure to risks that may materialize later in the year.
Early 2026: Participate in Momentum, but Manage Exposure
Overweight sectors poised to benefit from capital spending and ample liquidity, including technology, industrials, and energy.
Prioritize high-quality growth companies with durable earnings and strong cash-flow generation, rather than momentum-driven narratives.
Implement trailing stop-loss strategies to protect gains if market sentiment shifts.
Use periods of volatility to add selectively, while scaling back position sizes as valuations become more stretched.
Avoid excessive concentration in AI-related stocks, even during strong rallies, as crowding increases dispersion and downside risk.
Mid-to-Late 2026: Emphasize Defense and Cash-Flow Stability
Gradually rotate toward defensive, value-oriented sectors such as healthcare, consumer staples, and utilities.
Increase exposure to dividend-paying companies with strong balance sheets and resilient cash flows.
Raise cash allocations or shift into short-duration Treasuries to preserve flexibility.
Allocate selectively to high-quality credit while reducing exposure to private credit and high-yield debt.
Monitor consumer credit conditions, labor-market trends, and bank earnings for early signs of financial stress.
Throughout the Year: Maintain Discipline and Objectivity
Adhere to valuation discipline regardless of shifts in market narratives.
Keep portfolios well diversified to withstand both volatility and sector rotation.
Let data—not headlines—drive allocation decisions.
Rebalance regularly, particularly if strong first-half performance leads to excessive concentration in certain sectors.
In 2026, tactical flexibility, risk awareness, and discipline are likely to matter more than adopting a purely bullish or bearish stance. It is a year in which both camps could be partially wrong. Markets rarely move in straight lines, but a sound investment process should remain consistent throughout.
The year ahead is likely to test investors with heightened volatility, as both the bullish and bearish arguments carry real weight. A new technology cycle may generate genuine economic momentum, yet it also introduces risks tied to elevated valuations, debt-fueled growth, and widening inequality. With markets effectively pricing in near-perfection, history suggests outcomes often fall short of expectations.
Whether 2026 delivers further gains or a sharp correction, performance will hinge on effective risk management. Avoid anchoring to any single narrative. Let data guide decisions, respect your signals, and remain willing to adjust as conditions evolve.
Ultimately, the objective is not to chase short-term returns, but to endure—and compound—across full market cycles.
Gold has climbed beyond $5,100, underpinned by a softer US dollar and strong, persistent structural demand. Solid technical momentum and ongoing global policy uncertainty continue to favor hard assets such as gold and silver. While the focus on potential FX intervention raises the risk of near-term profit-taking, the broader rally still shows little sign of losing steam.
Gold surged to a fresh record of $5,100 an ounce, while silver extended its rally with another 5% jump to around $110. The latest advance has been fueled by persistent US dollar weakness, signs of yen intervention, and broader unease over fiat currencies—long a structural pillar of gold’s appeal. Ongoing global policy uncertainty is also channeling capital into hard assets.
With such an extensive list of supportive factors, even the most bullish investors may question how long the rally can continue without at least a pause, especially given how stretched valuations have become. The temptation for profit-taking at these levels is clear. Yet prices continue to refuse to roll over, and that resilience is becoming the key narrative. Despite a fading geopolitical risk premium and last week’s tariff U-turn by Trump—which, in theory, should have dampened safe-haven demand—gold barely reacted and instead pushed even higher, underscoring the strength of the current trend.
US dollar remains under pressure amid easing rate expectations and declining investor confidence.
At first glance, the explanation seems simple: the US dollar has weakened, giving gold a natural boost. A softer greenback makes gold more affordable for non-US buyers, and that effect is clearly visible. However, this move goes beyond a straightforward FX translation. Gold prices have also been rising in euro and sterling terms, pointing to broader, more structural demand rather than just currency-driven gains.
That said, dollar weakness is still playing an important role. The greenback has slid amid recent geopolitical fractures, and suspected Japanese intervention in USD/JPY has added further pressure. Markets are increasingly convinced that Japanese authorities stepped in when USD/JPY pushed beyond 159. What really caught investors’ attention were reports that the Federal Reserve was “rate-checking” banks in New York around the London close. The idea that this may have been more than unilateral action by Tokyo—potentially involving coordination with Washington—is significant, as joint Japan–US intervention would send a far stronger signal than Japan acting alone.
Bullish momentum remains firmly intact, with strong follow-through buying and little sign of exhaustion despite overextended conditions.
Momentum is clearly carrying much of the move. The uptrend remains firmly intact, with trend-following behavior dominating as traders continue to buy dips rather than sell into strength. As long as that pattern persists, it is difficult to make a convincing case against further near-term gains.
From a psychological standpoint, the $5,000 threshold has now been decisively cleared. It may have seemed ambitious only a few sessions ago—much like $4,000 did not long before—but strong technical momentum, a weakening US dollar narrative, and rising anxiety in global bond markets have made these once-distant milestones appear increasingly attainable.
That said, macro fundamentals still deserve attention. Real yields, growth expectations, and inflation dynamics have not vanished, and eventually they will reassert influence. When they do, gold may find it harder to sustain these elevated levels without a renewed or deeper systemic risk backdrop.
Key Levels to Monitor
For now, the bias remains to the upside. The next resistance target is near $5,182, corresponding to the 261.8% Fibonacci extension of the major October downswing, with the $5,200 psychological level just above. On the downside, multiple support zones are in focus, starting with $5,000. Other round-number levels such as $4,900 and $4,800 may also provide support, while more significant longer-term support is seen around $4,500–$4,550.
As long as the dollar stays weak, central banks continue to be net buyers of gold, and governments openly signal a willingness to intervene in FX markets, it is difficult to identify a catalyst that would meaningfully reverse gold’s advance at this stage, aside from bouts of profit-taking.
The Japanese yen finds it hard to build on recent strong gains as worries over Japan’s fiscal position persist. However, a relatively hawkish Bank of Japan stance and concerns about potential currency intervention could continue to support the yen. Meanwhile, the US dollar remains near a four-month low on expectations of Fed rate cuts, helping to limit upside in USD/JPY.
The Japanese yen comes under modest selling pressure during Tuesday’s Asian session, pulling back further from its strongest level against the US dollar since November 2025, reached a day earlier. Sentiment toward the yen remains fragile as investors worry about Japan’s fiscal outlook, driven by Prime Minister Sanae Takaichi’s expansive spending proposals and tax cut plans. A broadly upbeat mood in equity markets, along with domestic political uncertainty ahead of the snap election scheduled for February 8, is also weighing on the safe-haven currency.
However, downside pressure on the yen may be limited by expectations that Japanese authorities could intervene to prevent excessive weakness, especially given the Bank of Japan’s relatively hawkish stance. Meanwhile, the US dollar stays near a four-month low as markets price in two additional Federal Reserve rate cuts this year. The ongoing “Sell America” theme further dampens demand for the greenback, which should help restrain USD/JPY movements as investors turn their attention to the key two-day FOMC meeting beginning later today.
Japanese yen bears remain cautious as intervention speculation offsets political uncertainty.
Japan’s already stretched public finances have come under sharper scrutiny following Prime Minister Sanae Takaichi’s campaign pledge to suspend the sales tax on food items ahead of the snap lower house election on February 8. Concerns over the country’s fiscal outlook have been a major driver behind the recent jump in long-dated Japanese government bond yields, which raises debt servicing costs and, in turn, limits the Japanese yen’s upside.
Data released earlier on Tuesday showed a slowdown in wholesale inflation, with the Producer Price Index rising 2.4% year-on-year in December, down from 2.7% in November. Additional figures indicated that the Corporate Service Price Index increased 2.6% YoY, slightly lower than the previous reading. Overall, the data offered little to challenge the Bank of Japan’s tightening trajectory and had a limited impact on the yen.
The BoJ recently raised its economic and inflation forecasts while keeping short-term rates unchanged at the conclusion of its two-day meeting last Friday, signaling its readiness to continue gradually lifting still-low borrowing costs. This stance contrasts sharply with expectations for a more dovish US Federal Reserve, leaving the US dollar under pressure near a four-month low and lending support to the yen amid fears of possible official intervention.
Reinforcing this view, Prime Minister Takaichi said on Sunday that authorities are prepared to take action against speculative and highly abnormal market moves, following rate checks by Japan’s Ministry of Finance and the New York Fed on Friday. Still, traders appear reluctant to take aggressive positions ahead of the two-day FOMC meeting beginning today, which is expected to be a key driver for the US dollar and the USD/JPY pair in the near term.
USD/JPY needs to establish a sustained break below the 100-day SMA to strengthen the case for further downside.
The USD/JPY pair showed signs of resilience below its 100-day Simple Moving Average (SMA) on Monday, although it continues to trade beneath the 154.75–154.80 horizontal support zone. The MACD histogram has moved further into negative territory, with the MACD line below the signal line, reflecting bearish momentum that remains below zero. Meanwhile, the RSI stands near 32, close to oversold territory, suggesting that the downside move may be becoming stretched.
A daily close below the 100-day SMA at 153.81, which currently provides near-term support, would give bears greater control. In contrast, sustained trading above this level would keep the broader bias supported by the rising SMA. Signs of stabilization would include a flattening MACD histogram and a move back toward the zero line, while an RSI rebound toward 50 would improve the overall tone. On the other hand, a dip below 30 on the RSI would increase the risk of deeper losses.
Oil prices edged lower in Asian trading on Tuesday as markets focused on rising US-Iran tensions, while also monitoring potential supply disruptions caused by extreme winter weather in the United States.
Crude had gained in recent sessions on fears that tensions with Iran could disrupt supply, while a severe snowstorm in the US was estimated to have shut in up to 2 million barrels of oil production over the weekend.
However, expectations of tighter supply were tempered after Kazakhstan signaled it would resume production at the Tengiz oil field, its largest producing asset.
Brent crude futures for March slipped 0.6% to $65.22 a barrel, while West Texas Intermediate futures fell 0.5% to $60.33 a barrel by 21:20 ET (02:20 GMT).
Iran tensions, US weather disruptions in focus
A US aircraft carrier and several destroyers were seen arriving in the Middle East over the weekend. President Donald Trump said last week that an “armada” was headed toward Iran, though he expressed hope it would not be used.
The deployment followed Trump’s warnings to Iran over the killing of protesters during recent nationwide demonstrations, although unrest has eased in recent weeks and his rhetoric toward Tehran has softened.
Meanwhile, a severe snowstorm in the US caused widespread disruptions, halting oil production and straining the power grid, with markets closely watching whether prolonged outages could further tighten crude supplies.
Kazakhstan signals plans to resume production at the Tengiz oil field.
Kazakhstan said on Monday it will resume output at the Tengiz oil field after a fire and power outage halted production. However, Reuters reported that initial volumes are expected to be limited, as the country has yet to lift a force majeure on CPC Blend exports.
Kazakhstan is the world’s 12th-largest oil producer and a member of OPEC and its allies. The group is expected to keep production levels unchanged at its February 1 meeting, after steadily increasing output through 2025 before announcing a pause late last year to curb prolonged weakness in oil prices.
Bitcoin hovered near one-month lows on Monday, extending last week’s sharp losses as investors stayed cautious ahead of the Federal Reserve’s policy meeting and amid heavy liquidations in leveraged crypto markets.
The world’s largest cryptocurrency was last down 0.7% at $88,081 as of 09:36 ET (14:36 GMT).
Bitcoin has fallen more than 6% over the past week, pressured by a broader risk-off mood driven by uncertainty over global monetary policy, volatility in US Treasury yields, and sharp swings in foreign exchange markets.
Crypto markets remain under pressure as heavy liquidations and Federal Reserve caution weigh on sentiment.
Last week’s selloff was intensified by forced liquidations in derivatives markets, where highly leveraged positions were rapidly unwound. Market data shows more than $1 billion in leveraged crypto positions were liquidated, with long Bitcoin trades making up most of the losses, amplifying the downward price move.
Bitcoin had surged earlier this year on hopes of easier US monetary policy and steady inflows into spot ETFs, but sentiment has since turned cautious as investors reassess the interest-rate outlook and cut risk exposure amid volatility in currency and bond markets.
Focus now shifts to the Federal Reserve’s two-day policy meeting ending Wednesday. While rates are expected to remain unchanged, markets will watch Chair Jerome Powell’s comments closely for signals on the timing and extent of potential rate cuts later this year.
Investors are also watching signals on liquidity conditions and the Fed’s balance sheet, both key drivers for crypto markets.
Adding to the uncertainty, traders are awaiting US President Donald Trump’s expected announcement of his nominee for the next Federal Reserve chair, an appointment that could shape future monetary policy, especially if the new leadership is viewed as more dovish or closely aligned with the administration’s economic agenda.
Strategy increases its Bitcoin holdings with a $264 million purchase.
Strategy said it bought 2,932 more Bitcoins for about $264 million between Jan. 20 and Jan. 25, paying an average price of $90,061 per coin, according to a regulatory filing released Monday.
The purchase raises the company’s total Bitcoin holdings to 712,647 tokens, valued at roughly $62.5 billion.
Led by Michael Saylor, the firm has accumulated its Bitcoin position at an average cost of $76,037 per coin, bringing total investment to about $54.2 billion, including related expenses.
Crypto price today: Altcoins remain weak
Most altcoins stayed under pressure on Monday, extending losses amid cautious sentiment. Ethereum slipped 0.4% to $2,916.08, while XRP rose 1.5% to $1.91. Solana fell 1.8%, with Cardano and Polygon largely flat. Among meme tokens, Dogecoin edged up 0.3%, while $TRUMP declined 1%.
AUD/USD hovers near its 16-month high of 0.6940, supported by rising Australian three-year bond yields at 4.27%, while a weaker US Dollar amid political uncertainty and shutdown risks adds to the upside.
AUD/USD is holding near its 16-month high of 0.6940 set in the prior session, trading around 0.6920 during Tuesday’s Asian hours, as markets await Australia’s December CPI data on Wednesday for fresh cues on the RBA’s policy outlook.
The Australian Dollar is underpinned by higher government bond yields, with the policy-sensitive three-year yield climbing to 4.27%, its highest since November 2023, supported by confidence in Australia’s strong credit rating and the RBA’s relatively hawkish stance.
Australia’s strong PMI and employment data have strengthened expectations of tighter RBA policy. While inflation has eased from its 2022 peak, recent figures point to renewed upward pressure, with headline CPI slowing to 3.4% YoY in November but still above the RBA’s 2–3% target range.
AUD/USD may find further support as the US Dollar weakens on rising political uncertainty, with the risk of a partial US government shutdown ahead of the January 30 funding deadline after Senate Democratic leader Chuck Schumer vowed to oppose a key funding bill.
Market caution is also heightened by uncertainty around the Federal Reserve, after President Donald Trump said he would soon name a successor to Fed Chair Jerome Powell, raising speculation over a more dovish policy stance. Attention now turns to Wednesday’s Fed decision.
The US Dollar Index stays under pressure near 97.00 in Tuesday’s Asian session as concerns over Fed independence grow ahead of expectations that rates will remain unchanged at Wednesday’s meeting.
The US Dollar Index (DXY) weakened toward 97.00 in Asian trading on Tuesday, with investors awaiting the US ADP Employment Change and Consumer Confidence data later in the day.
Concerns over the Federal Reserve’s independence have pushed the DXY to its lowest level since September 18, 2025, after President Donald Trump said he would soon name a successor to Fed Chair Jerome when his term ends in May. According to Reuters, betting markets see BlackRock executive Rick Rieder as the leading candidate.
Tim Duy, chief US economist at SGH Macro Advisors, noted that the actions of the next Fed chair cannot be separated from broader economic conditions or their influence on other FOMC members.
Adding to the USD’s downside risks are fears of a US government shutdown, with Senate Democratic leader Chuck Schumer pledging to block a funding bill that includes Homeland Security appropriations. Lawmakers face a January 30 deadline to avoid a partial shutdown.
Meanwhile, the Fed is widely expected to keep rates unchanged at Wednesday’s meeting after three straight cuts late in 2025. Markets will focus on the press conference for signals on the economic outlook and future rate path, with any hawkish tone potentially limiting near-term USD losses.
U.S. stock index futures showed minimal movement on Monday night, with Dow futures edging lower after a policy proposal from the Trump administration, as investors stayed cautious ahead of an important Federal Reserve decision and major tech earnings.
S&P 500 futures hovered near flat at 9,982.0, while Nasdaq 100 futures rose 0.2% to 25,898.2 by 19:54 ET (00:54 GMT). Meanwhile, Dow Jones futures slipped 0.3% to 49,409.0.
Wall Street ended higher, with the Dow up 0.6%, the S&P 500 gaining 0.5%, and the Nasdaq rising 0.4%.
The Trump administration proposed flat-rate payments for Medicare Advantage.
Dow futures edged lower after major health insurers slumped in late trading, following a Trump administration proposal to keep Medicare Advantage payment rates nearly flat, below market expectations. Shares of UnitedHealth, Humana, and CVS fell sharply on concerns that weaker reimbursement growth would squeeze margins amid rising medical costs. Separately, President Trump announced a hike in tariffs on South Korean imports to 25%, citing Seoul’s failure to ratify a trade deal.
Investors await the Fed decision and key megacap earnings.
Markets are in wait-and-see mode ahead of the Fed meeting, with rates expected to stay unchanged and focus on signals about future cuts. Attention is also on earnings from the “Magnificent Seven,” with results from Microsoft, Meta, Tesla, and Apple likely to shape sentiment, especially around AI investment, demand trends, and margins.
Demo trading is a way to practice trading using virtual (fake) money in a simulated market environment that mirrors real market prices—without risking real capital.
What demo trading is used for?
Learn how a trading platform works (placing orders, stop-loss, take-profit)
Practice trading strategies in live market conditions
Understand market behavior before trading with real money
Test risk management rules
How demo trading works
You’re given a virtual account balance (e.g., $10,000 or $100,000)
Trades use real-time market data
Profits and losses are simulated only—no real money involved
Advantages
No financial risk
Ideal for beginners
Helps reduce costly mistakes
Limitations
Lacks real emotional pressure
Slippage and liquidity may not be fully realistic
Can encourage overtrading if not taken seriously
Demo Trading vs Real Trading
Demo trading is like a flight simulator for pilots
Real trading adds emotion, discipline, and psychological stress
Best practice
When you transition to live trading:
Start with small capital
Trade exactly as you did in demo
Focus on risk control, not profits
Global demo trading or trading simulator in the education
This is taught in a very structured and rigorous way at Curtin University, where Thanh Nguyen studied. The program provides a comprehensive understanding of how markets move, and Curtin University’s trading room offers an optimized, real-world environment for practical trading education.
Wednesday brings the FOMC meeting and Chair Powell’s press conference, and it wouldn’t be surprising if President Trump chose that moment—ideally around 2:30 p.m. ET—to announce his pick for the next Fed chair. Such timing would dominate headlines, catch financial media off guard, and inject maximum uncertainty into markets.
That said, the Fed is not expected to cut rates at this meeting, which should keep the event relatively uneventful. In the bigger picture, what the Fed does between now and May may prove less important, particularly if a new chair is appointed and moves quickly toward easing.
Markets appear to be dialing back expectations for aggressive rate cuts. Current pricing suggests the fed funds rate settles near 3.25% by December, with little additional easing beyond that. To meaningfully shift those expectations, the nominee would likely need to be notably dovish—something markets already anticipate, given the widespread assumption that Trump will select a policy-leaning accommodator.
As a result, the risk of a breakout in the 2-year Treasury yield appears increasingly credible, with initial resistance near 3.62%. Beyond that, a move back toward the 4% level cannot be ruled out. From a technical perspective, the setup supports this view: the 2-year yield has formed multiple bottoms in recent months, and the RSI has begun to turn higher, signaling building upside momentum.
The direction of the 2-year yield may ultimately be more closely linked to oil prices. With inflation still hovering near 3% and crude having fallen to around $60 from highs in the $120s, the message is clear: a rebound in oil prices could quickly reignite inflation pressures. That dynamic likely explains why the price action in oil and the 2-year yield charts has begun to look strikingly similar.
The Bank of Japan once again chose to kick the can down the road, leaving rates unchanged and, in my view, offering little in the way of a clear policy roadmap. The yen’s strength on Friday appeared to be driven solely by reports of a possible “rate check” by the New York Fed on behalf of the U.S. Treasury—widely interpreted as a warning signal that currency intervention could be imminent. Perhaps the strategy is to keep markets stable until after the snap election in February. It’s hard to say, but it should be telling to see how markets react once Japan reopens on Monday.
The Korean won also strengthened notably against the U.S. dollar on Friday. In recent weeks, there has been growing chatter that the KRW had become excessively weak, so it’s likely the currency took the developments around the yen as a warning signal and moved to reprice accordingly.
The Korean won likely matters more than many investors realize, given the sizable exposure South Korean investors have built up in U.S. equities. That dynamic is probably one of the reasons the KRW has weakened so significantly in the first place—buying U.S. stocks requires selling won for dollars.
If the KRW begins to strengthen from here, it could start to put pressure on that trade. For investors who are unhedged on the currency side, a stronger won increases the risk of FX-related losses on their U.S. equity holdings, potentially prompting position adjustments.
Of course, this week also brings major earnings reports from Microsoft, Apple, Tesla, and Meta. From what I can see, all four stocks are currently sitting in positive gamma with positive delta positioning. Implied volatility typically builds into earnings because of the event risk, which sets up a familiar dynamic: unless a company delivers truly blowout results, the reaction can easily turn into a sell-the-news move. Once earnings are released, implied volatility collapses and hedges are unwound as delta decays, potentially putting pressure on the shares.
Gold’s record-setting bull market has resumed its charge—but under a new set of drivers. Aggressive buying from China has increasingly taken over from gold’s traditional engines of demand, namely U.S.-based gold ETFs and futures traders. With American participation fading, gold’s ability to hold lofty levels now rests heavily on sustained Chinese demand. This shift has helped gold remain elevated, postponing the corrective phase typically required to rebalance overheated markets.
Between late July and mid-October 2025, gold surged an extraordinary 32.9% in just 2.7 months. During that stretch, the metal logged 24 record closes—roughly three-sevenths of all trading days—while its strongest gains were spread relatively evenly across the calendar. At the time, U.S. investors were aggressively piling into gold, providing powerful upside momentum.
That enthusiasm was clearly reflected in holdings of the world’s largest gold ETFs—SPDR Gold Shares (GLD), iShares Gold Trust (IAU), and SPDR Gold MiniShares (GLDM). According to the World Gold Council’s Q3’25 data, these three vehicles together accounted for more than three-sevenths of all gold held by global ETFs. During the rally, their combined bullion holdings jumped 10.9%, or 169.4 metric tons, helping propel gold to around $4,350 by mid-October and pushing technical conditions to extreme levels.
At its peak, gold was trading 33% above its 200-day moving average—ranking among the most overbought readings since 1981. The bull market had delivered gains of 139.1% over 24.5 months without a single correction exceeding 10%, making it the largest cyclical gold bull ever in U.S. dollar terms since the gold standard was abandoned in 1971. Historically, such excesses have almost always been followed by sharp pullbacks.
A correction initially appeared to be unfolding, with gold dropping 9.5% into early November—its steepest decline of the cycle and close to formal correction territory. Then the pattern abruptly changed.
Since mid-October, gold has climbed another 10.9% over roughly three months, yet this time without meaningful participation from U.S. investors. ETF holdings at GLD, IAU, and GLDM rose just 2.2% (37.8 tons), less than one-quarter of the prior buildup—and all of that increase occurred only in the past month. Those holdings didn’t even recover their mid-October peak until mid-December, shortly before gold began printing fresh record highs.
Gold’s ability to avoid a deeper correction despite some of the most extreme overbought conditions in decades raised questions. Normally, such excesses demand a reset in sentiment and positioning. Since U.S. investors were not driving the rebound, another source of demand had to be absorbing supply.
Clues emerged in the timing of gold’s strongest advances. Since mid-October, nearly all of gold’s gains have occurred on Mondays—a striking anomaly given that Mondays have historically been gold’s weakest trading day. Major upside moves were logged on November 10, November 24, December 22, January 5, January 12, and again this week following a Monday market holiday. Collectively, these few sessions accounted for the vast majority of gold’s rally since October.
Closer inspection revealed that most of these gains occurred overnight during Asian trading hours—well before European or U.S. markets opened. In other words, Chinese traders were responsible for driving price action when the rest of the world was largely inactive. These sessions effectively became “China Mondays,” periods when Chinese market flows dominated global pricing due to minimal competing liquidity.
Because China is uniquely active during the late Sunday-to-early Monday window, its influence on gold prices during that time is disproportionate. On other weekdays, extended trading hours in Western markets dilute that impact. The clustering of gains during these windows strongly suggests that China has become the primary marginal buyer supporting gold at record levels.
Until U.S. investors re-engage meaningfully, gold’s resilience at these heights will depend largely on whether Chinese demand remains strong enough to keep the rally alive.
China’s influence on Sunday-night trading is further magnified by the weekend effect. Weekends represent the longest stretch when traders are unable to react to new, market-moving developments. As a result, many participants square positions and shut down algorithmic trading systems ahead of the weekend. Meanwhile, algorithms that remain active into early Monday often have a backlog of news to process, which can intensify price moves during thin overnight liquidity. This dynamic can significantly amplify China-driven buying in gold.
Before delving further into China’s growing dominance in the gold market, it’s useful to look at how dramatically conditions shifted around gold’s mid-October peak. In the months leading up to that high, heavy share buying in GLD, IAU, and GLDM was the primary force behind gold’s explosive rally. Since then, demand from U.S. equity investors has been largely muted. Even so, gold has managed to surge back into extreme overbought territory—an outcome that underscores how unusual and China-dependent this phase of the rally has become.
China’s dominance during Sunday-night trading is reinforced by the structure of weekends themselves. Weekends are the longest periods when traders cannot respond to new, market-moving information. As a result, many participants flatten positions and shut down algorithmic systems before markets reopen. Meanwhile, algorithms that remain active into early Monday often need to process a backlog of news, which can magnify price movements in thin overnight liquidity. This dynamic amplifies China-driven gold buying when global participation is minimal.
Before exploring China’s growing grip on gold prices further, it helps to contrast the months before and after gold’s mid-October peak. In the run-up to that high, aggressive share buying in GLD, IAU, and GLDM was the dominant force behind gold’s explosive advance. Since then, U.S. stock investor demand has been largely muted—yet gold has still surged back into extreme overbought territory, underscoring how unusual and externally driven this rally has become.
While American equity investors were slow to chase this China-led surge until recently, U.S. gold-futures speculators jumped in aggressively. Futures positioning is reported weekly, and in late November—just after gold’s second “China Monday” surge—total speculative long positions stood at 307,000 contracts. Over the following seven weeks, that figure ballooned. By the January 13 Commitments of Traders report, total spec longs had risen to 362,400 contracts—an increase equivalent to roughly 172 metric tons of gold. That dwarfed the roughly 52-ton increase in GLD, IAU, and GLDM holdings over the same period, meaning futures traders significantly amplified China-driven momentum.
However, futures-driven buying power is limited and quickly exhausted. Gold futures allow extreme leverage—often 20x to 25x—which dramatically restricts the pool of participants willing to assume such risk. Assessing speculative positioning within its historical range provides insight into whether traders are more likely to add exposure or begin selling.
As of mid-January, speculative long positions were already 58% into their bull-market range, while shorts were just 6% in. The most bullish setup occurs when longs are near the bottom of their range and shorts are near the top, leaving ample room for buying. The current configuration is far closer to the opposite—suggesting diminishing upside fuel from U.S. speculators.
That leaves gold’s ability to continue defying a necessary corrective phase largely dependent on China. Unfortunately, reliable, consistent data on Chinese gold markets is scarce, especially in English. Even if such data were available, it would require extensive historical analysis to establish meaningful relationships with price behavior.
Still, anecdotal evidence is abundant. Major financial publications regularly report frenzied gold buying in China. Silver’s recent parabolic surge—largely driven by Chinese demand—appears to have spilled over into gold, fueling enthusiasm both domestically and globally. Without transparent data, Western analysts are left guessing how long this demand can persist.
Cultural factors may offer some clues. In Western markets, gold had long been dismissed as outdated, resulting in minimal portfolio allocations for years. In contrast, gold has always held deep cultural significance in China. Chinese investors therefore began this cycle with far greater enthusiasm, potentially making them more willing to buy aggressively and stay invested longer.
Capital controls also play a role. Chinese investors have limited avenues to diversify wealth outside the domestic financial system, while gold and silver offer a rare escape from policy risk. Additionally, Chinese culture places a stronger emphasis on wealth accumulation and status—traits that can fuel speculative behavior.
These dynamics make China uniquely susceptible to a speculative gold mania. Evidence increasingly suggests one is underway, reinforced by the repeated “China Monday” surges. Yet Chinese markets remain opaque. Financial transparency is limited, economic data series have been quietly discontinued when trends turn unfavorable, and even official gold reserve figures from the People’s Bank of China are widely viewed with skepticism.
For example, China reported identical gold reserves for more than six years before suddenly announcing a 57% jump in a single month—an implausible scenario. Many analysts believe China has accumulated far more gold than officially disclosed for years. If official reserve data lacks credibility, confidence in broader market transparency is equally questionable.
That uncertainty is unsettling. History shows that speculative manias eventually end in sharp, symmetrical collapses once buying power is exhausted. Whether China’s gold frenzy lasts months—or reverses abruptly—is unknowable.
What is clear is that gold’s recent breakout has been almost entirely driven during Chinese trading hours. Since December 19, gold has climbed roughly $487, yet nearly all of those gains occurred on just four “China Mondays.” This concentration of upside is highly abnormal and inherently risky.
Chinese markets have repeatedly demonstrated how quickly sentiment can flip once fear takes hold. Any government action—such as curbing speculative activity—could trigger rapid selling. Without strong participation from U.S. investors or futures traders to absorb that supply, gold could fall sharply.
In short, Chinese trading has seized control of the gold market. After peaking at extreme overbought levels in mid-October, gold required a corrective reset. That process was prematurely halted by surging Chinese demand. With U.S. participation limited and futures buying power fading, gold’s current position is precarious. If Chinese enthusiasm wanes or policy shifts intervene, a forced and potentially violent rebalancing could follow.
This week’s spotlight will be on the Fed’s FOMC meeting, Chair Powell’s press conference, major Big Tech earnings, and the looming U.S. government shutdown deadline. Apple is set to report earnings after Thursday’s close, with expectations rising for a beat-and-raise quarter. Meanwhile, Starbucks looks like a sell, as profit growth continues to slow and a weaker outlook is anticipated.
The stock market finished Friday on a mixed note, as both the S&P 500 and Nasdaq Composite recorded their second consecutive weekly declines.
The Dow Jones Industrial Average slipped 0.5% for the week, while the S&P 500 edged down about 0.4%. The tech-heavy Nasdaq fell by less than 0.1%, and the small-cap Russell 2000 lost 0.3%.
Looking ahead, the coming week is set to be a blockbuster, packed with potential market catalysts. Investors will be watching a crucial Federal Reserve policy meeting alongside a wave of earnings from major technology companies.
The Fed is widely expected to hold interest rates steady on Wednesday, though markets could see volatility as Chair Jerome Powell addresses the media in his post-meeting press conference.
Other key economic releases on the calendar include durable goods orders on Monday and The Conference Board’s Consumer Confidence Index for January on Tuesday. Friday will also bring the release of the December producer price index.
At the same time, earnings season ramps up sharply, with four members of the “Magnificent Seven” set to report this week. Microsoft (NASDAQ:MSFT), Tesla (NASDAQ:TSLA), and Meta Platforms (NASDAQ:META) are scheduled to announce results Wednesday evening, followed by Apple (NASDAQ:AAPL) after the close on Thursday.
These mega-cap names will be joined by a long list of other major companies, including IBM (NYSE:IBM), ASML (NASDAQ:ASML), SanDisk, Exxon Mobil (NYSE:XOM), Chevron (NYSE:CVX), Visa (NYSE:V), Mastercard (NYSE:MA), American Express (NYSE:AXP), SoFi Technologies (NASDAQ:SOFI), UnitedHealth Group (NYSE:UNH), Boeing (NYSE:BA), UPS (NYSE:UPS), Caterpillar (NYSE:CAT), General Motors (NYSE:GM), Verizon (NYSE:VZ), AT&T (NYSE:T), Starbucks (NASDAQ:SBUX), American Airlines (NASDAQ:AAL), RTX (NYSE:RTX), and Lockheed Martin (NYSE:LMT).
Adding to the uncertainty, Congress faces a Friday deadline to fund the government once again, with the risk of a prolonged shutdown looming.
No matter how markets ultimately move, I outline below one stock that could attract strong buying interest and another that may face renewed downside pressure. Keep in mind, this outlook is strictly for the week ahead, from Monday, January 26 through Friday, January 30.
Stock to Buy: Apple
Apple is scheduled to report earnings after the market closes on Thursday, with conditions lining up for a possible upside surprise. Wall Street is increasingly calling for a beat-and-raise quarter, as consensus forecasts point to double-digit revenue growth fueled by steady iPhone demand and continued expansion in services.
Options markets are pricing in a post-earnings move of roughly plus or minus 4%. Meanwhile, earnings expectations have turned more optimistic, with profit estimates revised higher 21 times in recent weeks versus just three downward revisions, according to InvestingPro data—underscoring the growing bullish sentiment surrounding Apple’s results.
Apple is expected to post adjusted earnings of $2.67 per share, representing an 11.2% increase from a year ago, while revenue is projected to climb 10.6% year over year to $137.5 billion. Analysts are looking to the iPhone and Services segments to lead the charge, pointing to double-digit growth and a strong pipeline of upcoming products, including a foldable iPhone and an AI-enhanced Siri.
With sentiment leaning bullish, the market appears positioned for a positive surprise. Price targets reaching as high as $350—implying roughly 41% upside—suggest that even a modest earnings beat could be enough to trigger a rebound in the stock.
So far in 2026, Apple shares have struggled, falling roughly 9% year to date to finish Friday at $248.04. The decline has mirrored broader volatility across the tech sector, alongside investor concerns that Apple’s AI strategy may be lagging rivals such as Alphabet.
That said, the recent pullback is shaping up as a potential buying opportunity. The stock is trading in deeply oversold territory, and while daily technical indicators still signal a “Strong Sell,” key support sits near $247.53 (pivot S1). A decisive move above resistance at $248.87 could open the door to a rebound toward $260 or higher, particularly if earnings guidance exceeds expectations.
Trade Setup:
Entry: $248 (pre-earnings)
Target: $265 (gain ~7%)
Stop-Loss: $240 (risk ~3%)
Stock to Sell: Starbucks
Starbucks is set to report earnings Wednesday morning, but unlike Apple, it heads into the week on much shakier footing. The coffee chain is grappling with slowing same-store sales in core markets, intensifying competition, changing consumer spending habits, and persistent cost pressures from labor and commodities.
Options markets are pricing in a post-earnings move of about plus or minus 6.4%, highlighting elevated downside risk. Sentiment has also turned notably bearish, with 17 of the 19 analysts tracked by InvestingPro cutting their EPS forecasts over the past three months ahead of the report.
Wall Street is bracing for a difficult quarter, with earnings per share projected to fall 15.9% year over year to $0.59, even as revenue is expected to edge up 2.5% to $9.62 billion.
Starbucks is also contending with intensifying competition from value-focused fast-food chains such as McDonald’s and Dunkin’, alongside pressure from local coffee shops. At the same time, its China growth narrative—once a major upside driver—has increasingly become a source of investor concern.
Looking ahead, expectations are building that CEO Brian Niccol may caution about continued near-term weakness, citing softer customer traffic, higher operating costs, and lingering uncertainty around the company’s turnaround efforts.
So far in 2026, Starbucks has been one of the stronger performers, climbing roughly 16% year to date and closing Friday at $97.62. However, the technical setup suggests the stock may be overextended heading into earnings.
Key pivot support lies near $96.25, with resistance around $97.84. A downside break below support could open the door to a pullback toward the $90 level if earnings or guidance disappoint.
Germany’s IFO Institute is set to release its January Business Survey on Monday at 09:00 GMT.
The headline IFO Business Climate Index is forecast to edge up to 88.1 in January, from 87.6 in December. In the previous release, the Current Assessment Index stood at 85.6, while the Expectations Index came in at 89.7.
How might the German IFO Survey influence the EUR/USD exchange rate?
EUR/USD could trade sideways if the German IFO Business Survey meets expectations, as heightened safe-haven demand continues to cap upside momentum despite the pair opening with a gap higher. Meanwhile, the Euro may hold relatively steady after Eurozone PMI figures signaled weakness in the services sector in January, reinforcing expectations that the European Central Bank (ECB) will keep interest rates unchanged. Earlier data from Germany was more constructive, with the Services PMI exceeding forecasts and remaining in expansionary territory, while the Manufacturing PMI showed improvement but stayed below the 50 threshold.
The pair comes under pressure as the US Dollar regains intraday strength, supported by rising risk aversion linked to trade and geopolitical concerns. US President Donald Trump warned of potential 100% tariffs on Canadian imports should Ottawa pursue a trade agreement with China. Canadian Prime Minister Mark Carney clarified that Canada has no intention of negotiating a free trade deal with Beijing. Trump also noted that a US aircraft carrier strike group is en route to the Middle East amid escalating tensions with Iran.
From a technical perspective, EUR/USD pulls back after opening at four-month highs and is trading near 1.1860 at the time of writing. Despite the dip, the broader bullish structure remains intact, with the 14-day Relative Strength Index (RSI) hovering around 69.00, indicating strong—though stretched—momentum. The pair could attempt a retest of the four-month peak at 1.1897, close to the key psychological resistance at 1.1900. On the downside, immediate support is seen at the nine-day Exponential Moving Average (EMA) near 1.1739.
Asian equities traded mixed on Monday as investors positioned ahead of a pivotal Federal Reserve policy meeting later this week and awaited major technology earnings, while Japanese shares fell sharply as the yen strengthened.
U.S. stock indexes ended last week lower, and futures linked to Wall Street declined further during Asian trading on Monday.
Nikkei tumbles as yen surges
Japan’s Nikkei 225 fell nearly 2%, deepening losses in exporter stocks as the yen strengthened sharply against the U.S. dollar amid speculation that Japanese and U.S. officials could intervene in currency markets to support the battered currency.
A firmer yen typically weighs on Japanese exporters’ overseas earnings, reinforcing risk-off sentiment in Tokyo. Meanwhile, gold surged to record highs as safe-haven demand intensified, underscoring investor caution ahead of major global policy decisions.
Elsewhere in Asia, South Korea’s KOSPI slipped nearly 1% after touching an intraday record of 5,023.76 points, while China’s Shanghai Composite was little changed.
Australia’s S&P/ASX 200 added 0.1%, while Singapore’s Straits Times Index fell 0.4%.
Indian markets were closed for a public holiday.
Fed meeting and packed tech earnings slate in focus
Traders are firmly focused on this week’s Federal Reserve meeting, where officials are broadly expected to keep interest rates unchanged, with markets closely watching for any adjustment in forward guidance on future policy moves as inflation pressures persist. Remarks from Fed Chair Jerome Powell and other policymakers later in the week are likely to influence sentiment across global risk assets.
Investor attention is also fixed on a packed earnings calendar, featuring quarterly results from most of the so-called “Magnificent Seven” technology heavyweights, including Microsoft Corp (NASDAQ:MSFT), Meta Platforms Inc (NASDAQ:META), Tesla Inc (NASDAQ:TSLA) and Apple Inc (NASDAQ:AAPL), whose results often set the tone for wider markets.
In Asia, major technology names such as Samsung Electronics (KS:005930) and SK Hynix Inc (KS:000660) are also scheduled to report earnings.
Caution around AI-related stocks remains, with technology shares underperforming in some sessions amid growing concerns over elevated valuations and rising costs.
Overall, market participants remain guarded ahead of key policy and earnings catalysts, weighing optimism over artificial-intelligence-driven long-term growth against near-term macroeconomic and currency risks.
Gold vaulted above the psychological $5,000-per-ounce threshold on Monday, building on last week’s explosive rally as investors flocked to the traditional safe haven amid escalating geopolitical risks.
Spot gold climbed 1.1% to a fresh all-time high of $5,035.83 per ounce by 18:52 ET (00:52 GMT), while U.S. gold futures also advanced 1.1% to a record $5,074.71 per ounce.
The precious metal surged more than 8% last week, repeatedly setting new highs, and is now up nearly 17% year-to-date.
The broader precious metals complex also strengthened. Silver jumped over 2% to a record $106.56 per ounce, while platinum edged higher to a new peak of $2,798.46 per ounce.
Gold has climbed sharply since the beginning of the year, supported by geopolitical tensions, expectations of looser U.S. monetary policy later in 2026, and continued buying from central banks and investors hedging against market volatility.
A key catalyst behind gold’s sharp rally this month has been mounting friction between the United States and its NATO partners over Greenland, a dispute that has rattled global markets.
President Trump’s comments on U.S. strategic ambitions in the Arctic have further strained transatlantic ties, fueling fears of wider diplomatic and economic repercussions.
Adding to those geopolitical pressures, Trump escalated trade tensions with Canada over the weekend, warning of a 100% tariff on Canadian imports should Ottawa move forward with a trade agreement with China.
Trump said on his social media platform that Canada could serve as a “drop-off port” for Chinese goods entering the United States, warning that Beijing would “eat Canada alive” if the agreement proceeds.
Fed rate decision in focus
Gold has also found support from expectations around U.S. monetary policy. The Federal Reserve is set to wrap up its policy meeting on Wednesday, with markets broadly expecting officials to leave interest rates unchanged.
Although a hold decision is largely priced in, investors will closely examine the Fed’s statement and remarks from Chair Jerome Powell for signals on the timing and pace of potential rate cuts later this year.
Gold typically benefits from lower interest rates, which reduce the opportunity cost of holding non-yielding assets.
“Both the data and Chair Powell’s strong defence of central bank independence suggest there is little chance of a Fed rate cut on January 28,” ING analysts said in a note.
“Attention will instead turn to President Trump’s forthcoming nomination for the next Fed chair, upcoming economic data, and whether that nominee can steer the committee toward additional rate cuts,” they added.
Jefferies says Microsoft’s recent pullback presents an attractive entry opportunity
Jefferies analyst Brent Thill wrote this week that the recent pullback in Microsoft Corporation (NASDAQ: MSFT) shares has created an attractive buying opportunity. He highlighted the company’s expanding backlog, deepening AI partnerships, and continued strength in cloud computing as the foundations of a robust multi-year growth outlook among large-cap technology names.
Thill noted that the stock has declined about 18% since the first fiscal quarter, despite Microsoft disclosing roughly $250 billion in commitments to OpenAI and an additional $30 billion linked to Anthropic. He added that Microsoft’s current valuation—around 23 times calendar-year 2027 earnings—now trades below that of Amazon and Google, even though Microsoft offers what he sees as superior earnings visibility.
According to Thill, Microsoft’s record level of contractual commitments is the primary catalyst for buying at current prices. He expects second-quarter remaining performance obligations to show the largest sequential increase on record, driven largely by the OpenAI and Anthropic agreements, which he says provide “unprecedented multi-year demand visibility.”
Azure remains a central source of upside. Thill described Azure demand as constrained by supply rather than demand, noting that Microsoft plans to double its data-center capacity over the next two years. After beating Azure revenue guidance for three straight quarters, he believes that execution on new capacity alone could push results above consensus expectations for both fiscal second-quarter Azure performance and full-year 2026 forecasts.
The analyst also pointed to accelerating AI monetisation from Copilot and other first-party products. With Azure representing roughly 30% of total revenue, he said sustained outperformance in the cloud business could push overall revenue growth into the high-teens.
Although Thill acknowledged ongoing capacity constraints and elevated capital expenditures, he believes Microsoft is well positioned to generate meaningful upside to both revenue and earnings through fiscal 2026.
Analyst upgrades Google to Strong Buy as AI stack accelerates
Earlier this week, Raymond James upgraded Google parent Alphabet (NASDAQ: GOOGL) to Strong Buy, arguing that the company is entering a phase in which its AI stack is “shifting into high gear,” creating the conditions for meaningful upward revisions to medium-term forecasts.
Analyst Josh Beck said updated bottom-up analysis across Search and Google Cloud Platform (GCP) led him to raise his 2026 and 2027 estimates, with his 2027 revenue projection now exceeding broader Street expectations. He believes Alphabet is “entering a cycle of strengthening AI stack momentum and upward estimate revisions that could produce one of the highest-quality top-line AI acceleration stories in the public markets.”
Beck added that in 2026, the AI stack narrative and related forecast upgrades are likely to become the primary performance drivers among mega-cap internet stocks, rather than a simple mean-reversion trade.
Within Cloud, Beck projects GCP revenue growth of 44% in 2026 and 36% in 2027, ahead of consensus. He attributes this to strong momentum in infrastructure and platform services, underpinned by large-scale TPU and GPU deployments and increasing adoption of the Gemini API and Vertex AI.
By the end of 2027, Beck estimates that GCP could generate approximately $25 billion in annualised revenue from TPUs, around $20 billion from GPUs, about $10 billion from the Gemini API, and roughly $2.5 billion from Vertex AI.
In Search, Beck projects revenue growth of 13% in both 2026 and 2027—above broader Street expectations—as softness in core search is offset by the expanding adoption of AI Overviews, AI Mode, and Gemini. He expects AI-driven queries to drive stronger cost-per-click growth as improved context and conversion rates enhance monetisation.
Stifel starts Micron at Outperform, citing a multi-year memory market upturn
Brokerage firm Stifel initiated coverage of Micron Technology with an Outperform rating, arguing that the memory industry is entering a multi-year upcycle driven by structural AI demand and persistently tight supply conditions.
Stifel believes Micron is well positioned to benefit from rising average selling prices and a favorable mix shift toward higher-margin products, as memory increasingly becomes a critical constraint within AI systems. “Access to memory has emerged as a key bottleneck in AI racks and systems, boosting demand for higher-performance, higher-bandwidth memory solutions,” the firm said.
With supply expected to remain constrained through 2027, Stifel sees an environment supportive of sustained pricing power and margin expansion. Against this backdrop, the firm expects Micron to capture significant ASP growth and expand margins, forecasting non-GAAP EPS growth of more than 275% over the next two years.
High-bandwidth memory (HBM) is central to Micron’s growth thesis, according to Stifel. As AI models become more complex and require faster access to larger data sets, next-generation chips are incorporating more HBM, increasing memory’s share of overall AI infrastructure spending. As the industry’s number-two player, Micron is expected to see HBM revenue grow 164% in fiscal 2026 and a further 40% in fiscal 2027, with DDR and QLC NAND also benefiting from AI-driven demand.
Stifel also highlighted several risks, including the potential re-emergence of Samsung as a more formidable HBM competitor, elevated capital spending that could shift value toward equipment suppliers, a possible easing in DRAM supply-demand dynamics, and the risk that chipmakers design their own base logic dies.
On valuation, Stifel noted that Micron trades at roughly 9.7 times calendar 2026 earnings, modestly below historical averages. “While valuation increasingly reflects significant growth expectations, we believe the shares can continue to perform on the back of a multi-year, AI-driven product cycle characterized by tight supply,” the firm concluded.
Mizuho says Arm selloff presents a buying opportunity
Mizuho analyst Vijay Rakesh said investors should take advantage of the recent pullback in Arm Holdings shares to build positions, arguing that market concerns around handset demand have become excessively pessimistic.
Arm’s stock has declined roughly 30% since November, even as the Philadelphia Semiconductor Index has risen about 10%. Rakesh described the selloff as “overdone,” adding that Mizuho would “be buyers of ARM on the approximately 30% pullback.”
According to Rakesh, Arm’s growth drivers extend well beyond smartphones. While mobile royalties account for about 50% of revenue, he noted that Arm has historically outpaced handset market growth and is projected to expand at annual rates of 7% to 31% between 2021 and 2027.
A key catalyst is the ongoing transition to Arm’s v9 architecture, which delivers roughly double the average selling price per core compared with v8, providing a structural uplift to royalty revenue. Rakesh also highlighted rising interest in custom silicon, noting that potential ASIC and CPU ramps in 2027 and 2028 could contribute more than $1 billion in incremental revenue.
He further pointed to opportunities tied to AI-focused custom chips, including a potential training and inference ASIC associated with OpenAI and SoftBank. That initiative alone, he said, could conservatively generate around $1 billion in revenue during the 2027–2028 period.
Beyond mobile, Arm is gaining traction in data centers as hyperscalers increasingly adopt its architectures. Rakesh cited platforms such as AWS Graviton, Microsoft Cobalt, Meta’s planned CPU, and Nvidia’s Grace and Vera as evidence of a growing custom silicon customer base and an improving royalty mix.
Rakesh reiterated Mizuho’s Outperform rating and $190 price target, saying Arm remains “well positioned as the broadest global semiconductor platform.”
Morgan Stanley grows more positive on European semiconductor stocks
Morgan Stanley upgraded the European semiconductor sector to Overweight this week, arguing that the group offers an attractive environment for selective stock picking as diversification inflows gather pace, valuation dynamics improve, and semiconductor equipment companies stand to benefit from the next phase of the AI capital expenditure cycle.
The firm’s strategists noted that European equities are attracting increased diversification inflows while beginning to emerge from a long-standing valuation discount to U.S. markets. Within this context, semiconductors stand out as a sector where strengthening bottom-up fundamentals are increasingly driving top-down performance. Morgan Stanley said its preferred expression of this view remains analyst-led stock selection rather than broad factor exposure.
“While European equities already appear highly idiosyncratic, we see further scope for stock-level dispersion in Europe to rise toward cycle highs,” the strategists wrote.
The upgrade is anchored in the semiconductor equipment segment. Morgan Stanley highlighted ASML as the dominant contributor to European Top Picks performance year to date, accounting for more than half of weighted gains. ASML also represents roughly 80% of the MSCI Europe Semiconductors and Semiconductor Equipment index.
Looking ahead, the bank said risks in the AI investment cycle are shifting away from demand and toward execution and transition. “For 2026, the key risk in the AI capex cycle is execution and transition, not demand,” the strategists wrote, arguing that this dynamic favors European semiconductor equipment exposure—particularly companies tied to extreme ultraviolet lithography.
Morgan Stanley expects upcoming order intake to confirm higher foundry and memory capital spending through 2027, alongside stronger-than-expected demand from China.
From a portfolio construction standpoint, the firm said it adjusted its sector model to reflect improving earnings momentum and broader price-target revisions for European semiconductors, while neutralising accrual factors and reducing China exposure. These changes lifted the sector to second place in Morgan Stanley’s internal rankings, just behind banks.
At the stock level, ASML and ASM International remain Morgan Stanley’s Top Picks, with BE Semiconductor Industries also highlighted as an Overweight-rated beneficiary of the same themes.
When Tesla introduced the Semi in 2017, it billed the vehicle as a game-changer for the heavy-duty trucking industry. Almost ten years on, however, only a limited fleet is in operation. Repeated production delays and Tesla’s focus on higher-visibility ventures such as passenger cars, AI, and robotics have kept the Semi on the sidelines. Still, 2026 could prove to be the decisive year in determining whether the truck can evolve from a pilot project into a viable commercial offering.
Worldwide sales of heavy-duty trucks reached roughly 2.8 million units in 2024, including about 400,000 in the U.S. Yet electrification in the Class 8 segment remains minimal, as fleet operators tend to prioritise total cost of ownership over branding or technological novelty.
Tesla argues that the Semi offers a strong economic proposition, citing a claimed 500-mile range from an approximately 850 kWh battery, ultra-fast charging rates of up to 1.2 MW, and significantly lower energy and maintenance costs compared with diesel alternatives. Elon Musk has repeatedly characterised demand as “ridiculous” and the business case as a “no-brainer” for fleet operators.
On paper, momentum appears to be building. Filings associated with California’s electric-truck incentive programme indicate that nearly 900 Semis were applied for in 2025—more than any traditional truck manufacturer has historically secured. Early customers, including DHL and RoadOne, report performance exceeding expectations and have signalled intentions to expand their fleets once mass production begins.
Execution risks, however, remain substantial. Tesla is aiming for annual output of up to 50,000 units from its Nevada facility by the end of 2026, a lofty target given that the entire U.S. day-cab tractor market totals fewer than 100,000 units per year. Additional concerns include battery supply constraints following a significant writedown by a major 4680-cell supplier, while drone footage suggests the Nevada production line is not yet fully installed.
Bernstein analysts also caution that, based on current assumptions, the Semi’s total cost of ownership may still marginally exceed that of best-in-class diesel trucks.
For established manufacturers such as Daimler, Volvo, and Paccar, Tesla’s influence is unlikely to be felt immediately. Diesel-powered trucks continue to dominate the market, and the electrification of long-haul freight is expected to progress gradually.
However, if Tesla succeeds in scaling production in 2026, the Semi could alter industry perceptions, prompting increased investment and putting pressure on margins within one of the sector’s most important profit pools.
Monday – U.S. markets were closed for Martin Luther King Jr. Day.
Ciena Corp
What happened? On Tuesday, Bank of America lowered its rating on Ciena Corp. (NYSE: CIEN) to Neutral and set a price target of $260.
TL;DR: Ciena shares have jumped on strong hyperscaler-driven growth, but BofA turned more cautious due to concerns over potential backlog risks.
What’s the full story? Ciena’s shares have surged to record levels, now trading at roughly 40x forward earnings, about twice its 10-year average, reflecting strong expectations for sustained growth. Demand from hyperscale cloud providers has driven a sharp acceleration in revenue growth—from around 8% to approximately 30% in 1Q26—supported by a $5 billion backlog that provides solid visibility into next year’s revenues.
Analysts believe the current cycle has durability, fueled by rapid expansion in scale-across deployments, which are projected to rise 11-fold to $808 million by 2026, alongside continued leadership in 800G optical technology. Ciena’s market share has increased from 18% in 2024 to 22% in 9M25, with the company commanding roughly 50% share among major cloud providers, driven by its RLS systems and WaveLogic 6 Nano built on 3nm DSP, offering superior power efficiency versus competitors such as Cisco and Marvell.
However, risks remain. The company’s history offers a cautionary example: in 2022, backlog coverage fell sharply—from levels that once covered 96% of revenue to a 38% decline, triggering a 12% drop in the stock. With shares now valued at about 45x earnings, assumptions of peak growth leave little room for disappointment if backlog momentum weakens.
As a result, Bank of America downgraded the stock to Neutral, maintaining a $260 price objective, which implies only around 7% upside, suggesting much of the optimism is already reflected in the valuation.
Ulta Beauty
What happened? On Wednesday, Raymond James upgraded Ulta Beauty Inc. (NASDAQ: ULTA) to Strong Buy and raised its price target to $790.
TL;DR: Raymond James turns more bullish on ULTA, citing earnings upside from growth initiatives despite competitive and execution risks.
What’s the full story? Raymond James upgraded Ulta to Strong Buy from Outperform, lifting its price objective to $790 and modestly increasing its FY26 EPS forecast to $28.60 from $28.51. The firm sees a combination of strategic initiatives reigniting growth as Ulta enters FY26 following a year of restructuring.
Beauty demand remains resilient, while the company benefits from operational improvements implemented over the past year, including a refreshed leadership team, enhancements to its loyalty program, stronger digital capabilities, and expanded assortments in Wellness and Marketplace categories. Looking ahead, Raymond James highlights opportunities from deeper data analytics, adoption of agentic AI, and early-stage international expansion—initiatives expected to drive earnings growth without relying on valuation multiple expansion.
The firm believes Ulta is transitioning from an investment phase toward a period of return realization, with contributions expected across physical stores, e-commerce, and potential international markets. However, risks persist, including intensifying competition in beauty retail, potential softness in U.S. consumer demand, rising cost pressures, and execution risks tied to overseas expansion.
Overall, Raymond James views Ulta’s balanced exposure to both prestige and value-conscious consumers, its strong loyalty ecosystem, and improving operational leverage as creating an attractive risk-reward profile, supporting the Strong Buy rating.
Palantir
What happened? On Thursday, PhillipCapital initiated coverage of Palantir Technologies Inc. (NASDAQ: PLTR) with a Buy rating and a $208 price target.
TL;DR: PhillipCapital sees Palantir as a buying opportunity, driven by strong revenue and profit growth, and sets a $208 target.
What’s the full story? PhillipCapital expects Palantir’s FY25 revenue to rise 47% year over year to $4.2 billion, supported by a growing contribution from its commercial segment, which is forecast to expand 51% YoY, outpacing 43% growth in government revenue. The shift reflects accelerating enterprise adoption of AI-driven platforms beyond Palantir’s traditional defense and public-sector base. Net profit is projected to increase by approximately 1.9x, reflecting improving operating leverage.
The U.S. market, which accounts for roughly 66% of total revenue, is expected to remain the key growth driver. Revenue in the region is forecast to grow 66% YoY, supported by elevated government spending amid geopolitical tensions and a sharp acceleration in commercial contracts—nearly doubling in 3Q25—driven by demand for Palantir’s Artificial Intelligence Platform (AIP) and its ontology-based productivity tools.
PhillipCapital’s $208 price objective is derived from a discounted cash flow valuation, assuming an 8.3% WACC, 4.2% risk-free rate, and 8% terminal growth rate. While the stock trades at a lofty ~170x forward P/E, the firm argues this remains below prior peak valuation levels, leaving room for a potential re-rating as earnings visibility improves and Palantir’s addressable markets continue to expand.
Starbucks Co.
What happened? On Friday, William Blair upgraded Starbucks Corporation (NASDAQ: SBUX) to Outperform, without assigning a price target.
TL;DR: William Blair sees an imminent return to positive U.S. comparable sales, prompting an upgrade to Outperform.
What’s the full story? William Blair expects Starbucks to deliver its first positive domestic comparable-sales growth in two years during the December quarter, setting the stage for improved performance into fiscal 2026. While sales momentum is turning, the firm highlights margin recovery as the central investment debate. Americas operating margins are projected to fall to 13.4% in FY25, down from a peak of 20.8%, with an additional $500 million in labor-related cost pressures anticipated in the following year.
The firm is looking to Starbucks’ January 29 investor day for further clarity, anticipating a multi-year strategy focused on general and administrative cost reductions, productivity initiatives, and sustained comparable-sales growth. Over the longer term, William Blair models approximately 3% global unit growth combined with low-single-digit comparable sales, allowing consolidated margins to gradually approach 2023 levels by 2030.
Under this framework, Starbucks could generate a 15–20% compound annual growth rate in EPS over the next five years. Despite the stock being up roughly 15% year to date, William Blair sees a potential valuation path toward $140+ per share by 2029, based on a 30x multiple applied to $4.70+ in EPS, implying roughly 10% annual share price appreciation, with upside if comparable sales accelerate faster than expected.
As a result, William Blair upgraded Starbucks to Outperform, arguing that the recovery in sales is likely to precede and ultimately drive a more meaningful rebound in profitability beginning around 2027.
Micron (MU) is a global leader in advanced memory and storage technologies, playing a critical role in converting data into actionable intelligence. The stock has surged amid the AI-driven rally, as Micron’s products have become an essential component of AI infrastructure, particularly in addressing persistent memory bottlenecks.
The shares also highlight the effectiveness of the Zacks Rank framework. In August of last year, Micron was upgraded to the highly sought-after Zacks Rank #1 (Strong Buy) following upward revisions to earnings estimates, a shift that has since been accompanied by a strong and sustained rally in the stock price.
As illustrated above, the Zacks Rank may also have helped mitigate downside risk last March.
Why Micron Shouldn’t Be Overlooked
Micron delivered outstanding results in its latest earnings report, surpassing consensus expectations on both revenue and earnings, driven by rapidly accelerating demand tied to AI workloads. Revenue surged more than 55% year-over-year to a record high, while adjusted EPS jumped an impressive 185%.
The company’s cash-generation profile also strengthened significantly amid the favorable demand backdrop. Operating cash flow reached a record $8.4 billion during the period, sharply exceeding the $5.7 billion generated in the same period last year.
The positive momentum appears set to continue, with Micron’s Q2 guidance pointing to new records across revenue, margins, earnings, and free cash flow. In short, Micron plays a critical role in enabling the AI boom, as memory capacity remains a key bottleneck in advanced systems. This strategic positioning places the company in a strong overall stance and helps shield it from concerns about being an AI “also-ran” or laggard.
As illustrated below, Micron’s revenue has surged sharply in recent periods, reinforcing the strength of the current demand environment. The company’s top-line trajectory mirrors that of NVIDIA (NVDA – Research Report), widely regarded as the flagship beneficiary of the broader AI trade.
Micron vs. NVIDIA
While many AI-linked companies are likely to come under increased scrutiny in 2026, Micron represents a far more straightforward beneficiary of the broader infrastructure buildout. Memory remains a key bottleneck in AI systems, and MU has been capitalizing meaningfully on this constraint. The company recently announced its exit from the consumer memory segment, further underscoring its strategic focus on maximizing revenue from large-scale enterprise and data-center customers.
Micron noted that “AI-driven growth in the data center has led to a sharp increase in demand for memory and storage,” adding that the decision to wind down its Crucial consumer business was made to improve supply allocation and support for larger, strategic customers in faster-growing markets.
Overall, Micron stands out as one of the most compelling AI-related investment opportunities, drawing a clear parallel with NVIDIA. While NVIDIA dominates the GPU side of AI computing, Micron plays an equally critical role by supplying the high-performance memory required for those GPUs to operate efficiently.
Turning to NVIDIA, the company once again delivered a double beat versus consensus in its latest, record-setting earnings report. Revenue reached $57 billion, up 62% year-over-year, alongside a 67% surge in earnings per share. Data Center revenue climbed to $51.2 billion, representing a robust 66% annual increase and comfortably exceeding consensus expectations of $49.1 billion.
For investors looking to capitalize on the AI infrastructure buildout, both Micron (MU – Research Report) and NVIDIA (NVDA) stand out as premier choices, with each currently holding the highly sought-after Zacks Rank #1 (Strong Buy).
GBP/USD is extending its strong weekly rally and is edging closer to the 1.3600 handle on Friday, marking fresh four-month highs. The pair’s upside momentum is being fueled by a deepening decline in the US Dollar, while supportive UK economic data further reinforces the bullish trend.
Fundamental Analysis Overview
The latest PMI data signaled a strong expansion in overall business activity, driven by a notable pickup in both manufacturing and services. The Composite PMI surged to 53.9 in January from 51.4 in December, comfortably surpassing market expectations of 51.7.
The Services PMI climbed to 54.3, exceeding both the forecast of 51.7 and the previous reading of 51.4, while the Manufacturing PMI also improved markedly, rising to 51.6 from 50.6.
In addition, UK Retail Sales rebounded in December after two consecutive monthly declines. Data from the Office for National Statistics (ONS) showed that Retail Sales, a key gauge of consumer spending, increased by 0.4% month-over-month, defying expectations for a 0.1% contraction.
On a year-on-year basis, consumer spending rose sharply by 2.5%, well above the consensus forecast of 1% and up from a revised 1.8% in November (previously reported at 0.6%).
The stronger-than-expected Retail Sales figures are likely to reduce market expectations for near-term interest rate cuts by the Bank of England (BoE).
Looking ahead, the UK economic calendar is relatively light next week, leaving broader market sentiment and expectations surrounding the BoE’s February policy decision as the primary drivers of Pound Sterling performance.
GBP/USD Technical Outlook
GBP/USD is trading around 1.3437 at the time of writing. The 20-day Exponential Moving Average is hovering near 1.3439, with price currently testing this dynamic resistance. A daily close above the moving average would strengthen near-term momentum. The Relative Strength Index (RSI) stands at 52, edging higher but still signaling broadly neutral momentum.
Using the move from the 1.3780 peak to the 1.3006 trough, the 50% Fibonacci retracement at 1.3393 continues to act as a hurdle on rebounds, while the 61.8% retracement at 1.3485 limits upside potential. A decisive break above the latter would suggest the broader bearish bias is losing strength and could pave the way for a deeper recovery, whereas rejection at that level would likely keep the pair confined to a range.
Gold prices remain firmly in an uptrend and are poised to test the key $5,000 per troy ounce level on Friday. The precious metal’s strong rally accelerates amid mounting US Dollar weakness and mixed US Treasury yields across the curve.
Fundamental Analysis Overview
Expectations of additional monetary easing by the US Federal Reserve (Fed) continue to support demand for the non-yielding yellow metal, even as geopolitical risks have eased following US President Donald Trump’s reversal on Greenland. The bullish momentum also appears largely undeterred by extremely overbought short-term technical conditions, reinforcing the view that Gold’s path of least resistance remains upward.
On Wednesday, Trump announced the cancellation of planned tariffs on European allies related to US control over Greenland, after reaching a preliminary framework with NATO leaders on future Arctic security cooperation. He also dismissed the possibility of taking Greenland by force, encouraging risk appetite. However, the positive market response proved short-lived, as dovish Fed expectations dominated, outweighing Thursday’s US economic data and pushing the US Dollar (USD) back toward its lowest level since January 6, last seen earlier this week.
Data from the US Bureau of Economic Analysis showed that final third-quarter GDP growth came in at 4.4%, marginally above the previous estimate of 4.3% and notably stronger than the 3.8% expansion recorded in the prior quarter. Meanwhile, the Core Personal Consumption Expenditures (PCE) Price Index — the Fed’s preferred inflation measure — rose 2.8% year-on-year in November, up from 2.7%, while the monthly increase remained steady at 0.2%.
Further weighing on the USD, the US Department of Labor reported that initial jobless claims edged up by 1,000 to 200,000 for the week ending January 17, below market expectations of 212,000. Despite the better-than-expected figure, the data failed to offer meaningful support to the greenback amid the broader de-dollarization trend. Investors now turn their attention to upcoming flash PMI releases for insight into global economic conditions, which could influence risk sentiment and shape Gold’s trajectory as it heads toward solid weekly gains.
XAU/USD Technical Analysis
The broader uptrend remains supported by an ascending channel originating from $3,805.69, with XAU/USD now having decisively broken above the channel’s upper boundary around $4,742.80. The Moving Average Convergence Divergence (MACD) remains firmly above the zero line and continues to trend higher, indicating strengthening bullish momentum. Meanwhile, the Relative Strength Index (RSI) stands at 81.25, deep in overbought territory, which may limit immediate upside as momentum becomes stretched.
That said, a sustained hold above the former channel ceiling opens the door for a continuation of the rally toward new highs. On the downside, initial support is seen near the ascending channel’s lower boundary at $4,437.79 should prices consolidate. A flattening MACD would point to fading upside momentum at elevated levels, while a pullback in RSI toward the 70 mark would help ease overbought conditions and reinforce trend stability. A failure to defend the breakout zone could trigger a move back into the previous range, whereas continued momentum would keep bullish control intact.
Shares of Apple (NASDAQ: AAPL) have come under sustained selling pressure, with the stock now trading around $245—nearly 15% below the record high reached just last month. The decline has been largely one-way, which is notable given Apple’s reputation as one of the market’s most reliable large-cap names. Broader market conditions have also weighed on the stock, as escalating geopolitical tensions have fueled a sharp risk-off move across equities in recent days.
What makes the current situation particularly striking is how stretched Apple’s technical signals have become. The stock’s relative strength index (RSI) has fallen into deeply oversold territory this month, currently hovering near 18—its lowest level since September 2008. Such an extreme reading suggests that selling may have been excessive and overly rapid, especially with the company’s earnings report scheduled for next week.
Understanding the Setup as Apple Heads Toward Earnings
An RSI reading this depressed would draw attention for any stock, especially one like Apple. With the company heading into a closely watched earnings report next week, the setup becomes even more compelling.
Apple has a well-established history of beating analysts’ expectations on a quarterly basis, and viewed through that lens, the current situation raises an important question. After such an aggressive sell-off, is it possible that the market has already priced in a worst-case outcome?
Apple’s Fundamentals Still Strengthen the Bullish Case
From a business perspective, Apple’s recent share price performance appears increasingly out of step with its underlying fundamentals. The company’s consistent ability to exceed earnings expectations is something few of its peers can rival. Gross margins remain solid, and its ecosystem-based model continues to deliver dependable cash flows.
Apple’s approach to returning capital also offers a meaningful buffer for investors considering an entry. A sizable share repurchase program alongside steady dividend growth means management is a regular buyer of its own stock during periods of weakness. While this doesn’t eliminate the risk of sharp pullbacks, it often helps prevent negative sentiment from persisting for long.
That said, the concerns driving the sell-off cannot be ignored. iPhone shipment volumes have softened, and the stock’s valuation is near the upper end of its recent range. These factors help explain investor caution, but they fall short of fully justifying the speed and magnitude of the recent decline.
Analyst Confidence Grows Ahead of Apple’s Earnings
The case for buying the dip is reinforced by steadfast analyst support for Apple. This week, Evercore added the stock to its tactical outperform list ahead of next week’s earnings, reflecting confidence that the company will deliver results above expectations.
Recent analyst commentary has focused on the composition of iPhone sales, with higher-end models reportedly making up a greater share of demand. This trend supports both average selling prices and margins. Meanwhile, services revenue is expected to continue providing a stable source of growth, helping to cushion any weakness in hardware volumes.
Evercore set a new price target of $330 for Apple, implying roughly 35% upside from current levels, and that still isn’t the most optimistic view on the Street. Wedbush released a bullish update last week, assigning a $350 price target and further supporting the argument that the market’s reaction has been excessive. With momentum already deeply washed out, even a modest beat on revenue or earnings could be enough to spark a meaningful shift in sentiment.
Apple’s Risk/Reward Looks Compelling at Current Prices
None of this suggests Apple is without risk. Next week’s earnings will carry more weight than usual, and a true disappointment could drive the stock lower—particularly if geopolitical tensions intensify.
That said, the risk/reward profile is becoming increasingly asymmetric. This is the most oversold Apple has been in nearly two decades, and for a company with its balance sheet strength, margin profile, and history of delivering shareholder returns, it’s difficult to ignore the appeal of buying at these levels.
Markets managed to rebound after Tuesday’s sell-off, but the bounce—despite attracting attention—fell short of fully recouping the earlier losses. More importantly, a significant “bull trap” remains in place for the S&P 500. Technical signals for the index continue to be mixed, with momentum indicators such as stochastics failing to move back into overbought territory—a key condition needed to support a sustained rally.
Bitcoin faces more significant challenges. Yesterday’s rise alone is far from sufficient to undo what was beginning to resemble the formation of a right-hand base. That said, this still appears to be the early stages of building a new base and could represent an attractive buying opportunity for investors willing to hold through what may be a year-long process, potentially targeting a move toward $125K. For now, technical indicators remain net bearish, and a break below $85K would invalidate any bullish outlook.
The Nasdaq has mounted a counter-trend bounce following the breakdown, but the symmetrical triangle pattern has already resolved, meaning attention now shifts to identifying new support and resistance levels. There is still a potential bullish scenario if price action evolves into a bullish ascending triangle.
On the other hand, the Russell 2000 shows the potential to form a bearish “evening star” pattern, though this would require a gap lower today. Setting that possibility aside, the index remains firmly in rally mode and is far from any “bull trap” conditions. Overall, technical indicators are net bullish.
For today, bulls may want to focus on Bitcoin, while bears should monitor the Russell 2000 for signs that a bearish “evening star” pattern could emerge.
Bank of Japan (BoJ) Governor Kazuo Ueda is speaking at a press conference, outlining the rationale for keeping the benchmark interest rate unchanged at 0.75% at the January policy meeting.
Key takeaways from the BoJ press conference
Japan’s economy is showing a moderate recovery and is expected to continue growing at a steady pace.
The government’s economic stimulus package has improved the overall outlook.
Underlying inflation is projected to rise gradually and move closer to the 2% target.
Board members Takata and Tamura suggested revisions to the outlook report.
The BoJ will continue to raise interest rates if economic and price projections are realized.
Lending rates tied to the BoJ’s policy rate are already trending higher.
Financial conditions remain accommodative despite the December rate hike.
Foreign exchange movements are influenced by multiple factors.
The governor refrained from commenting on specific yen levels but emphasized close monitoring of FX developments.
Government bond yields are increasing at a rapid pace.
The BoJ stands ready to conduct bond-buying operations flexibly in exceptional circumstances.
Measures may be taken to support stable yield formation when necessary.
Currency movements, particularly the yen, may be having a stronger impact on prices.
Greater attention will be paid to foreign exchange trends going forward.
The rise in long-term yields is partly influenced by end-of-fiscal-year factors.
Price developments in April will be an important consideration when assessing the timing of future rate hikes.
The section below was published at 3:35 GMT on January 23 to cover the Bank of Japan’s monetary policy announcement and the initial market reaction.
The Bank of Japan (BoJ) board voted to keep the short-term policy rate unchanged at 0.75% at the conclusion of its two-day monetary policy meeting on Friday, a move that was widely expected.
As a result, borrowing costs remain at their highest level in roughly three decades.
Key takeaways from the BoJ’s policy statement
Japan’s economy is expected to continue a moderate recovery.
Consumer inflation is likely to pick up gradually.
The virtuous cycle in which wage growth and inflation reinforce each other is expected to be sustained.
The output gap is projected to improve over time and expand at a moderate pace.
Medium- to long-term inflation expectations are seen rising gradually.
No major imbalances are observed in Japan’s financial activity.
The overall financial system remains stable.
Firms’ moves to pass higher wages on to selling prices could strengthen more than previously anticipated.
The recent increase in food prices, including rice, mainly reflects temporary supply-side factors.
Significant uncertainty surrounds the global economic outlook, particularly due to trade policies that could push up import prices through supply-side channels.
Trade measures announced so far may weigh on global economic growth.
Regarding the US economy, close attention is needed on how tariffs could affect employment and income via weaker corporate profits.
High uncertainty persists around China’s economic outlook, especially the future pace of growth.
A sharp rise in import prices could further reinforce households’ cautious stance on spending.
Current trade policies could lead to a shift in the long-term trend of globalisation.
The Board raised its median real GDP growth forecast for fiscal 2025 to +0.9% from +0.7% in October.
The fiscal 2026 median growth forecast was revised up to +1.0% from +0.7%.
The fiscal 2027 median growth forecast was lowered to +0.8% from +1.0%.
BoJ’s Quarterly Outlook Report: Key Highlights
The Board kept its median core consumer price index forecast for fiscal 2025 unchanged at +2.7%, the same as in October.
The median real GDP growth forecast for fiscal 2025 was revised up to +0.9% from +0.7% in October.
Real interest rates remain at significantly low levels.
Risks to the economic outlook are assessed as roughly balanced.
The impact of foreign exchange volatility on prices has become more pronounced than in the past, as firms are more willing to raise prices and wages.
Core consumer inflation is expected to slow to below 2% during the first half of this year.
Companies’ efforts to pass higher wages on to selling prices could strengthen more than anticipated.
Japan’s economy is projected to continue a moderate recovery.
Market reaction following the BoJ policy announcements
USD/JPY climbed further toward 158.60 in an immediate reaction to the Bank of Japan’s (BoJ) decision to keep interest rates unchanged, rising 0.11% on the day.
The section below was published at 23:00 GMT on January 22 as a preview of the Bank of Japan’s interest rate decision.
The Bank of Japan is widely expected to leave interest rates unchanged at 0.75% on Friday.
The central bank is likely to wait and assess the effects of December’s rate hike before considering further tightening.
February’s general elections introduce an additional layer of uncertainty to the BoJ’s monetary policy outlook.
The Bank of Japan (BoJ) is widely expected to keep its benchmark interest rate unchanged at 0.75% following the conclusion of its two-day monetary policy meeting next Friday.
The Japanese central bank raised interest rates to their highest level in three decades in December and is now likely to keep policy unchanged on Friday to better evaluate the economic impact of earlier hikes.
BoJ Governor Kazuo Ueda is expected to reaffirm the bank’s commitment to continued policy normalisation. As a result, investors will closely scrutinise his press conference for clues on the timing and extent of the next phase of the tightening cycle.
What to anticipate from the Bank of Japan’s interest rate decision?
The Bank of Japan is broadly expected to leave interest rates unchanged in January while signaling the possibility of further tightening if economic conditions unfold as projected.
In December, the BoJ raised rates by 25 basis points to 0.75%, and the meeting minutes showed that some policymakers favor additional tightening, noting that real interest rates remain sharply negative once inflation is taken into account.
Markets, however, have ruled out consecutive rate hikes, especially following Prime Minister Sanae Takaichi’s surprise call for snap elections and her proposal to suspend food and beverage taxes for two years to ease the burden on households amid rising inflation.
While the implications of these political developments for monetary policy remain uncertain, the BoJ has emphasized a cautious, gradual normalization of policy, aiming to withdraw stimulus without undermining economic growth. As a result, the central bank is likely to wait for greater political clarity and for the effects of past rate increases to become clearer before moving again.
Meanwhile, the yen has weakened steadily amid speculation surrounding the snap election. This raises the question of whether the currency’s depreciation will push the BoJ to adopt a firmer stance on monetary tightening.
How might the Bank of Japan’s monetary policy decision influence the USD/JPY exchange rate?
Markets have fully priced in a Bank of Japan rate pause on Friday, but the central bank will need to clearly signal further monetary tightening to curb the Yen’s ongoing weakness.
Yen sellers have eased off in recent days, helped by broad US Dollar softness linked to the EU–US trade dispute following President Donald Trump’s threats over Greenland. Even so, USD/JPY is still up roughly 0.7% year to date and remains close to last week’s 18-month peak around 159.50.
Investors are also concerned that Prime Minister Takaichi could secure stronger parliamentary backing after the elections, allowing her to push ahead with expansionary fiscal policies such as higher spending and tax cuts. This has heightened worries about Japan’s already stretched public finances, driving the Yen lower and pushing long-term government bond yields to record highs amid fears of a potential fiscal crisis.
Meanwhile, recent remarks from BoJ Governor Ueda have reinforced the bank’s cautious tightening stance, suggesting Japan is transitioning toward a more sustainable inflation environment where wages and prices rise together. For the Yen’s recent, still-fragile rebound to continue, markets will need clearer evidence that interest rate hikes are on the horizon.
USD/JPY 4-Hour Chart
From a technical standpoint, FXStreet analyst Guillermo Alcalá views USD/JPY as undergoing a bearish correction, with an important support zone just above 157.40. He notes that while the pair has pulled back from recent highs, Yen buyers would need to push it below the 157.40–157.60 support area to invalidate the short-term bullish structure and open the door to a move toward the early-January lows near 156.20.
A cautious or non-committal message from the BoJ would likely disappoint markets and weaken the Yen. In that scenario, Alcalá expects USD/JPY to climb to new long-term highs. He points out that technical signals are improving, with the 4-hour RSI rebounding from the 50 level, indicating strengthening bullish momentum. At the time of writing, the pair is challenging resistance around 158.70 (the January 16 high), which stands as the final hurdle before the 18-month peak close to 159.50.
UK retail sales increased by 0.4% month-on-month in December, rebounding from a 0.1% decline in November, according to data released Friday by the Office for National Statistics.
Markets had expected retail sales to fall by 0.1% during the month. Core retail sales, which exclude auto fuel, rose 0.3% month-on-month in December, reversing a revised 0.4% decline previously reported. The reading exceeded market expectations for a 0.2% fall.
On an annual basis, UK retail sales increased 2.5% in December, up from a revised 1.8% previously and above the consensus forecast of 1.0%. Annual core retail sales also strengthened, climbing 3.1% compared with a revised 2.6% gain earlier, outperforming expectations of a 1.4% rise.
Market response to the UK Retail Sales data
The positive UK Retail Sales report has failed to lift the Pound Sterling, with GBP/USD down 0.06% on the day, trading at 1.3488 at the time of writing.
The following section was published on January 23 at 5:11 GMT as a preview of the UK Retail Sales report.
Overview of UK Retail Sales
The UK calendar features the release of the December Retail Sales figures from the Office for National Statistics (ONS) on Friday at 07:00 GMT.
Retail Sales are forecast to edge down by 0.1% month-on-month in December, following an identical 0.1% decline in November. On a yearly basis, sales are expected to increase by 1%, slightly higher than the previous 0.6% rise.
Core Retail Sales, which exclude motor fuel, are also projected to slip by 0.2% MoM, in line with the prior reading, while annual growth is anticipated to improve to 1.4% from 1.2% in November.
How might UK retail sales influence the GBP/USD exchange rate?
The GBP/USD pair could show little reaction even if UK Retail Sales for December exceed expectations, as markets largely anticipate the Bank of England to maintain a cautious, gradual easing stance despite stronger price pressures seen in December. Attention is likely to shift instead to the preliminary January S&P Global PMI readings from both the UK and the US, scheduled for release later in the day.
Sterling may find support if the US Dollar weakens amid rising risk aversion linked to geopolitical tensions. Earlier, US President Donald Trump threatened tariffs on European nations opposing his Greenland initiative, but later eased his stance after reaching a NATO framework agreement that opened the door to a potential deal.
From a technical perspective, GBP/USD is holding firm after climbing more than 0.5% in the previous session, hovering near the 1.3500 level at the time of writing. The pair could aim for the three-month peak at 1.3562 as the next resistance. On the downside, initial support is seen at the nine-day EMA around 1.3451, followed by the 50-day EMA near 1.3398.
Bitcoin declined on Friday, rounding out a weak week as easing tensions between the U.S. and Greenland, along with a major purchase by Strategy, failed to revive demand for cryptocurrencies.
Risk appetite during the Asian session was further constrained by a Bank of Japan meeting and warnings from U.S. President Donald Trump about possible military action against Iran.
Safe-haven assets such as gold and other precious metals surged to record highs amid rising demand for physical stores of value, while Bitcoin largely underperformed compared with bullion. The world’s largest cryptocurrency slipped 0.5% to $89,517.3 by 00:53 ET (05:53 GMT).
Bitcoin on track for 5% weekly drop, ignores positive signals
Although Bitcoin posted modest gains earlier this week after Trump softened his stance on Greenland, the world’s largest cryptocurrency quickly reversed direction, drifting back toward one-month lows.
Bitcoin was on course for a roughly 5% weekly decline, finding little support from Strategy Inc. (NASDAQ:MSTR) despite the company’s disclosure of a $2.1 billion Bitcoin purchase.
In recent months, Strategy has also become a source of concern for the market, as investors questioned the long-term sustainability of its Bitcoin treasury strategy, particularly amid Bitcoin’s continued price underperformance.
Bitcoin and the broader crypto market were further pressured by delays to a long-anticipated crypto regulation bill, after leading U.S. exchange Coinbase Global Inc. (NASDAQ:COIN) opposed the legislation in its current form.
Retail demand for Bitcoin remained subdued, as strong performance in technology stocks—driven by enthusiasm around artificial intelligence—absorbed much of the available investment capital.
The Coinbase Bitcoin Premium Index, which tracks the difference between Bitcoin’s U.S. price on Coinbase and the global average, has shown Bitcoin trading at a near-persistent discount in the U.S. since mid-December, signaling continued weakness in retail interest within the world’s largest crypto market.
Crypto prices today: Altcoins slide, headed for sharp weekly losses
Broader cryptocurrency prices declined alongside Bitcoin and were on track for significantly steeper losses this week.
Ether, the world’s second-largest cryptocurrency, dropped 2.4% to $2,946.35 and was heading for an 11.2% weekly decline. XRP fell 1.5%, while BNB slipped 0.1%, with both tokens set to post weekly losses of around 6% to 8%.
Solana and Cardano each declined 1.5% and were down roughly 10% for the week. Among memecoins, Dogecoin fell 1.3%, while $TRUMP eased 0.9%.
Gold prices climbed to an all-time high during Asian trading on Friday, edging closer to the widely monitored $5,000-per-ounce mark after U.S. President Donald Trump said American ships had been deployed toward Iran, boosting demand for safe-haven assets.
Silver and platinum also reached record levels on Friday. Although precious metals eased slightly after Trump announced a trade agreement involving Greenland, continued uncertainty over the deal and heightened tensions with Iran sustained investor demand for safe havens.
Spot gold climbed as much as 0.7% to a new record of $4,967.48 an ounce, while February gold futures advanced more than 1% to $4,969.69 per ounce.
Spot silver surged almost 3% to an all-time high of $99.0275, and spot platinum gained nearly 1% to reach a record peak of $2,692.31 per ounce.
Trump says a large U.S. naval “armada” is being sent toward Iran as tensions escalate
Speaking to reporters aboard Air Force One on Thursday night, Trump said the United States had dispatched a naval fleet toward Iran, warning Tehran against harming protesters or resuming its nuclear program.
“We have an armada moving in that direction, and hopefully it won’t need to be used,” Trump said, adding that he would prefer to avoid any escalation. According to reports, a U.S. aircraft carrier along with several destroyers is expected to arrive in the Middle East in the coming days.
Earlier in January, Trump had warned Tehran against the killing of protesters as Iran faced nationwide demonstrations against the Nezam.
However, although he later softened his tone toward Iran, Trump’s remarks on Thursday reignited concerns about the possibility of U.S. military intervention in the Middle East.
Gold and metals post strong start to 2026
Metal markets surged through January as escalating geopolitical risks drove investors toward physical safe-haven assets. A U.S. military move into Venezuela early in the year, along with Trump’s threats related to Greenland, boosted demand for low-risk investments.
So far in 2026, spot gold has risen nearly 15%, while silver has jumped close to 39% and platinum has gained about 21%.
A weaker U.S. dollar has also supported metal prices, as mixed economic signals fueled expectations that the Federal Reserve will cut interest rates later this year. The Fed is set to meet next week and is widely expected to keep rates unchanged for now.
Trump’s criticism of the Fed further lifted safe-haven demand, alongside growing concerns about worsening fiscal conditions in developed economies, particularly Japan. Sharp sell-offs in Japanese and U.S. government bonds in recent weeks have prompted investors to rotate into gold.
Geopolitical tensions are rising as President Trump moves ahead with threats to levy tariffs on eight NATO allies while continuing his push regarding Greenland. Although overall markets have weakened, these frictions may spur higher defense budgets, accelerated resource reshoring, and expanded infrastructure investment. Below, we identify five U.S.-based companies that stand to gain from the intensifying U.S.–NATO standoff.
As tensions between the U.S. and NATO escalate over fresh tariffs and Greenland’s strategic resource base, defense, mining, and industrial shares appear well positioned for a strong upswing. Against this backdrop, five companies stand out—Lockheed Martin (NYSE:LMT), RTX (NYSE:RTX), Critical Metals (NASDAQ:CRML), Teck Resources (NYSE:TECK), and Caterpillar (NYSE:CAT). Each is set to benefit from increased U.S. defense spending, intensifying competition for Arctic resources, and ongoing efforts to shift supply chains away from Europe and China.
Lockheed Martin: A Leader in Arctic Defense Capabilities
Lockheed Martin appears to be among the primary beneficiaries of rising U.S.–NATO tensions, particularly as Greenland’s strategic value elevates the need for enhanced Arctic defense capabilities. The company’s advanced military platforms and surveillance systems are well suited to the region’s demanding operational environment.
Its F-35 fighter aircraft, along with missile defense and radar solutions such as the “Golden Dome,” play a central role in Arctic security, where Greenland’s geographic position strengthens U.S. monitoring capacity and deterrence against potential Russian and Chinese advances.
So far in 2026, Lockheed Martin’s shares are up roughly 19% year to date, supported by President Trump’s proposed $1.5 trillion defense budget for 2027, which points to expanded procurement activity. In periods of sustained geopolitical strain, investors typically favor companies with stable revenues and long-term contracts. Against this backdrop, Lockheed’s robust order backlog, strong free cash flow generation, and reliable dividend profile position it as a traditional “geopolitical hedge” stock.
RTX: Rising Demand Across Aerospace and Missile Systems
RTX, formerly known as Raytheon, stands out as a key beneficiary due to its broad defense technology portfolio tailored to the demanding requirements of Arctic environments. The company’s missile defense and advanced radar solutions are central to securing and monitoring strategically vital regions such as Greenland.
In particular, RTX’s Patriot missile defense system is regaining prominence as governments prioritize battle-tested platforms capable of operating in extreme climates while defending against increasingly sophisticated threats.
RTX shares are up about 7% year to date in 2026, following a strong 60% advance in 2025, with a record backlog of $251 billion underpinning continued momentum.
Looking ahead through the rest of 2026, RTX remains attractive amid rising orders from the Middle East, its inclusion in leading defense-focused ETFs, and expectations for roughly 20% earnings growth.
Critical Metals controls the Tanbreez project in Greenland, the largest non-Chinese rare earth deposit globally, directly linking the company to U.S. strategic resource objectives. Heightened geopolitical tensions could accelerate Washington’s push to secure access to these materials, which are essential for defense systems, missile technologies, and electric vehicles—reducing reliance on China and enhancing CRML’s strategic importance.
In addition, the company’s proprietary rare earth processing capabilities and its focus on North American operations position it to benefit from government initiatives aimed at strengthening domestic critical-materials supply chains and expanding strategic mineral stockpiles.
CRML shares have surged nearly 150% so far in 2026, propelled by strong high-grade drilling results and regulatory approval for its pilot processing plant in Greenland.
While the stock carries elevated risk, it offers substantial upside potential this year, with the possibility of capturing up to 50% of the Western rare earth supply. Despite ongoing volatility, secured offtake agreements and heightened U.S. national security priorities support the bullish case, with the stock still trading at an estimated 22% discount to net present value.
Teck Resources: A Global Metals and Mining Leader
Teck Resources is a leading diversified mining company with significant exposure to steelmaking coal, copper, zinc, and other essential industrial metals. While its operations are not exclusively Arctic-centric, Teck’s asset base firmly places it within the strategic raw materials space that underpins infrastructure development, defense manufacturing, and the global energy transition.
Should 2026 be marked by robust commodity demand, sustained decarbonization spending, and intensifying geopolitical rivalry, diversified miners such as Teck are well positioned to benefit from favorable pricing dynamics and rising shipment volumes.
TECK shares are up roughly 5% year to date, notching fresh 52-week highs as copper prices rally and investors rotate into the materials sector.
Looking ahead, Teck presents a compelling copper-focused opportunity, with its merger with Anglo American set to create a top-five global producer, unlock an estimated $800 million in synergies, and benefit from AI-driven demand growth. Analyst price targets in the $80–90 range are underpinned by structural supply constraints and sustained long-term commodity demand.
Caterpillar – Infrastructure & Arctic Expansion
Caterpillar stands out as a key beneficiary through its portfolio of heavy machinery and construction equipment critical to Arctic infrastructure expansion, including military installations, transportation networks, and mining projects.
Its specialized cold-weather and Arctic-rated equipment gives Caterpillar a distinct advantage in supporting development across Greenland and other high-latitude regions that gain strategic relevance amid heightened geopolitical tensions.
CAT shares are up roughly 10% year to date in 2026, building on a strong 58% gain in 2025, supported by a record backlog of $39.9 billion.
Looking ahead, Caterpillar remains a solid hold for 2026, with earnings per share projected to grow about 20.5%, aided by continued spending under the U.S. Infrastructure Act and expanding construction tied to AI-driven data center development.
Last week, we kicked off a broad review of the key macro forces shaping the stock market, focusing on the health of the economy and earnings expectations. The takeaway was clear: the economy appears to be in solid shape, and consensus forecasts for earnings growth this year are not just positive, but notably strong.
Admittedly, there has been no shortage of headlines and market volatility since then. It would be reasonable to dive into geopolitical developments, market breadth, or the current state of the AI trade. However, at least for now, none of these factors have altered the market’s primary trend. With that in mind, it makes sense to continue our top-down assessment of the major macro drivers.
Having already examined the economy and earnings, the remaining areas to address are inflation, Federal Reserve policy and interest rates, and market valuations. Let’s turn to those next.
What Is Inflation?
The Federal Reserve defines inflation as a sustained rise in the prices of goods and services over time, reflecting a general increase in the overall price level across the economy. Similarly, Investopedia and standard economics textbooks describe inflation as a gradual erosion of purchasing power, manifested through a broad-based increase in the prices of goods and services over time. The International Monetary Fund frames inflation as the pace at which prices rise over a given period, indicating how much more costly a representative basket of goods and services has become.
Or, as I was taught in my very first economics class many years ago, inflation can be summed up as “too much money chasing too few goods.”
In Focus
There is little doubt that inflation has dominated the attention of the Federal Reserve, policymakers, consumers, and financial markets for several years. Unless one has been completely disconnected from events, it is well known that inflation surged in the aftermath of the COVID crisis, driven by trillions of dollars in government stimulus flowing into household bank accounts and severe disruptions across global supply chains.
This surge fueled fears that the United States was heading back toward the inflationary turmoil of the 1970s—a period the Fed ultimately subdued, but only at significant cost to the economy. With the Consumer Price Index approaching double-digit territory in early 2022, such concerns were understandable.
As the pandemic faded and supply chains normalized, inflationary pressures also began to ease. By early 2024, CPI readings had fallen back near pre-pandemic levels, when face coverings were not yet a cultural norm. The key question now is whether the inflation spike has been fully brought under control.
While corporate pricing strategies and consumer behavior—both central drivers of inflation—are inherently difficult to forecast, it remains possible to analyze the components of the CPI and examine the historical forces that have shaped inflation trends.
A Framework for Understanding Inflation
Unsurprisingly, the team at Ned Davis Research Group has already taken this step. In short, there is indeed a model that addresses this—shown below.
The upper chart shows the Consumer Price Index, which represents the inflation rate, while the lower chart displays NDR’s Inflation Timing Model. Reading the model is fairly intuitive. When the blue line rises above zero, it signals that inflation pressures are likely increasing. Historically, readings above 10 have coincided with periods when inflation was significantly above normal levels.
The red box highlights the CPI period from late 2020 through early 2022. During that phase, the model effectively flagged the acceleration in inflation and warned that conditions were set to deteriorate. The model also performed well in the opposite direction in the fall of 2022. While widespread concern about inflation persisted, the model correctly indicated that inflation was poised to ease—and it did.
That downtrend continued until late 2024 or early 2025, when the model briefly suggested inflation was no longer moving in the right direction. However, the signal proved temporary, as the model dropped back below the zero line by the end of 2025. Encouragingly, recent data has validated the model’s current reading, with price pressures generally moderating and the inflation rate falling back below 3%.
Is 3% Becoming the New Inflation Norm?
Inflation skeptics are quick to push back against my relatively calm view, pointing out that inflation remains well above the Federal Reserve’s stated 2% target. From that perspective, they argue the Fed is unlikely to turn accommodative anytime soon. While this logic is understandable, it overlooks two important points: first, the Fed operates under a dual mandate, and second, its preferred inflation gauge—core PCE—differs from the inflation measures most often highlighted in the media.
Crucially, inflation is not the Fed’s sole concern. Maintaining a healthy labor market is equally central to its mission. As a result, the Federal Open Market Committee must carefully balance inflation pressures against broader economic conditions.
This helps explain why the Fed has been cutting interest rates even as inflation remains above target. The labor market has shown signs of weakening, prompting policymakers to act. Equity bulls have welcomed these moves, mindful of the long-standing adage that it rarely pays to fight the Fed. With rates coming down, investors have largely aligned with the bullish camp.
That said, it’s important to recognize that the Fed is not engaged in an aggressive stimulus campaign. Chair Jerome Powell and his colleagues are not attempting to jump-start the economy. Instead, they are seeking to bring interest rates back toward a more neutral, “normal” level—one that balances inflation with labor market stability.
In this context, the prevailing view is that the Fed is willing to tolerate inflation running somewhat above its 2% target while it works to shore up employment conditions. From that standpoint, an inflation rate around 3% may be acceptable—for the time being.
In Summary
The encouraging takeaway is that history suggests a modest amount of inflation can actually be beneficial—supporting stock prices, home values, and corporate earnings. From that perspective, inflation does not appear to be a headwind for equities at present. While this may not be a classic “don’t fight the Fed” environment, the central bank is also not acting as an adversary. As a result, my view is that investors can remain on the bullish path—for now.
This move would likely complete a broader irregular expanded flat formation, labeled red W-iv, made up of green waves W-a, W-b, and W-c. These waves collectively form a 3-3-5 structure (gray a, b, c – a, b, c – i, ii, iii, iv, v), unfolding near the 50% retracement level of the entire red W-iii. From this zone, red W-v could begin, with upside potential extending to at least $164K, thereby fulfilling the first condition outlined above.
In our previous update, we highlighted three key observations on Bitcoin (BTC), spanning both long-term and short-term perspectives.
Bitcoin posted a negative close in 2025, marking a disappointing year for the asset. Still, historical patterns—albeit based on limited data—show that BTC has never finished lower for two years in a row. With 2024 ending in positive territory, this suggests that the period from 2026, and potentially through 2028, could be bullish.
That said, similar to conditions seen in 2015 and as outlined in earlier analysis, the risk of a deeper pullback cannot be dismissed. Bitcoin may still print a lower low near the upper band of long-term support, around $69K–$73K, before a sustained upside move takes hold.
To confirm renewed bullish momentum, BTC must break above the December 9 high at $94,617, which would open the door to a potential third wave advance. As a result, bullish warning levels have been revised to $91,483, $90,327, $88,410, $86,704, and $84,424. Each successive break below these thresholds raises the probability by roughly 20% that BTC will revisit the low-to-mid $70K range before attempting another rally.
These observations matter because they provide the framework for both current market behavior and likely future developments. Bringing the analysis up to date, Bitcoin broke above the $94,617 level on January 13, but managed to stay above it for only four days before slipping back to around $88,000. This proved to be a false breakout, invalidating the impulsive path we had been monitoring. At the same time, the third warning level has now been breached, raising the probability to 60% that the broader uptrend has ended. As a result, we have promoted our alternative bearish Elliott Wave count to the primary scenario. See Figure 1 for details.
Figure 1. Bitcoin’s intermediate-term Elliott Wave count since June 2025.
The failed breakout strongly points to the January 14 peak at $97,943 as the termination of orange Wave-c within gray W-iv. Notably, Wave-c was nearly equal in length to the same-degree orange Wave-a that topped at $94,617, measuring 13,519 versus 14,055 points—a textbook relationship.
In classical Elliott Wave analysis, a third wave typically extends to the 138.2%–161.8% projection of the first wave, measured from the second wave. On November 21, Bitcoin’s low at $80,562 came close to the 1.618 extension of the gray W-i low from October 17, measured from the gray W-ii high on October 27 at $79,654. Following W-iii, waves W-iv and W-v are expected, with W-iv commonly retracing into the 76.4%–100% extension zone, and W-v subsequently targeting the 176.4%–200.0% extension zone.
The January 14 gray W-iv high occurred almost precisely at the 76.4% level—$97,943 versus a projected $99,068—keeping the structure technically sound. To date, Bitcoin’s price action appears to be unfolding as a downward impulse. In addition, W-ii formed a zigzag while W-iv developed as an expanded flat, satisfying the rule of alternation. Accordingly, provided BTC remains below the January 14 high at $97,943, we anticipate a move toward the 176.4%–200.0% Fibonacci extension area between $76,335 and $70,970 for gray W-v, fulfilling conditions 2) and 3) outlined earlier.
Completion of gray W-v would likely also conclude a broader irregular expanded flat, labeled red W-iv, composed of green waves W-a, W-b, and W-c. Together, these form a 3-3-5 structure (gray a, b, c – a, b, c – i, ii, iii, iv, v), unfolding near the 50% retracement of the entire red W-iii. From that base, red W-v could then begin, with upside potential extending to at least $164K, satisfying condition 1) from the list above.
The Australian dollar moved higher after stronger-than-expected employment data reinforced expectations of a tighter policy stance from the Reserve Bank of Australia. Seasonally adjusted employment in Australia increased by 65.2K in December, while the unemployment rate declined to 4.1%. Meanwhile, the U.S. dollar firmed after Bloomberg reported that President Trump would pause tariffs on European countries opposing his push over Greenland.
The Australian dollar strengthened against the U.S. dollar on Thursday after seasonally adjusted employment data from Australia reinforced expectations of a tighter monetary policy stance by the Reserve Bank of Australia. Data from the Australian Bureau of Statistics showed employment rose by 65.2K in December, reversing a revised loss of 28.7K jobs in November and well above the market forecast of a 30K increase. Meanwhile, the unemployment rate fell to 4.1% from 4.3%, beating expectations of 4.4%.
Sean Crick, head of labour statistics at the ABS, noted that a rise in employment among people aged 15–24 helped lift overall employment levels and contributed to the drop in the unemployment rate. Meanwhile, the International Monetary Fund has called on the RBA to proceed cautiously, pointing out that inflation has remained above the Bank’s 2%–3% target range for an extended period, despite headline CPI easing faster than expected in November.
U.S. dollar rises as Trump eases tariff threats against Europe
The U.S. Dollar Index (DXY), which tracks the greenback against six major currencies, was steady after posting modest gains in the previous session, trading around 98.80 at the time of writing. The dollar found support after Bloomberg reported on Wednesday that President Donald Trump said he would step back from imposing tariffs on goods from European countries opposing his bid to take control of Greenland. Earlier, Trump had insisted there was “no going back” on his ambitions for Greenland and had threatened to impose new 10% tariffs on eight European Union nations.
Trump also stated that the United States and NATO had “established the framework of a future deal on Greenland,” though he provided no details, leaving the scope and substance of the proposed agreement unclear.
U.S. labor market data has pushed expectations for further Federal Reserve rate cuts back to June, with Fed officials signaling little urgency to ease policy until there is clearer evidence that inflation is moving sustainably toward the 2% target. Morgan Stanley analysts revised their 2026 outlook, now projecting one rate cut in June and another in September, compared with their earlier expectations for cuts in January and April.
In Asia, the People’s Bank of China announced on Tuesday that it would keep its Loan Prime Rates unchanged, with the one-year and five-year LPRs remaining at 3.00% and 3.50%, respectively. Developments in China remain important for the Australian dollar, given the close trade relationship between the two economies.
China’s industrial production grew 5.2% year-on-year in December, accelerating from 4.8% in November, supported by resilient export-led manufacturing. However, retail sales increased just 0.9% year-on-year, falling short of expectations of 1.2% and slowing from November’s 1.3%.
In Australia, the TD-MI Inflation Gauge rose to 3.5% year-on-year in December from 3.2%, while monthly inflation jumped 1.0%, the fastest pace since December 2023 and a sharp acceleration from 0.3% in the previous two months.
RBA policymakers acknowledged that inflation has eased significantly from its 2022 peak, but recent data points to renewed upward pressure. Headline CPI slowed to 3.4% year-on-year in November, the lowest level since August, yet remains above the RBA’s 2–3% target range. Trimmed mean CPI edged down to 3.2% from 3.3% in October.
The RBA assessed that inflation risks have modestly tilted to the upside, while downside risks—particularly from global factors—have eased. Policymakers expect only one additional rate cut this year, with underlying inflation projected to stay above 3% in the near term before easing toward around 2.6% by 2027.
Australian dollar tests the 0.6800 level near the top of its ascending channel
AUD/USD was trading near 0.6790 on Thursday. Daily chart signals show the pair continuing to climb within an ascending channel, reflecting a sustained bullish bias. The nine-day exponential moving average remains above the 50-day EMA, with prices holding above both indicators, reinforcing the positive momentum and keeping upside pressure intact. Meanwhile, the 14-day Relative Strength Index stands at 69.93, close to overbought territory, suggesting momentum is becoming stretched.
The pair is currently challenging immediate resistance at the psychological 0.6800 level, followed by the upper boundary of the ascending channel near 0.6810. A decisive break above the channel could open the door to 0.6942, marking the highest level since February 2023.
On the downside, initial support is seen at the nine-day EMA around 0.6732. A move below this short-term support would undermine bullish momentum, bringing the lower boundary of the ascending channel near 0.6680 into focus, ahead of the 50-day EMA at 0.6656.
Gold prices edged lower in Asian trading on Thursday after touching a record high near $4,900 an ounce in the prior session, as U.S. President Donald Trump’s retreat from tariff threats linked to Greenland tensions dampened safe-haven demand. Spot gold declined 0.7% to $4,799.55 an ounce by 20:36 ET (01:36 GMT), after hitting a record peak of $4,888.1 an ounce a session earlier. March U.S. gold futures also slipped 0.8% to $4,801.75 an ounce.
Gold jumped on Wednesday as geopolitical tensions intensified following a transatlantic dispute over Greenland and threats of tariffs on European imports. The rally earlier this week lifted bullion close to the psychological $5,000 level, with investors seeking a safe haven amid heightened global uncertainty.
Prices later pulled back after President Trump, speaking at the World Economic Forum in Davos, said he would refrain from imposing the tariffs and ruled out the use of force in the dispute over the Danish territory. He added that a “framework” agreement was taking shape to ease tensions with NATO allies.
“It’s a long-term deal — the ultimate long-term deal — and it puts everyone in a very strong position, particularly when it comes to security and minerals,” Trump told reporters. Gold also faced mild pressure from a modest rebound in the U.S. dollar, with the Dollar Index trading slightly higher after rising 0.1% in the previous session.
Oil prices were largely flat in Asian trade on Thursday as U.S. President Donald Trump eased tariff threats related to Greenland. Market participants also weighed an increase in U.S. crude inventories alongside recent supply disruptions. At 22:07 ET (03:07 GMT), March Brent futures inched up 0.1% to $65.31 a barrel, while WTI crude rose 0.2% to $60.74. Both benchmarks have posted modest gains over the past two sessions, underpinned by supply concerns after OPEC+ member Kazakhstan suspended production at the Tengiz and Korolev oilfields on Sunday.
Trump retreats from tariff threats against Greenland
Market sentiment improved after President Trump unexpectedly softened his position on Greenland on Wednesday, stepping back from threats to impose tariffs on European countries as leverage to annex the Danish territory. He ruled out the use of force and indicated that a framework for a potential deal was emerging, easing concerns over a sharp escalation in U.S.–EU tensions that could have pressured global growth and energy demand. The de-escalation supported broader risk appetite, although oil markets remained cautious amid mixed supply and demand signals.
U.S. crude inventories increase again, API data shows
The American Petroleum Institute (API) reported that U.S. crude stockpiles increased by 3.04 million barrels in the week ending Jan. 16, following a build of more than 5 million barrels the previous week. Gasoline inventories surged by 6.21 million barrels, signaling weaker demand, while distillate stocks—including diesel and heating oil—slipped by 33,000 barrels.
On the demand front, oil prices drew some support after the International Energy Agency raised its forecast for global oil demand growth in 2026 on Wednesday. Despite the upward revision, the IEA continues to expect the oil market to remain in a substantial surplus through 2026.
Roughly $700 billion is the price tag now being discussed for a potential acquisition of Greenland, according to recent reports.
Skepticism is warranted. A transaction of that magnitude seems highly unlikely, particularly given that it would exceed half of the U.S. Defense Department’s entire 2024 budget. Public sentiment also appears far from supportive, despite President Donald Trump’s assertion that “anything less than full U.S. control of Greenland is unacceptable.”
Polling suggests little domestic support in the United States for the idea, whether pursued diplomatically or by force. A recent YouGov survey found that just 13% of Americans support compensating Greenland’s residents to join the U.S., while only 8% favor acquiring the island through military means.
Sentiment in Greenland is similarly resistant, with an overwhelming majority unwilling to leave the Danish realm, and opposition across Europe—particularly in Denmark—remains firm.
That said, dismissing Greenland’s significance altogether would be a mistake.
Why Greenland Matters—Even Without a Sale
Positioned between North America, Europe, and Russia, Greenland hosts the Pituffik Space Base, a critical site where the U.S. Space Force monitors potential threats traversing the Arctic and the North Pole.
This role has grown increasingly significant as Arctic ice continues to recede. Satellite data show that summer sea ice has been declining by more than 12% per decade—roughly 33% since 1984—opening new shipping routes and reshaping both military and commercial dynamics. As I noted last year, the Arctic is becoming not only more accessible, but also more investable.
Denmark clearly recognizes Greenland’s growing importance. The kingdom has pledged more than $4 billion toward Arctic and North Atlantic defense through 2033, coordinating closely with NATO allies. Danish and allied air, naval, and ground forces are increasing their presence on and around the island, with exercises focused on protecting critical infrastructure and conducting fighter operations in Arctic conditions. At the same time, Denmark’s Chief of Army Command, Peter Boysen, has openly discussed the need for a stronger boots-on-the-ground posture.
The Tough Realities of Developing Greenland
Greenland’s resource base adds another layer of significance. The island holds substantial deposits of iron ore, copper, zinc, graphite, tungsten, and other minerals.
Most attention, however, centers on rare earth elements (REEs)—critical materials used in technologies ranging from smartphones and fighter jets to missile guidance systems. According to the Center for Strategic and International Studies (CSIS), Greenland currently ranks eighth worldwide in proven rare earth reserves, with the potential to climb higher as exploration continues.
From a miner’s perspective, the resource potential looks compelling. In reality, however, development would be slow, complex, and highly capital-intensive.
Greenland spans an area roughly three times the size of Texas, yet it has fewer than 100 miles of roads—and none connect one town to another. Energy infrastructure is sparse, transportation costs are steep, and many mineral deposits are associated with uranium, which Greenland prohibited from mining in 2021 following strong local opposition.
In this sense, Greenland is often mischaracterized in much the same way as Venezuela. Both are portrayed as resource-rich prizes ready for rapid exploitation—rare earths in Greenland’s case, oil in Venezuela’s—but the reality is that unlocking these assets would require billions of dollars and many years of sustained investment. Illustrating the challenge, Wood Mackenzie notes that only 25 hydrocarbon exploration wells have ever been drilled in Greenland, none of which have resulted in commercial success. Neither region should be viewed as a quick path to easy riches.
China’s Efforts to Establish a Presence in Greenland Have Fallen Short
China is well aware of Greenland’s strategic and resource significance. Over the past decade, Beijing has sought to establish a presence through airport construction proposals, infrastructure investments, scientific research initiatives, and other channels.
Most of these efforts, however, have been blocked on national security grounds by either Denmark or the United States. In 2016, for example, a Chinese mining firm’s attempt to purchase a former U.S. naval base in Greenland was stopped. Two years later, China’s state-owned China Communications Construction Company (CCCC) pursued a $550 million contract to expand several Greenlandic airports, but then–U.S. Secretary of Defense James Mattis successfully urged Denmark to withdraw the bid.
So What’s Driving Trump’s Interest in Greenland?
Having said all that, why does President Trump want Greenland so badly (other than as retribution for not being awarded the Nobel Peace Prize)?
He insists it’s for national security, but, as I mentioned earlier, the U.S. military already has broad access to the island, as spelled out in the 1951 agreement signed by the U.S. and Denmark.
Further, Greenland is under the protection of NATO, of which the U.S. is a member. If Russia or China tried to attack it, Article 5 of the treaty would be triggered, activating NATO forces.
Recent reporting suggests that some of Trump’s wealthiest backers see Greenland not as a military outpost or mining play, but as a blank slate. According to Reuters, influential tech investors—including Peter Thiel and Marc Andreessen—have pitched the idea of turning parts of Greenland into a so-called “freedom city,” offering a low-regulation, quasi-autonomous hub for next-gen technologies.
Another explanation? Trump’s reaffirmation of the Monroe Doctrine, which the White House has dubbed the “Trump Corollary” or “Donroe” Doctrine. As stated in the president’s December 2 proclamation, the “American people—not foreign nations nor globalist institutions—will always control their own destiny” in the Western Hemisphere. Denmark, notably, sits in the Eastern Hemisphere.
Japan’s Gold Reserves Reach a New Record High
To conclude, central banks worldwide continue to accumulate gold as a means of supporting their currencies and reducing reliance on the U.S. dollar.
While emerging markets have driven the bulk of gold purchases over the past decade, several advanced economies have also increased their holdings. According to The Kobeissi Letter, Japan’s gold reserves reached a new record in 2025, rising to approximately $120 billion—an increase of roughly 60% compared with the previous year.
According to data from the World Gold Council (WGC), Japan now holds the world’s ninth-largest gold reserves, excluding the International Monetary Fund.
As I’ve noted previously, the actions of major institutions underscore a clear recognition of the value of hard assets like gold. For that reason, I continue to advocate allocating around 10% of a portfolio to gold, divided evenly between physical bullion and high-quality gold mining equities, with positions rebalanced annually.
All views expressed and information provided are subject to change without prior notice and may not be suitable for all investors. Links provided may direct you to third-party websites; U.S. Global Investors does not endorse and is not responsible for the accuracy or content of these external sources.
The modern state increasingly rests on three foundations: debt, fiat currency, and coercive power. Concepts such as “national security” and “critical minerals” have become the latest government talking points, widely promoted and readily accepted by the public. Meanwhile, personal preparedness—once a priority during health crises—has faded from focus, even as harmful consumer habits and ultra-processed foods continue to be normalized and aggressively marketed.
Political leaders often project strength through military posturing and geopolitical confrontation while avoiding personal sacrifice, financing these actions primarily through expanding debt and currency creation. In several regions, power structures are maintained through force, information control, and repression rather than genuine legitimacy or accountability.
Across parts of the world, regimes with deeply troubling records are frequently rebranded as sources of “stability” when it suits geopolitical or economic interests, particularly in energy and resource markets. This pattern underscores a broader contradiction: governments race to announce ambitious initiatives and sweeping strategies, yet largely ignore the importance of real savings and sound money.
Against this backdrop, a growing share of the global population—particularly in Asia, along with a minority of investors in the West—has turned toward long-term wealth preservation through tangible assets such as gold and silver. For those already positioned this way, the erratic behavior and short-term thinking of governments is more a source of frustration than fear.
Gold is the currency of independent citizens. While the U.S. dollar is technically due for its fifth cyclical rebound against gold in the past 50 years, that does not mean it must happen immediately—and when it does…. Gold-focused savers should stay prepared to add to their gold holdings—and silver as well.
On the weekly chart, gold appears technically overbought, yet its price behavior is beginning to resemble the equity market’s powerful advance in the mid-1990s. Momentum indicators such as RSI and Stochastics are finding support near the 50 level before pushing above 70 and remaining elevated for extended periods—an indication of strong, persistent trends rather than imminent reversals.
Against a backdrop of rising debt, expanding fiat issuance, and escalating geopolitical risks, prominent gold investors such as Pierre Lassonde have projected that gold prices could approach the $20,000 level in the years ahead.
From a portfolio-management perspective, selectively taking profits—up to roughly 30% in many cases—can be prudent, not as a call on a fiat-denominated price peak, but as a way to build liquidity. That capital can then be redeployed during the next meaningful pullback, which is likely to occur at price levels well above today’s.
Psychologically, sharp corrections can be challenging, particularly for investors without available cash. Maintaining some dry powder through partial profit-taking enables investors to add to gold, silver, and mining positions when opportunities arise—this is the primary rationale for trimming exposure now.
Fundamentally, the case for gold remains exceptionally strong. Recent statements suggesting potential military actions involving NATO allies underscore the degree of geopolitical uncertainty. Even without direct conflict, such rhetoric alone could propel gold significantly higher against fiat currencies. In the event of an actual escalation, price moves of $2,000 per ounce—or more—could unfold rapidly.
The Shiller (CAPE) ratio—an inflation-adjusted price-to-earnings measure for the S&P 500—highlights the extreme valuation levels currently embedded in U.S equities.
If U.S. policymakers continue to pressure European allies through aggressive tariff measures while openly discussing military options, the resulting backlash could be severe. At some point, a tipping point may be reached, prompting European governments and institutions to rapidly reduce exposure to U.S. government bonds and U.S. equities.
Such a scenario would carry profound risks. Asset freezes or retaliatory measures could follow, severely disrupting global financial markets. Under those conditions, gold could experience explosive upside moves, potentially rising by thousands of fiat-denominated dollars in very short order. At the same time, forced selling from Europe could trigger a rapid collapse in U.S. equity markets, with a speed and scale rivaling—or even exceeding—historic market crashes.
The broader takeaway is that gold increasingly functions as a form of sovereign money for billions of individuals, particularly across Asia, who already view it as a long-term store of value. As pressures build on systems dominated by fiat currency, debt expansion, and coercive policy tools, the resilience of those systems may be tested. Should confidence fracture, the adjustment—especially in the U.S.—could be both abrupt and far-reaching.
Turning to the 10-year Treasury yield chart, the recent upside breakout carries profound implications for both the U.S. government and gold. For years, the notion of unlimited quantitative easing was promoted as a sustainable solution, but that framework was always unrealistic. Instead, it appears to be giving way to a regime of persistently higher interest rates—and, in parallel, steadily rising fiat-denominated gold prices.
This shift reflects a deeper issue: confidence in governments and their currencies is eroding. As debt burdens expand and monetary credibility weakens, markets are beginning to price in a structural change rather than a temporary cycle. In that environment, higher yields and higher gold prices are not contradictions but complementary signals of systemic stress.
The loss of trust in fiat-based systems is no longer a distant risk; it is an active force shaping global markets—and one that is likely to persist.
While a new Federal Reserve chair has yet to be appointed, the leading candidate, Kevin, is known to favor aggressive quantitative tightening and has openly described equity markets as severely overvalued. To restore credibility in the U.S. government, its bond market, and the dollar, a substantial and sustained QT program would likely be required.
What I continue to regard as one of the most significant base formations in market history is the inverse head-and-shoulders pattern on the CDNX. I have long argued that a breakout from this structure would likely coincide with a major move higher in long-term interest rates, and recent developments suggest that this scenario is unfolding decisively.
My long-term objective for the CDNX stands at 10,000, and well before that level is reached, many junior resource stocks could deliver outsized returns—potentially achieving multi-hundred- or even thousand-fold gains.
Another chart I encourage investors to monitor closely is the GDX-to-gold ratio. Of particular note is the 14,3,3 Stochastics oscillator at the bottom of the chart. As the upside breakout gains traction and the rally develops, this momentum indicator could remain in overbought territory not merely for months or years, but potentially for an extended secular period.
The broader takeaway is clear: Markets appear to be entering a new phase—one defined by a sustained gold bull cycle. In this environment, informed and disciplined investors stand to benefit the most, as capital increasingly shifts toward real assets and away from fiat-based complacency.
I’m not concerned about a negative market reaction at the open tied to headlines about President Trump’s interest in Greenland, as my exposure to gold stocks provides protection. Gold is surging today as a classic safe haven, offering an oasis amid uncertainty. There are always opportunities in the market, and some assets move counter to broader market swings—gold being a prime example. Among the gold names I favor are Kinross Gold, Agnico Eagle Mines, Alamos Gold, Coeur Mining, Caledonia Mining, Eldorado Gold, Idaho Strategic Resources, New Gold, OR Royalties, and SSR Mining.
I also view any pullback in high-quality technology stocks—particularly those linked to data centers and semiconductors—as a buying opportunity. Investors should not be distracted by short-term volatility or headline noise, as the U.S is simply reaffirming its global leadership position. Preferred names in the semiconductor and data center space include Bloom Energy, Power Solutions International, Comfort Systems, Vertiv Holdings, EMCOR Group, GE Vernova, and Ubiquiti.
Meanwhile, rising geopolitical uncertainty has given so-called bond vigilantes an opening to push global bond yields higher. Japan, the UK, and France remain especially vulnerable due to demographic headwinds that could constrain their ability to service government debt. U.S. Treasury yields have also moved higher, but for fundamentally stronger reasons: higher real rates, solid economic growth, and more favorable demographics relative to other developed economies. As global markets adjust to the reality of President Trump’s long-term ambitions, I expect the U.S dollar to strengthen and the 10-year Treasury yield to retreat toward 3.5% from its recent level near 4.3%.
The World Economic Forum is getting underway this week in Davos, Switzerland, with BlackRock CEO Larry Fink serving as an interim co-chair. Given BlackRock’s recent shift away from ESG and other themes long promoted at Davos, it remains to be seen whether Fink will face criticism from fellow participants. President Trump is scheduled to address the forum on Wednesday, where he is expected to outline his vision for global peace and prosperity, while also stressing the need for the U.S. to confront what he describes as destabilizing forces, including the Iranian regime.
California Governor Gavin Newsom is also expected to speak in Davos, where he plans to argue that President Trump’s economic agenda has underperformed—an argument that may prove difficult amid reports of roughly 5% GDP growth.
Heightened controversy surrounding the U.S. push to purchase Greenland from Denmark has effectively turned Davos into an emergency diplomatic gathering, with President Trump set to hold meetings with NATO allies. Italian Prime Minister Giorgia Meloni has offered to help mediate the Greenland discussions. Meanwhile, Trump has publicly criticized French President Emmanuel Macron and reportedly disclosed private communications in an attempt to highlight France’s handling of Syria. Known for his confrontational negotiating style, President Trump’s approach is likely to draw close scrutiny as European leaders assess how to respond.
Monero hovers near the key psychological $500 support after plunging 20% on Tuesday.
Hyperliquid is testing an important support level following a roughly 18% drop over three consecutive days.
Morpho edges toward the $1 mark as an 11% decline on Tuesday reinforces bearish pressure.
Monero (XMR), Hyperliquid (HYPE), and Morpho (MORPHO) are among the worst performers on Wednesday, as the broader cryptocurrency market records more than $1 billion in liquidations over the past 24 hours. From a technical standpoint, all three tokens are pressing key support levels following steep losses logged on Tuesday.
The downturn mirrors the sharp gap lower in US equities on Tuesday, driven by renewed tariff threats, looming court rulings, escalating geopolitical risks, and turbulence in Japan’s bond market.
Monero faces the risk of slipping below the $500 level
Monero is hovering near the $500 mark at the time of writing on Wednesday, with this psychological level limiting further downside after a sharp 20% sell-off the day before. Additional support may emerge at the 50-day Exponential Moving Average (EMA) around $484, followed by the 100-day EMA near $432, levels that would help maintain the broader bullish structure.
On the daily chart, the Moving Average Convergence Divergence (MACD) shows widening negative histograms, as the MACD line has crossed below the signal line and both indicators remain in negative territory, pointing to increasing bearish pressure.
Meanwhile, the Relative Strength Index (RSI) stands at 47.55, indicating a loss of bullish momentum.
XMR/USDT daily logarithmic chart.
On the upside, a sustained close above the 20-day EMA at $542 could extend the XMR rebound, targeting the $600 round figure.
Hyperliquid rebounds from a key support level
Hyperliquid is trading above $21 at the time of writing on Wednesday after suffering an 11% decline on Tuesday. The exchange token is up around 2% on the day, suggesting a short-term rebound following a roughly 18% drop over the past three sessions.
The Moving Average Convergence Divergence (MACD) continues to flash a sell signal triggered by Monday’s bearish crossover, with both signal lines pushing deeper into negative territory and red histograms widening. Meanwhile, the Relative Strength Index (RSI) sits at 35, hovering near oversold levels and underscoring persistent downside pressure.
Should HYPE register a daily close below the October 10 low at $20.82, price action could extend toward the S1 Pivot Point at $19.70, increasing the risk of further losses.
HYPE/USDT daily price chart.
However, a sustained rebound from the $20 level may face immediate resistance at the 20-day EMA near $24.52.
Morpho’s short-term recovery after a bearish slide
Morpho is edging about 2% higher at the time of writing on Wednesday, following a steep decline of roughly 20% over the past six days. The token continues to trade below its 20-, 50-, and 200-day Exponential Moving Averages (EMAs), all of which are trending lower, reinforcing the prevailing bearish bias.
Immediate support is located at the December 28 low near $1.08. A break below this level could accelerate losses beneath the psychological $1 threshold, with the S1 Pivot Point at $0.94 emerging as the next downside target.
In line with Hyperliquid, the Moving Average Convergence Divergence (MACD) indicator has turned bearish, with the MACD line drifting toward zero as the negative histogram expands, pointing to strong downside momentum.
Meanwhile, the Relative Strength Index (RSI) has fallen to 40, slipping decisively below the midline and signalling a sharp shift toward selling pressure, while still leaving room for further downside before oversold conditions are reached.
MORPHO/USDT daily price chart.
A prolonged rebound in MORPHO may encounter resistance at the 20-day EMA near $1.26, which could limit upside potential.
The UK’s Office for National Statistics (ONS) is set to release December CPI data on Wednesday. Headline inflation is expected to edge up to 3.3%, while core inflation is projected to remain sticky above 3.0% year-on-year.
The UK Office for National Statistics (ONS) is scheduled to publish December Consumer Price Index (CPI) data at 07:00 GMT on Wednesday, a release closely watched by financial markets. Economists anticipate a mild pickup in inflationary pressures.
UK inflation remains a key consideration for the Bank of England (BoE) and is typically a significant driver of Sterling movements. With the Monetary Policy Committee (MPC) due to meet on February 5, markets largely expect policymakers to leave the bank rate unchanged at 3.75%, though this week’s inflation figures are likely to influence the guidance and tone of the decision.
What might the upcoming UK inflation report reveal?
Headline UK CPI is projected to tick up to 3.3% year-on-year in December, compared with 3.2% in November. On a monthly basis, inflation is expected to rebound by 0.4%, reversing the 0.2% month-on-month decline seen previously.
Meanwhile, core inflation—which excludes volatile food and energy prices and is more closely monitored by the Bank of England—is anticipated to remain steady at 3.2% annually. Month-on-month, core CPI is forecast to rise by 0.3% after falling 0.2% in November.
What impact will the UK CPI data have on GBP/USD?
In December, the Bank of England’s Monetary Policy Committee narrowly voted 5–4 to reduce the bank rate by 25 basis points to 3.75%, marking its fourth cut in 2025. Although policymakers pointed to easing inflation pressures and initial signs of a softening labour market, they emphasised that any additional policy loosening would proceed cautiously.
The December Decision Maker Panel (DMP) survey largely reinforced this outlook and failed to alter expectations around the policy path. Persistent wage pressures continue to constrain the potential for significant repricing at the short end of the yield curve.
One-year-ahead wage growth expectations rose slightly to 3.7% from 3.6%, while actual pay growth over the past year remains in the mid-4% range. Both indicators remain well above levels consistent with a sustained return of inflation to the BoE’s target.
Overall, the survey does little to shift sentiment and supports the argument against accelerating rate cuts. Markets currently price in just over 42 basis points of easing for the year, with the BoE widely expected to keep rates unchanged at its next meeting.
From a technical perspective, Pablo Piovano highlights that GBP/USD is facing resistance near its yearly lows around 1.3340, recorded on January 19. A further decline could open the door to the 55-day simple moving average at 1.3309, followed by the December low at 1.3179. Conversely, if buyers regain control, the year-to-date high at 1.3567 may act as the first upside hurdle, with little resistance beyond that until the September 2025 peak at 1.3726.
Piovano also notes that momentum indicators remain supportive, with the Relative Strength Index rebounding to around 54 and the Average Directional Index near 20, pointing to a reasonably firm underlying trend.
U.S. stock index futures edged higher on Tuesday evening after Wall Street suffered sharp losses amid rising geopolitical tensions linked to President Donald Trump’s demands regarding Greenland. Netflix was a notable mover in after-hours trading, sliding nearly 5% after the streaming company issued guidance that disappointed the market.
Futures stabilized following Wall Street’s worst session in three months, as investors grew uneasy over President Trump’s push to acquire Greenland despite resistance from European leaders. S&P 500 futures gained 0.1% to 6,838.0 by 18:27 ET, while Nasdaq 100 and Dow Jones futures also rose 0.1% to 25,152.75 and 48,727.0, respectively.
Netflix falls after issuing a weaker-than-expected outlook; more earnings reports ahead
Netflix Inc (NASDAQ: NFLX) fell 4.8% despite reporting December-quarter earnings that topped market expectations, as its first-quarter guidance disappointed investors. The company pointed to weakening viewership for non-branded licensed content, signaling softer demand beyond its flagship in-house programming. Netflix’s outlook for 2026 also came in below expectations.
The results arrive amid a wave of mixed corporate earnings over the past week, particularly among major U.S. banks. The fourth-quarter earnings season continues in the days ahead, with Johnson & Johnson (NYSE: JNJ), Charles Schwab Corp (NYSE: SCHW), and Prologis Inc (NYSE: PLD) scheduled to report on Wednesday.
On Thursday, earnings are due from Procter & Gamble (NYSE: PG), GE Aerospace (NYSE: GE), Intel (NASDAQ: INTC), Abbott Laboratories (NYSE: ABT), and Intuitive Surgical (NASDAQ: ISRG). Elsewhere in Tuesday evening trading, United Airlines Holdings Inc (NASDAQ: UAL) jumped 5% after posting strong quarterly earnings and an upbeat outlook.
Wall Street rattled by Trump–Greenland dispute
Wall Street’s major indexes slumped sharply on Tuesday — the first trading day after a long weekend — as investors were unnerved by escalating geopolitical tensions tied to President Donald Trump’s aggressive push over Greenland and tariff threats against several European countries. The sell-off marked one of the market’s worst sessions in months, with the S&P 500, Dow Jones, and Nasdaq all posting significant declines amid heightened risk aversion.
Trump’s plan to pressure European allies with new tariffs in an effort to secure U.S. leverage over Greenland drew strong rejection from European leaders and amplified fears of broader trade conflict, prompting a flight from risk assets.
On the trading day, the S&P 500 dropped about 2.1%, the Nasdaq Composite slid nearly 2.4%, and the Dow Jones Industrial Average fell roughly 1.8%. Tech and broader market stocks led the weakness, underscoring how geopolitical uncertainty can quickly sour sentiment across sectors.
This is shaping up to be a highly unpredictable week for U.S. and global markets, with numerous wildcard risks—largely tied to developments from the White House.
Investors will be closely watching for any developments related to the Justice Department’s investigation into Federal Reserve Chair Jerome Powell. Attention will also turn to the Supreme Court on Wednesday, when it hears arguments concerning President Trump’s attempt to remove Fed Governor Lisa Cook.
Trade policy remains a major wildcard, with tariff headlines likely to emerge rapidly after Trump threatened over the weekend to impose a new 10% levy on imports from eight European countries opposing his push on Greenland. The Supreme Court could also rule this week on the legality of Trump’s tariffs. Meanwhile, fresh rhetoric around Iran, renewed intrigue involving Venezuela, or actions targeting other geopolitical flashpoints could further unsettle markets.
In Japan, the Bank of Japan is widely expected to keep interest rates unchanged on Friday. However, a weakening yen has revived speculation about possible intervention, leaving the future of the massive yen carry trade hanging in the balance. In China, fourth-quarter GDP growth slowed amid the ongoing property downturn, potentially prompting a policy response.
All of this sets the stage for a busy week in Davos, where global leaders and policymakers are gathering, with President Trump scheduled to address the forum.
In the United States, a slate of economic data will keep both investors and Federal Reserve officials engaged during the holiday-shortened week. A revision to third-quarter GDP could clarify whether the initially reported 4.3% growth overstated the economy’s strength or accurately reflected underlying momentum.
Below are the key data releases this week that are most likely to shape the FOMC’s outlook ahead of its January 27–28 policy meeting.
GDP Update: Growth Momentum in Focus
Overall data indicate the economy stayed resilient through the final three quarters of 2025. Despite a notable slowdown in employment growth, household demand exceeded expectations, while AI-related capital investment surged. Although a modest upward or downward revision to Q3 real GDP (Thursday) is possible, Q4 real GDP is currently tracking at a strong 5.3% annualized pace (see chart).
Personal income, consumption, and saving
Personal income data for October and November (Thu) may reinforce the view that real disposable income growth has stalled. This likely reflects demographic effects, as retiring Baby Boomers exit the labor force and no longer generate wage income. If consumer spending remains resilient, it would suggest households—particularly retirees—are increasingly drawing on retirement savings.
The personal saving rate (Thu) is likely to continue declining under our framework, particularly if household net worth keeps rising to record levels relative to disposable income (chart).
PCE inflation
The Bureau of Economic Analysis will calculate October PCE inflation (Thu) using the average of September and November CPI data. Meanwhile, the Cleveland Fed’s Inflation Nowcasting model projects headline and core PCE inflation at 2.65% y/y and 2.70% in November (chart).
Unemployment claims
Initial jobless claims (Thu) have declined in recent weeks, indicating that January’s unemployment rate likely edged lower from December’s 4.4% (chart).
Silver remains in a high-momentum price-discovery phase, holding above the Daily VCPMI mean in the upper $89–$90 area, signaling sustained bullish momentum across both short- and intermediate-term timeframes.
The current structure points to strong participation on corrective pullbacks, increasing the likelihood that dips remain brief as buyers continue to defend the Daily Buy 1 and Weekly VCPMI support zones between $85 and $87.
From a time-cycle standpoint, the dominant 30-, 60-, and 90-day harmonic cycles remain in alignment with the broader expansion phase that began in early Q4. The market is now entering a near-term inflection window projected for January 18–20, a period that historically aligns with volatility compression and subsequent directional resolution. Should price sustain closes above the Daily Sell 1 level, the probability outlook shifts toward trend continuation, with upside targets extending to the Weekly Sell 1 and Weekly Sell 2 zones.
Square of 9 price geometry identifies $93.75, $94.80, and $95.40 as key harmonic resistance levels—rotational nodes where trend acceleration or rejection is most likely to occur. A sustained acceptance above this zone would open the technical pathway toward the $98–$101 range, aligning with the upper Weekly Sell 2 projection and longer-term cycle expansion targets.
Conversely, failure to rotate higher through this resistance band would favor a mean-reversion move back toward the Daily VCPMI mean and the Weekly Buy 1 support zone near $81–$83.
From a structural perspective, silver’s resilience amid elevated volatility and margin pressure continues to validate a supported trend environment, with accumulation behavior dominating corrective phases. Rising open interest and consistent closes above the Weekly VCPMI further support the view that the broader market remains positioned for higher price discovery rather than distribution.
Looking ahead, the secondary momentum window from January 27–30 marks the next key timing convergence, where the interplay between Square of 9 resistance and cyclical factors could drive either a decisive breakout or a rotational pullback.
Traders applying the VC PMI framework should maintain discipline, executing systematically at predefined probability levels while separating emotional bias from structured risk and money management.