HSBC Asset Management said gold and silver posted dramatic price swings in 2025, fueled by geopolitical risks and worries about the Federal Reserve’s independence, before evolving into a retail-driven speculative phase. Analysts caution that leveraged selling could increase their correlation with equities, but note that central bank de-dollarisation efforts and crisis-related demand continue to support the long-term structural case for precious metals.
Safe-haven demand weighed against speculative flows
“This year’s moves in gold and silver have been extraordinary. Sparked by geopolitical tensions and concerns over the Federal Reserve’s independence, the 2025 rally morphed into a retail-driven speculative surge, making a correction increasingly probable.
So where does that leave investors who rely on gold as a portfolio diversifier? Although retail inflows lifted returns, they also brought equity-like volatility — at odds with gold’s traditional safe-haven role.
That said, recent turbulence shows that no safe haven is perfect, reinforcing the case for ‘diversifying the diversifiers’: taking an active, multi-asset approach to seek uncorrelated returns across a wide range of assets.”
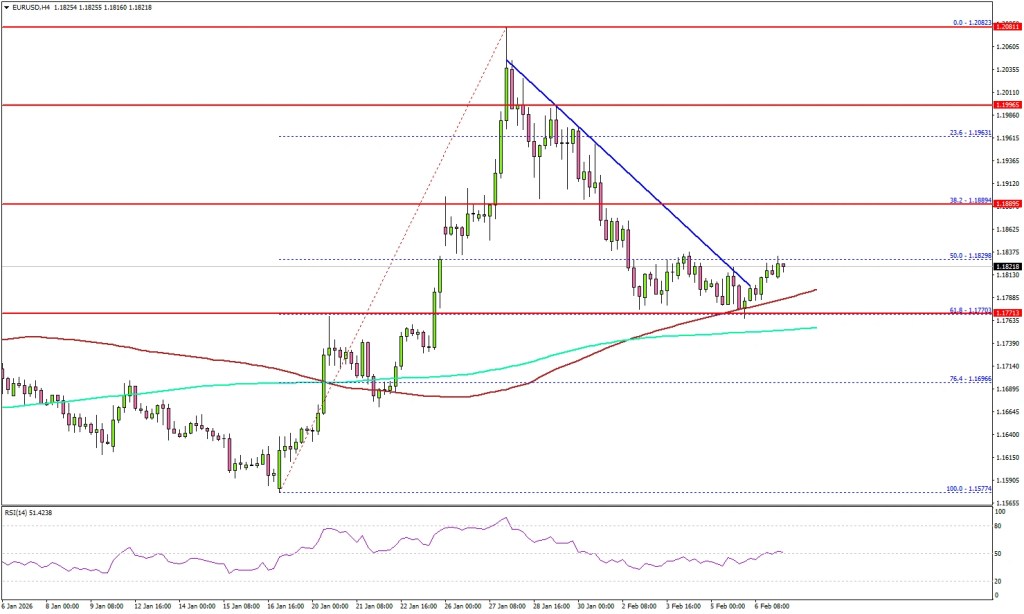
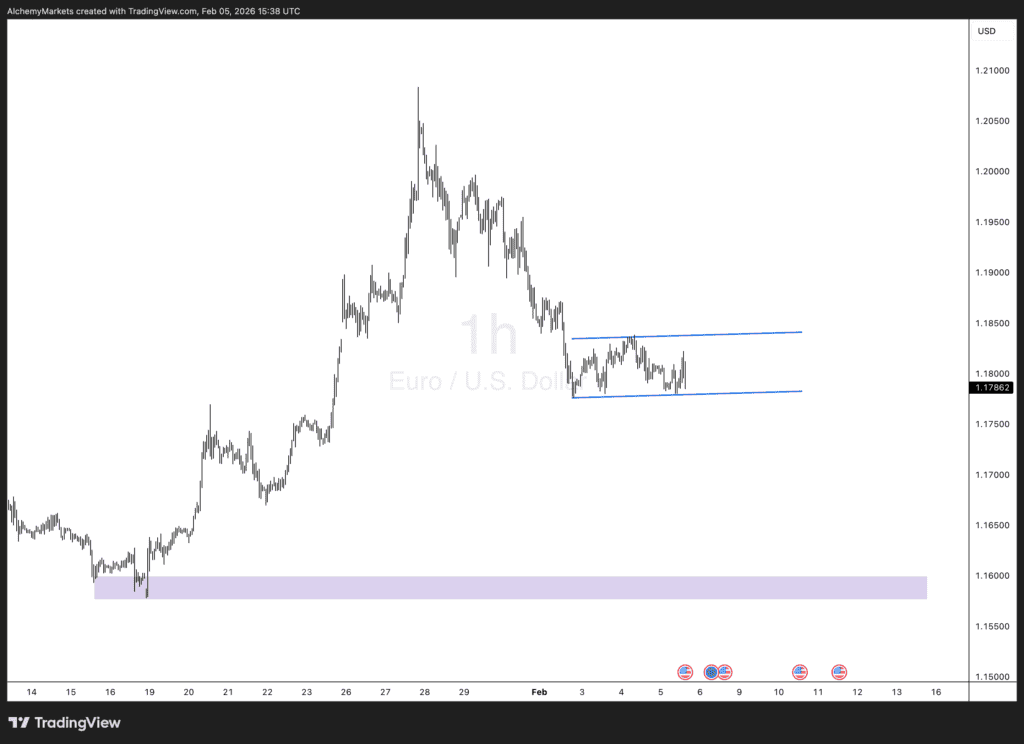
EUR/USD slipped below 1.1900 and tested support near 1.1780.
The pair broke above a key bearish trend line, previously acting as resistance around 1.1810 on the 4-hour chart.
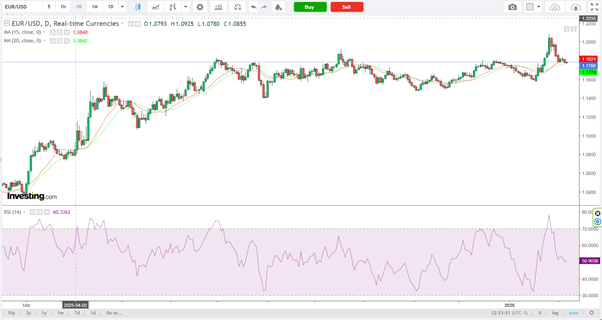
EUR/USD technical analysis
On the 4-hour chart, EUR/USD tested the 61.8% Fibonacci retracement of the advance from the 1.1577 swing low to the 1.2082 peak. The pair has held above both the 100-period (red) and 200-period (green) simple moving averages, signaling underlying support.
The pair is stabilizing above 1.1780 and has recently cleared the bearish trend line near 1.1810. On the upside, initial resistance is seen around 1.1850, followed by 1.1890. A sustained close above 1.1890 could pave the way for further gains toward 1.1920, with a potential extension toward the 1.2000 handle.
On the downside, immediate support remains at 1.1780. A deeper pullback could test the 1.1720 area, while the key support level lies at 1.1700. A break below this zone would likely shift momentum in favor of the bears and could expose the 1.1650 region.
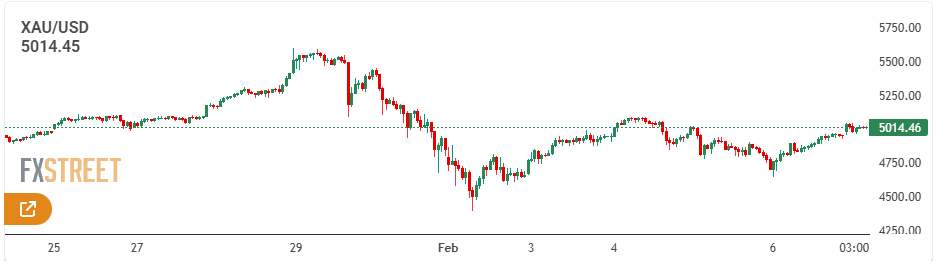
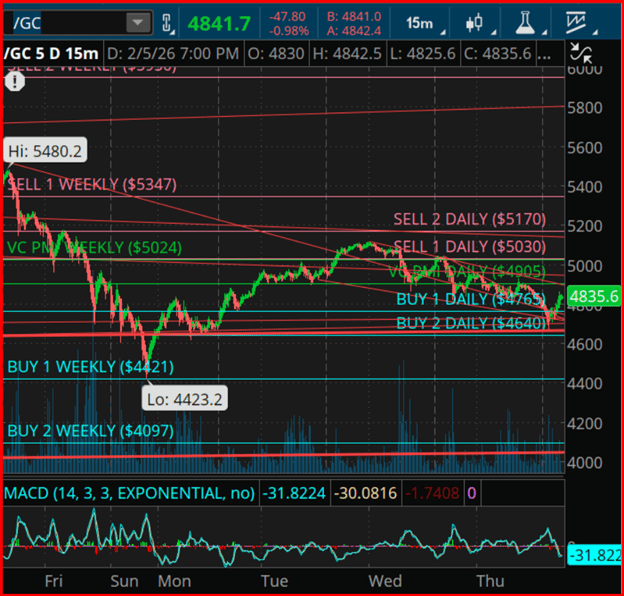
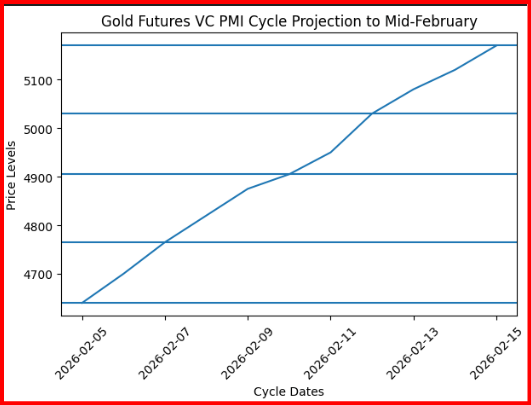
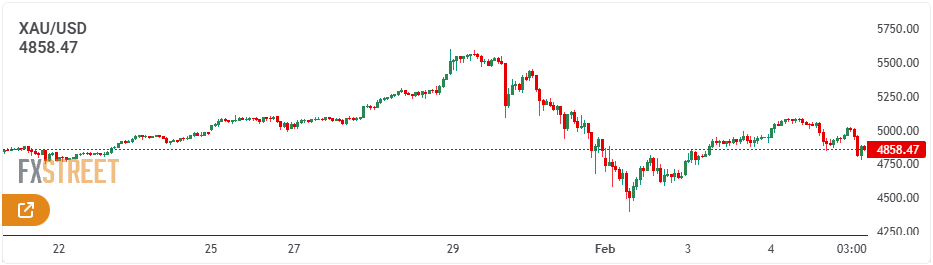
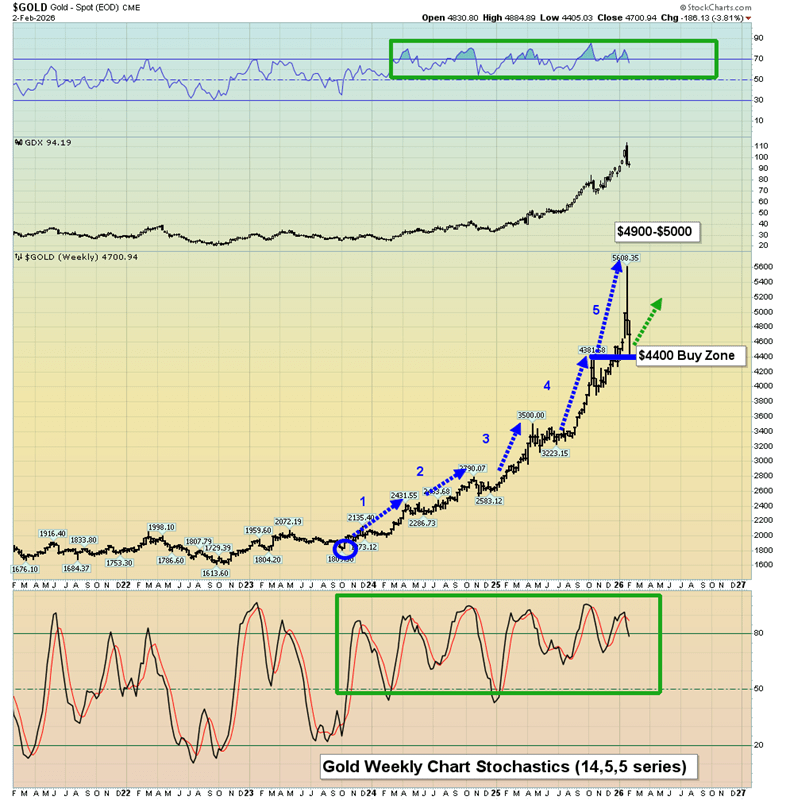
Gold is consolidating recent gains around the $5,000 level, with buyers gradually building momentum for a potential sustained uptrend as a pivotal week gets underway. Market attention is firmly on the delayed U.S. Nonfarm Payrolls report due Wednesday and the Consumer Price Index data scheduled for release on Friday.
Fundamental Analysis
As the new, data-heavy week begins, dovish sentiment surrounding the U.S. Federal Reserve is setting the tone, with renewed reflation trades helping gold extend Friday’s strong rebound from the $4,650 area.
After last week’s weak U.S. labor data, markets have continued to price in the first Fed interest-rate cut as early as June, even as investors remain divided over the likely policy stance of Fed chair nominee Kevin Warsh.
Risk appetite has also been supported by a resurgence in reflationary trades, sparked by Japan’s ruling Liberal Democratic Party securing a decisive majority in snap elections. The outcome has reinforced expectations of debt-funded fiscal stimulus, further underpinning the broader reflation theme.
Adding to gold’s support, the U.S. dollar has softened amid renewed weakness in USD/JPY following strong verbal intervention from Japanese authorities. The resulting dollar pressure has helped keep the precious metal buoyant.
That said, gold’s recovery momentum appears somewhat constrained as overall risk sentiment remains upbeat on expectations of expansionary fiscal policies in Japan. Japanese equity markets have surged to record highs, lifting broader Asian stocks and reducing demand for traditional safe havens.
Looking ahead, it remains uncertain whether gold can sustain its rebound, as traders may grow more cautious and adjust positions ahead of Wednesday’s closely watched U.S. January jobs report.
XAU/USD Technical Overview
On the daily chart, XAU/USD is trading around $5,023.88, with the technical structure firmly tilted to the upside. The 21-day Simple Moving Average (SMA) has crossed above the 50-, 100-, and 200-day SMAs, and all are sloping higher, highlighting a strong and well-established bullish trend. Prices remain comfortably above these moving averages, keeping buyers in control.
Momentum indicators also support the constructive outlook. The Relative Strength Index (RSI) is at 57.72, holding above the neutral 50 level and well below overbought territory, suggesting steady positive momentum without signs of exhaustion. Immediate dynamic support is provided by the rising 21-day SMA at $4,873.06.
This bullish alignment implies that any pullbacks are likely to be limited as long as prices stay above the faster moving average. A daily close below the 21-day SMA would signal a deeper corrective move, potentially exposing the 50-day SMA near $4,563.97. For now, the continued rise in medium- and long-term SMAs favors a buy-on-dips approach and keeps the broader trend firmly pointed higher.
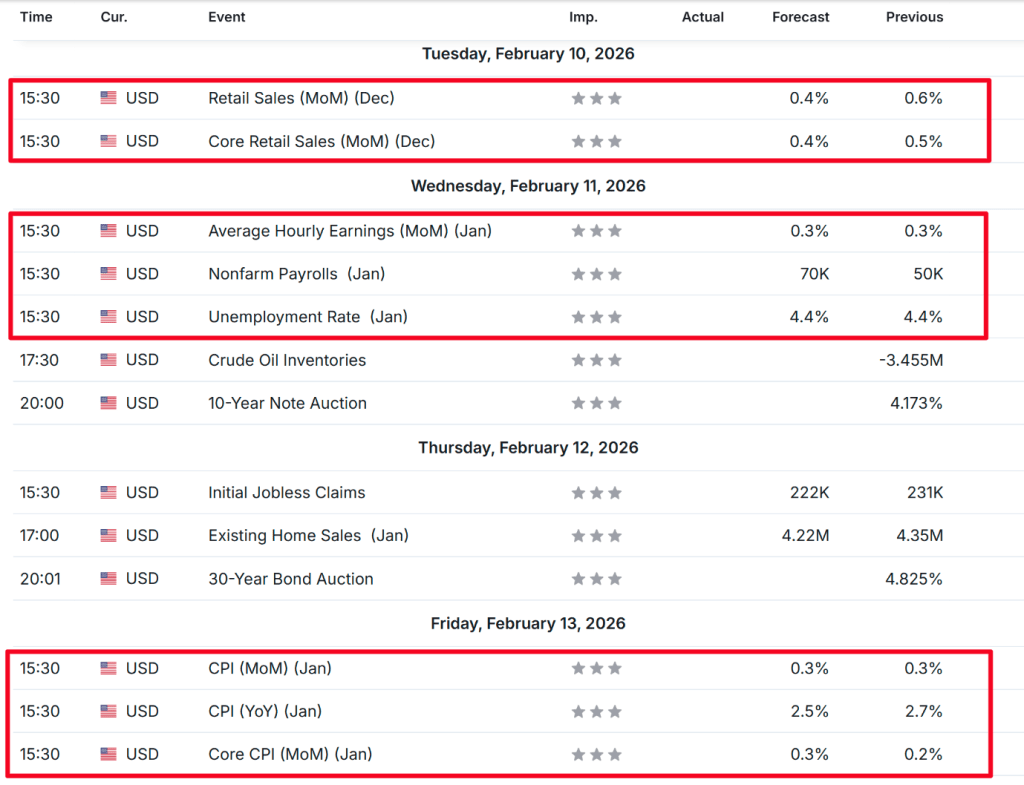
Key U.S. economic data—including the jobs report, CPI inflation, retail sales—and another round of corporate earnings will be in focus this week.
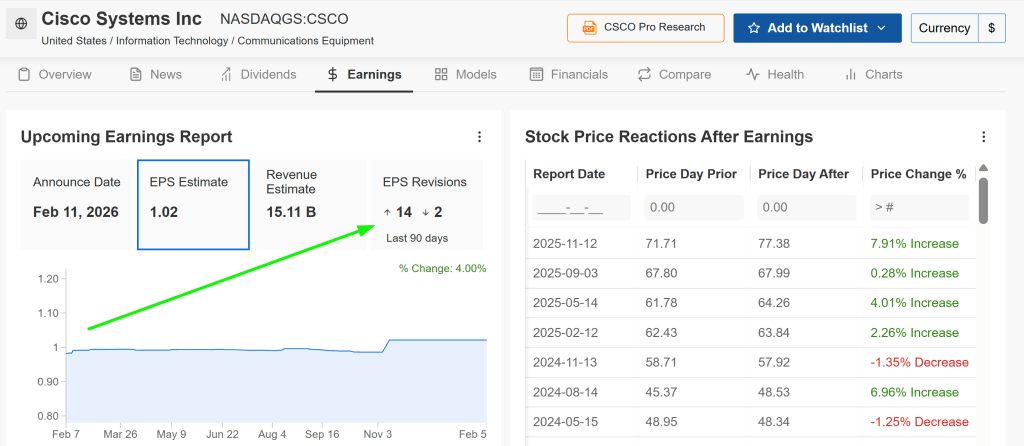
Cisco is expected to post strong earnings along with upbeat guidance, positioning the stock as a high-conviction potential outperformer in the near term.
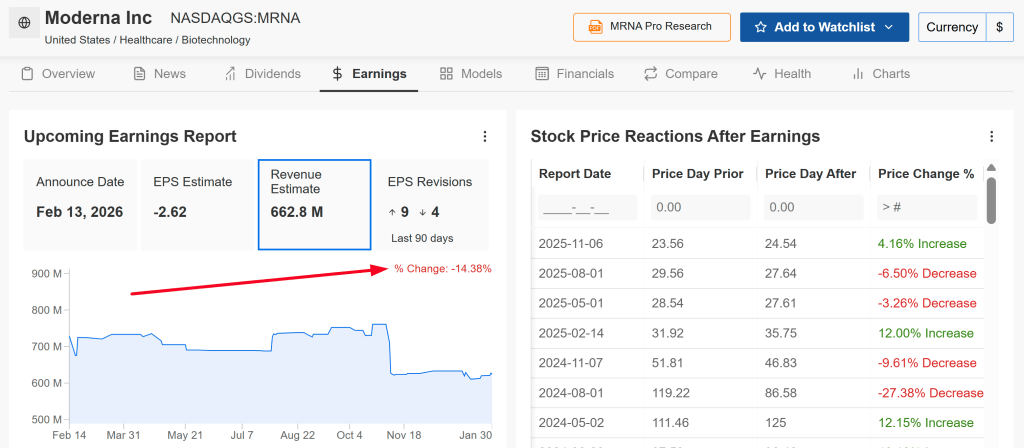
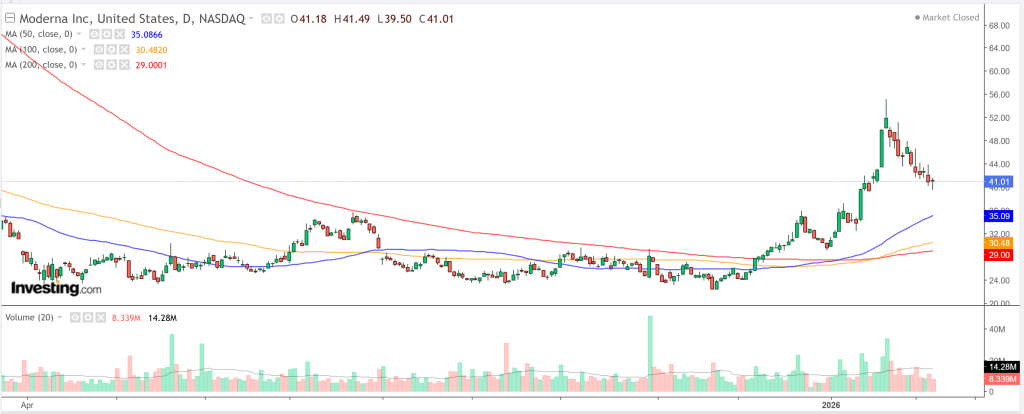
By contrast, Moderna faces pressure from declining revenue and anticipated losses, leaving the stock vulnerable to downside risk this week.
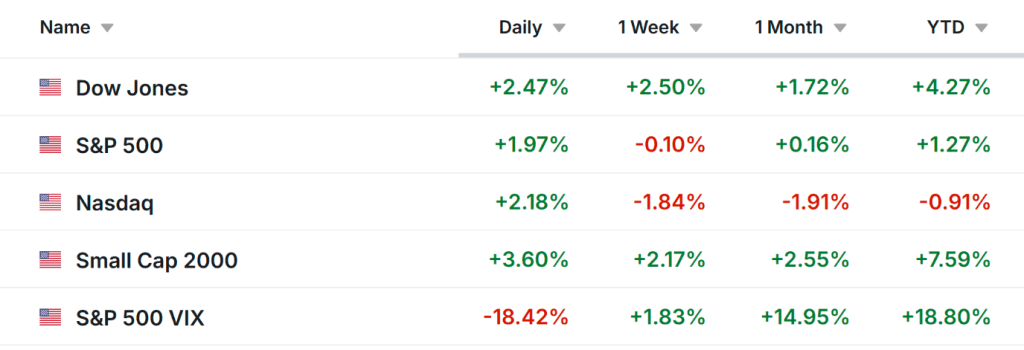
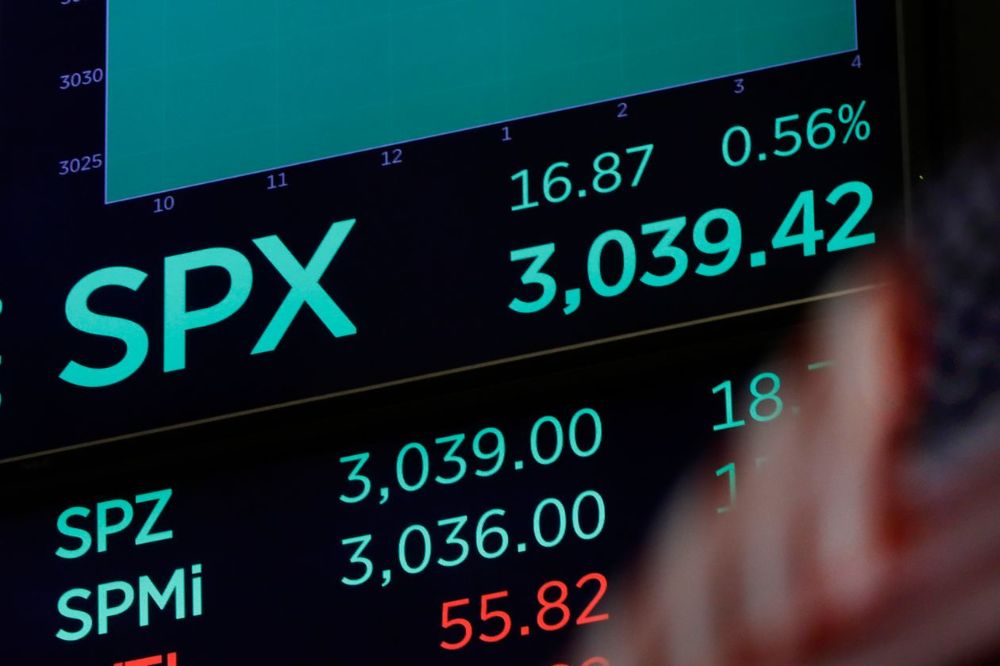
Wall Street stocks surged on Friday, posting their strongest gains in months as the Dow Jones Industrial Average finished above the landmark 50,000 level for the first time.
The rally came after three consecutive sessions of declines driven by artificial intelligence-related concerns, with software stocks particularly pressured on fears that AI could intensify competition across the sector.
For the week, the benchmark S&P 500 and the tech-heavy Nasdaq Composite edged lower by 0.1% and 1.8%, respectively, while the 30-stock Dow Jones Industrial Average gained 2.5% and the small-cap Russell 2000 advanced 1.8%.
Volatility may remain elevated in the days ahead as investors weigh the outlook for economic growth, inflation, interest rates, and corporate earnings.
On the economic front, delayed December retail sales data is set for release on Tuesday. However, Wednesday’s postponed January U.S. jobs report could prove more influential amid mounting concerns over labor-market conditions. January CPI inflation data due on Friday will also be closely watched for further evidence on whether price pressures are truly easing.
Earnings season also rolls on, with a busy slate of high-profile results due in the coming days. Notable reports include Coca-Cola, McDonald’s, Ford, Cisco, Robinhood, Coinbase, and Arista Networks, alongside key software names such as AppLovin, Shopify, and Datadog.
Regardless of broader market direction, below I highlight one stock that is likely to attract buying interest and another that could face renewed downside pressure. Note that this view is strictly short term, covering the week ahead from Monday, February 9 through Friday, February 13.
Stock To Buy: Cisco
Cisco’s upcoming earnings report is the key catalyst for the stock this week, with the risk–reward profile appearing skewed to the upside. CSCO is set to report fiscal second-quarter results after the market closes on Wednesday at 4:05 p.m. ET.
Market expectations remain relatively modest, suggesting that even a small beat on revenue and earnings per share, coupled with steady or slightly optimistic guidance, could be enough to spark a post-earnings rally.
Analyst sentiment has been notably constructive heading into the release. According to InvestingPro data, 14 of the last 16 EPS revisions have been upward, underscoring growing confidence in Cisco’s ongoing expansion.
As a leading player in networking hardware, cybersecurity, and an increasingly important provider of AI infrastructure, Cisco is well positioned to capitalize on multiple tailwinds that could support a strong quarterly performance despite a mixed macroeconomic backdrop.
Consensus forecasts call for adjusted earnings per share of $1.02, representing a 9% increase from a year earlier. Revenue is expected to rise 8% year over year to $15.1 billion, supported by AI-driven demand and solid product sales.
Analysts see potential for longer-term upside from Cisco’s partnership with Nvidia to develop AI networking solutions for the enterprise market. Meanwhile, Cisco’s security segment underperformed in fiscal first quarter results despite the acquisition of Splunk, and investors will be watching closely for signs of a rebound in that business.
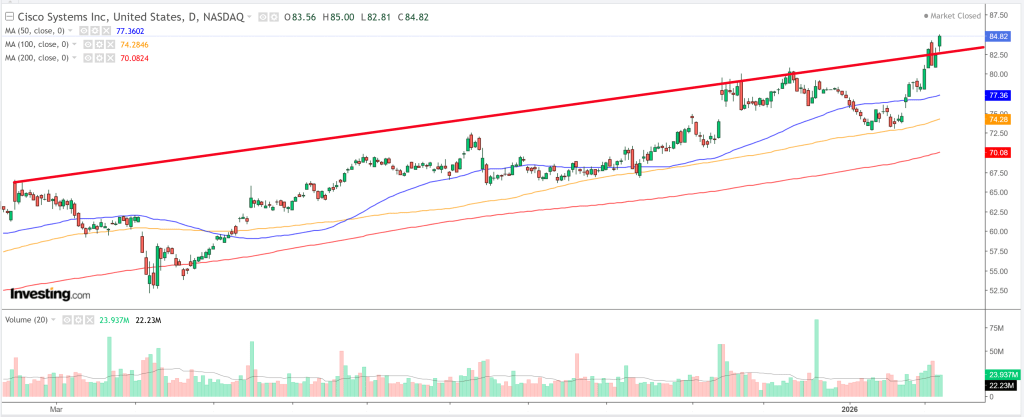
Cisco’s shares have been on a strong run, notching a string of fresh 52-week highs in recent sessions. The stock closed at $84.82 on Friday, underscoring solid momentum heading into the earnings release.
Valuation and sentiment also remain supportive. Cisco continues to trade at a reasonable earnings multiple relative to both the broader technology sector and its own historical averages, while offering an appealing dividend yield underpinned by robust free cash flow.
Trade setup:
Entry: Near current levels (~$84–85)
Target: $90–$95 (potential upside of ~5.8%–10.8%)
Stop-loss: $80 (downside risk of ~5.8%)
Stock To Sell: Moderna
Moderna, meanwhile, faces a tougher setup this week as it heads into its fourth-quarter earnings release scheduled for before Friday’s opening bell at 6:35 a.m. ET. Options markets are pricing in a sharp post-earnings swing of around ±16%, underscoring the heightened risk of a downside surprise.
After its blockbuster pandemic-era success with the mRNA COVID-19 vaccine, the biotech company has struggled with the transition from reliance on a single product to a broader—yet still largely unproven—development pipeline.
Analyst sentiment has turned increasingly cautious ahead of the report, with consensus sales estimates cut by roughly 14%, reflecting growing concerns over Moderna’s near-term revenue outlook.
Consensus expectations point to a sizable loss, with earnings per share projected at around –$2.62 on revenue of $662.8 million, representing a steep year-over-year decline of more than 30% from sales of $966 million.
Moderna is grappling with slowing revenue growth and a lack of near-term catalysts to counter weakening demand, as vaccine sales continue to fade.
At the same time, the company must maintain elevated spending on research, development, and manufacturing to advance a broad pipeline spanning respiratory viruses, oncology, and other therapeutic areas. This combination is weighing on near-term profitability and increasing pressure on cash burn.
Moderna’s share price has started to lose momentum after a strong recent rally, ending Friday at $41.01. While the stock remains up 67.1% over the past three months and 21.1% in the last month, last week’s 7% decline points to waning upside traction.
In a market increasingly favoring growth and AI-linked themes, high-beta biotech stocks like Moderna are vulnerable to rotation, particularly if earnings fall short or forward guidance disappoints.
Trade setup:
Entry: Near current levels (~$40–41)
Target: $35 (potential gain of ~15%)
Stop-loss: $45 (risk of ~12.5%)
Whether you’re a newer investor or an experienced trader, tools like InvestingPro can help uncover opportunities while managing risk in a challenging and fast-moving market environment.
The Japanese yen slid to a fresh two-week low as Sanae Takaichi’s landslide victory reignited concerns over Japan’s fiscal outlook. However, warnings of possible currency intervention sparked some intraday short covering in the yen, aided by broader U.S. dollar weakness.
Still, downside momentum in the yen was partly limited after data showed a decline in Japan’s real wages, which reduced expectations for an immediate interest rate hike by the Bank of Japan and helped cap further moves in the currency.
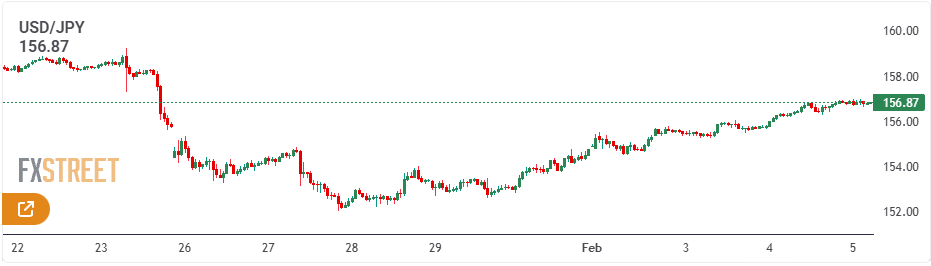
The Japanese yen began the new week on a softer footing after Prime Minister Sanae Takaichi’s landslide victory in Sunday’s election raised expectations of additional fiscal stimulus. That initial weakness proved short-lived, however, as Finance Minister Satsuki Katayama reiterated warnings over excessive currency moves and confirmed close coordination with the United States to counter disorderly FX fluctuations. Combined with continued U.S. dollar selling, the comments prompted an intraday reversal of nearly 150 pips in USD/JPY from the Asian session peak near 157.65.
Meanwhile, data released earlier showed Japan’s real wages fell in December for a 12th straight month, with nominal pay growth slightly lagging cooling consumer inflation. This reinforces expectations that the Bank of Japan will proceed cautiously after lifting interest rates to a three-decade high in December. In addition, a more upbeat risk environment, supported by signs of easing tensions in the Middle East, limited further safe-haven demand for the yen, allowing USD/JPY to find support and stall its pullback around the 156.20 area.
Yen bulls stay cautious as fiscal concerns and delayed BoJ hike bets offset intervention talk
Japan’s ruling Liberal Democratic Party, led by Prime Minister Sanae Takaichi, secured a decisive victory in Sunday’s election, comfortably surpassing the 233-seat threshold needed for a lower-house majority. The result clears the path for proposed tax cuts and increased defense spending, bringing renewed attention to Japan’s already stretched public finances.
Finance Minister Satsuki Katayama said on Monday that she stands ready to communicate with markets if necessary to help stabilize the yen. She reiterated that Japan remains in close coordination with U.S. Treasury Secretary Scott Bessent and emphasized Tokyo’s right to intervene if currency moves stray from economic fundamentals.
Meanwhile, data from the labor ministry showed nominal wages rose 2.4% year-on-year in December 2025, accelerating from a revised 1.7% gain previously but still missing market expectations. Adjusted for inflation, real wages fell 0.1% from a year earlier, extending their decline to a 12th consecutive month.
The figures have dampened expectations for an imminent Bank of Japan rate hike, as policymakers have stressed that further tightening hinges on sustained and broad-based wage growth. Together with a generally positive global equity backdrop, this has limited the yen’s rebound from a more than two-week low.
Risk sentiment was further supported by indirect U.S.–Iran talks on Tehran’s nuclear program, which concluded on Friday with agreement to keep diplomatic channels open. The development eased fears of a military escalation in the Middle East and encouraged demand for risk assets at the start of the week, despite new U.S. sanctions on Iran.
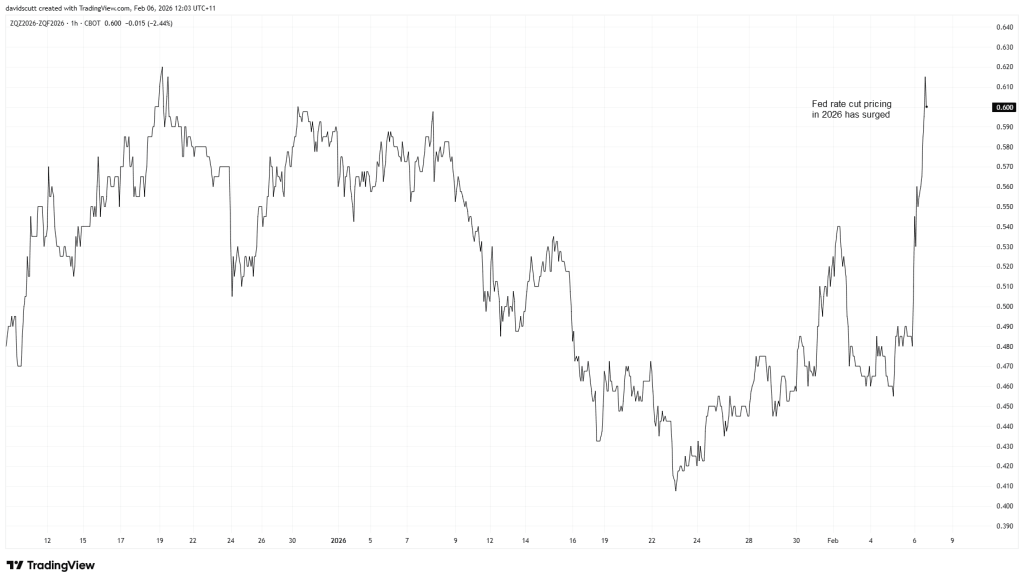
The U.S. dollar weakened for a second straight session amid growing bets that the Federal Reserve could cut interest rates twice more in 2026. This contrasts with expectations that the BoJ will continue its gradual policy normalization, helping to cap gains in USD/JPY and urging caution among bullish traders.
Attention now turns to key U.S. data later this week, including the closely watched nonfarm payrolls report due Wednesday and consumer inflation figures on Friday, both of which are likely to shape dollar direction and drive fresh moves in USD/JPY.
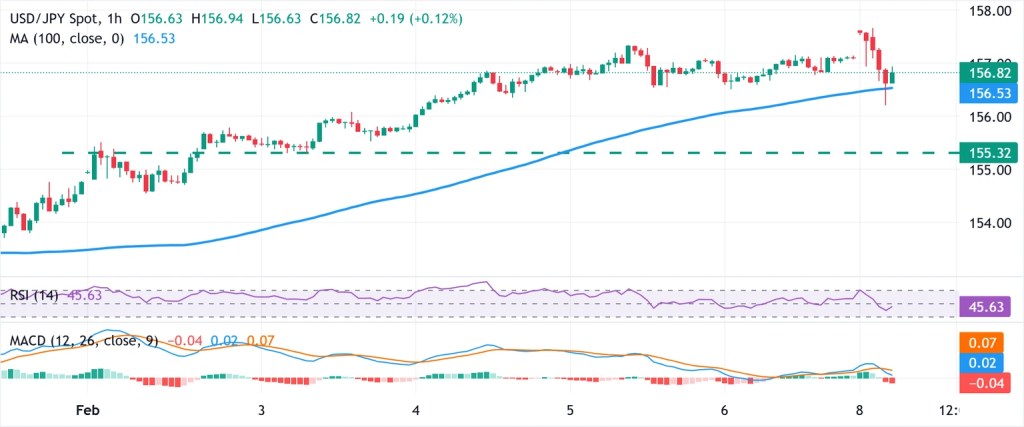
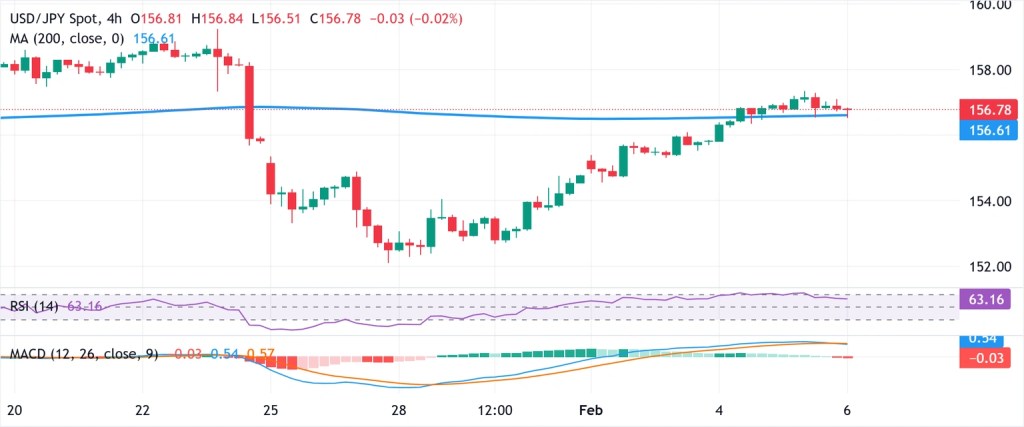
USD/JPY holds steady below 100-hour SMA as technical signals remain mixed
The USD/JPY pair is showing modest resilience around the 100-hour Simple Moving Average (SMA), with its intraday pullback stalling near the 156.20 area, which now stands out as a key pivot for short-term traders. Momentum indicators, however, paint a mixed picture. The Moving Average Convergence Divergence (MACD) has formed a bearish crossover near the zero line, signaling rising downside pressure, while the Relative Strength Index (RSI) is hovering around 46, below the neutral 50 level, pointing to subdued momentum.
At the same time, USD/JPY remains above the 100-hour SMA, currently located around the 156.55–156.50 zone, which preserves a mildly constructive near-term bias and provides dynamic support. A move by the MACD back into positive territory alongside an RSI break above 50 would strengthen the bullish case and open the door to further gains. On the other hand, a clear break and close below the 100-hour SMA would undermine the setup and increase the risk of a deeper corrective move.
U.S. stock futures ticked higher on Sunday evening after Wall Street mounted a strong rebound late last week, even as investors remained cautious ahead of delayed U.S. employment and inflation data scheduled for release in the coming days.
S&P 500 futures rose 0.4% to 6,978.75 points, while Nasdaq 100 futures advanced 0.6% to 25,319.0 points by 19:12 ET (00:12 GMT). Dow Jones futures were up 0.2% at 50,327.0 points.
Wall Street bounced back late last week as AI disruption fears eased
Wall Street’s major indexes surged on Friday after several days of losses, as investors stepped in to scoop up beaten-down technology stocks and found reassurance in easing bond yields.
The S&P 500 advanced 2%, while the Nasdaq Composite climbed 2.2%. The Dow Jones Industrial Average rose 2.5%, notching its first close above the 50,000-point mark.
Gains were led by chipmakers and AI-linked stocks, which had faced intense selling pressure amid concerns over technology disruption and lofty valuations.
Earlier in the week, the technology sector had suffered sharp declines as investors rotated away from high-growth names, worried that rapid advances in artificial intelligence could upend software business models and squeeze profit margins.
For the week as a whole, the Dow gained roughly 2.5%, supported by strength in industrial and financial stocks. The S&P 500 slipped 0.1%, while the Nasdaq fell about 2%, underscoring the sector’s pronounced weakness.
Jobs, inflation data in focus with major earnings ahead
Market attention is shifting toward key U.S. economic data releases that were postponed due to the partial government shutdown.
The closely watched January employment report, originally due last week, is now scheduled for release on Wednesday. A private-sector jobs report published last week showed weaker-than-expected hiring, sparking concerns that labor market momentum may be starting to cool after months of strength.
Focus will then turn to January consumer price index data, set for release on Friday following the shutdown-related delay. The inflation report will be closely examined for indications that price pressures are easing enough to give the Federal Reserve scope to consider interest rate cuts later this year.
Corporate earnings may also influence markets in the days ahead, with companies such as Coca-Cola Co (NYSE:KO) and Ford Motor Company (NYSE:F) among the notable firms due to report quarterly results this week.
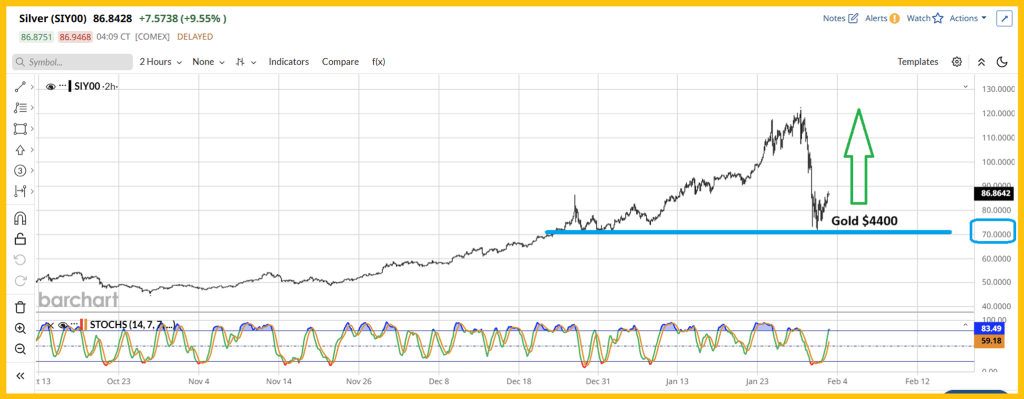
Gold prices climbed in Asian trading on Monday, with silver also advancing after precious metal markets experienced sharp volatility last week amid weaker safe-haven demand, profit-taking, and heightened uncertainty over U.S. monetary policy.
This week’s focus is on a series of key U.S. economic releases—most notably nonfarm payrolls and consumer price index inflation data—which are expected to offer fresh signals on the outlook for the world’s largest economy. Demand for haven assets eased as the United States and Iran showed signs of progress in weekend talks, with both sides agreeing to continue negotiations over Tehran’s nuclear program.
Spot gold rose 0.7% to $4,996.47 an ounce by 20:49 ET (01:49 GMT), after briefly touching an intraday high of $5,046.79. April gold futures gained 0.8% to $5,016.21 an ounce.
Spot silver jumped 3.3% to $80.5330 an ounce, extending its rebound from lows near $60 an ounce seen last week. Platinum underperformed, slipping 2.3% to $2,068.45 an ounce.
Precious metals saw sharp swings last week as investors weighed the outlook for U.S. monetary policy under President Donald Trump’s nominee for Federal Reserve chair, Kevin Warsh. His nomination boosted the dollar, triggering broad selling across metal markets as traders also took profits after strong recent gains in gold and silver.
So far in 2026, gold and silver remain up about 15% and 5%, respectively, despite both metals retreating sharply from record highs reached in early February.
Oil prices slipped in Asian trading on Monday as the United States and Iran indicated they would continue negotiations over Tehran’s nuclear program, easing concerns about heightened tensions in the Middle East.
Crude prices were also weighed down by a firmer U.S. dollar ahead of a busy week of key U.S. economic data, extending losses after a roughly 2% decline last week. Investors are additionally awaiting major economic releases from China, the world’s largest oil importer.
Brent crude futures for April dropped 0.7% to $67.57 a barrel by 21:17 ET (02:17 GMT), while West Texas Intermediate futures also fell 0.7% to $63.12 a barrel.
U.S. and Iran agree to press ahead with nuclear negotiations
Washington and Tehran said over the weekend that indirect nuclear negotiations will continue following what both sides described as constructive talks in Oman on Friday.
The statements helped ease fears of an imminent military confrontation in the Middle East, particularly after the United States had earlier deployed several warships to the region.
Concerns over a potential conflict had previously pushed traders to build a higher risk premium into oil prices, with former President Donald Trump also issuing threats of military action against Iran.
However, the likelihood of a full-scale war in the region now appears reduced, even as Tehran indicated it will continue advancing its nuclear enrichment activities.
Markets await key U.S. and China economic data
Attention this week is also on a slate of major economic data from the world’s largest oil-consuming economies.
In the United States, January nonfarm payrolls figures are due on Wednesday, followed by CPI inflation data on Friday. These releases will be closely scrutinized for further signals on the interest-rate outlook, as markets continue to assess the direction of monetary policy under Warsh.
In China, January CPI data is also scheduled for release on Friday, providing fresh insight into conditions in the world’s biggest oil importer.
The data arrives just ahead of China’s week-long Lunar New Year holiday, which is expected to boost fuel demand across the country.
Most Asian markets climbed sharply on Monday, tracking Wall Street’s tech-led rebound, while Japanese shares jumped to record highs after Prime Minister Sanae Takaichi’s coalition won a decisive lower-house victory. Risk sentiment improved across the region following Friday’s strong U.S. rebound from AI-driven losses, with U.S. stock futures also edging higher in Asian trade.
Nikkei tops 57,000 following Takaichi’s election victory
Japan’s Nikkei 225 jumped as much as 5.6% to a new record of 57,337.07, supported by improved political certainty after Prime Minister Sanae Takaichi’s coalition won a commanding majority in Sunday’s lower-house election. The broader TOPIX index also surged 3.4% to an all-time high of 3,825.67.
Analysts said the decisive victory gives Takaichi greater latitude to push through policy initiatives, with markets anticipating higher public spending, tax incentives, and measures to lift wages and corporate investment, alongside continued backing for key sectors such as technology, defense, and energy. While the outcome is seen as positive for Japanese equities, it is expected to pressure government bonds and the yen.
Asian tech stocks jump, with South Korea’s KOSPI surging nearly 5%
Asian tech stocks rallied at the start of the week, supported by gains in U.S. chipmakers and AI-linked shares. South Korea’s KOSPI surged nearly 5%, rebounding from sharp losses, as Samsung Electronics jumped more than 5% on reports it will begin mass production of HBM4 chips later this month, while SK Hynix also climbed over 5%.
Elsewhere, Hong Kong’s Hang Seng rose 2% with the tech subindex up 1.5%, while China’s CSI 300 and Shanghai Composite gained 1.3% each. Australia’s ASX 200 advanced 2%, Singapore’s STI added 1%, and India’s Nifty 50 futures edged higher. Despite the rebound, investors remain cautious amid recent volatility in tech stocks and ahead of key U.S. jobs and inflation data due later this week.
Most Asian currencies traded in narrow ranges on Monday, while the yen edged higher after Japan’s finance ministry stepped up intervention warnings. However, the yen remained under pressure from concerns over heavy fiscal spending, which are expected to persist following Prime Minister Sanae Takaichi’s landslide election win. Elsewhere, Asian currencies stayed subdued after recent dollar strength, with markets now focused on key economic data due from the U.S. and China.
Yen buoyed by intervention warnings following Takaichi’s victory
The USD/JPY slipped 0.2% to 156.87 on Monday after earlier dropping as much as 0.5%, with the yen finding modest support from renewed intervention warnings by Japanese officials. While the currency remained broadly weak against the dollar, comments from Finance Minister Satsuki Katayama about close coordination with U.S. Treasury officials lent temporary relief.
However, the yen continues to face pressure following Prime Minister Sanae Takaichi’s decisive election victory, which gives her coalition a supermajority in the lower house and a clearer path to expansionary fiscal plans. Concerns over stretched government spending have weighed heavily on the yen and previously triggered a sharp sell-off in Japanese government bonds. Analysts at OCBC noted that while a looser fiscal stance could further pressure the yen, the risk of official pushback is likely to rise as USD/JPY nears the 160 level.
Dollar rebound eases as Asian FX trades quietly
The dollar eased slightly in Asian trade, extending its pullback from last week’s near-98 highs, as traders stayed cautious ahead of key U.S. data, including nonfarm payrolls on Wednesday and CPI inflation on Friday. The releases are expected to shape expectations for U.S. interest rates under potential Fed leadership changes.
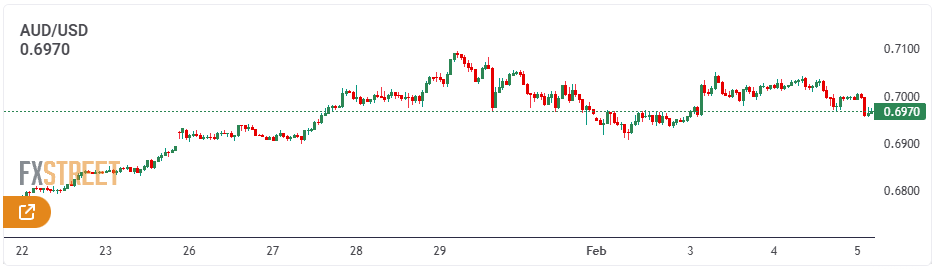
Asian currencies were mostly rangebound. The Chinese yuan edged up, with USD/CNY down 0.1% and hovering near mid-2023 lows, supported by firm PBOC fixings ahead of Friday’s CPI data and the Lunar New Year. The Australian dollar rose 0.2% above $0.70 on bets of further RBA rate hikes after a hawkish move last week.
Elsewhere, the Singapore dollar was flat, the Korean won weakened slightly, and the Indian rupee stayed above 90 per dollar following the RBI’s steady policy stance and upgraded forecasts.
Google plans to increase capital expenditures to as much as $185 billion this year, significantly exceeding market expectations of around $120 billion. Robust growth in search advertising and Google Cloud has provided Alphabet with the financial flexibility to pursue this aggressive investment strategy. According to Morgan Stanley analysts, the sharp rise in spending signals that AI is driving higher engagement and improved monetisation across Google’s core businesses, with search revenue climbing 17% and cloud revenue surging 48% in the most recent quarter.
Meta conveyed a similar message after projecting annual capital expenditures of $135 billion, supported by evidence that AI is enhancing advertising effectiveness. However, not all technology giants have been able to convince investors that rising capital spending is justified. Microsoft, for example, saw its shares fall sharply—erasing more than $350 billion in market value—after its cloud performance disappointed, even as its own capital investment ramped up.
Amazon is also under pressure to sustain strong growth at AWS while continuing to expand data-center capacity. In contrast, Alphabet’s sharply rising cloud backlog highlights growing demand for AI infrastructure and tools, lending credibility to its aggressive spending plans.
The trade-off, however, is immediate. Morgan Stanley estimates that Alphabet’s free cash flow per share could decline by 58% in 2026 and by as much as 80% in 2027 as higher capital expenditures flow through the business. In effect, the company is sacrificing near-term cash returns in exchange for longer-term strategic positioning.
Alphabet now stands at a crossroads. Strong advertising and cloud growth point to early benefits from AI investments, but the sheer scale of spending increases execution risk. If the added capacity delivers sustained revenue growth, the strategy will appear well-timed. If growth slows, Alphabet could face a thinner cash buffer and heightened expectations. For now, the company is betting that leading with investment is essential to staying ahead—and the market will be watching closely to see whether returns keep pace.
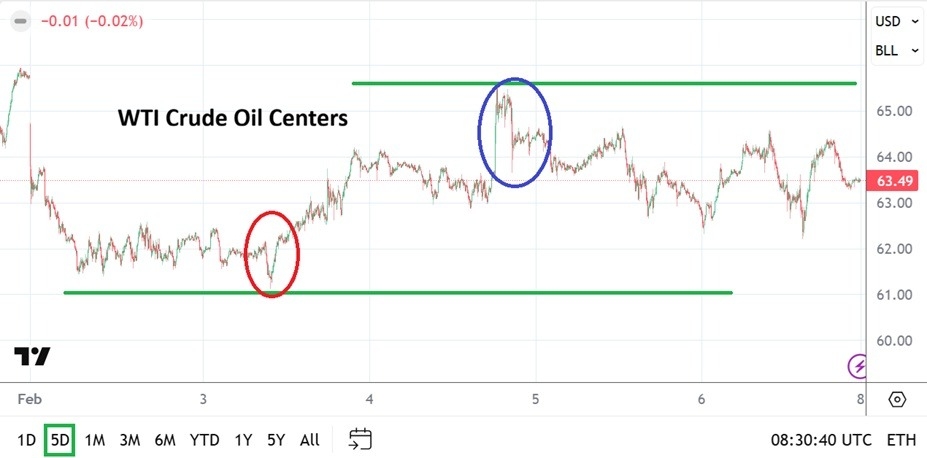
After closing the prior week comfortably above the 65.000 level, WTI Crude Oil began this past Monday with a sharp selloff, dropping to nearly 63.300. From there, price action largely revolved around that area throughout the week, with technical levels guiding the back-and-forth movement.
Heading into the weekend, WTI is trading near 63.490 and is likely to open with early momentum when markets reopen on Monday. Overall, crude appears to have formed a central pricing zone, reflecting a higher equilibrium that remains reluctant to drift too far from lower levels. Resistance seems to be forming near 65.500, while the 61.000 area is acting as a key support floor—though, of course, there is no guarantee prices will remain confined within this range.
Short-Term Outlook and Retrospective Analysis
While some market participants attribute higher WTI crude prices to geopolitical concerns in the Middle East—particularly surrounding Iran and the buildup of U.S. military forces in the region—another factor may be the recent stretch of record cold temperatures across the United States. Notably, WTI crude had been trading with support near the 59.000 level up until January 22.
The challenge with any of these explanations is the possibility that WTI crude is simply trading higher due to speculative forces, even though broader factors are clearly influencing market sentiment. The combined impact of geopolitical tensions involving Iran and unusually cold weather in the U.S. may be shaping positioning decisions among large market participants. At the same time, WTI has returned to a price range that was already tested back in August 2025, underscoring that this valuation zone is not unfamiliar territory for the commodity.
Support and Resistance Levels in Focus This Week
Broader financial markets continue to display signs of unease, with many large traders and institutions positioning defensively and expressing limited confidence in signals coming from other asset classes.
By contrast, WTI crude oil has continued to grind along within a familiar and well-defined range, potentially creating opportunities for speculative positioning. The opening price action on Monday will be worth watching, especially given that the prior week began with a sharp selloff at the open. A repeat of that move appears less likely this time, as market anxiety seems to have eased somewhat compared with last week. If WTI opens in a more orderly fashion, it could present attractive opportunities to engage around key technical levels.
WTI Crude Oil Weekly Market Outlook
If WTI crude oil moves higher at the start of Monday’s session and approaches the 64.000 level, traders may look to target slightly higher price zones. That said, day traders should avoid becoming overly aggressive, as the 64.500 area could present stiff resistance unless upside momentum is firmly maintained. For now, a sharp acceleration to higher levels appears unlikely, with a decisive breakout probably requiring fresh catalysts—such as escalating developments involving Iran—to overcome established resistance.
Conversely, if WTI opens lower on Monday, the early reaction around the 63.000 support level will be key. A successful hold there would suggest larger participants are comfortable maintaining the current price equilibrium. However, a sustained break below 63.000 lasting several hours could indicate reduced concern among major oil players, potentially opening the door to further downside movement.
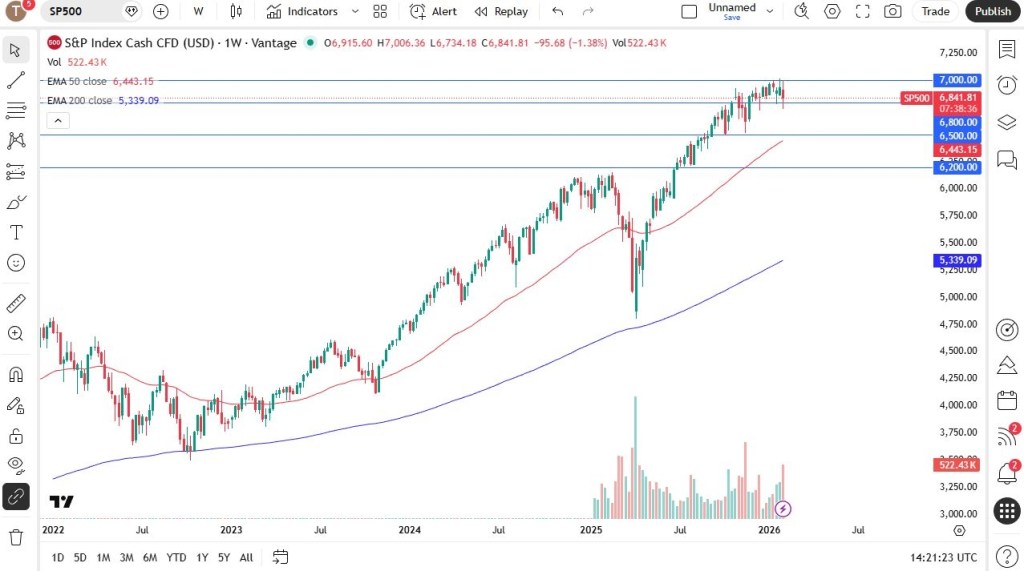
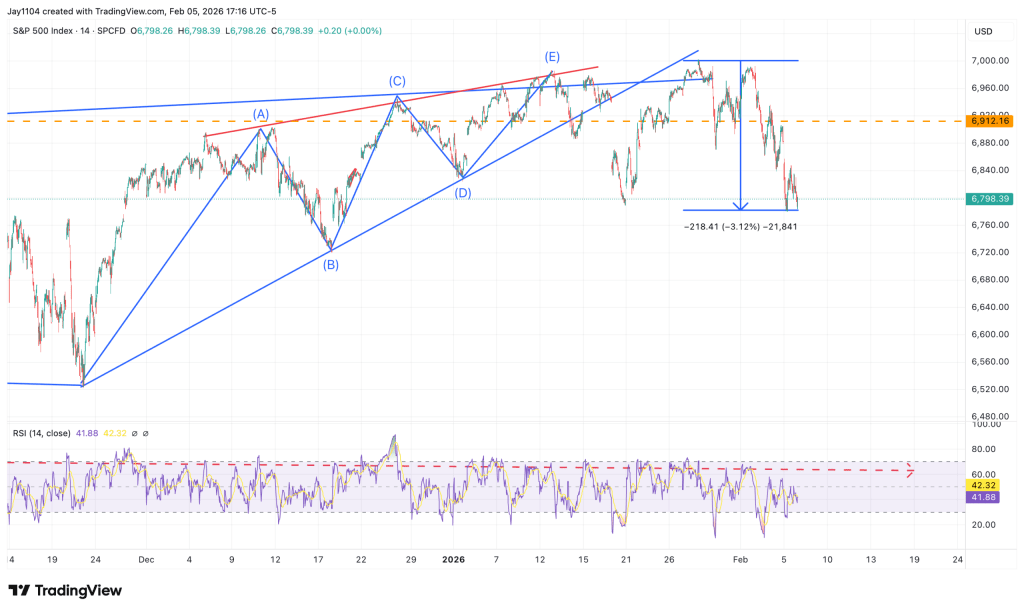
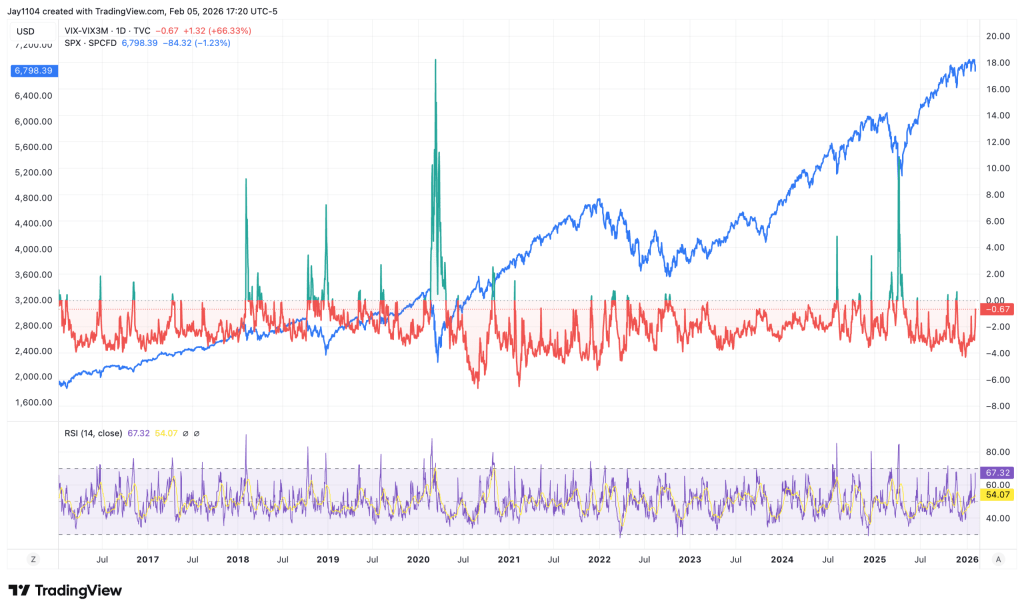
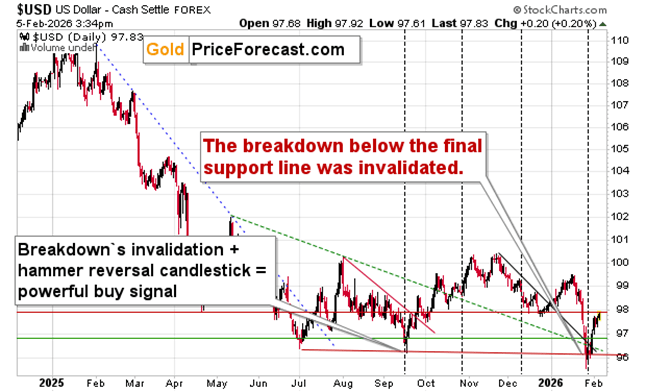
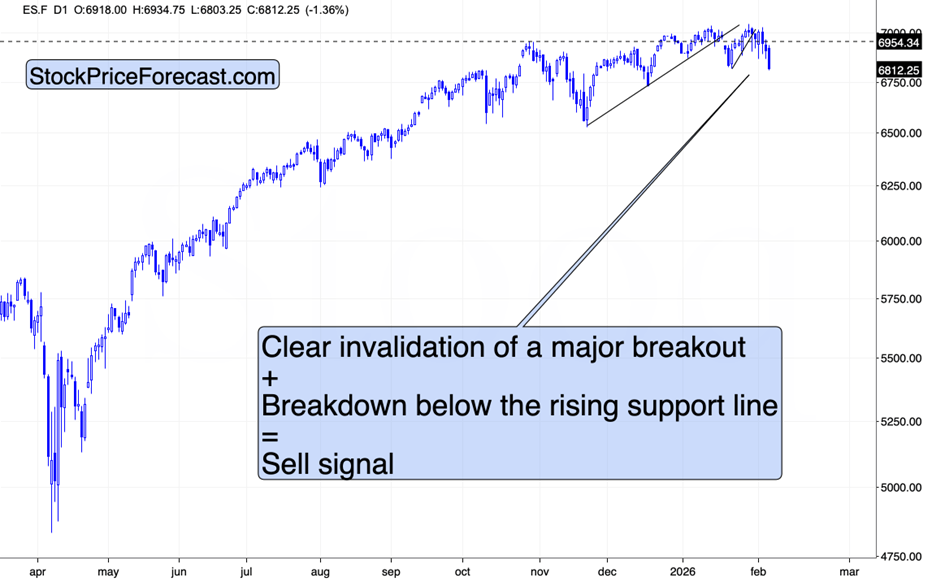
The S&P 500 remains highly volatile, with last week seeing the index test the 7,000 mark and briefly dip below 6,800 before rebounding. Overall, the price action suggests the market is still trying to determine its next direction, which is understandable given that earnings season is underway.
For now, the index continues to favor a buy-the-dip dynamic, with rebounds likely fueling further FOMO. A decisive move above 7,000 would likely open the door to further upside, although short-term choppiness is still to be expected.
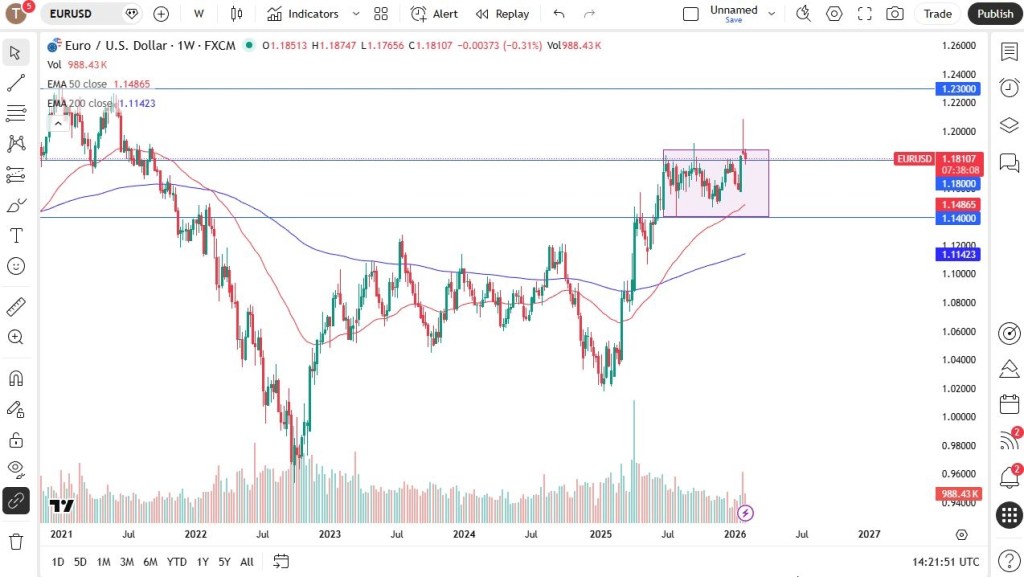
EUR/USD
The euro traded in a choppy manner throughout the week as it tested the 1.18 level, an area that had previously acted as resistance. Last week’s price action formed a particularly ugly shooting star, leaving uncertainty about whether the euro has enough momentum to sustain an upside breakout.
A move below the low of last week’s candle could open the door for a pullback toward the 1.16 level, effectively returning the pair to its prior consolidation range. While short-term price action is likely to remain noisy, the broader outlook is clouded by ongoing uncertainty around ECB policy and whether the Federal Reserve will move quickly enough on rate cuts to satisfy market expectations. Overall, I remain neutral on this pair.
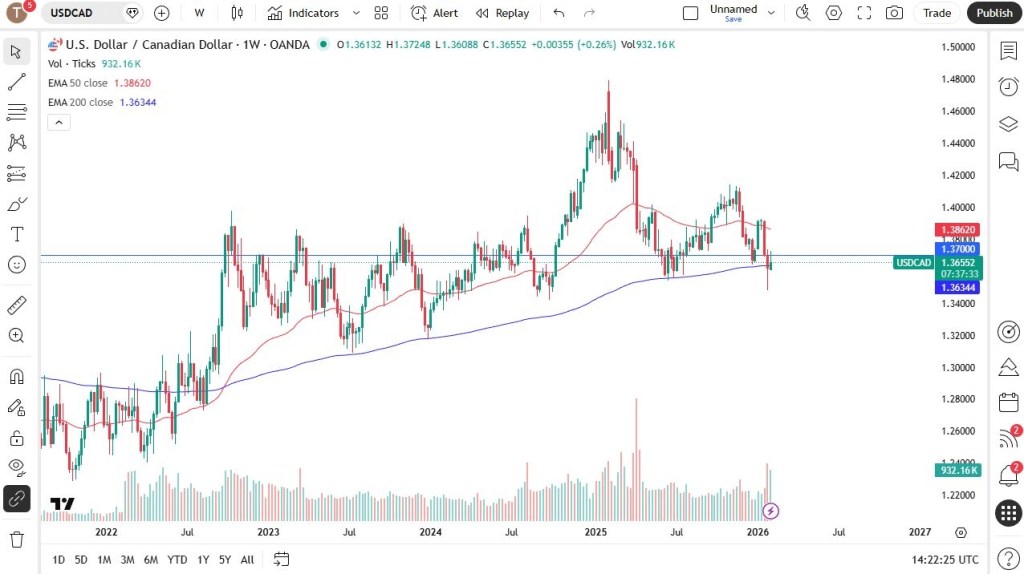
USD/CAD
The US dollar strengthened against the Canadian dollar but once again ran into resistance near the 1.37 level. Price is hovering around the 200-week EMA, and last week’s hammer candle suggests buyers may attempt to drive the pair higher, though confirmation is still needed.
From a technical perspective, this zone appears attractive for potential long positions, with the interest rate differential continuing to favor the US dollar. That said, this setup is better suited for short-term traders, as large or sustained moves are unlikely in the near term given the pair’s typically range-bound behavior.
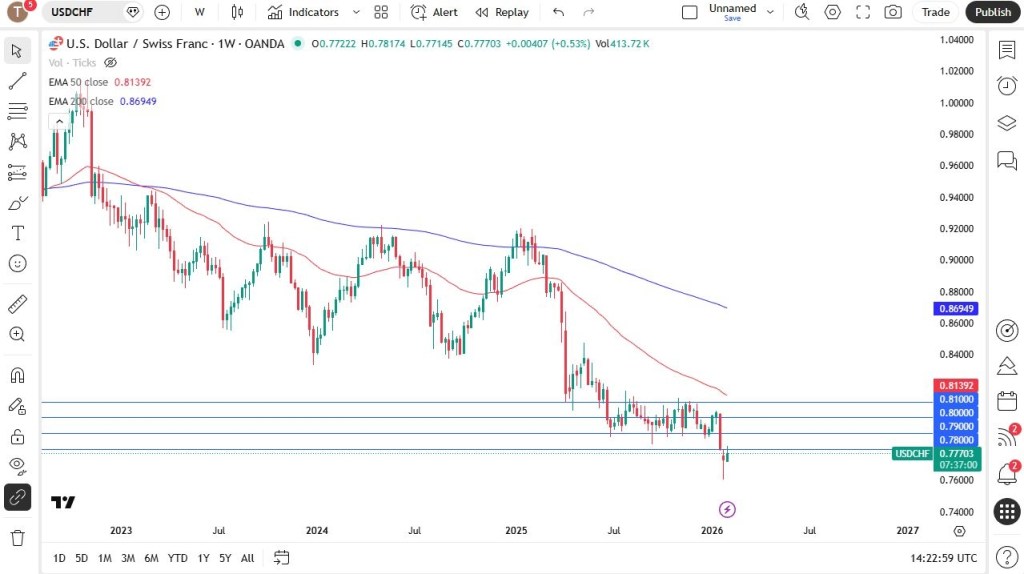
USD/CHF
The US dollar has edged higher against the Swiss franc, pushing above the 0.78 level, a key psychological round number that many traders are closely monitoring. This pair is especially noteworthy given last week’s hammer formation and ongoing comments from the Swiss National Bank expressing discomfort with a strong franc.
Should the SNB maintain this stance, intervention remains a possibility, which would likely weaken the franc and lift USD/CHF along with other CHF-denominated pairs. While the positive swap favors long positions, the move higher is likely to be uneven and challenging, so traders should be mindful of potential volatility.
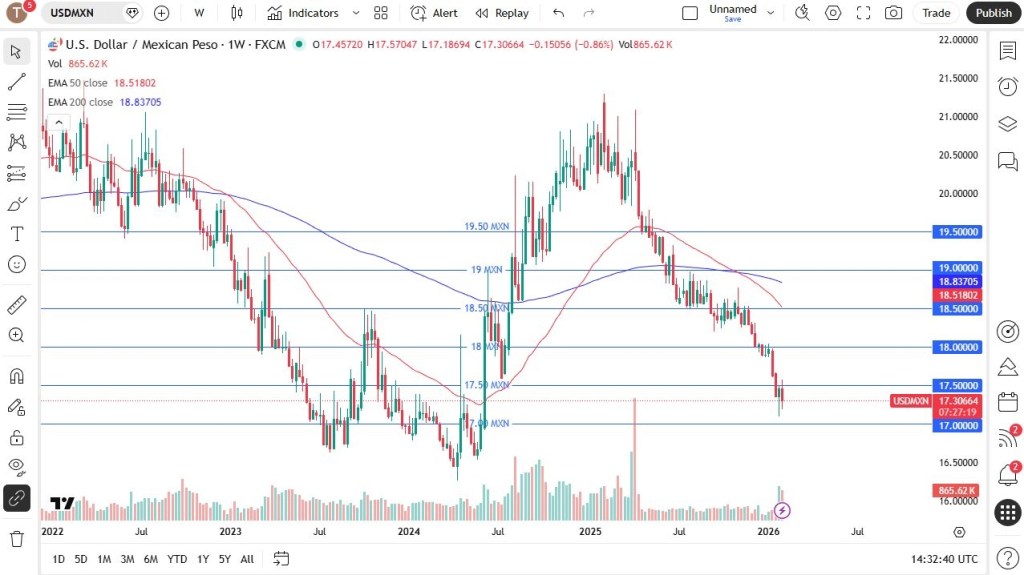
USD/MXN
The US dollar has been highly volatile against the Mexican peso, with the 17.50 level continuing to act as resistance. For now, the 17.00 area below appears to be the most likely short-term target.
From a longer-term perspective, there is substantial support beneath current levels, making a deeper breakdown uncertain. At the same time, the pair still offers an attractive carry trade, particularly for short-term participants. Given recent price action, this week is likely to remain as choppy as the last two, and significant moves seem unlikely.
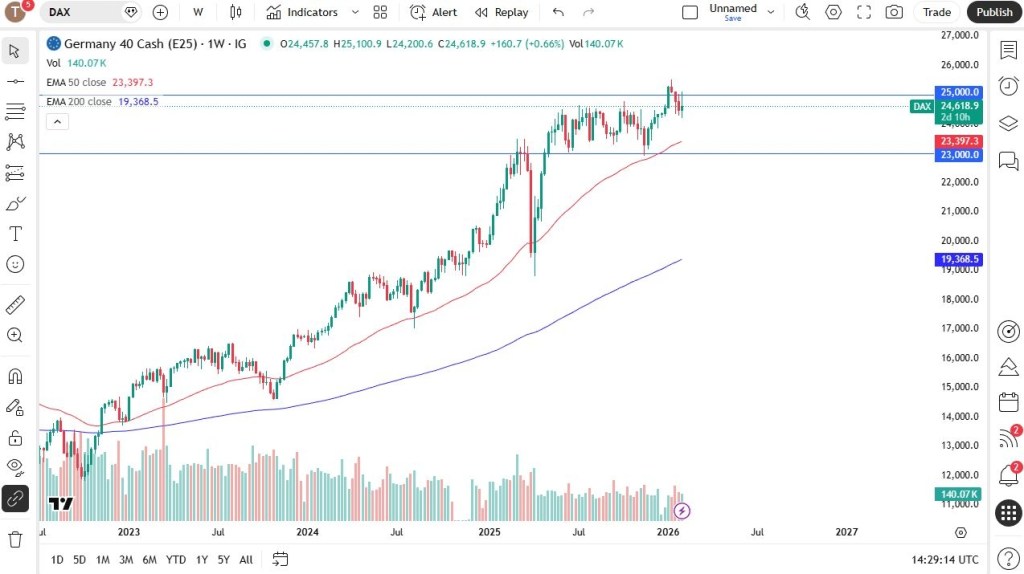
DAX
The German DAX has maintained a bullish tone for most of the week but continues to face resistance near the 25,000 level. A decisive break above 25,000—ideally confirmed by a daily, if not weekly, close—would likely clear the way for further upside in the index.
A Global Search for Support
Over time, I expect that breakout to occur. This is not a market that lends itself well to short positions, as it is likely to receive ongoing support from the German government, which continues to inject significant spending into the economy. As a result, buying pullbacks in the DAX remains an attractive strategy.
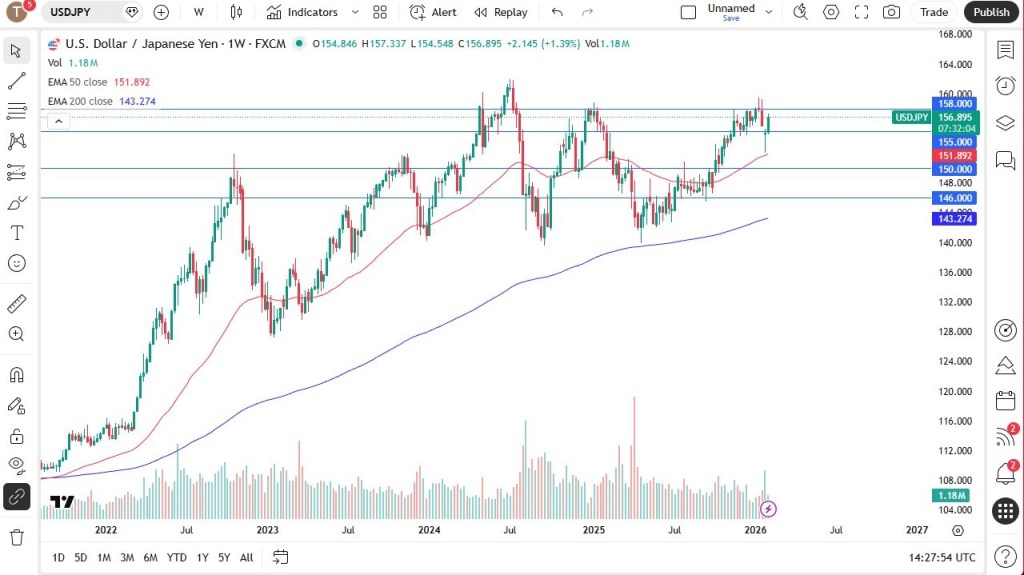
USD/JPY
The US dollar has held up well against the Japanese yen this week, even in the wake of recent intervention efforts. The 158 level remains a major reference point on long-term charts, an area of significance that dates back to May 1990 and deserves close attention.
Looking further ahead, a sustained break above the 163 level—where the monthly chart shows a substantial resistance zone—could eventually open the door to much higher levels, potentially even toward 250 yen over the longer term. While such a move is not expected in the near future, it reflects the broader outlook for the yen unless there is a meaningful shift in underlying conditions.
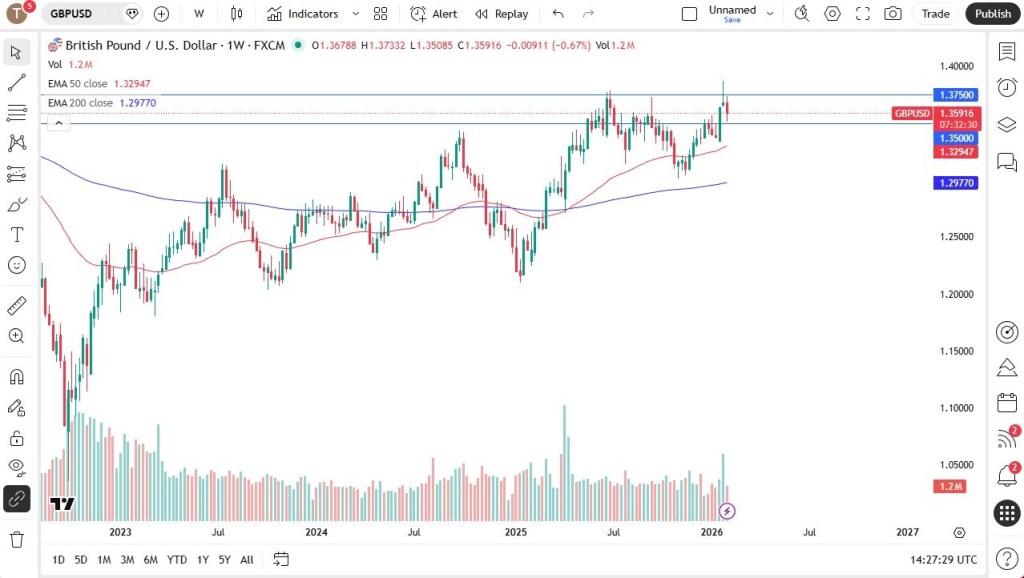
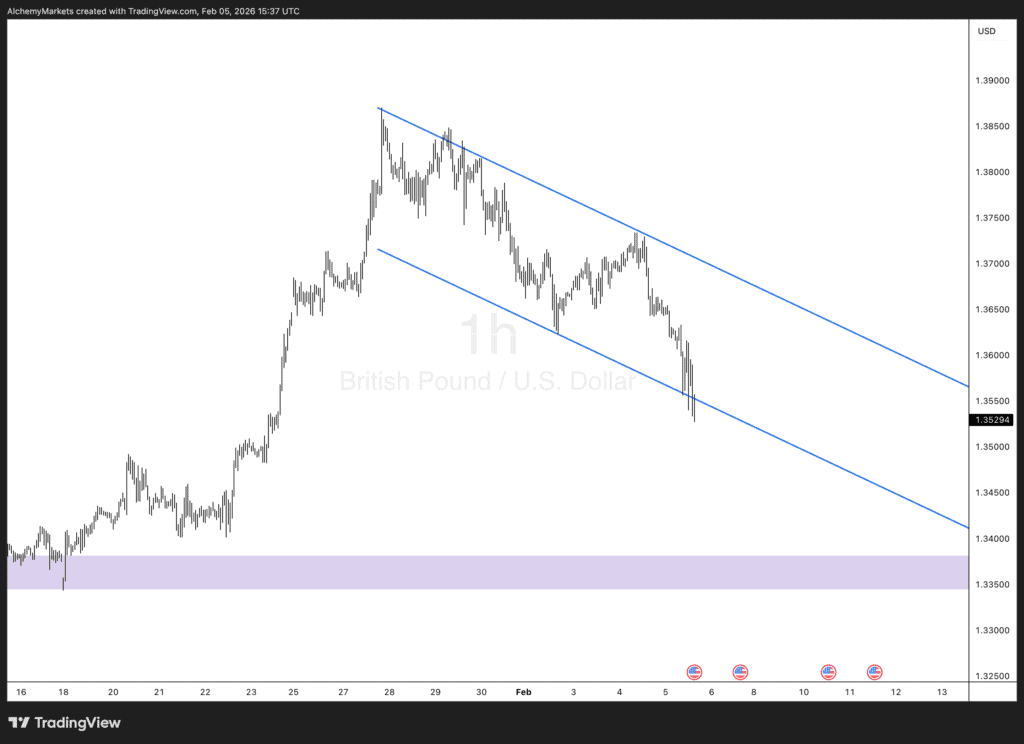
GBP/USD
The British pound was highly volatile throughout the week, with the 1.3750 level once again acting as notable resistance. A break below 1.35 would be a strongly bearish signal for GBP/USD and could potentially open the door for a move toward the 1.30 area.
While it remains unclear whether the US dollar has definitively bottomed, it is beginning to show signs of attempting a base. If that proves to be the case, it could leave many traders positioned on the wrong side of the market.
Concerns that the U.S. dollar is heading into a phase of rapid debasement look exaggerated, despite ongoing longer-term headwinds. Although the currency has been volatile recently and briefly hit multi-year lows—reviving “Sell America” narratives—Bank of America says market evidence does not yet point to a structural shift away from U.S. assets.
While BofA remains bearish on the dollar over the long run, it expects any depreciation to play out gradually through 2026 and 2027 rather than through an abrupt decline. Investor positioning and capital flow data show little sign of a coordinated move out of U.S. assets. Dollar risk premia have risen only modestly, and options markets indicate that short-dollar positioning is not meaningfully larger than it was three months ago.
Cross-asset flows reinforce this view, with equity and bond data showing no substantial foreign capital flight from the U.S. Notably, there has been just one session this year in which both the dollar and U.S. equities sold off sharply at the same time—an outcome inconsistent with a broad debasement scenario.
Instead, BofA suggests that increased currency hedging is the more likely adjustment. European investors may hedge their U.S. exposure more actively, which could place steady, incremental pressure on the dollar without triggering a disorderly selloff.
Macro indicators also fail to signal rising debasement risks. Inflation expectations remain well anchored, and although fiscal concerns are widely discussed, they have not produced market stress indicative of eroding confidence in the dollar. Part of the expected dollar weakness may simply reflect improving conditions elsewhere, particularly in Europe, where stronger growth prospects, German fiscal stimulus, potential spillovers from Chinese stimulus, and longer-term structural factors such as higher defense spending and trade agreements could support the euro and other non-U.S. assets.
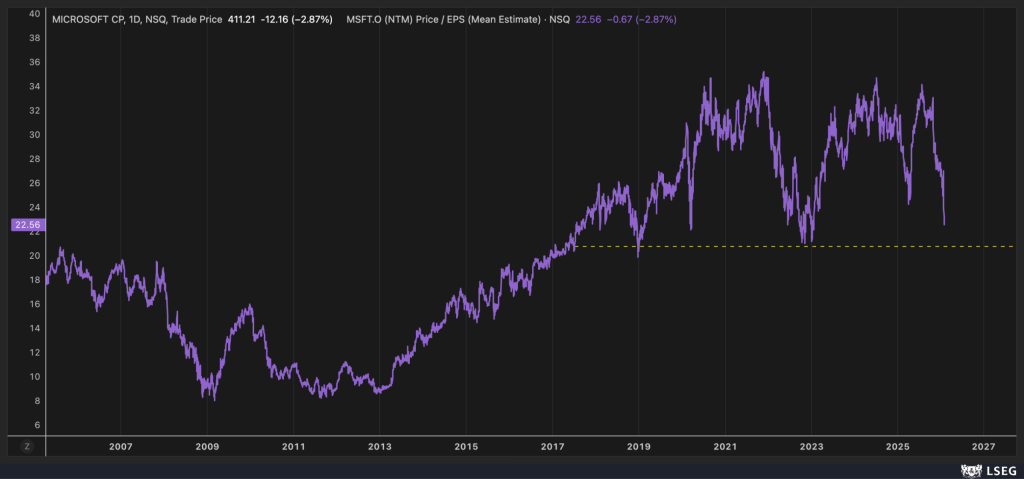
Stifel downgrades Microsoft to Hold, says it’s “time to pause”
Microsoft (NASDAQ: MSFT) saw a rare Wall Street downgrade this week as Stifel analyst Brad Reback lowered the stock to Hold from Buy, cautioning that expectations for fiscal and calendar 2027 appear overly optimistic. He cited ongoing cloud capacity constraints, rising capital intensity, and intensifying AI competition as key concerns.
Reback cut Stifel’s price target to $392 from $540, saying the stock may need a breather after its strong run. Persistent limitations in Azure capacity remain a major headwind. Given well-known supply issues, along with strong results from Google’s GCP and Gemini platforms and increasing momentum at Anthropic, Reback believes meaningful near-term acceleration at Azure is unlikely.
He also noted that revenue tailwinds from overlapping product cycles that benefited fiscal 2026 should fade, limiting upside in subsequent years. Meanwhile, investment spending is expected to surge. Stifel raised its fiscal 2027 capex estimate to roughly $200 billion, about 40% growth and well above the Street’s $160 billion forecast. As a result, Reback lowered his FY27 gross margin outlook to around 63%, versus a consensus near 67%.
Operationally, Microsoft is entering what Reback described as a new — though still efficient — phase of elevated spending as it builds and monetizes proprietary AI platforms, a shift likely to weigh on operating margin leverage. While Stifel remains positive on Microsoft’s long-term strategic position, Reback said near-term visibility has become less clear, arguing the stock is unlikely to re-rate until capital spending moderates relative to Azure growth or cloud demand reaccelerates meaningfully.
DA Davidson cuts Amazon as AWS cedes cloud leadership
DA Davidson downgraded Amazon (NASDAQ: AMZN) to Neutral from Buy, warning that the company is losing its leadership position in cloud computing and showing early strategic strain in an AI-driven retail landscape. The firm lowered its price target to $175, arguing Amazon is now playing catch-up through increasingly aggressive investment.
Analyst Gil Luria said AWS continues to trail Microsoft Azure and Google Cloud. While AWS posted 24% year-over-year growth, Google Cloud accelerated to 48%, and Azure grew 39% despite capacity constraints. Luria highlighted Amazon’s lack of a frontier AI research lab and the absence of a flagship partnership like Microsoft’s alliance with OpenAI as factors driving customer preference toward rivals.
Falling behind, he warned, is forcing Amazon into heavier spending, pointing to more than $200 billion in projected capex. Luria suggested Amazon may ultimately need to pursue a $50 billion OpenAI investment to remain competitive in frontier AI models. He also raised concerns that Amazon’s retail business could face a structural disadvantage in a chat-centric internet dominated by Gemini and ChatGPT, where merchants embedded directly in leading AI platforms may gain superior traffic and advertising leverage.
Wolfe sees massive long-term upside in Tesla robotaxis, but near-term pressure
Wolfe Research said Tesla’s (NASDAQ: TSLA) robotaxi platform could become a major long-term growth engine, estimating the business could scale to $250 billion in annual revenue by 2035 as autonomous adoption expands. Analyst Emmanuel Rosner described 2026 as a catalyst-heavy year, with investor focus on robotaxi rollout, Optimus production, and the launch of unsupervised full self-driving.
Wolfe’s model assumes 30% autonomous penetration, a 50% market share for Tesla, and pricing of $1 per mile, which could support roughly $2.75 trillion in equity value, or about $900 billion on a discounted basis. Additional upside could come from Optimus and FSD licensing.
Despite the long-term optimism, Rosner remains cautious on near-term fundamentals, sitting below consensus earnings estimates for 2026 and 2027. He expects margin pressure from higher costs, pricing dynamics, and changes in FSD monetization, along with heavy AI-related investment weighing on earnings. Still, strong momentum in Tesla’s energy storage business provides some offset, and Wolfe remains tactically constructive given the steady flow of upcoming catalysts.
Truist tells investors to “buy the dip” in AMD
Truist Securities reiterated a bullish long-term view on AMD (NASDAQ: AMD), urging investors to buy the weakness after the stock fell more than 14% over the past week to its lowest level since October 2025. Analyst William Stein said AMD continues to compound earnings at roughly a 45% CAGR through 2030, while trading at just 11x estimated 2030 EPS.
Although fourth-quarter results benefited from a one-off China-related dynamic, AMD still reaffirmed its outlook for 60% data-center growth and 35% overall sales growth, which management believes could drive more than $20 in EPS by 2030. Stein cited strong customer engagement, accelerating adoption of Instinct MI350 GPUs, and solid demand for fifth-generation EPYC processors as key drivers. Truist raised its 2027 EPS forecast and lifted its price target to $283, arguing long-term fundamentals outweigh short-term noise.
Jefferies warns Palantir valuation still has room to fall
Jefferies said Palantir Technologies (NASDAQ: PLTR) remains vulnerable to further downside despite a steep year-to-date decline of roughly 27%. Analyst Brent Thill emphasized that the call is based on valuation rather than fundamentals, noting that even after compressing from 73x to about 31x forward revenue, Palantir still trades at nearly double the valuation of other large-cap software peers.
While acknowledging improving fundamentals, expanding addressable markets, and strengthening competitive positioning, Thill argued that valuation risk outweighs operational progress. The stock’s premium leaves it highly sensitive to shifts in AI sentiment and broader software sector trends. Jefferies believes cooling enthusiasm could push Palantir toward more sustainable valuation levels, reiterating its Underperform rating and $70 price target, even after strong quarterly results failed to justify the stock’s elevated multiple.
On Monday, JPMorgan downgraded Best Buy (NYSE: BBY) to Neutral with a $76 price target.
TL;DR
JPMorgan turns cautious on BBY. Seller pressure remains heavy, upside is capped, and the stock struggles to break out — “Run, Forrest, run.”
The full story
JPMorgan cut BBY to Neutral from Overweight and set a December 2026 price target of $76, based on 12x P/E and 5.5x EV/EBITDA using its 2026 estimates.
The firm expects a tough 4Q25, with punishing year-over-year comparisons in 2Q and 3Q that mute any consumer recovery rally. Computing faces meaningful pressure just as macro tailwinds fade. While tax stimulus could briefly lift demand, JPM sees limited durability: a short-lived boost from the Nintendo Switch 2 (adding ~2.3 points of comp in 2Q) and the October Windows 10 end-of-support event fail to change the bigger picture.
Rising memory prices — potentially doubling — threaten computing, which makes up over 35% of sales, undercutting what had been mid-single-digit growth from replacement demand. Meanwhile, housing remains weak, while TVs (20%+ of revenue) and appliances (11%) continue to struggle amid aggressive pricing and limited feature-driven upgrades.
Crowded short positioning and stimulus optimism could push shares back into the $70s, but JPM sees this as a classic “can’t see the forest for the trees” setup. With sellers positioned higher, the firm steps aside.
SoFi (SOFI)
What happened?
On Tuesday, JPMorgan upgraded SoFi (NASDAQ: SOFI) to Overweight and lifted its price target to $31.
TL;DR
Momentum is real, and the recent pullback looks like a gift — not a red flag. Happy New Year.
The full story
SoFi shares are down about 10% since the company’s Q4 earnings call on January 30, even as the S&P 500 has barely moved. JPMorgan views the selloff as disconnected from fundamentals, coming on the heels of record quarterly results and 2026 adjusted EBITDA guidance that surpassed expectations.
The firm points to strong and accelerating momentum across the business. SoFi continues to add members and deposits at record levels, standing out as many competing fintechs face outflows or stalled growth. Elevated marketing spend through 2025 and into the first half of 2026 is seen as a strategic advantage, helping attract and retain higher-quality customers.
With a nearly $40 billion loan portfolio now producing meaningful GAAP earnings — even excluding non-cash fair-value adjustments — alongside growing fee revenue from the Tech Platform and expanding products like SoFi Plus, JPM argues the company has reached real scale. That combination, in its view, supports a premium valuation and underpins the upgrade.
Booking Holdings (BKNG)
What happened?
On Wednesday, Mizuho upgraded Booking Holdings (NASDAQ: BKNG) to Outperform and reiterated its $6,000 price target.
TL;DR
Mizuho turns bullish on BKNG. Buy the fear — roughly 30% upside ahead.
The full story
Mizuho raised BKNG to Outperform from Neutral while holding its $6,000 price target, implying about 30% upside and a compelling 2.7x bull/bear skew.
Shares are down 16% since the recent selloff, underperforming peers (Expedia +6%, Airbnb -1%) and the broader market (Nasdaq +2%), even as 2027 EPS estimates have risen roughly 4%. The firm dismisses concerns that generative AI will bypass online travel agencies and drive consumers directly to hotels, characterizing the narrative as exaggerated market fear rather than a structural threat.
Valuation has become increasingly attractive. BKNG now trades at 17.8x next-twelve-month consensus P/E, a full standard deviation below its three-year average of 20.6x, and around 16x projected 2027 GAAP EPS.
For investors who missed the November selloff, Mizuho frames the current setup as another clear opportunity: sentiment has overshot fundamentals, and fear is once again creating an entry point.
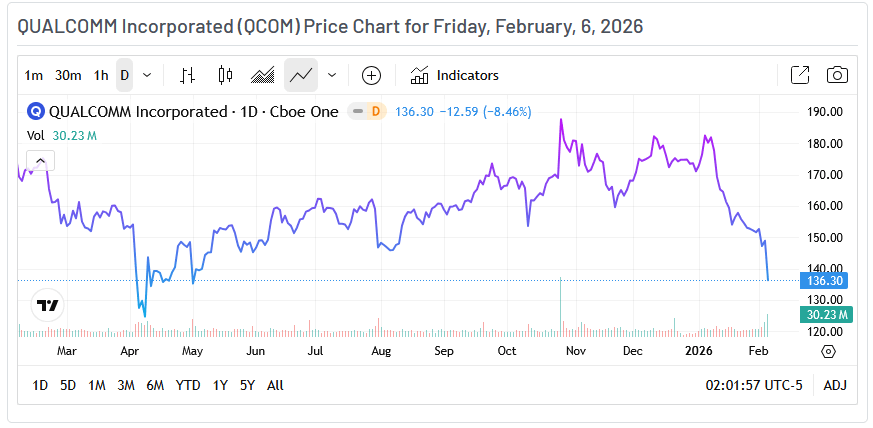
Qualcomm (QCOM)
What happened?
On Thursday, Bank of America downgraded Qualcomm (NASDAQ: QCOM) to Neutral and cut its price target to $155.
TL;DR
Handset demand is collapsing, QCT is in trouble, and near-term catalysts are nowhere to be found. BofA looks elsewhere.
The full story
BofA downgraded QCOM from Buy to Neutral and slashed its price target from $215 to $155, lowering its valuation multiple to 13.5x FY27E P/E, down from 17x previously.
The call centers on worsening handset fundamentals. Smartphones account for roughly 74% of QCT revenue, and unit volumes are now expected to fall about 15% this year, a sharp deterioration from prior expectations of a modest 2% decline. Memory pricing volatility continues to pressure the ecosystem, weighing on demand across the supply chain, with even ARM and MediaTek feeling the strain.
Competitive dynamics add to the pain. Samsung has taken roughly 25% share, Apple is expected to reduce reliance on Qualcomm later this year, and China demand is fading following a holiday-driven surge. As a result, BofA forecasts QCT revenue to decline 1.5% in FY26.
While Qualcomm trades at a seemingly cheap ~12x FY27E earnings, the firm sees little reason for multiple expansion. With no clear near-term catalysts and both cyclical and structural headwinds building, BofA steps to the sidelines.
Amazon (AMZN)
What happened?
On Friday, DA Davidson downgraded Amazon (NASDAQ: AMZN) to Neutral and cut its price target to $175.
TL;DR
AWS is losing momentum versus faster-moving rivals, AI leadership gaps are widening, and rising capex clouds the risk/reward. DA Davidson steps back.
The full story
DA Davidson downgraded Amazon from Buy to Neutral, arguing that AWS’s dominance is beginning to erode under competitive pressure. While AWS is growing at roughly 24%, rivals are accelerating faster—Google Cloud at 48% and Azure at 39%—driven by stronger AI ecosystems, frontier-model partnerships, and perceived leadership rather than arguments around scale.
The firm highlights growing concerns around AWS’s AI stack. Trainium continues to lag Google’s TPUs, and customers appear increasingly willing to shift workloads accordingly. In retail, DA Davidson sees strategic risk from limited deep integration with leading conversational AI platforms such as Gemini or ChatGPT, potentially allowing competing commerce platforms to capture merchant traffic and advertising dollars. Internal efforts, including Rufus and broader “horizontal model” initiatives, are viewed as slow to gain traction. Even Amazon’s early investment in Anthropic is seen as less differentiating as competition intensifies.
Meanwhile, capital expenditures are surging beyond $200 billion, raising questions about return on investment and whether Amazon may need to pursue costly external AI partnerships simply to remain competitive. Although revenue growth remains solid at around 13% and backlog continues to build, the firm believes the balance of risk has shifted.
DA Davidson concludes that Amazon’s scale no longer guarantees leadership, and that caution—not blind confidence—is warranted at current levels.
The opening weeks of the year have underscored how rapidly investor sentiment can change. In early 2026, markets saw a clear rotation into consumer staples, a sector traditionally favored for its defensive characteristics. As technology stocks came under pressure from elevated valuations and growing doubts about the durability of the AI-driven rally, consumer staples emerged as a relative safe haven.
The Consumer Staples Select Sector SPDR Fund (XLP), a widely followed benchmark, climbed roughly 13% year-to-date through early February—one of its strongest starts in more than ten years. By contrast, technology shares fell by about 3% over the same period, reflecting a classic shift toward lower-risk assets.
Why Investors Are Seeking Safety
The drivers behind this rotation are varied but grounded in clear logic. After years of leadership fueled by AI enthusiasm and an extended period of low interest rates, technology entered 2026 with lofty expectations. Rising concerns over escalating AI capital expenditures, potential regulatory pressure, and a more normalized rate environment triggered a wave of profit-taking.
At the same time, broader macro signals—including softening labor market conditions, pockets of persistent inflation, and heightened geopolitical risks—pushed investors toward more stable areas of the market. Consumer staples fit that role well. Demand for everyday necessities such as food, beverages, household goods, and tobacco alternatives remains steady, supporting reliable earnings, consistent dividend payouts, and lower overall volatility.
This shift mirrors historical patterns in which periods of uncertainty or market broadening drive capital away from high-growth, cyclical sectors and into defensive ones. Amid broader market pullbacks this year, consumer staples have stood out as one of the few areas of relative strength, drawing significant inflows as investors reduce risk. The sector’s limited sensitivity to economic cycles—consumers continue to buy essentials like toothpaste, soap, and snacks regardless of conditions—offers a cushion when discretionary spending weakens.
Consumer Staples Stocks Reaching Yearly Highs
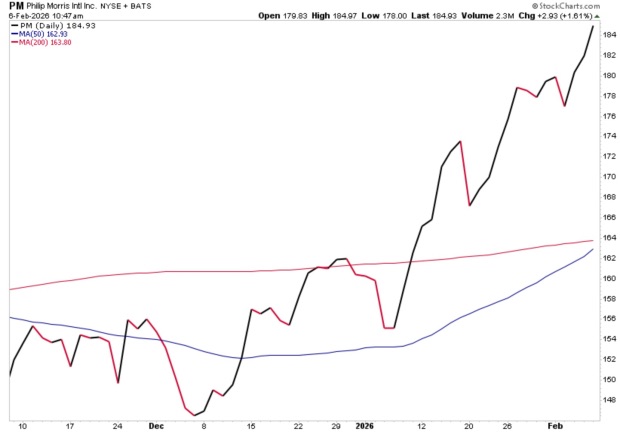
Established industry leaders have been at the forefront of this move, combining defensive stability with incremental growth drivers. Philip Morris International (NYSE: PM) has been a notable example, with shares posting solid gains in early 2026 following a strong fourth-quarter 2025 earnings report. The company’s ongoing shift toward smoke-free alternatives—such as IQOS heated tobacco products and Zyn nicotine pouches—has delivered robust volume growth, more than offsetting declines in traditional cigarette sales.
Philip Morris exceeded Q4 expectations, reporting adjusted earnings per share of $1.70, up 9.7% year over year, alongside revenue growth of 6.8%. The stock currently holds a Zacks Rank #3 (Hold), reflecting stable near-term expectations. Consensus forecasts call for full-year 2026 EPS of roughly $8.34, representing nearly 11% annual growth, supported by strong pricing power and continued momentum in emerging markets.
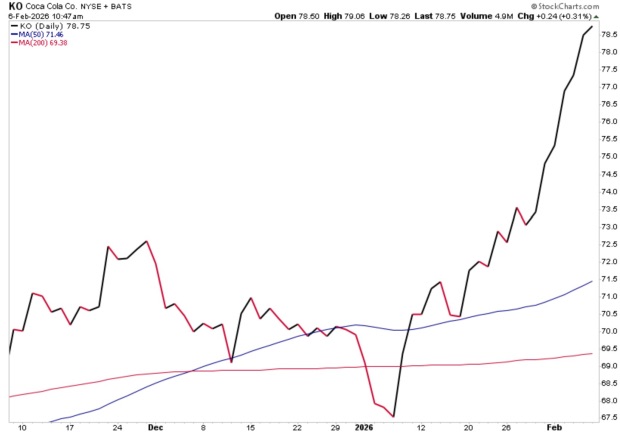
Coca-Cola (NYSE: KO) completes the list of standout performers, benefiting from its unmatched global brand presence in beverages. Continued volume growth in emerging markets, along with broader diversification into non-carbonated offerings, has helped sustain the company’s momentum. Coca-Cola’s attractive dividend yield and dependable payout profile make the stock particularly appealing in income-focused environments. Currently holding a Zacks Rank #3 (Hold), consensus estimates suggest a steady, incremental improvement in earnings per share.
Bottom Line
These sector leaders highlight the core appeal of consumer staples: dependable, recurring revenue from essential products; strong balance sheets that support consistent dividends—often in the 3–4% yield range; and modest growth driven by innovation or international expansion. Valuations across the sector remain reasonable relative to growth prospects, with many names trading at forward price-to-earnings multiples in the high teens to low 20s, well below the elevated valuations seen in much of the technology space.
As recession concerns quietly build amid a softening labor market, consumer staples offer credible downside protection without materially compromising long-term total returns. For well-diversified portfolios, the sector serves as a stabilizing anchor—delivering steady performance in increasingly uncertain market conditions.
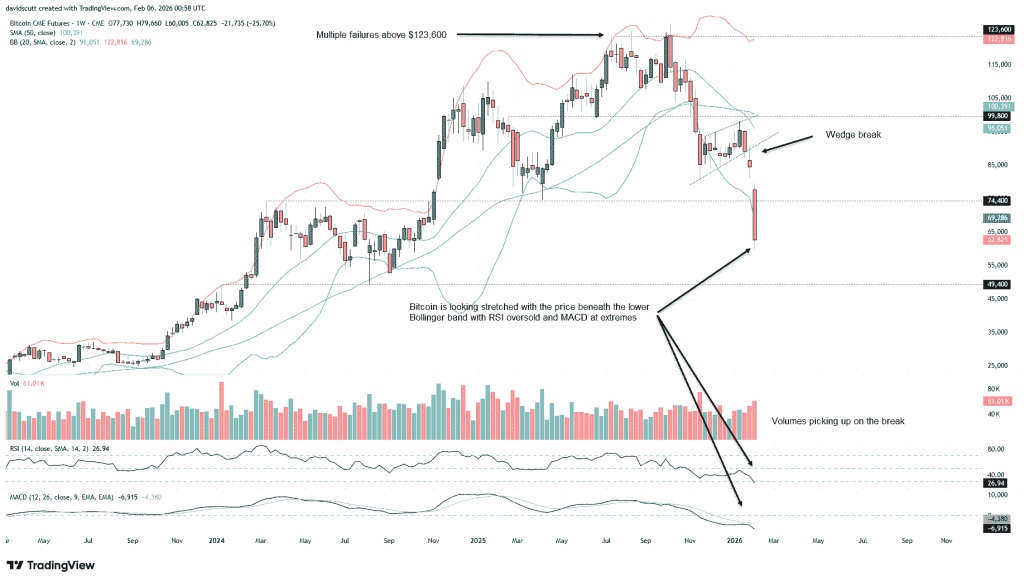
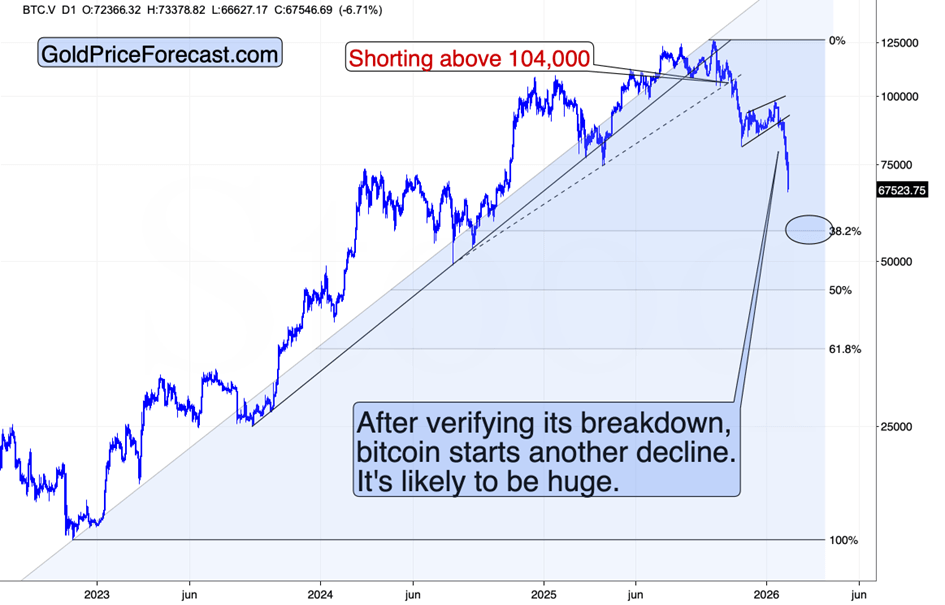
Over the past year, market attention has largely centered on bitcoin’s price volatility and shifting investor sentiment. Headlines were dominated by discussions around regulation, adoption, and inflation. Meanwhile, a more subtle but potentially significant risk has been developing in the background: advances in quantum computing. Bitcoin has recently come under pressure as investors begin to factor in these concerns, prompting renewed debate over the cryptocurrency’s long-term security and durability.
Introduction
Rapid progress in quantum computing is raising fresh questions about the future security of blockchain-based systems. Bitcoin’s network depends on cryptographic algorithms to protect transactions and verify ownership, and researchers are increasingly examining whether sufficiently powerful quantum computers could one day compromise these safeguards.
These worries are no longer confined to academic circles. Christopher Wood, Jefferies’ global head of equity strategy, recently removed bitcoin from his model portfolio, citing the risk that breakthroughs in quantum computing could erode the cryptographic foundations underpinning the asset. He cautioned that any successful attack would call into question bitcoin’s credibility as a long-term store of value.
The Quantum Computing Threat
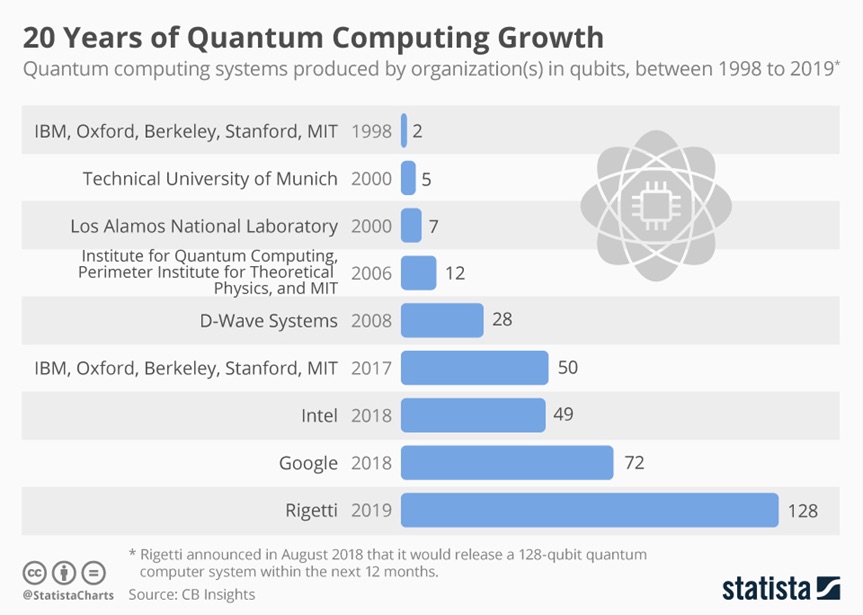
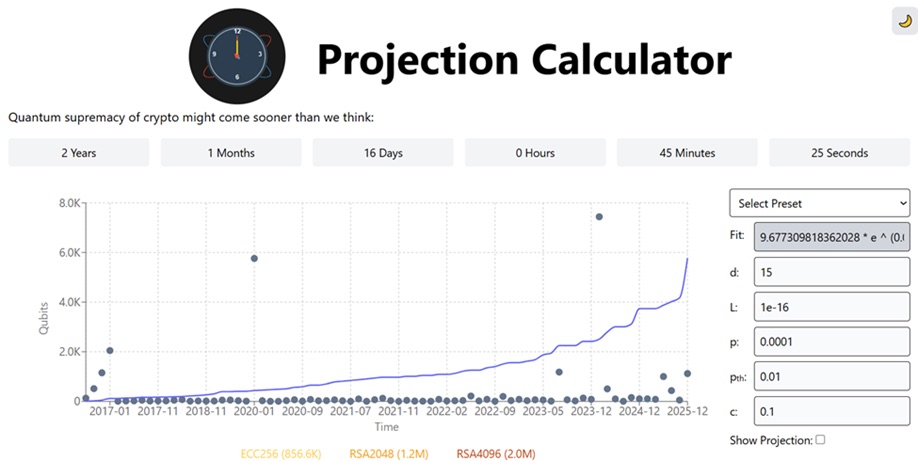
Quantum computing is widely viewed as the next major leap in computational technology. Traditional computers process information using binary bits—either a 0 or a 1. Quantum computers, by contrast, rely on quantum bits, or qubits, which can exist in multiple states simultaneously due to a phenomenon known as superposition. When combined with other quantum effects such as entanglement and interference, this capability allows quantum systems to solve certain classes of problems far more efficiently than classical machines.
Timothy Hollebeek, Industry Standards Strategist at DigiCert, offers a helpful analogy: classical computing is like navigating a maze by testing one route at a time, while a quantum computer can explore all possible paths simultaneously. This parallelism is what makes quantum computers especially powerful for tasks involving complex mathematics, including factoring large numbers and uncovering patterns within massive datasets.
Recent breakthroughs highlight the promise of quantum technology. Google’s quantum processor, Willow, reportedly completed a specialized computation in under five minutes—an exercise that would take classical supercomputers an impractically long time to finish. The chip is estimated to be roughly 13,000 times faster than the world’s most powerful traditional systems for that task. Achievements like this help explain why quantum computing is drawing growing interest across sectors such as healthcare, logistics, and materials research.
Still, despite the enthusiasm, quantum computing remains in its early developmental phase. Current systems face significant technical limitations. Qubits are highly fragile, must operate at temperatures close to absolute zero, and are extremely sensitive to environmental noise, which can introduce errors. Even in tightly controlled settings, sustaining a stable quantum state for more than a short duration remains challenging. For instance, Google’s Willow chip uses 105 qubits, whereas practical, fault-tolerant quantum computers would likely require thousands of reliably connected and stable qubits.
The rapid progress of quantum computing has prompted renewed scrutiny of the long-term security of cryptography-dependent digital systems, including cryptocurrencies. Because bitcoin’s architecture rests on assumptions about the limits of computational power, any transformative advance in computing naturally warrants closer evaluation.
The Real Threats That Could Undermine Bitcoin’s Value
“Quantum computers are not a matter of if, but when,” said Timothy Hollebeek, Industry Standards Strategist at DigiCert—a sentiment that helps explain why quantum advancements are increasingly viewed as a potential long-term risk to bitcoin’s security and valuation.
The most significant risk centers on Shor’s algorithm, a quantum method capable of compromising the elliptic curve digital signature algorithm (ECDSA) that bitcoin relies on to verify ownership of funds. Under today’s classical computing constraints, deriving a private key from a public key is computationally infeasible. However, in a future with sufficiently powerful quantum computers, this assumption may no longer hold. In theory, an attacker could extract a private key from its corresponding public key in a relatively short period, enabling unauthorized transfers of funds.
The quantum risk is not evenly spread across the bitcoin network. Roughly 25% of all bitcoins—more than 5 million BTC—are held in so-called “vulnerable” addresses, including early P2PK addresses and reused P2PKH addresses. This category also encompasses the estimated 1.1 million BTC attributed to Satoshi Nakamoto. These holdings are more exposed because their public keys are already visible on the blockchain, making them potential targets for quantum-enabled attacks. If even a fraction of these coins were moved by a quantum adversary, the resulting supply shock could be severe, shaking confidence in bitcoin’s ownership framework and placing significant downward pressure on prices.
Even newer address formats are not entirely risk-free under extreme assumptions. One commonly cited theoretical vulnerability involves transactions sitting in the mempool—the queue of unconfirmed transactions shared across network nodes. In this scenario, a sufficiently advanced quantum computer could detect a transaction before it is confirmed, derive the corresponding private key in real time, and submit a competing transaction that redirects the funds. Although highly speculative, this example illustrates how execution speed could become as critical as raw computational power.
Beyond outright theft, quantum computing could also erode trust in bitcoin’s neutrality and privacy. Through Grover’s algorithm, quantum-capable miners could gain a disproportionate advantage in proof-of-work mining, increasing the risk of mining centralization. If a single entity accumulated enough influence, it could censor transactions or reorganize blocks, undermining bitcoin’s decentralised ethos.
Another frequently cited risk is the concept of “harvest now, decrypt later,” where encrypted blockchain data is collected today with the expectation that future quantum computers could decrypt it. While this would not alter historical transactions, it could reveal identities behind pseudonymous wallets or expose past activity, weakening perceived privacy guarantees.
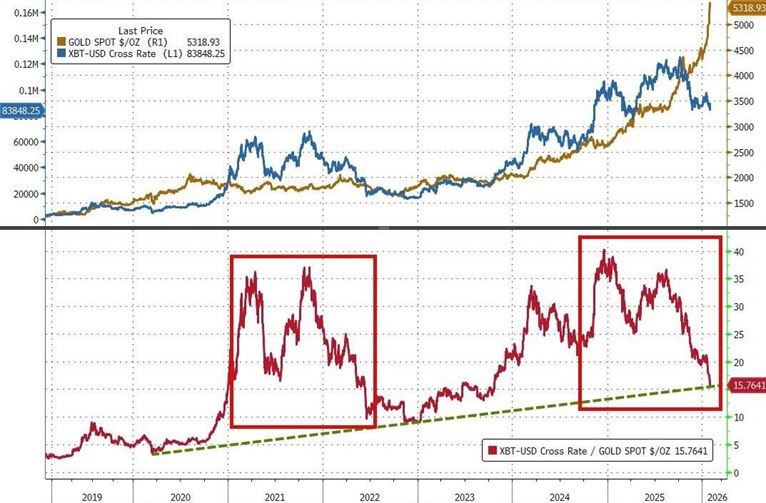
These technical risks are increasingly showing up in market behavior. By early 2026, quantum-related concerns had moved beyond abstract theory and begun to affect investor positioning. Bitcoin, for instance, lagged gold by roughly 6.5% year-to-date, while gold advanced about 55% over the same period. As a result, the bitcoin-to-gold ratio fell to around 19 BTC per ounce, signaling a more cautious stance toward bitcoin among investors.
Bitcoin Relative to Gold
How Bitcoin Could Be Compromised—and Why It Remains Resilient
At present, Bitcoin depends on elliptic curve cryptography (ECC)—specifically the secp256k1 curve—to generate public and private keys. Transactions are authenticated using ECDSA signatures, a system that is secure against classical computers but could be vulnerable to sufficiently advanced quantum machines. If that were to happen, both fund ownership and transaction integrity could be at risk.
One practical solution is the adoption of post-quantum cryptography (PQC), which is designed to withstand quantum attacks. Rather than requiring a complete overhaul of the network, PQC could be introduced incrementally, allowing vulnerable cryptographic components to be replaced over time.
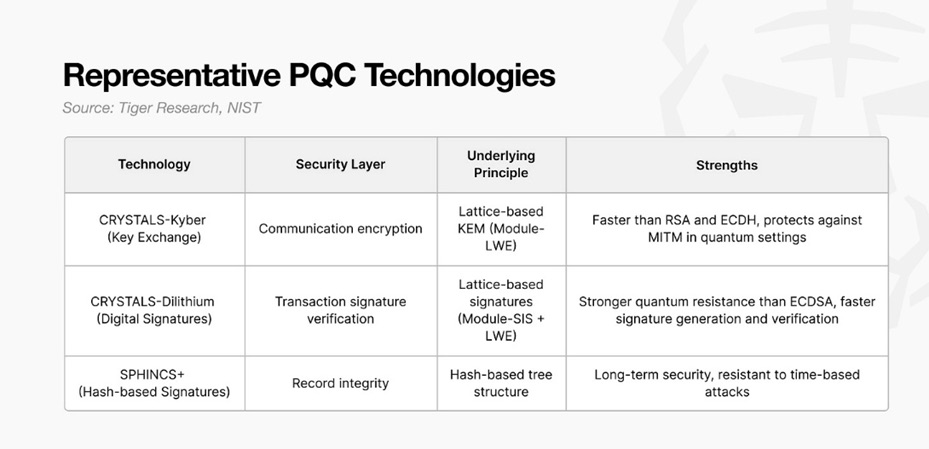
Under a PQC framework, security would be reinforced through a three-layer defense. Kyber would protect communications between nodes and wallets, preventing interception or eavesdropping. Dilithium would handle transaction verification and safeguard private keys against quantum-enabled attacks. SPHINCS+ would ensure the integrity of transaction records, effectively giving each transaction a unique, tamper-resistant cryptographic fingerprint.
Bitcoin is not a static system. In January 2026, the first “Bitcoin Quantum” testnets began experimenting with post-quantum cryptography using NIST-standardised algorithms such as ML-DSA (formerly Dilithium). These trials demonstrated that quantum-resistant upgrades can be tested safely before any network-wide rollout. Such technologies strengthen transaction validation, data transmission, and record integrity, helping ensure bitcoin’s durability in a future shaped by quantum computing. Previous upgrades—including SegWit and Taproot—illustrate that bitcoin can evolve without disrupting network operations.
Resilience is not purely technical; it is also economic and social. A visible quantum-related attack would pose an immediate threat to bitcoin’s value, creating strong incentives for miners, developers, exchanges, and large holders to coordinate a rapid response. Historically, the network has shown an ability to converge quickly on practical solutions when facing systemic risks. Moreover, quantum computing is advancing incrementally, giving bitcoin ample time to prepare, test, and deploy defensive measures before the threat becomes acute. In this context, resilience is about managing technological change carefully rather than attempting to stop it outright.
Bitcoin’s robustness is rooted in both its architecture and its incentives. The network has no central authority, physical headquarters, or kill switch. Its ledger is maintained by thousands of independent nodes globally, eliminating single points of failure. A fixed supply cap of 21 million coins guards against monetary inflation, while the proof-of-work mechanism—secured by vast computational resources—makes large-scale attacks prohibitively expensive.
Widespread adoption further reinforces this resilience. By 2024, an estimated 500 million people held bitcoin or other cryptocurrencies, while institutional participation expanded through ETFs, hedge funds, pension funds, and even sovereign entities. As bitcoin becomes increasingly embedded in the global financial system, the economic and political costs of attempting to disrupt it continue to rise. Major stakeholders now have strong incentives to preserve long-term stability rather than undermine it.
Some observers, including Michael Saylor, have argued that a shift to quantum-resistant addresses could materially affect bitcoin’s market dynamics. If the network were to establish a migration deadline, coins held in legacy addresses—whose owners have lost access or passed away—could become permanently inaccessible. This would effectively remove millions of bitcoins from circulation, tightening supply and increasing scarcity. While the timing and market response remain uncertain, such a transition underscores the intricate relationship between technological evolution and bitcoin’s economic framework.
Conclusion
Quantum computing poses challenges that extend well beyond bitcoin, as many digital platforms and internet communications depend on the same public-key cryptographic systems that could eventually be vulnerable to quantum attacks. Nvidia CEO Jensen Huang has suggested that truly practical quantum computers may still be 15 to 30 years away, providing a meaningful window for industries to prepare and adapt.
In the meantime, leading technology firms are already moving to address these risks. Microsoft, for instance, is incorporating post-quantum cryptography (PQC) into its core software libraries and working alongside global standards organizations to develop quantum-resistant protocols for secure communications.
Together, these initiatives indicate that both the broader technology sector and the cryptocurrency ecosystem are actively planning for a post-quantum future, testing and deploying safeguards well ahead of the arrival of commercially viable quantum computers.
The U.S. and Iran are holding talks in Oman today focused on dismantling Iran’s nuclear program. Washington is pushing Tehran to halt uranium enrichment, scale back its ballistic missile development, and withdraw support for regional proxy groups that contribute to instability in the Middle East. Iran, however, has stated it is only prepared to negotiate on nuclear-related issues. If discussions collapse, the risk of renewed U.S. military action rises, underscored by the significant U.S. naval presence in the region. That said, Iran recently seized two oil tankers ahead of the talks and later described the discussions as “positive.”
Following the meeting, Iranian Foreign Minister Abbas Araghchi said on state television that both sides could reach a framework for future negotiations if talks continue along the same lines. He emphasized that the dialogue remains limited strictly to nuclear matters, with no broader issues under consideration. Given Iran’s history of prolonging negotiations and the U.S. military buildup aimed at Iranian nuclear and defense assets, it remains to be seen how long Washington will tolerate a narrow scope of engagement.
Meanwhile, despite some concerns on Wall Street about OpenAI’s momentum, activity in the data center sector continues to accelerate. Super Micro Computer (SMCI) reported a 123% year-over-year jump in fourth-quarter revenue to $12.7 billion, while earnings climbed to $0.69 per share. The company delivered a 22.1% revenue beat and a 40.8% earnings surprise, along with upbeat forward guidance. As one of Nvidia’s largest customers, Super Micro’s results suggest Nvidia could also deliver a strong upside surprise, even as analysts forecast robust growth of 66.7% in sales and 71.1% in earnings.
AI-driven productivity gains are expected to continue supporting stronger GDP growth. The data center expansion shows no signs of slowing, underscoring the durability of the AI revolution. Nvidia’s upcoming Vera Rubin GPU—offering five times the performance and ten times the energy efficiency of the Blackwell architecture—is likely to trigger a multi-year AI hardware replacement cycle. At the same time, pricing for advanced chips and memory remains resilient, allowing AI demand to sustain strong profitability across the semiconductor ecosystem, including Nvidia (NVDA), Micron (MU), and Seagate Technology (STX).
The U.S. economy is experiencing a powerful growth phase, with annual GDP growth of 5% potentially driven by an estimated $20 trillion in onshoring investments across data centers, semiconductors, pharmaceuticals, and automotive manufacturing. Energy independence gives the U.S. a structural advantage over global peers, as manufacturers can avoid tariffs by relocating production domestically. In addition, U.S. support for increased crude oil output in Venezuela should help keep global oil prices contained over the medium term.
Overall, the U.S. continues to outperform globally in domestic growth. With Kevin Warsh nominated as the next Federal Reserve Chair, the U.S. dollar is expected to strengthen further. While AI is clearly enhancing productivity, it is also contributing to job displacement across corporate America. As a result, the Federal Reserve is likely to cut policy rates at least three times this year amid ongoing labor market concerns. These rate cuts should, in turn, help lift consumer confidence in the months ahead.
Amazon.com (NASDAQ: AMZN) reported quarterly revenue that topped expectations on Thursday, but markets focused on the company’s 2026 capital expenditure forecast of roughly $200 billion—far above what analysts had anticipated.
Shares ended Friday down 5.55%, though they pared earlier losses as a broad rally on Wall Street boosted risk assets.
The results arrive amid a notable rotation out of technology stocks into other sectors. Investor sentiment has shifted from viewing the tech sector broadly as an AI beneficiary to a more selective approach, with clear winners and losers emerging. Software firms have been singled out as laggards, with weakness spreading to chipmakers and the wider tech space.
Concerns around stretched valuations and aggressive spending plans have also weighed on sentiment. Amazon’s projected $200 billion in 2026 capex significantly exceeded the consensus estimate of $146.11 billion.
Despite those concerns, Morgan Stanley analyst Brian Nowak struck an optimistic tone, noting that AWS is gaining momentum with stronger growth ahead, while Amazon’s retail business continues to improve efficiency. Although the company is ramping up investment across AWS, Retail, and its low-Earth-orbit initiatives, Nowak highlighted Amazon’s solid history of delivering returns on invested capital, keeping the firm bullish on what it views as an underappreciated GenAI leader.
Amazon’s guidance followed closely on the heels of Alphabet (NASDAQ: GOOGL), which also surprised investors earlier in the week with plans to spend as much as $185 billion in capital expenditures in 2026.
On the earnings front, Amazon narrowly missed profit expectations, posting earnings of $1.95 per share—one cent below forecasts—on revenue of $213.39 billion for Q4 2025, representing a 13.6% year-over-year increase. Revenue exceeded the consensus estimate of $211.27 billion.
Emarketer principal analyst Sky Canaves described the results as slightly mixed, citing strong overall revenue growth and a notable acceleration in the cloud business, which had been closely watched by investors.
Looking ahead, Amazon forecast first-quarter 2026 revenue in the range of $173.5 billion to $178.5 billion, compared with analyst expectations of $175.2 billion.
CEO Andy Jassy said the company plans to invest heavily in areas such as AI, custom chips, robotics, and low-Earth-orbit satellites, adding that Amazon expects these investments to generate strong long-term returns on invested capital despite the elevated spending outlook.
An overview of AWS
For Amazon, one of the Magnificent Seven, Amazon Web Services (AWS) sits at the core of its AI strategy and remains its fastest-expanding business. AWS generated $35.58 billion in revenue in Q4, marking a 23.6% year-over-year increase. Beyond cloud services, the unit includes Amazon’s AI development platforms and infrastructure—such as Bedrock—as well as products like Alexa and Polly.
According to Emarketer analyst Canaves, AWS delivered an uncommon performance in Q4 by outpacing the advertising segment’s growth while also improving operating margins. Amazon has also deepened its exposure to AI through a substantial investment in Anthropic, the startup behind the Claude AI models.
Amazon revealed in October that it had added 3.8 gigawatts of cloud computing capacity over the past year—more than any rival provider. CEO Andy Jassy noted during the earnings call that AWS’s power capacity has doubled since 2022 and is expected to double again by 2027.
UBS has argued that the market is not fully accounting for the implications of Amazon’s aggressive capital expenditure plans. The bank raised its combined CapEx forecast for 4Q25–4Q27 to $344 billion from $300 billion, including an increase in AWS investment estimates from $225 billion to $260 billion.
UBS analysts Stephen Ju and Vanessa Fong believe Amazon shares remain undervalued, as neither they nor broader markets are factoring in the possibility that AWS revenue could double by 2028. They estimate this scenario could generate an additional $20 billion in free cash flow that year.
Despite these growth drivers, Amazon’s stock has lagged its Magnificent Seven peers. Shares rose just 5.2% in 2024—the weakest performance among the group—and trailed the S&P 500’s 16.4% gain. Performance in the current year has also been modest, with Amazon up 0.9% year-to-date, compared with the S&P 500’s 0.5% increase.
While AI continues to attract attention, Amazon’s core business is still its e-commerce, retail, and subscription services—primarily housed in its North America segment. This division posted Q4 revenue of $127.08 billion, up 9.9% year over year.
Consumer spending faced increasing pressure last year amid economic challenges. The National Retail Federation projects 2025 holiday sales growth of 4.1%, down from 4.3% in 2024, while consumer confidence has recently dropped to its lowest level since May 2014.
Even so, Amazon’s retail operations showed resilience during the critical holiday season. Canaves noted that profitability in North America improved due to stronger fulfillment efficiency, despite faster delivery rollouts. Meanwhile, Amazon’s AI shopping assistant, Rufus, is gaining adoption and contributing to higher sales among users.
Macquarie has updated its 2026 outlook for gold and silver, pointing to extreme volatility and recent geopolitical and policy-driven shocks as the main catalysts.
Strategist Peter Taylor noted that the bank had previously flagged the risk of gold reaching $5,000 per ounce amid concerns surrounding the Federal Reserve chair—a scenario that ultimately materialized. He also warned that silver was vulnerable to a sharp pullback, given its tendency to gap lower.
Macquarie raised its average gold price forecast for the first quarter of 2026 to $4,590 per ounce from $4,300, while its second-quarter estimate was lifted to $4,300 from $4,200. The bank also increased its full-year 2026 gold forecast to $4,323 per ounce, up from $4,225.
For silver, the Q1 target was raised sharply to $75 from $55, with the 2026 average forecast increased to $62 from $57.
Taylor emphasized that market conditions in January were exceptionally volatile, citing events such as threats of a criminal indictment against the Fed chair by the U.S. Department of Justice, the arrest and extradition of Venezuela’s Maduro, renewed focus on Greenland alongside potential tariffs on some NATO countries, and a buildup of military forces around Iran.
He added that while commodities broadly delivered strong gains, price movements were often detached from underlying fundamentals.
“Overall, this resulted in one of the strongest monthly performances for the commodities complex in recent history,” Taylor said.
Macquarie said it is holding off on revising longer-term forecasts for gold and silver, pointing to the ongoing disconnect between fundamentals and the unusually high volatility in precious metals markets.
Despite a turbulent week that ended with a rebound on Friday, both the S&P 500 and Nasdaq are on track to finish lower, weighed down by steep losses in technology stocks.
Below are Investing.com’s stocks of the week:
Walmart
As volatility rocked the tech sector, investors rotated into more defensive names, lifting Walmart shares by more than 11% over the week. The rally pushed the stock above $130, taking Walmart’s market capitalization past the $1 trillion mark.
PayPal
PayPal shares plunged over 20% on Tuesday and are down more than 23% for the week after the company reported fourth-quarter earnings and revenue that fell short of analysts’ forecasts.
The company also announced a major leadership change, naming Enrique Lores as President and CEO effective March 1, 2026, replacing Alex Chriss.
Commenting on the results, Wolfe Research analyst Darrin Peller said that while a miss and a weak 2026 outlook were anticipated, both were worse than expected, raising “greater questions around execution and market share and competition.”
Novo Nordisk
Novo Nordisk’s stock dropped more than 14% on Tuesday and has slid over 21% in the past week.
The maker of Wegovy reported fourth-quarter earnings and issued a sales warning for 2026.
According to BMO Capital analyst Evan Seigerman, the company is facing significant pricing pressure in the U.S. following Trump MFN deals and additional efforts required to maintain access in the obesity treatment market.
“Although there are early indications of growth for the oral Wegovy pill, pricing concessions on injectable GLP-1 treatments are weighing on overall revenue, effectively offsetting gains from the pill segment.”
Silicon Laboratories
Silicon Labs shares jumped more than 48% on Wednesday and are on track to finish the week up roughly 44% after announcing it will be acquired by Texas Instruments.
Texas Instruments agreed to pay about $231 per share in an all-cash deal, valuing the company at approximately $7.5 billion on an enterprise basis.
Strategy
After sliding for much of the week, MSTR rebounded sharply on Friday and is currently up more than 24% for the day. Despite the bounce, the stock is still set to end the week down around 5%.
The move mirrored Bitcoin’s price action, which fell to around $62,200 on Thursday before rebounding to above $70,100 on Friday.
In a client note, Benchmark analyst Mark Palmer reaffirmed a Buy rating and a $705 price target, saying the firm remains bullish based on a sum-of-the-parts valuation. This includes the projected value of the company’s Bitcoin holdings by year-end 2026, a 10x multiple on its estimated FY26 Bitcoin gains, and the expected value of its software business by YE26.
Palmer added that the target assumes Bitcoin reaches $225,000 by the end of 2026.
Amazon
Amazon shares fell sharply on Friday, down more than 5%, as investors reacted to the company’s latest quarterly earnings report released after the market closed on Thursday.
The tech heavyweight exceeded expectations on quarterly revenue but surprised markets by projecting capital spending of roughly $200 billion in 2026, well above forecasts.
Commenting on the outlook, Morgan Stanley analyst Brian Nowak said AWS is gaining momentum with even stronger growth ahead, while the retail segment continues to improve efficiency. Although Amazon is ramping up investment across AWS, Retail, and LEO, he noted the company’s strong track record in generating returns on invested capital, keeping the firm bullish on what it sees as an underappreciated GenAI leader.
Early on, some questionable US labor market data set the tone, but the real catalyst was the shift to a risk-off mood. Day two is often decisive. We also cover updates from the ECB and BoE—no policy changes, but plenty of developments.
A growing sense of decay fuels demand for Treasuries
Markets reacted sharply to weaker US labor data on Thursday—arguably an overreaction. Challenger job cuts came in elevated, and headlines noting the highest January reading since 2009 quickly raised alarm. However, a higher figure was recorded as recently as October 2025, and the series itself is notoriously volatile.
A move lower in yields was the appropriate response, but the magnitude was reinforced by subsequent JOLTS data, which showed job openings falling more than expected. Openings remain sizeable at around 6.5 million, though down from 7.2 million. Initial jobless claims also edged higher, but the increase was modest and levels remain low in a broader historical context.
Broader market dynamics added fuel to the move. A pronounced risk-off backdrop—particularly concerns surrounding private credit—typically channels demand into Treasuries. Technical factors also played a role, with key thresholds giving way: the 10-year yield broke below 4.2%, while the 2-year slipped under 3.45%. While not extreme relative to recent months, the move was nevertheless notable. Hard to fight the move, particularly if the risk-off reassessment proves durable.
ECB meeting takes a back seat to global risk sentiment
A dovish tilt from the Bank of England, softer US labor signals, and persistent equity-market jitters have had a greater influence on markets than the ECB, with the 2s10s Bund curve modestly reflattening in a bullish move—still comfortably within recent ranges. The VIX remains elevated, indicating ongoing caution around potential equity volatility. While there has been no broad-based equity sell-off, investors are becoming more discerning about the sustainability of AI-driven business models.
ECB President Lagarde appeared to downplay the role of the exchange rate in the policy outlook, though our economists see it as a lingering vulnerability in the ECB’s “good place” narrative. In the near term, tail risks remain skewed toward further easing, even as the threshold for a rate cut stays high. Markets are currently pricing roughly a 25% chance of a cut later this year, which we view as reasonable. This pricing keeps the front end of the euro curve well anchored, implying that any further deterioration in global risk sentiment—stemming from outside the euro area—would likely continue to flatten the curve. That said, a concurrent strengthening of the euro would complicate the curve dynamics.
A dovish BoE fails to outweigh mounting political risks
Markets reacted far more strongly to the Bank of England meeting than to the ECB, with a March rate cut rapidly becoming the base-case scenario. The BoE’s relatively sparse inter-meeting communication means that policy surprises tend to generate outsized moves, and this meeting delivered just that. The 2-year swap rate dropped around 7bp as the outcome proved more dovish than markets had anticipated. We are broadly aligned with the revised pricing and see considerable scope for easing as inflation continues to soften. Governor Bailey appeared to endorse this view, later remarking that current market pricing for a March cut was “not a bad place to be.”
Attention now shifts to the long end of the curve, where political risks may continue to exert upward pressure on 30-year gilt yields. Unlike the front end, the 30-year yield actually rose by roughly 3bp on Thursday despite the BoE’s dovish pivot. Political uncertainty—particularly around Starmer’s position as prime minister—adds to doubts over the future fiscal trajectory. Ahead of November’s budget, we had estimated the 10-year gilt risk premium at around 25bp, underscoring investor sensitivity to the UK’s fiscal outlook. Against this backdrop, we see limited scope for 10-year GBP rates to move meaningfully lower in the near term.
Friday: Key Events and Market Outlook
Softer US labor indicators weighed on risk sentiment on Thursday. While Friday does not bring the official jobs report, attention will turn to the preliminary University of Michigan consumer sentiment index. Consensus expectations point to a weaker reading, but any sharper-than-anticipated deterioration would likely amplify existing market unease. Consumer credit data, also due on Friday, will be another point of focus.
In the euro area, the ECB will publish its Survey of Professional Forecasters. Following the ECB meeting, markets will also listen closely to remarks from ECB officials, with Kocher and Cipollone scheduled to speak. Elsewhere, BoE Chief Economist Huw Pill is also on the agenda.
On the supply side, government issuance is limited, with the only primary market activity being a €0.5bn Belgian ORI auction.
The Bank of England held its policy rate at 3.75%, but the decision revealed a notably divided committee, with four of the nine members voting in favor of another cut. This close split has reinforced expectations for a rate reduction as soon as March, particularly as inflation continues to ease and wage growth shows signs of cooling.
The BoE now estimates that wage growth consistent with its 2% inflation target is roughly 3.25%, only slightly below current private-sector pay growth of about 3.6%. With inflation projected to fall toward 1.8% by April, the central bank appears increasingly comfortable with the prospect of further policy easing.
Governor Andrew Bailey remains a pivotal swing vote, and if upcoming data confirms a softer labor market and moderating pay growth, he is widely expected to back a rate cut at the next meeting. Markets are already pricing in additional easing through the summer months.
GBP/USD Technical Perspective
GBP/USD has been trending lower, reflecting expectations of Bank of England rate cuts and a broadly dovish policy outlook.
On the four-hour chart, the pair continues to trade within a well-defined descending channel, currently hovering around 1.3536. This structure indicates that sellers remain in control for the time being.
That said, a notable support zone sits near 1.34, aligning with a previous accumulation area. A break lower within the channel could see price gravitate toward that level.
Conversely, a move above the upper boundary of the channel would signal a shift in momentum and could open the door to a rebound toward the 1.37–1.38 area in the near term.
Summary:
Trend: Bearish, within a descending channel
Support: 1.34
Resistance: 1.37–1.38
Key Catalyst: March Bank of England policy meeting
ECB Remains Comfortably on Hold
The European Central Bank left interest rates unchanged, signaling confidence that the eurozone economy remains in a solid position. Inflation is tracking close to the 2% target, growth is stable, and there is little immediate need to either tighten or ease policy.
That said, past experience suggests the ECB is willing to resume rate cuts after extended pauses if conditions evolve. A meaningful appreciation in the euro or a dip in inflation below target could prompt policymakers to consider a modest “insurance cut” later in the year to guard against undershooting inflation.
For now, however, the ECB appears comfortable remaining on hold, a stance that has translated into relatively calm market conditions.
EUR/USD Technical Perspective
EUR/USD continues to consolidate in a narrow range between 1.1780 and 1.1840, reflecting the ECB’s steady policy stance and a broader lack of directional conviction. Volatility remains subdued, underscoring ongoing market indecision.
A renewed move lower could develop if expectations build around further ECB easing, or if euro strength becomes a concern for policymakers. Until a clear catalyst emerges, price action is likely to remain range-bound, with consolidation dominating near-term trading.
Summary:
Trend: Sideways / range-bound
Range: 1.1780–1.1840
Downside risk: A decisive break below 1.1780 would expose a move toward 1.1700
Catalyst: Shift in ECB tone or renewed concerns over excessive euro strength
In short:
The BoE’s dovish stance is pressuring the pound, leaving GBP/USD biased lower.
The ECB’s steady, wait-and-see approach is keeping the euro supported, though excessive euro strength could revive rate-cut speculation.
With both central banks leaning dovish, the next meaningful FX moves are likely to be driven by shifts in rate expectations, not policy surprises.
EUR/USD remains technically constructive, consolidating after a strong push toward recent highs. While short-term momentum has eased, the price action continues to reflect a pause within a broader uptrend rather than a trend reversal.
Attention now turns to whether the pair can hold key support levels and reassert upside momentum in the sessions ahead.
From a medium-term standpoint, EUR/USD continues to exhibit a well-defined bullish structure, marked by a sequence of higher highs and higher lows. The recent pullback comes after a sharp rally and appears corrective, suggesting profit-taking rather than a meaningful change in the underlying trend.
Notably, downside momentum has been contained, supporting the view that buyers are still stepping in on dips.
Moving Averages Continue to Act as Dynamic Support
Price is currently holding near and above the 15-day and 20-day moving averages, both of which continue to slope higher.
Key technical takeaways:
Moving averages are still functioning as dynamic support
Pullbacks have been modest relative to the preceding advance
No decisive break has occurred to signal deterioration in the trend
As long as EUR/USD remains above these moving averages, the broader technical outlook stays constructive.
Momentum: RSI Cools Without Undermining the Trend
The 14-day RSI has pulled back toward the low-50s after previously reaching elevated readings.
This momentum behavior suggests:
A healthy reset following strong upside momentum
Reduced risk of near-term overextension
Conditions more consistent with consolidation than exhaustion
Importantly, there is no clear bearish divergence, reinforcing the view that the broader trend remains intact.
Key Technical Zone: 1.1780–1.1820 in Focus
The 1.1780–1.1820 area has become a key technical reference zone:
It previously served as resistance prior to the recent breakout
It is now acting as near-term support
A sustained hold above this range would strengthen the case for bullish continuation
A failure to hold this zone could allow for a deeper pullback toward the moving averages, though such a move would still be considered corrective unless support is decisively broken.
Broader Market Backdrop
EUR/USD continues to be closely influenced by:
Broader trends in the U.S. dollar
Changes in global risk sentiment
Evolving expectations around relative monetary policy trajectories
For now, the technical backdrop suggests that euro resilience remains intact, as long as external conditions stay broadly supportive.
Outlook
EUR/USD appears to be shifting from trend extension into a consolidation phase:
Holding above key support: The upside bias remains intact
Sideways consolidation: Would help reinforce the durability of the trend
Break below moving averages: Needed to meaningfully weaken the outlook
Until such confirmation occurs, the balance of technical evidence continues to favor the bullish scenario.
Overall, EUR/USD is consolidating following a strong advance, but the broader technical structure remains supportive. Momentum has eased in a constructive manner, key support levels are holding, and price action continues to point toward stabilization rather than reversal.
As long as EUR/USD remains above established support zones, the uptrend stays intact, with scope for renewed upside once the consolidation phase resolves.
Gold futures are currently trading around 4,841.7, holding steady above the VC PMI daily Buy 1 level at 4,765 and the Buy 2 support at 4,640. This price action suggests the market has entered a well-defined mean-reversion accumulation zone. It reflects the natural interaction between price and time cycles, where markets extend into extreme areas before reverting toward equilibrium.
The VC PMI daily mean at 4,905 now acts as the key price magnet. A sustained close above this level would signal the return of bullish momentum, potentially paving the way for a move toward Sell 1 at 5,030 and Sell 2 at 5,170.
On the weekly timeframe, the VC PMI mean at 5,024 aligns closely with an upper resistance cluster and Square of 9 harmonic geometry. This confluence implies that once price establishes itself above the 4,905 mean, upside momentum could accelerate rapidly toward the 5,000–5,170 zone.
The Square of 9 framework suggests current price action is progressing through a harmonic relationship between time and price, with the next cycle window extending into mid-February. These cycle windows often mark potential inflection points, where volatility expands and directional conviction strengthens.
From a structural perspective, maintaining levels above 4,765 preserves the bullish accumulation framework and indicates that institutional demand continues to absorb selling pressure. The deeper support at 4,640 marks the lower extreme of the daily cycle. A decisive break below that level would suggest the market is not yet ready to complete its bullish phase and could prompt a retracement toward lower weekly support zones.
However, as long as price holds above the 4,640–4,765 support zone, the odds continue to favor a mean-reversion advance toward the 5,030 and 5,170 upside targets.
By integrating VC PMI price levels, time cycles, and Square of 9 geometry, this framework offers a structured way to identify high-probability turning points. Markets operate in recurring phases of expansion and contraction, and these tools are designed to quantify those cycles with consistency, discipline, and objectivity.
Bitcoin may be extended and capable of sharp countertrend bounces, but the broader signal is clearly weakening. When market leaders begin to roll over and assets start moving in lockstep, liquidity is usually the underlying issue.
When risk assets move together, it’s rarely intentional. Dispersion has collapsed, leadership is breaking down, and liquidity is retreating to the sidelines. Volatility is no longer being absorbed—it’s being amplified.
The extent of the damage matters. The very assets that led the risk rally are now suffering the most, not because the narrative has shifted, but because capital is being withdrawn rather than reallocated. That’s how selloffs become disorderly.
Signs of stress are already emerging in rates markets. Expectations for Federal Reserve easing this year have surged from 41 basis points to 61 basis points in just a few days—nearly a full rate cut being priced in within a week. Markets don’t make that kind of adjustment unless financial conditions are tightening rapidly.
Bitcoin is deeply stretched and prone to sharp countertrend rallies, but being oversold does not mean the downside is finished. This feels like the phase where correlations converge, risk assets move as one, and capital preservation takes precedence.
BTC/USD Price Action Deteriorates Sharply
My long-held view is that bitcoin’s price is ultimately driven by its own price action. Whatever the underlying catalysts, the market repeatedly failed to break above the $123,600 level in the second half of last year, with four separate weekly rejections at that resistance. That ceiling capped the advance and set the stage for a pullback toward the $99,800 support area, before price eventually slipped below the 50-week moving average—a level that had consistently provided support throughout last year’s uptrend.
From there, downside momentum intensified. Bitcoin broke decisively through the $99,800 support and then consolidated within a rising wedge, a bearish continuation pattern, before breaking down last week on a clear surge in volume. The move below $74,400 triggered a sharp acceleration lower, pointing to forced liquidations of long positions rather than orderly selling.
So far, price has rebounded from around $60,000, which is not surprising given how stretched conditions have become. Bitcoin remains well below the lower Bollinger Band, RSI is deeply oversold, and MACD is at extreme levels by historical standards. A rebound toward $74,400 is therefore quite possible, but unless that level is decisively reclaimed, any rally is likely to be sold into.
On the downside, there is limited meaningful support below $60,000 until roughly $49,400—a level that served as both support and resistance during parts of 2024.
It’s striking that the S&P 500 is only about 2–3% below its all-time high given the turmoil seen across other areas of the market. On Thursday alone, silver and bitcoin fell by roughly 20% and 13%, respectively. For the moment, the index is hovering near the 6,800 level, supported by gamma-related positioning, though that support can shift quickly. A break below 6,800 would likely expose the next support zone around 6,700–6,720.
Based on some of the post-earnings price action late last evening, there is also a meaningful risk that the index opens with a downside gap.
At present, the VIX remains below the three-month VIX index, indicating that the volatility curve has not yet moved into backwardation. This suggests that implied volatility is increasing across maturities, but the market has not yet experienced a full-fledged spike in fear.
In addition, the dispersion index minus the three-month implied correlation index is still near the top of its range, indicating that the broader unwind has yet to begin.
At this stage, NVIDIA (NASDAQ: NVDA) appears to be one of the few pillars supporting the broader market, having held above the $170 level since July. That area represents a key support zone and can reasonably be viewed as the neckline of a potential head-and-shoulders pattern. A decisive break below $170 would likely signal further downside for NVIDIA and could also act as a catalyst for a wider breakdown across the major equity indexes.
Viewed through a second-order lens, the prevailing narrative suggests that AI could disrupt—or even undermine—the traditional SaaS business model. That naturally leads to a third-order question: if the SaaS model falters, who will be left to purchase AI models from the hyperscalers? And if hyperscalers struggle to earn adequate returns, who ultimately continues to drive demand for GPUs from NVIDIA?
Ironically—or perhaps predictably—the software sector topped out before NVIDIA did. With software stocks now turning lower, the key question is whether NVIDIA will eventually follow the same trajectory.
Gold, silver, and mining stocks did initially move higher, but the rally was short-lived. Prices reversed intraday and then pushed lower, with the declines continuing today—benefiting all of our open trading positions. Hopefully, you followed the recommendation to short bitcoin, as previously emphasized.
The key question now is whether the corrective rebound has already run its course. In today’s analysis, the focus is on bitcoin and the equity market, as both remain closely linked to the performance of precious metals.
At this point, the odds appear evenly balanced. I’d put the chances at roughly 50/50, largely due to the factors driving the current pullback, at least over the near term.
Looking Beyond the U.S. Dollar
The U.S. Dollar Index has rallied recently, and while it was one of the drivers behind last week’s decline in precious metals, it does not account for this week’s weakness, as the USDX has been relatively subdued.
So what drove the sharp selloff in silver and mining stocks? What triggered the move—aside from the fact that both markets were extremely overbought from a technical standpoint?
The key driver was the sharp drop in equities. While the S&P 500’s decline may not appear dramatic on the surface, it is notable given the unusually low volatility that had prevailed in recent months.
That situation is likely to shift. Some traders may even consider exposure to VIX-related instruments or call options, though shorting bitcoin arguably offers greater leverage.
Equities have moved back toward their recent lows, and silver and mining stocks followed suit. This type of synchronized behavior is typical—and closely mirrors the market dynamics observed in 2008.
And this is where the situation turns especially grim
The stock market is now in a position similar to where it stood last year. After multiple attempts, it failed to hold a breakout above the prior year’s highs, effectively invalidating that move. The market also peaked shortly after reaching the vertex formed by earlier support and resistance lines.
If this pattern plays out again, the S&P 500 could fall toward the 6,300 area in the near term, stage a corrective rebound, and then slide further toward roughly 5,500.
Could it really drop that far?
Yes.
And in fact, a move to 5,500 may not mark the end of the market’s broader decline.
The AI Bubble Is Bursting
If the AI bubble does burst—and the sharp selloff in bitcoin suggests that risk appetite may already be cracking—the broader stock market could face a severe downturn. Much of the market’s prior strength was driven by aggressive buying in tech and AI-related names in the first place.
On the topic of bitcoin, here’s what I noted in yesterday’s Gold Trading Alert when discussing its recent “rebound”:
And while we’re on the subject of rebound magnitude, this is bitcoin’s rebound that barely qualifies as one. While prices did tick higher briefly, the move is almost imperceptible when viewed against the scale of the prior decline, visible only on very short-term charts.
This further underscores bitcoin’s underlying weakness and reinforces the case that gains on our short positions were likely to expand in the near term.
And that is precisely what unfolded.
The encouraging takeaway is that bitcoin still appears to have further downside ahead, suggesting our profits are likely to continue growing. The next meaningful support sits just below $60,000, though a brief drop toward the $50,000 level—a key round number and prior low—remains possible.
Such a move could, but does not necessarily have to, spark a rebound similar to the consolidation seen in 2024. If that scenario unfolds, it would likely form the right shoulder of a head-and-shoulders pattern, which could ultimately point to a much deeper decline toward the $30,000–$35,000 range.
So what does all of this mean for the precious metals market?
It suggests that a 2008-style crisis could indeed unfold again in the coming months.
This is a critical point. Although there is limited data to confirm it conclusively, silver and mining stocks have so far shown a strong correlation with the broader equity market’s performance.
Assessing the daily charts for gold and silver futures against a backdrop of rising trader anxiety, it is clear that the outcome of the meeting between U.S. and Iranian diplomats could soon determine the next directional move once markets receive clearer signals.
Volatility in both gold and silver futures has surged, leaving prices highly sensitive to the meeting’s outcome. Gold futures opened at $4,722.30, dipped to an intraday low of $4,671.74, and then rallied to trade near the session high around $4,907—just below immediate resistance at $4,938.55. This price action reflects mounting concern as U.S.–Iran talks begin amid fears of a potential direct conflict.
Despite the heightened tension, the situation remains unresolved. The U.S. is reportedly pressing Iran to freeze its nuclear program, dismantle its uranium stockpile, and expand discussions to include ballistic missiles, regional proxy support, and human rights issues. Iran, however, has stated that talks will be limited strictly to its nuclear program, and it remains unclear whether these fundamental differences have been bridged.
In recent weeks, President Donald Trump has warned of military action if a deal is not reached, while the U.S. has deployed thousands of troops and significant naval and air assets to the region. Iran has responded with threats of retaliation, including strikes on U.S. military targets in the Middle East and Israel.
This marks the first direct engagement between U.S. and Iranian officials since last June’s Israel–Iran conflict, during which U.S. forces struck Iran’s three primary nuclear facilities. Iran has since claimed that its uranium enrichment activities ceased following those attacks.
Meanwhile, precious metals have endured an extended selloff since last week. Initial pressure stemmed from President Trump’s nomination of Kevin Warsh as the next Federal Reserve chair, a move interpreted as less dovish and supportive of a stronger U.S. dollar. The dollar is now on track for its strongest weekly performance since early October, with soft labor data doing little to halt its advance.
Looking ahead, any indication that talks may ease tensions between the U.S. and Iran could spark renewed selling in gold and silver, even though both futures have already rebounded modestly from their intraday lows. At this stage, dissecting technical rebounds or exhaustion signals may be premature. Instead, the focus remains squarely on the diplomatic outcome and whether it ultimately de-escalates the situation—or deepens existing tensions.
Looking at the current positioning of the spot gold–silver ratio, today’s session saw it test an intraday high of 72.77 and a low of 65.10, with the ratio currently trading around 66.39. This movement suggests that gold and silver futures may revisit price levels last seen between December 1 and 16, 2025—when gold futures were trading in the $4,207 to $4,340 range and silver futures were between $57 and $65.
Gold futures are currently trading above the key 50-EMA support near $4,580, while remaining capped below the immediate 9-EMA resistance around $4,885, after successfully holding above the short-term 20-EMA support at approximately $4,824.
Meanwhile, silver futures are holding above the key 100-EMA support near $62.692, but continue to trade below the immediate resistance at the 50-EMA around $74.252.
In summary, any constructive outcome from the meeting could prompt renewed selling pressure across both precious metals, while renewed disagreement between the two countries may spark a bout of buying. However, any upside could remain vulnerable to fresh selling, as follow-up commentary from the U.S. President after the meeting is likely to play a decisive role in shaping market sentiment.
After posting disappointing earnings after the market closed on February 4, Qualcomm (NASDAQ: QCOM) left investors questioning what has gone wrong. The stock has since fallen below $140, down from $185 just a month ago—a sharp decline in a short time, capped by a steep selloff following Thursday morning’s earnings reaction.
Most notably, Qualcomm has now erased all the gains it painstakingly built over the past two years. The stock has fallen back to its 2020 levels—an unsettling spot for a company that has consistently positioned itself as a semiconductor player well placed to benefit from the AI boom.
Heading into earnings with already fragile sentiment, Qualcomm’s Q1 results did little to reinforce confidence in its long-term story. (Qualcomm’s fiscal year runs ahead of the calendar year.) While the headline figures stopped short of a major miss, management’s downbeat forward guidance was enough to spark another sharp deterioration in investor sentiment. That said, does this selloff present an opportunity for risk-tolerant investors, or was the pessimistic outlook a warning that’s simply too loud to dismiss? Let’s dig in.
Why Long-Term Investors Should Take This as a Red Flag
The key concern raised by the latest report is what it reveals about Qualcomm’s underlying structural headwinds. Management cited continued industry pressures stemming from memory supply limitations and weaker handset demand. While these challenges are not exclusive to Qualcomm, they carry greater weight given the company’s ongoing reliance on smartphones, despite its efforts to diversify. Automotive, Internet of Things (IoT), and licensing are still presented as growth drivers, but so far they have not been sufficient to counterbalance downturns in the core business when market conditions weaken.
This is significant because Qualcomm has a history of failing to sustain upside momentum. Each time enthusiasm builds around a rally or its diversification story, the stock has ultimately reversed course, and the latest selloff aligns uncomfortably well with that pattern. As a result, the market is once again justified in questioning whether Qualcomm can generate lasting growth rather than short-lived recoveries.
Analyst sentiment has also clearly deteriorated. In response to the earnings release, several firms reiterated neutral ratings or downgraded their outlooks. In some instances, the commentary turned explicitly bearish, with HSBC noting that it may be “difficult to forecast a potential bottom.”
The consequence is a meaningful erosion of credibility. Long-term shareholders who endured multiple cycles are now faced with a stock that has delivered little progress over the past five years, despite repeated assurances of strategic transformation. Viewed through that lens, this earnings report appears less like a reset and more like a clear warning sign.
Where Short-Term Traders May Spot an Opportunity
That said, while the long-term outlook appears impaired, the near-term technical picture may be telling a different story. The speed and severity of the selloff have driven Qualcomm into deeply oversold territory, with momentum indicators reaching extremes rarely seen over the past decade. While this does not guarantee a sustained recovery, it does raise the likelihood of a sharp relief bounce, particularly as selling pressure begins to fade.
There are already tentative signs of this process taking shape. After opening sharply lower in the session following earnings, the stock began to find support by the afternoon. How this behavior develops in the days ahead will be worth watching.
Even among analysts who have adopted a more cautious stance, many updated price targets still sit well above current levels. Bank of America, for instance, maintains a $155 target, while Cantor Fitzgerald sees value up to $160. Rosenblatt went a step further, reiterating its Buy rating with a $190 price target.
Whether those targets are ultimately justified over the coming year remains open to debate, but in the near term, they support the notion that bearish sentiment may have become stretched.
How to Approach the Current Setup
The crucial point is to clearly distinguish between investing and trading. From a long-term investment perspective, this report surfaces some uncomfortable issues. Until Qualcomm demonstrates an ability to deliver consistent growth and maintain its gains, a cautious and patient approach is justified.
For short-term traders, however, the setup looks different. Deeply oversold conditions, sharp price swings, and widespread pessimism can create conditions where relief rallies are swift and potentially lucrative—provided risk is managed carefully.
Japanese yen bears trimmed positions ahead of Japan’s snap election on Sunday, allowing the currency to recover modestly. Growing speculation of an imminent Bank of Japan rate hike, combined with a broader risk-off mood, has also supported the safe-haven yen. Meanwhile, the U.S. dollar paused its recent rebound from a four-year low, adding further downside pressure on USD/JPY.
The Japanese yen attracted modest buying during Asian trading on Friday, appearing to snap a five-day losing streak against the U.S. dollar after touching a two-week low in the previous session. Traders remain alert to the possibility of coordinated Japan–U.S. intervention to curb further yen weakness, while a shift in global risk sentiment and elevated market volatility have boosted demand for the currency’s safe-haven appeal. Expectations for a more hawkish Bank of Japan have also provided underlying support to the yen.
Data released earlier showed Japan’s household spending fell sharply in December, highlighting the impact of higher prices on consumer activity and reinforcing expectations that the BoJ could move toward a rate hike sooner rather than later. That said, concerns about Japan’s fiscal position and ongoing political uncertainty may limit aggressive bullish positioning in the yen. In addition, the U.S. dollar’s recent recovery from a four-year low could help cap further declines in USD/JPY as markets look ahead to Japan’s snap lower house election on February 8.
Yen finds support from hawkish BoJ outlook and improving risk sentiment
Data released earlier on Friday showed that Japan’s Household Spending fell 2.6% YoY in December 2025, reversing a 2.9% increase in the previous month. The sharp contraction highlights the drag from elevated living costs on consumption and reinforces the Bank of Japan’s resolve to tackle inflation, strengthening the case for an earlier interest rate hike.
This view is supported by the Summary of Opinions from the BoJ’s January meeting, which revealed that policymakers discussed rising price pressures stemming from a weak Japanese Yen and agreed that further rate hikes would be appropriate over time. These factors helped the JPY attract modest buying during the Asian session.
The Yen also benefited from a risk-off impulse, as Asian equities extended losses for a second straight day following a deepening selloff in global tech stocks. Meanwhile, the US Dollar paused its recent advance to a two-week high, prompting traders to trim USD/JPY long positions ahead of Japan’s snap lower house election on Sunday, February 8.
Japan’s Prime Minister Sanae Takaichi’s Liberal Democratic Party (LDP) is widely expected to secure a decisive victory, which would strengthen her control over parliament and provide greater scope to pursue aggressive pro-stimulus policies. However, markets remain concerned that expansionary fiscal plans could further strain Japan’s already fragile public finances, limiting the Yen’s upside.
From the US, data released Thursday showed that Initial Jobless Claims rose to 231K for the week ending January 31, up from 209K and above expectations of 212K, adding to weak private-sector employment data released earlier in the week. Further evidence of labor market softening came from the JOLTS report, which showed job openings falling to 6.542 million in December from a downwardly revised 6.928 million previously.
The softer labor backdrop has reinforced expectations for additional Federal Reserve easing, with markets currently pricing in two more rate cuts in 2026. This has capped the US Dollar’s rebound from a four-year low and contributed to USD/JPY pulling back modestly from the two-week high above the 157.00 level touched on Thursday.
Traders now await the preliminary Michigan Consumer Sentiment Index and inflation expectations, along with remarks from key FOMC members, for fresh directional cues later in the North American session. However, market reactions are likely to remain subdued ahead of Japan’s closely watched political event.
USD/JPY buyers remain in control after breaking above the 200-period SMA resistance on the H4 chart.
The overnight move above the 156.50 barrier, which aligns with the 200-period SMA on the 4-hour chart, marked an important catalyst for USD/JPY bulls. The gently rising SMA reflects a stable underlying uptrend, and prices remaining above it preserve a bullish tone. However, the MACD has dipped below its Signal line around the zero level, with the histogram turning negative and widening, pointing to a loss of upside momentum. Meanwhile, the RSI has retreated to 63 from overbought territory, highlighting a more tempered momentum backdrop.
As long as USD/JPY holds above the rising 200-period SMA, upside risks remain favored. A sustained break below this level would shift the focus toward a corrective pullback. From a momentum perspective, continued expansion of the negative MACD histogram would strengthen downside risks, while a swift move back above zero would negate the bearish crossover. The RSI staying above 50 continues to support the bullish case, whereas a slide toward that level would signal weakening buying interest.
USD/CAD edged lower as the commodity-linked Canadian dollar found support from a rebound in oil prices. Gains in WTI crude may be limited, however, after the U.S. and Iran agreed to hold talks in Oman on Friday, easing supply-related concerns. Meanwhile, the U.S. Dollar Index remained near two-week highs as markets continued to price in a slower pace of potential Federal Reserve rate cuts.
USD/CAD traded largely flat around the 1.3700 level during Asian hours on Friday after paring earlier gains, as the Canadian dollar drew support from a rebound in oil prices. West Texas Intermediate (WTI) crude recovered to around $63.50 at the time of writing, although further upside appeared limited after the United States and Iran agreed to hold talks in Oman later in the day.
Iran is expected to center discussions on its long-standing nuclear dispute with Western powers, while Washington is pushing to broaden the agenda to include Tehran’s ballistic missile program, its regional proxy activities, and human rights concerns.
The USD/CAD pair could regain upward momentum as the U.S. Dollar Index (DXY) remains close to two-week highs, underpinned by expectations for a slower pace of Federal Reserve rate cuts. Fed Governor Lisa Cook said she would not support additional easing without clearer evidence of cooling inflation, emphasizing greater concern over stalled disinflation than labor market softness.
Markets also assessed the implications of Kevin Warsh’s nomination as the next Fed chair, noting his preference for a smaller balance sheet and a more restrained approach to rate reductions—factors that have also helped ease concerns about the Fed’s independence.
Meanwhile, a series of U.S. labor market reports released this week pointed to cooling employment conditions, reinforcing dovish expectations for the Fed. Investors are now pricing in two rate cuts this year, beginning in June, with another potentially in September.
EUR/USD inched higher toward the 1.1770 area, finding modest support as the U.S. dollar struggled to extend its recent rally. Rising expectations of a more dovish Federal Reserve stance have capped further gains in the greenback. Meanwhile, the European Central Bank left interest rates unchanged at its policy meeting on Thursday, as widely expected.
The EUR/USD pair edged higher toward the 1.1770 area during Asian trading on Friday, as the U.S. dollar eased amid growing speculation that the Federal Reserve could cut interest rates at its March policy meeting. The pair attracted modest buying interest as expectations for Fed easing gained traction.
At the time of writing, the U.S. Dollar Index (DXY), which measures the greenback against a basket of six major currencies, was down 0.1% at around 97.85, although it remained close to Thursday’s weekly high of 97.98.
According to the CME FedWatch tool, the probability of a 25-basis-point rate cut—taking the fed funds rate to a 3.25%–3.50% range—at the March meeting has risen to 22.7%, from just 9.4% on Wednesday. Dovish Fed expectations have strengthened following a string of labor market indicators pointing to softer demand. December JOLTS data showed job openings fell to 6.542 million, well below estimates of 7.2 million and the prior 6.928 million. Meanwhile, ADP data released on Wednesday showed private sector payrolls rose by only 22,000 in January, down from 37,000 in December.
On the other hand, the euro remained broadly pressured despite the European Central Bank’s policy decision on Thursday. The ECB left interest rates unchanged, as expected, and played down the recent dip in eurozone inflation, reaffirming that inflation is likely to stabilize around its 2% target over the medium term. The central bank also cautioned about an uncertain geopolitical backdrop.
Silver prices slipped to around $71.90 during the Asian session on Friday, pressured by profit-taking and easing geopolitical tensions that reduced demand for safe-haven assets. Meanwhile, U.S. initial jobless claims rose more than expected last week, coming in above market forecasts.
Silver prices (XAG/USD) slid to around $71.90 during Asian trading on Friday, marking their lowest level since January 2, as the metal extended recent losses amid easing geopolitical tensions and profit-taking. Market participants are closely watching scheduled U.S.–Iran talks later in the day for further cues.
Diminishing tensions between Washington and Tehran have weighed on safe-haven demand for precious metals. Iran has signaled it wants discussions to center on its long-running nuclear dispute with Western powers, while the U.S. is pushing to broaden the agenda to include Iran’s ballistic missile program, its alleged support for armed groups in the Middle East, and its human rights record.
Analysts note that recent price action has been driven largely by speculative flows, leveraged positioning, and options-related trading rather than underlying physical demand. Sunil Garg, managing director at Lighthouse Canton, said a substantial buildup of speculative positions has yet to be fully unwound.
Meanwhile, signs of softening in the U.S. labor market could limit further downside by pressuring the U.S. dollar and lending some support to dollar-denominated commodities. Data from the U.S. Bureau of Labor Statistics showed job openings unexpectedly fell in December to their lowest level since 2020, while layoffs increased. In addition, applications for unemployment benefits rose more than anticipated last week.
The U.S. Dollar Index edged lower as recent labor market data pointed to cooling employment conditions, reinforcing expectations of a more dovish Federal Reserve. CME FedWatch data showed markets pricing in a 77.3% probability that the Fed will keep rates unchanged at its March meeting, with the first rate cut now expected in June. Despite the dip, the DXY remained near two-week highs as investors continued to factor in a slower pace of potential rate cuts.
The U.S. Dollar Index (DXY), which tracks the greenback against a basket of six major currencies, edged lower on Friday after posting gains over the previous two sessions, hovering around 97.90 during Asian trading hours. Market participants are awaiting the preliminary February Michigan Consumer Sentiment Index, due later in the North American session, for fresh direction.
The dollar softened as recent U.S. labor market data signaled cooling employment conditions, reinforcing expectations of a more dovish Federal Reserve stance. Markets are now pricing in two rate cuts this year, beginning in June and potentially followed by another in September. CME FedWatch data indicate a roughly 77.3% probability that the Fed will keep rates unchanged at its March meeting, with expectations centered on a first cut in June.
Labor Department figures showed initial jobless claims climbed to 231,000 in the week ended January 31, exceeding forecasts of 212,000 and the prior reading of 209,000. Meanwhile, ADP data revealed private payroll growth slowed sharply to 22,000 in January, well below expectations of 48,000 and the previous month’s revised 37,000.
Despite the pullback, the DXY remained near two-week highs, supported by expectations for a slower pace of Fed easing. Fed Governor Lisa Cook said she would not support further rate cuts without clearer evidence of easing inflation, highlighting greater concern over stalled disinflation than labor market softness.
Traders also assessed the implications of Kevin Warsh’s nomination as the next Fed chair, with markets noting his preference for a smaller balance sheet and a more restrained approach to rate cuts, while also easing concerns over the central bank’s independence.
Bitcoin plunged on Thursday to its lowest level since mid-October 2024, as thinning liquidity and a broad selloff in global technology stocks renewed pressure on risk assets. The world’s largest cryptocurrency was last down 12.4% at $63,539.4 by 17:28 ET (22:28 GMT).
The token has fallen in seven of the past eight sessions and is now down nearly 50% from its record high of around $126,000 reached in October 2025. Interactive Brokers chief strategist Steve Sosnick said the scale of the decline suggests the crypto market has moved beyond a normal cycle, describing it as a full-blown bear market given drawdowns of 40% to 50% or more.
Tailwinds that once boosted crypto now turning into headwinds
Bitcoin’s sharp selloff has intensified in recent days amid a broader rout in technology stocks, as investors rotate out of high-risk assets. According to Interactive Brokers strategist Steve Sosnick, several of the forces that fueled bitcoin and other cryptocurrencies’ rapid ascent in 2025 have now turned into headwinds.
Strong inflows following the launch of bitcoin ETFs in January 2024, the Trump administration’s supportive stance toward digital assets, and substantial purchases by crypto-focused treasury firms all helped drive prices higher, Sosnick said. He added that crypto also benefited during the rally from minimal margin constraints, as many exchanges and dealers offered extremely high leverage. Unlike stocks and ETFs, which are limited by Regulation T and similar rules, this leverage allowed investors to amplify gains—an effect that is now accelerating losses as prices fall.
After bitcoin surged to a record high above $126,000 on October 6, the broader cryptocurrency market experienced a sharp selloff just four days later. Analysts later described the move as a “flash crash,” attributing it to heavily leveraged dealers being forced to unwind positions amid margin-related losses.
Interactive Brokers strategist Steve Sosnick said that as market momentum shifted, several of the factors that had previously supported cryptocurrencies began to turn into headwinds. He noted that while leverage can significantly amplify gains during rallies, it can also sharply magnify losses during downturns. Sosnick added that progress on anticipated crypto regulation stalled in Congress, while equity-focused investors rotated toward other opportunities as momentum faded. He also pointed out that although exchange-traded funds made it easy for investors to gain crypto exposure, they also enabled swift exits when sentiment turned.
According to Sosnick, what began as a routine correction ultimately snowballed into a full-blown rout, mirroring selloffs seen in other assets that had posted outsized gains, including software stocks and precious metals.
Dwindling liquidity
Reports indicated that market liquidity was particularly thin, magnifying price swings and triggering a wave of forced liquidations as bitcoin fell through closely watched technical levels. The selloff was intensified by aggressive unwinding of leveraged positions—especially in derivatives markets—after bitcoin’s slide below $75,000 activated a series of stop-loss orders. Data from crypto analytics firm CoinGlass showed that nearly $770 million worth of cryptocurrency positions were liquidated over the past 24 hours.
Most major altcoins also moved sharply lower on Thursday. Ethereum, the world’s second-largest cryptocurrency, fell 11.5% to $1,878.11, while XRP, the third-largest token, plunged 21% to $1.19. Solana and Cardano recorded steep losses as well, sliding 11.9% and 11.1%, respectively. Meme coins were also hit hard, with Dogecoin down 12.1% and the $TRUMP token sinking more than 14%.
Global equities fell for a third straight session on Friday as the selloff on Wall Street intensified, while precious metals and cryptocurrencies were swept up in sharp volatility.
MSCI’s broad Asia-Pacific index excluding Japan dropped 1%, extending losses for a second day, led by a 5% plunge in South Korea’s Kospi that triggered a brief trading halt shortly after the open. S&P 500 e-mini futures declined 0.2%, while Nasdaq e-mini futures slid 0.4%. IG market analyst Tony Sycamore said investors were increasingly questioning their exposure to assets that have driven markets over the past six months—namely AI, cryptocurrencies and precious metals—raising the risk of a deeper unwinding. U.S. stocks sold off overnight on fears that new AI models could erode software-sector profitability, with the S&P 500 turning negative for the year amid growing labor market concerns.
U.S. employers announced a surge in layoffs in January, marking the highest level for the month in 17 years, according to data released Thursday by Challenger, Gray & Christmas.
Precious metals rebounded from session lows but remained weaker on the day. Gold slipped 0.1% to $4,764.43, while silver plunged as much as 10% before paring losses, last down 1.4% at $70.26.
Cryptocurrencies staged a rebound after suffering a $2 trillion market wipeout on Thursday. Bitcoin jumped 3.7% to $65,446.07 after earlier falling nearly 5% to a low of $60,008.52, while ether climbed 4.4% to $1,928.12 after reversing a prior 5.1% decline.
The S&P 500 software and services index sank 4.6%, shedding roughly $1 trillion in market capitalization since January 28 in a selloff dubbed “software-mageddon.” Pepperstone’s head of research Chris Weston said aggressive unwinding of crowded positions had driven large capital flows, warning that some companies—particularly outside the so-called Magnificent Seven—could face difficulties later this year as capital markets become less accommodating.
Amazon shares slid 11.5% in after-hours trading after the company projected capital spending to surge by more than 50% this year.
Markets have also begun to price in a higher probability of Federal Reserve policy easing, though expectations still favor no change at the next meeting. Fed funds futures imply a 22.7% chance of a 25-basis-point rate cut at the Fed’s March 18 meeting, up from 9.4% the previous day, according to CME Group’s FedWatch tool.
The U.S. dollar index was flat at 97.92, while the yield on the 10-year Treasury note fell 2.8 basis points to 4.18%. The yen strengthened 0.3% to 156.58 per dollar, and Japanese government bonds attracted buying ahead of Sunday’s election.
In energy markets, Brent crude slipped 0.4% to $67.31.
The U.S. dollar inched higher on Thursday, clawing back some strength amid ongoing volatility in equity markets, while attention turned to the euro and sterling following key central bank rate decisions. By 13:43 ET (18:43 GMT), the Dollar Index—which measures the greenback against a basket of six major currencies—was up 0.2% at 97.77, hovering near a two-week high and extending its rebound from levels close to four-year lows.
Stock market volatility lends support to the dollar
Heightened volatility across global equity markets—driven largely by concerns over stretched artificial intelligence spending—has prompted traders to rotate back into the U.S. dollar as a safe haven.
Analysts at ING noted that a more challenging equity backdrop typically triggers a move away from risk and pro-cyclical currencies toward the dollar, a dynamic they said has likely provided the greenback with some support this week. They added that while it remains unclear whether the current correction in U.S. technology stocks has further to run, a fully invested buy side appears increasingly vulnerable to negative surprises.
The dollar also found support late last week following the nomination of Kevin Warsh as the next Federal Reserve chair, with markets viewing him as less dovish than previously anticipated. Meanwhile, private payrolls data pointed to a cooling U.S. labor market, although the recent brief government shutdown has delayed the release of key employment figures scheduled for Friday.
Even so, several weak labor market signals emerged on Thursday. January job cuts rose to their highest level for that month since 2009, initial jobless claims exceeded expectations, and December job openings data fell short of forecasts.
Euro and pound move into focus
In Europe, the euro edged lower, with EUR/USD down 0.1% at 1.1799 after the European Central Bank left interest rates unchanged, in line with expectations. The ECB’s Governing Council said inflation is likely to stabilize around its 2% target over the medium term, while noting that the eurozone economy remains resilient despite a challenging global backdrop. Data released earlier in the week showed euro area CPI inflation eased to 1.7% year-on-year in January, from 1.9% in December.
Commenting on the decision, Mark Wall, chief European economist at Deutsche Bank, said the ECB was striking a necessary balance between downside risks and underlying strengths, adding that holding rates steady appeared appropriate given external vulnerabilities alongside domestic resilience, partly supported by increased defence and infrastructure spending in Germany.
Sterling also weakened, with GBP/USD falling 0.9% to 1.3544 after the Bank of England kept its benchmark rate unchanged. The Monetary Policy Committee said it expects inflation to return to its 2% target by the spring. Sanjay Raja, chief UK economist at Deutsche Bank, noted that while a rate cut was closer than anticipated, the meeting was more about positioning within the MPC, as rising economic trade-offs continue to fuel uncertainty over how restrictive current policy remains.
Yen in focus ahead of weekend elections
In Asian trading, USD/JPY edged 0.1% higher to 156.84, as the Japanese yen remained under pressure ahead of this weekend’s lower house elections. Prime Minister Sanae Takaichi’s party is widely expected to secure a larger majority, raising expectations of increased fiscal spending from Tokyo. Ongoing concerns about Japan’s stretched public finances have weighed heavily on the yen in recent weeks, with losses compounded by Takaichi’s remarks downplaying currency weakness.
Elsewhere, USD/CNY dipped slightly to 6.9378, with the Chinese yuan hovering near its strongest level in almost three years. The currency has been supported by a series of firm midpoint fixings from the People’s Bank of China, keeping the pair comfortably below the psychologically important 7.00 level.
The Australian dollar weakened, with AUD/USD sliding 0.4% to 0.6960, slipping back below 0.70 after two sessions of solid gains following a hawkish Reserve Bank of Australia meeting on Tuesday. The RBA raised interest rates by 25 basis points and upgraded its growth and inflation forecasts for the year.
U.S. stock index futures slipped on Thursday evening, extending Wall Street’s losses as the selloff in technology shares showed little sign of abating. Amazon.com led declines after forecasting a sharp increase in capital expenditures for 2026.
Futures weakened after another steeply negative session on Wall Street, where technology stocks fell amid ongoing concerns over AI-driven disruption within the software sector. Investors were also unsettled by elevated spending across the industry, with Amazon’s outlook echoing similar guidance from other major tech firms. By 18:30 ET (23:30 GMT), S&P 500 Futures were down 0.5% at 6,789.25, Nasdaq 100 Futures slid 0.9% to 24,422.0, and Dow Jones Futures fell 0.3% to 48,857.0.
Amazon plunges 11% after projecting higher-than-expected 2026 capex
Amazon.com Inc (NASDAQ: AMZN) was among the biggest laggards in after-hours trading, plunging 11% following the release of its December-quarter earnings. The company projected capital expenditures of roughly $200 billion in 2026, far exceeding both last year’s spending and analyst estimates of about $146.1 billion.
Quarterly profit came in at $1.95 per share, narrowly missing expectations, while the outlook for the current quarter also fell short as the e-commerce giant factored in rising AI-related costs. Revenue from Amazon Web Services—the core of the company’s artificial intelligence strategy—climbed 24% to $35.6 billion, topping analyst forecasts.
Despite the strong AWS performance, investors were unsettled by the scale of the planned spending, amid growing uncertainty over when heavy AI investments will begin to generate meaningful returns. In sympathy, shares of Microsoft (NASDAQ: MSFT), Alphabet (NASDAQ: GOOGL), and Meta Platforms (NASDAQ: META)—all of which have recently outlined elevated AI spending plans for 2026—fell by as much as 3% in after-hours trade following Amazon’s results.
Wall Street declines again on heavy tech losses, weak employment figures
Wall Street benchmarks extended their decline on Thursday, led lower by the Nasdaq Composite, which fell 1.6%. The S&P 500 dropped 1.3%, while the Dow Jones Industrial Average slid 1.2%. Both the Nasdaq and the S&P fell to their lowest levels since late November and mid-December, respectively.
Technology stocks continued to be the main drag on U.S. equities, as investors grew increasingly concerned about elevated AI-related spending and the potential disruptive effects of artificial intelligence on the software sector. Additional pressure came from disruptions tied to AI’s heavy demand for memory chips. Qualcomm (NASDAQ: QCOM) tumbled 8.5% after warning about the impact of a global memory-chip shortage, while data from Counterpoint Research showed memory-chip prices have surged by as much as 90% quarter-on-quarter so far this quarter.
Broader economic worries also weighed on sentiment. Data from Challenger indicated that U.S. layoffs in January rose to their highest level since the 2009 financial crisis. Weekly jobless claims came in above expectations, while December job openings data also fell short of forecasts, reinforcing concerns about a slowing labor market.
Although signs of labor market weakness have raised expectations for additional Federal Reserve rate cuts, investors remained focused on the outlook for monetary policy under Kevin Warsh, President Donald Trump’s nominee to become the next Fed chair. Warsh has been perceived as a less dovish choice, a view that has also weighed on Wall Street sentiment.
Gold and silver prices declined further in early Asian trading on Friday, extending steep losses from the previous session as profit-taking, easing geopolitical risks, and a stronger U.S. dollar continued to weigh on the metals complex. Silver remained the weakest performer after plunging around 15% on Thursday, while gold was trading nearly $1,000 per ounce below the record high reached last week.
Spot gold slipped 0.6% to $4,751.13 an ounce by 19:56 ET (00:56 GMT), while April gold futures dropped 2.5% to $4,766.11. Spot silver fell 2.2% to $69.383 per ounce, although it stayed above Thursday’s lows near $63, while silver futures tumbled 8.1% to $70.378.
OCBC analysts noted that the $70–$90 range has emerged as a key stabilization zone for silver, warning that a sustained break below this level could open the door to a deeper correction toward the $58–$60 area. They added, however, that holding within this range could allow bullish momentum to rebuild over time.
Losses extended across the broader precious metals space, with spot platinum sliding 7.2% to $1,853.81 an ounce. Metal markets have been under sustained pressure since last week, initially triggered by U.S. President Donald Trump’s nomination of Kevin Warsh to succeed Jerome Powell as Federal Reserve chair. Warsh has been perceived as less dovish, fueling a rally in the dollar that has weighed heavily on metals.
The U.S. currency was on track for its strongest weekly performance since early October, with softer labor market data failing to curb its advance. Meanwhile, easing tensions between the U.S. and Iran also dampened safe-haven demand for gold and silver, as the two sides were set to hold talks in Oman later in the day.
Oil prices slipped in Asian trading on Friday and were on track for a weekly loss, as markets focused on whether upcoming U.S.–Iran talks could ease Middle East tensions. Investors also priced in a lower risk premium and took profits after last week’s strong gains. Brent futures for April held at $67.58 a barrel, while WTI futures edged up 0.1% to $63.09 by 21:13 ET (02:13 GMT).
U.S.–Iran negotiations are scheduled to be held in Oman.
U.S. and Iranian officials are scheduled to hold talks in Oman later on Friday, as military tensions in the Middle East intensify following Washington’s deployment of at least two naval fleets to the region. Investors are optimistic that dialogue between Tehran and Washington could ease tensions and reduce the risk of a wider conflict, prompting traders to strip some geopolitical risk premium from oil prices this week.
However, differences have emerged over the scope of the discussions, with Iran rejecting U.S. demands to address its missile program and insisting that talks will focus solely on its nuclear ambitions. Iran is a key global oil producer and sits alongside the Strait of Hormuz, a critical chokepoint for global crude shipments.
Oil set for weekly decline as profit-taking and a stronger dollar weigh
Brent and WTI futures were down between 2.5% and 4% for the week, as prices came under pressure from profit-taking after six straight weeks of gains. Crude had earlier been supported by expectations of tighter supply, particularly after extreme weather in the U.S. disrupted output nationwide.
Supply disruptions in Kazakhstan and concerns over an escalation of conflict in the Middle East also lent support to prices. However, sentiment shifted this week as traders locked in profits, while a broader selloff across commodities—driven by a strengthening U.S. dollar—further weighed on oil markets. The dollar was on track for its strongest weekly performance since October, as investors viewed Kevin Warsh, U.S. President Donald Trump’s nominee for the next Federal Reserve chair, as a less dovish choice.
Stocks ended lower on Wednesday, though the S&P 500 slipped just 50 basis points. In contrast, the equal-weight S&P 500 ETF (RSP) gained nearly 90 basis points, highlighting a notable degree of dispersion beneath the surface. This divergence was reflected in the Dispersion Index, which climbed to 37.6 and is once again approaching the upper end of its historical range. As earnings season draws to a close, dispersion is likely to ease, with correlations gradually moving higher.
The spread between the Dispersion Index and the three-month implied correlation index widened on Wednesday. As earnings season comes to an end, this gap is likely to narrow in the coming weeks as dispersion trades begin to unwind and correlations normalize.
One explanation for the notable strength in Walmart (NASDAQ: WMT) and the broader consumer staples sector may be the rise in implied volatility. While IV typically increases ahead of earnings season, this year it appears to be climbing to levels well above those seen in prior quarters. With Walmart not scheduled to report until February 19 and most retailers releasing earnings later in the cycle, the recent strength in XLP may not reflect a true sector rotation. Instead, it could be driven by the same dispersion dynamics observed ahead of the major technology earnings releases.
Long-term rates edged higher on Wednesday, with the 30-year yield rising about 2 basis points to 4.92%, once again testing the upper end of its resistance range. Whether it ultimately breaks higher remains uncertain. Fundamentally, yields have had ample justification to move higher for weeks, yet they remain stubbornly range-bound. The 30-year could arguably already be above 5%, but the market continues to wait.
The latest QRA released Wednesday continues to point to mounting stress at the long end of the curve, though those pressures have yet to fully materialize. The report noted that the Treasury General Account (TGA) is expected to exceed $1 trillion around tax season—roughly $150 billion above current levels. That represents a significant liquidity drain from the system, and based on rough estimates, the Fed’s bill purchases would dilute, rather than offset, that impact.
Looking ahead, Kevin Warsh’s arrival in May adds another layer of uncertainty around balance-sheet policy. As a result, liquidity conditions are likely to remain tight for some time.
Silver sold off sharply after Kevin Warsh’s nomination to the Fed caught investors off guard who had been anticipating a more dovish pivot. The metal remains under pressure from margin increases, elevated physical delivery requirements, and aggressive short positioning by Chinese traders. While long-term fundamentals remain constructive, prices are still range-bound as the market waits for clearer macro and technical signals.
The steep decline in silver toward the end of last week can reasonably be characterized as a crash, triggered primarily by the announcement of Kevin Warsh’s nomination to lead the Federal Reserve.
Prior to the news, markets had been positioned for a notably dovish appointment, an expectation shaped by President Donald Trump’s repeated calls for a weaker U.S. dollar and faster interest-rate cuts. Warsh’s nomination caught investors off guard, forcing a rapid reassessment of monetary policy expectations.
Even so, uncertainty remains around how the incoming Fed chair would ultimately steer the central bank.
At the same time, broader commodity markets have struggled to regain traction. Despite several rebound attempts, prices have failed to establish sustained upside momentum, leaving commodities—silver included—likely confined to a period of sideways consolidation for now.
Investors Demand Physical Deliveries
Beyond monetary policy concerns, silver prices are facing additional pressure following the CME Group’s decision to raise margin requirements for gold and silver. The higher margins have forced some leveraged investors to unwind long positions, intensifying selling pressure.
At the same time, a growing number of futures contracts are moving toward physical delivery rather than being rolled forward. Given the current supply tightness, this dynamic is, for now, benefiting sellers more than buyers.
Activity out of China has also drawn attention. Zhongcai Futures reportedly established a sizable short position in silver—estimated at roughly $1.5 billion—and appears to have profited significantly from the recent decline.
With the Lunar New Year holiday ending and the Shanghai Stock Exchange reopening, market participants will be closely monitoring how Asian demand evolves.
Overall, the recent move appears to be a corrective pullback after metals prices advanced too rapidly over a short period. While the near-term retracement has weighed on sentiment, it does little to alter the longer-term outlook. From a fundamental perspective, the case for higher prices remains intact, supported by constrained supply and steadily rising industrial demand.
Investors will also be watching Kevin Warsh closely, as any public remarks could provide clearer insight into his economic views and expectations for the interest-rate path in the months ahead.
Technical View on Silver
Early in the week, demand showed signs of returning as investors stepped in to buy the dip. However, the rebound proved short-lived, with a fresh wave of selling reversing the recovery. For now, prices are consolidating within a range of roughly $74 to $92 per ounce.
By the end of the week, prices are likely to stay confined within this range, provided U.S. labor market data does not deliver any major surprises. From a technical standpoint, the market appears to be in wait-and-see mode, looking for a decisive breakout to determine the next directional move. Meanwhile, the U.S. Dollar Index has once again held key support near the 96 level, which also represents its lows for the year.
If buyers are able to extend the rebound, the next major hurdle sits near the 100 resistance level. A decisive break above that area could pave the way for a move toward 103.
On the downside, a drop below 96 on the U.S. Dollar Index would be a clear signal that the broader downtrend remains intact and is likely to persist.
Following a sharp and prolonged rally triggered by the outbreak of the Russia–Ukraine war in 2022, natural gas prices have since collapsed. The downturn has been driven by record U.S. output, warmer-than-expected winters, and improvements in drilling technology, all of which have contributed to a significant supply–demand imbalance.
Over the past five years, natural gas—and related instruments such as the US Natural Gas Fund ETF (NYSE: UNG)—has dropped nearly 60%, reinforcing its long-standing reputation as the “widow maker.”
However, following a sharp cold-weather-driven spike, warmer February forecasts have dampened near-term demand expectations, triggering a roughly 15% selloff in natural gas prices on Sunday evening.
Even so, a number of bullish catalysts are coming into focus that could pave the way for a powerful, 2022-style rally in natural gas. Below are three key reasons to maintain a bullish outlook, including:
Rising Energy Demand From Data Centers
Already, the buildout of AI-focused data centers represents the largest infrastructure expansion in history. Data from Grand View Research shows that the data center construction market surpassed $250 billion in 2025, as hyperscalers such as Alphabet (NASDAQ: GOOGL) and Microsoft (NASDAQ: MSFT) race to secure leadership in artificial intelligence. Looking ahead, spending on AI data center construction is projected to surge to $450 billion by the end of the decade.
Recent remarks from Nvidia’s (NASDAQ: NVDA) influential CEO, Jensen Huang, reinforce this view. Speaking at the World Economic Forum (WEF) 2026 in Davos, Switzerland, Huang pushed back against concerns of an AI bubble, pointing to rising spot prices—even for older GPUs—and the scarcity of available units for rent. He also suggested that trillions of dollars of capital are poised to flow into the development of increasingly powerful AI models.
That said, hyperscalers face a significant constraint: energy. Power costs are climbing as electricity demand from AI data centers is projected to double by the end of the decade.
While renewable and nuclear energy continue to dominate Wall Street’s narrative, both come with relatively high upfront costs. In the near term, natural gas remains the most reliable, scalable, and cost-effective source of power for meeting large-scale electricity demand.
U.S. LNG Producers Capitalize on Global Demand
Several major liquefied natural gas (LNG) export terminals are set to come online in 2026, expanding U.S. producers’ ability to supply Europe and other global markets. With U.S. natural gas prices well below those in Europe, exporters are incentivized to ship more volumes overseas. This dynamic is expected to absorb excess domestic supply, helping establish a solid price floor for U.S. natural gas.
In addition, the Trump administration has emphasized an “American Energy Dominance” strategy, securing multiple long-term LNG supply agreements with countries such as Japan and Qatar. These deals underpin durable, long-term demand for U.S. LNG exports.
Natural Gas Poised to Replace Coal
According to the U.S. Energy Information Administration (EIA), U.S. coal production declined 11.3% year over year, with the number of active coal mines dropping from 560 to 524. Although many countries are transitioning toward renewable sources such as solar, these alternatives are currently insufficient to fully replace coal-fired generation. In the near term, natural gas offers the most viable solution, given its scalability, cost efficiency, and significantly lower emissions—producing roughly half the CO₂ of coal.
Technical Outlook for Natural Gas
Over the past several weeks, UNG has surged from roughly $10 to $16.90. However, warmer-than-expected weather forecasts suggest the ETF may pull back to test its 200-day moving average. Bulls will be watching closely this week to see whether that key support level holds.
Bottom Line
While natural gas is well known for its short-term volatility and weather-driven swings, the underlying fundamentals are increasingly pointing toward a bullish long-term trajectory. Rising energy demand from AI data centers, combined with expanding U.S. export capacity, is expected to drive sustained growth in demand over time.
The bull market has expanded beyond technology, and a number of upcoming Investor Days, Analyst Days, and business updates across non-tech sectors may provide valuable insight into the health of the broader, Main Street economy. Improving manufacturing sentiment creates a constructive backdrop for renewed corporate commentary. Together with fourth-quarter earnings reports and early-year industry conferences, these events are expected to deliver both qualitative perspectives and quantitative data points for investors.
Technology stocks and the AI theme have driven global markets since the bull run began in October 2022. This year’s rally—marked by record highs across regions from Japan to Europe—has been led by a new group of sectors. In the United States, Energy and Materials are out in front, delivering double-digit gains through early February, with other “real economy” areas such as Consumer Staples and Industrials close behind.
This kind of sector rotation is often viewed constructively, particularly when the S&P 500 holds elevated levels as market leadership shifts. Still, some observers have raised concerns that late-cycle industries and even traditionally defensive segments are starting to outperform more than three years into the bull market.
Regardless of whether the shift proves bullish or bearish, attention has clearly moved toward cyclical and value-oriented stocks. While two more members of the Magnificent Seven are set to report earnings this week, meaningful macro signals are increasingly expected to come from outside the technology sector. In addition, corporate events—including investor conferences, shareholder meetings, interim updates, analyst days, and business briefings—add important context alongside formal earnings releases.
Our team has identified several upcoming events hosted by non-tech, blue-chip companies over the next few weeks that could provide insight into the health of the manufacturing sector and the broader Main Street economy. These meetings follow the strongest U.S. ISM Manufacturing PMI reading since August 2022, released earlier this week. The next phase of the bull market may be taking shape—not in technology, but in more traditional sectors. Below are the key events that will help clarify that trajectory.
Thursday, February 5: Xcel Energy 2025 Year-End Webcast
Power generation is expected to be a central theme at Xcel Energy’s (XEL) Analyst Day, which will take place shortly after the release of its Q4 2025 earnings. The $44 billion market-cap utility has pulled back after reaching record highs late last year, though the weakness has been broadly shared across the sector. Utilities within the S&P 500 continue to face volatility as significant structural changes reshape what has historically been a relatively quiet corner of the market.
A Dividend Aristocrat, Xcel Energy shares are up roughly 10% over the past year. Management signaled a more aggressive capital expenditure strategy in its Q3 update last October. Investors will be looking for greater detail on project developments, as well as insight into trends tied to the expanding AI-driven infrastructure buildout, when the company presents tomorrow morning.
Tuesday, February 10: Williams Companies 2026 Analyst Day
Williams (WMB) is also expected to spotlight developments in the energy market. The $81 billion market-cap oil and gas storage and transportation company navigated several major winter storms with limited disruption. In November, management outlined a significant investment plan, announcing a $5.1 billion capital expenditure initiative focused on power innovation, alongside an ambitious 9% annualized growth outlook.
Midstream energy companies have long appealed to income-focused investors for their stable and growing dividends, but a meaningful growth angle may now be emerging. After years of subdued demand, U.S. power consumption is beginning to accelerate. Investors will gain updated insight into these trends next Tuesday, following the company’s Q4 earnings release.
Thursday, February 12: FedEx 2026 Investor Day
One of the most closely watched events this month is FedEx’s (FDX) Investor Day on February 12. CEO Raj Subramaniam has navigated a series of macroeconomic challenges during his tenure, prompting strategic shifts and operational adjustments. This year, the Memphis-based air freight and logistics company plans to spin off its FedEx Freight division by June 1.
FedEx delivered an earnings beat in December, triggering a long-awaited rally in the stock. Shares are up more than 50% over the past six months, setting a constructive backdrop for the Investor Day. While the specific announcements remain uncertain, companies typically do not convene such high-profile events to deliver negative news, suggesting an optimistic tone is likely.
Monday, February 23: JPMorgan Chase & Co. 2026 Update
JPMorgan Chase (JPM) may use its Business Update on Monday, February 23, to address several housekeeping items. While the largest U.S. bank by market value is shifting back to a first-quarter reporting cadence, that change is unlikely to capture investors’ attention. Instead, the focus will be on an operational overview and a potentially market-moving Q&A session with company leadership.
JPM shares reached an all-time high on January 6 before pulling back around earnings, ultimately sliding into a roughly 12% drawdown early in the year. Whether the stock can regain momentum following the upcoming update remains an open question. Investors may get early signals on Tuesday, February 10, when co-CEO Troy Rohrbaugh is scheduled to present at the UBS Financial Services Conference.
Wednesday, February 25: L3Harris Technologies 2026 Investor Day
Tuesday, March 10: Howmet Aerospace 2026 Technology & Markets Presentation
Two Aerospace & Defense companies—L3Harris (LHX) and Howmet Aerospace (HWM)—are set to host investor briefings in the coming weeks. Similar to banks, defense stocks have faced early pressure to start 2026. Both companies were also referenced unfavorably in recent Truth Social posts from President Trump. Proposals such as a potential cap on credit card interest rates weighed on financial stocks like JPMorgan, while threats of capital controls—including restrictions on dividends and share buybacks—were directed at defense names such as LHX, HWM, and their peers.
L3Harris shares declined following last week’s Q4 earnings release, while Howmet Aerospace is scheduled to report results before the market opens on Thursday, February 12.
The Bottom Line
Market leadership within the bull run appears to be widening, as capital increasingly rotates toward cyclical, value-oriented, and real-economy sectors. A slate of upcoming corporate events across Utilities, Energy, Industrials, and Financials could provide important clues as to whether economic momentum is gaining traction beyond technology. Should these updates confirm improving fundamentals, they may point to a more resilient and broadly based next stage of the bull market.
Uncertainty surrounding AI is driving market volatility on several fronts. Beyond accelerating layoffs as AI replaces certain roles, software stocks continue to sell off amid concerns that rapid AI deployment threatens all but companies with strong client-relationship moats. At the same time, surging demand for large-scale data centers has boosted memory chipmakers, while early winners in other semiconductor segments are now facing valuation pressure. Meanwhile, advances in quantum computing are gaining traction and could fundamentally reshape the landscape if fully realized—particularly in the area of security, where quantum systems are widely viewed as capable of breaking existing encryption methods, including those used in blockchain technology. Despite the turbulence, the longer-term outlook still points toward meaningful gains in labor productivity and improved corporate profit margins.
This morning, the Dow Jones Industrial Average and the equal-weighted S&P 500 are the only major indexes trading in positive territory. Both the NASDAQ and the “Magnificent Seven” are now negative year to date. While the S&P 500 is up 0.9% YTD, the equal-weighted S&P has gained 4.6%, highlighting the underperformance of mega-cap technology stocks. The Dow is up 3.2%, and the Russell 2000 continues to lead with a 6.3% gain YTD, despite a 0.5% decline over the past week. Market volatility remains elevated, with the VIX jumping to 19.1 at the open from 18 previously and currently holding near 18.8.
Sector performance year to date shows Financial Services (-2.3%), Technology (-1.3%), and Healthcare (-0.5%) as the only groups in negative territory. In contrast, Energy (+15.6%), Basic Materials (+11.8%), and Consumer Staples (+10.5%) are posting double-digit gains.
Interest rates are little changed, with the U.S. 2-year Treasury yield at 3.57% and the 10-year at 4.27%. International yields are similarly flat. The U.S. dollar index is higher by 0.25 at 97.55, up 1.3% over the past week.
Precious metals are experiencing sharp swings today, with gold climbing as high as $5,113 per ounce before retreating to $4,939, while silver fell from $92.0 to $86.5 per ounce. Copper prices declined 2.7% to $5.92 per ounce. Energy markets are relatively quiet, with crude oil trading flat near $63.20 per barrel.
Cryptocurrencies continue to weaken, as Bitcoin has fallen 3.7% to $73.9K and is now down 26.4% over the last twelve months. Ethereum is lower by 4.2% and down 31% LTM. Even with the prospect of clearer regulation, many investors remain cautious given the sector’s persistent volatility.
On the earnings front, AMD delivered solid top- and bottom-line beats, but weaker-than-expected data center revenue and rising costs weighed heavily on the stock. Shares are down a sharp 15.9%—their worst session in years—bringing performance to -4.9% YTD, though still up 70.4% LTM, and sending ripples through the broader hardware space. The semiconductor sector is down 3.9% on the day, including a 3.1% decline in NVIDIA. In contrast, Eli Lilly posted a strong earnings beat, exceeded expectations on both revenue and profit, and raised guidance. Its shares are up 9.8%, now +2.6% YTD and +33.7% LTM. Investors are also looking ahead to Alphabet’s results tonight and Amazon’s tomorrow.
As trading continues, the Dow Jones Industrial Average and the equal-weighted S&P 500 are holding onto gains, while the NASDAQ has slid more than 1% and the Magnificent Seven is down 0.9%. The S&P 500 has dipped below 6,900, off 0.3%, and the Russell 2000 is down 0.8%. The ongoing pullback in technology stocks reflects elevated valuations and persistently high interest rates. Even so, the Dow and the equal-weighted S&P remain near record highs, the broader trend is still positive, and a rebound in tech following this correction would not be unexpected.
In our Ethereum (ETHUSD) update from three weeks ago, we noted that ETH had been forming an ascending triangle since 2020—characterized by higher lows and relatively equal highs—signaling that the long-term uptrend remained intact. We also highlighted that a pullback toward the ~$2,200 support area, followed by a breakout, could open the door for a move toward ~$6,190.
Today, Ethereum is trading near that trend line at around $2,150. At the same time, the daily RSI(30) has declined to 32. Historically, aside from the 2018 bear market, this zone has provided attractive low-risk, high-reward opportunities for investors with a long-term horizon or those employing a dollar-cost averaging (DCA) strategy (see Figure 1).
Figure 1: Ethereum’s daily price action since 2015.
More on the RSI is discussed below. In the meantime, what would be the downside risk if the trend line fails to hold, allowing for some short-term whipsaw action? That scenario is illustrated below using the Elliott Wave Principle (EW). Under this framework, ETH’s price action suggests it may be unfolding within a larger, higher-degree fourth wave—labeled as the black Wave 4. See Figure 2.
Figure 2: Ethereum’s monthly price action since 2015.
In this scenario, Ethereum would gravitate toward the lower black dotted trend line, which has acted as key downside support since 2021 and is currently near $1,450. From that level, the second-largest cryptocurrency by market capitalization could still resume its advance, unfolding a (black) fifth wave that ideally targets around $6,200 (4,865 − 1,08? + 1,450). This aligns closely with the breakout objective from our original analysis, where we noted: “If Ethereum drops to ~$2,200 support first and then breaks out, we can expect ~$6,190.”
Lastly, it is worth noting that the monthly RSI(5) has now fallen below 30. Similar to the daily RSI(30), historical data shows that this level has typically provided low-risk, high-reward opportunities for investors with a long-term horizon and/or those employing a dollar-cost averaging (DCA) approach.
USD/JPY paused its advance near the 157.00 mark during Thursday’s Asian session, as a renewed bout of risk aversion revived safe-haven demand for the Japanese yen.
That said, the yen remains on fragile footing amid ongoing concerns over Japan’s fiscal position under Prime Minister Sanae Takaichi’s expansionary spending agenda, helping to limit downside pressure on the pair.
Looking ahead, the U.S. JOLTS Job Openings report could provide fresh impetus for near-term trading.
USD/JPY Technical Analysis
The Japanese yen emerged as the weakest-performing G8 currency on Wednesday. Its sharp underperformance has lifted USD/JPY above the 156.80 level at the time of writing, putting the pair on course for a roughly 3% rebound from last week’s lows.
Fundamental Analysis
Investors are offloading the yen broadly ahead of this weekend’s snap election. Rising support for Prime Minister Takaichi has fuelled concerns that a stronger electoral mandate would allow her to extend tax cuts and expand stimulus spending, heightening fears of fiscal strain.
Markets Brush Aside Intervention Concerns
Tokyo authorities have warned of possible intervention to curb excessive yen volatility, but those concerns have been largely brushed aside. Comments from Prime Minister Takaichi highlighting the benefits of a weaker yen, along with the U.S. Treasury Secretary’s denial of any coordinated effort to stabilise the currency, have instead driven the yen sharply lower across the board.
The U.S. dollar, however, is not especially strong on Wednesday. While markets continue to react positively to the nomination of Kevin Warsh as the next Federal Reserve Chair and to the end of the brief partial government shutdown, the recent rally in the U.S. Dollar Index appears to be losing momentum.
Attention now turns to upcoming U.S. data, including the Services PMI and the ADP Employment Change report. The latter could be particularly influential, as the government shutdown has delayed Friday’s official nonfarm payrolls release, leaving private-sector jobs data as a key guide for markets.
Gold saw choppy price action during Thursday’s Asian session, oscillating within a roughly $200 range. Traders are now looking to the U.S. JOLTS Job Openings report and developments on the geopolitical front—particularly U.S.–Iran tensions—for clearer directional cues.
XAU/USD Technical Analysis
The 21-, 50-, 100- and 200-day SMAs are all sloping higher, with the 21-day positioned above the longer-term averages, highlighting a well-established bullish structure. Prices remain above these indicators, confirming that buyers retain control. Initial support is seen at the 21-day SMA near $4,827.45, followed by the 50-day SMA at $4,532.68. The 14-day RSI has eased to a neutral 52.58, suggesting momentum is consolidating after retreating from overbought levels.
The positive alignment of the moving averages favours a buy-on-dips approach while prices hold above the short-term average. A more pronounced correction would bring the 100-day SMA at $4,271.21 into focus, with the 200-day SMA at $3,821.77 reinforcing the broader uptrend. As long as the RSI remains above the 50 midpoint, the bullish bias stays intact, while a sustained break below it could signal scope for a deeper retracement.
Fundamental Analysis
Gold ended Wednesday little changed near $4,950 after choppy two-way trading. The metal initially rebounded sharply, testing the $5,100 area amid uncertainty surrounding the Federal Reserve’s future policy direction under Kevin Warsh, which weighed broadly on the U.S. dollar.
Renewed geopolitical tensions in the Middle East and between Russia and Ukraine also lent support to gold prices, alongside concerns about potential economic data disruptions stemming from the U.S. partial government shutdown that concluded on Tuesday.
Sentiment shifted during the U.S. session after the ISM Services PMI signalled firmer inflation pressures, prompting a rebound in the dollar. At the same time, an intensifying tech-sector sell-off on Wall Street unsettled markets, driving demand for the greenback as a safe haven.
Additional USD strength came from renewed weakness in the Japanese yen amid rising fiscal and political concerns, which pushed USD/JPY higher and further supported the dollar.
The USD rebound triggered a sharp pullback in gold, although buyers stepped back in near the key $4,950 psychological support level.
Early Thursday, gold remains under pressure after once again failing above the $5,000 resistance zone. The U.S. dollar continues to advance, hitting fresh two-week highs against its major peers as risk sentiment deteriorates amid a global technology sell-off.
The decline in global data analytics, professional services, and software stocks followed Anthropic’s launch of plug-ins for its Claude Cowork agent, which raised fresh concerns about AI-driven disruption across these industries, according to Reuters.
Looking ahead, the delayed U.S. JOLTS Job Openings report could offer gold some relief, particularly if it reinforces expectations for two Federal Reserve rate cuts this year. Conversely, an extended sell-off in the Japanese yen could spark another wave of heavy selling pressure in gold.
AUD/USD is trading lower below the key 0.7000 psychological level during Thursday’s Asian session, pressured by mixed Australian trade data. The pair is also weighed down by a firm U.S. dollar, which is hovering near a two-week high. With limited domestic catalysts, traders are now turning their attention to the upcoming U.S. JOLTS job openings data for fresh direction.
AUD/USD Technical Outlook
Should bullish momentum intensify, AUD/USD is likely to encounter its next resistance at the 2026 peak of 0.7093 (Jan 29), followed by the 2023 high at 0.7157 (Feb 2).
On the downside, a break below the February low at 0.6908 (Feb 2) may trigger a deeper pullback toward the interim 55-day SMA at 0.6693, ahead of the 2026 trough at 0.6663 (Jan 9). Additional downside support is seen at the 100-day SMA at 0.6628, with stronger support at the 200-day SMA at 0.6563 and the November low at 0.6421 (Nov 21).
Momentum indicators remain constructive and point to further upside potential, although the pair’s overbought readings suggest the risk of a near-term correction. The RSI hovers near 72, while the ADX around 50 continues to signal a strong underlying trend.
Bottom line
AUD/USD continues to be heavily influenced by global risk appetite and developments in China’s economy. A sustained move above the 0.7000 handle would reinforce a more credible bullish outlook.
For the time being, a weaker U.S. dollar, stable—though not particularly strong—domestic data, a still-hawkish tilt from the RBA, and modest backing from China leave the balance of risks skewed toward further upside rather than a pronounced pullback.
Fundamental Analysis
AUD/USD remains entrenched in its broader uptrend despite renewed selling pressure emerging on Wednesday. Any near-term pullbacks are expected to attract buying interest, as the Reserve Bank of Australia continues to project a clearly hawkish stance following its latest rate decision.
The Australian Dollar is struggling to extend Tuesday’s advance, easing back and once again testing the psychologically significant 0.7000 mark.
The retreat comes as the U.S. Dollar regains some traction, with markets having largely absorbed the RBA’s hawkish hike and refocusing attention on U.S. economic and monetary policy developments.
Australia: Growth Is Cooling, Not Collapsing
Recent Australian data have been underwhelming rather than alarming, reinforcing a well-established narrative. Economic activity is slowing, but in a controlled manner, with momentum easing rather than breaking down—supporting the soft-landing view.
January PMI surveys align with this assessment, as both Manufacturing and Services strengthened and remained firmly in expansion territory, at 52.3 and 56.3 respectively. Retail sales continue to show resilience, and although the trade surplus narrowed to A$2.936 billion in November, it remains solidly positive.
Growth is moderating only gradually, following a 0.4% quarter-on-quarter rise in GDP in Q3. On an annual basis, output expanded by 2.1%, matching the RBA’s projections.
The labour market remains a standout performer. Employment jumped by 65.2K in December, while the unemployment rate unexpectedly edged down to 4.1% from 4.3%.
Inflation, however, continues to be the key challenge. December CPI surprised to the upside, with headline inflation accelerating to 3.8% year-on-year from 3.4%. The trimmed mean rose to 3.3%, in line with market expectations but slightly above the RBA’s 3.2% forecast. On a quarterly basis, trimmed mean inflation increased to 3.4% in the year to Q4, marking the highest level since Q3 2024.
China: A Backdrop of Support, Not a Catalyst
China continues to offer a generally supportive backdrop for the Australian dollar, though without the momentum needed to drive a sustained upswing.
Economic growth ran at an annualised 4.5% in the October–December quarter, with quarter-on-quarter expansion at 1.2%. Retail sales rose 0.9% year-on-year in December—respectable, but not particularly compelling.
More recent indicators point to a renewed loss of momentum. Both the NBS Manufacturing PMI and the Non-Manufacturing PMI slipped back into contraction territory in January, at 49.3 and 49.4 respectively.
By contrast, the Caixin surveys painted a slightly brighter picture, with the Manufacturing PMI edging up to 50.3 to remain in expansion, while the Services PMI increased to 52.3.
Trade stood out as a relative bright spot, as the surplus widened sharply to $114.1 billion in December, supported by nearly 7% growth in exports and a solid 5.7% rise in imports.
Inflation signals remain mixed. Consumer prices were unchanged at 0.8% year-on-year in December, while producer prices stayed firmly negative at -1.9%, underscoring that deflationary pressures have yet to fully fade.
For now, the People’s Bank of China is maintaining a cautious stance. Loan Prime Rates were left unchanged in January at 3.00% for the one-year and 3.50% for the five-year, reinforcing expectations that policy support will remain gradual rather than aggressive.
RBA: Leaning Hawkish, In No Hurry to Ease
The RBA raised the cash rate to 3.85% in a decisively hawkish move that largely met expectations. Upward revisions to both growth and inflation forecasts signal firmer economic momentum and increasingly broad-based price pressures. Core inflation is now projected to remain above the 2–3% target band for much of the forecast horizon, reinforcing the case for a restrictive policy stance.
The central message is that inflation is becoming more demand-driven. The RBA cited stronger-than-expected private demand as a key justification for tighter policy, even as productivity growth remains subdued. While Governor Bullock described the move as an “adjustment” rather than the beginning of a renewed hiking cycle, the signal was clear: policymakers are uneasy with the upward drift in inflation.
For markets, this implies interest rates are likely to stay higher for longer, limiting the scope for near-term easing. From an FX perspective, this provides marginal support for the Australian dollar—particularly against low-yielding peers—even as the RBA’s emphasis on full employment tempers the likelihood of an aggressive tightening phase.
In the wake of the decision, markets are now pricing in nearly 40 basis points of additional tightening by year-end.
Positioning: Shifting Sentiment Toward the AUD
The latest positioning data suggest the worst of the bearish sentiment toward the Australian dollar may have passed. CFTC figures show that non-commercial traders have returned to a net long stance for the first time since early December 2024, although the position remains modest at just over 7.1K contracts in the week ending January 27.
Open interest has also climbed to its highest level in several weeks, exceeding 252K contracts, indicating that traders are beginning to re-engage with the market. That said, the move appears tentative rather than a strong conviction call on a sustained appreciation in the AUD, at least for now.
Key Drivers Ahead
Near term: Market attention is shifting back toward the United States. Incoming economic data, tariff-related developments, and ongoing geopolitical headlines are likely to drive movements in the U.S. dollar. For the Australian dollar, the key swing factors remain domestic labour market and inflation data, and how these shape expectations for the RBA’s next policy decision.
Risks: The AUD remains highly sensitive to global risk sentiment. A sharp deterioration in risk appetite, renewed concerns over China’s outlook, or an unexpected resurgence in the U.S. dollar could quickly unwind recent gains.
The slide followed heavy losses in Asian and U.S. technology stocks, as fears that AI investment may be peaking—alongside stretched valuations and slowing earnings growth—pushed investors away from risk assets.
What to know:
Bitcoin dropped as much as 7.5% during Asian trading on Thursday, falling below $71,000 as a global tech-led selloff spilled over into crypto markets.
The move came after sharp declines in Asian and U.S. tech shares, driven by concerns over cooling AI spending, elevated valuations, and weakening earnings momentum.
Bitcoin’s latest fall, alongside steep losses in silver and gold, highlights its behavior as a high-beta risk asset. Thin liquidity and rising macro uncertainty have amplified price swings, pointing to fragile investor conviction rather than a definitive trend reversal.
Bitcoin fell below the $71,000 threshold during Asian trading on Thursday as a renewed global selloff in technology stocks spilled over into crypto markets, dampening hopes of a sustained recovery after last week’s sharp volatility.
The world’s largest cryptocurrency dropped as much as 7.5% over the past 24 hours, briefly touching lows near $70,700 before trimming some losses, according to CoinDesk data.
The decline followed steep losses across Asian equity markets, where rising concerns about slowing artificial intelligence spending, elevated valuations, and weakening earnings momentum pushed investors further away from risk assets. MSCI’s Asia technology index fell for the fifth time in six sessions, led by a roughly 4% drop in South Korea’s Kospi as AI-linked heavyweight stocks came under pressure.
Weakness in Asia followed a selloff in U.S. markets, where the Nasdaq slid after underwhelming earnings from companies including Alphabet, Qualcomm, and Arm reinforced fears that the AI investment cycle may be peaking sooner than expected.
Bitcoin has increasingly behaved like a high-beta risk asset during equity-driven downturns, particularly when liquidity is thin and macroeconomic uncertainty intensifies.
The latest slide comes after choppy price action earlier in the week, when bitcoin dropped toward $73,000 before rebounding above $76,000—moves that signaled fragile investor conviction rather than a decisive trend reversal.
Pressure was exacerbated by sharp moves in commodities. Silver plunged as much as 17%, while gold fell more than 3%, extending a severe unwind that has already triggered significant liquidations in tokenized metals products across crypto trading platforms.
Asian stock markets declined on Thursday, pulling back from record highs reached earlier in the week, as heightened volatility in global technology shares and concerns over AI-driven disruption dampened investor sentiment.
The retreat followed a sharp overnight selloff in U.S. technology stocks, with the Nasdaq underperforming broader market indexes. Meanwhile, U.S. stock index futures were largely flat during early Asian trading hours on Thursday.
AI fears drag tech stocks lower
The decline follows a volatile week for technology and semiconductor stocks, as rising concerns that rapid advances in artificial intelligence could disrupt established business models and squeeze profit margins prompted investors to take profits after a strong rally.
South Korea’s benchmark KOSPI fell 3.7% after hitting record highs over the previous two sessions. Shares of Samsung Electronics and SK Hynix dropped more than 5% each as investors moved to lock in recent gains.
In China, the blue-chip CSI 300 index and the Shanghai Composite both slipped nearly 1%. Hong Kong’s Hang Seng Index declined 1.2%, while the Hang Seng TECH Index fell 1.5%.
Japanese stocks slip, earnings help stem losses
Japanese equities edged lower on Thursday, with the Nikkei 225 slipping 1% from record highs reached earlier in the week as technology stocks followed overnight losses on Wall Street.
The decline was cushioned by strong gains in select stocks. Panasonic shares surged after the company reported solid earnings and issued upbeat guidance, while Renesas Electronics jumped following the announcement that it will sell its timing business to U.S.-based SiTime in a deal valued at around $3 billion.
The broader TOPIX index was largely unchanged, highlighting relative resilience outside the technology sector.
Elsewhere in the region, Singapore’s Straits Times Index eased 0.4% after closing at a record high in the previous session. Australia’s S&P/ASX 200 also slipped 0.4%, tracking regional weakness as investors digested trade data released earlier in the day.
Australia’s trade surplus widened less than expected in December, reflecting modest export growth and softer imports, which reinforced concerns over uneven global demand.
Futures linked to India’s Nifty 50 were slightly lower, down 0.3%.
SoftBank Group Corp. shares fell sharply on Thursday, tracking losses in Arm Holdings after the British chip designer—one of the Japanese conglomerate’s largest investments—reported weaker-than-expected earnings for the December quarter.
SoftBank was also swept up in a broader selloff in technology stocks, as growing uncertainty surrounding artificial intelligence and its implications for the software sector weighed on sentiment. Shares of the group dropped as much as 7% to 3,909 yen, making SoftBank one of the biggest drags on the Nikkei 225 index, which declined 1%.
The slide followed an 8% drop in Arm’s shares in after-hours U.S. trading. Arm posted disappointing licensing revenue for the December quarter. The company generates income by licensing its chip designs to major customers such as Nvidia and Apple, as well as collecting ongoing royalties on those technologies.
Pressure on Arm was compounded by a cautious outlook from Qualcomm, which warned that rising global memory prices—driven by AI-related demand—could weigh on smartphone sales in 2026. Such a trend would be negative for Arm, whose chip architectures are widely used across the smartphone industry.
SoftBank currently owns an 87.1% stake in Arm following the chip designer’s return to public markets in 2023. Arm remains one of SoftBank’s most significant holdings and a central pillar of the group’s long-term ambitions in artificial intelligence and semiconductor technology.
Stellar continued its corrective move on Thursday after failing to reclaim a previously broken trendline. Derivatives data points to mounting weakness, with short positions increasing even as open interest declines. The technical picture remains bearish, suggesting sellers retain control and could push the price into a deeper correction.
Stellar (XLM) continued its corrective decline on Thursday, trading below $0.167 at the time of writing after facing rejection at a key resistance level. Derivatives indicators signal growing weakness, with short positions increasing even as open interest declines. From a technical perspective, bearish momentum remains dominant, leaving XLM vulnerable to further downside and potential new lows.
Derivatives data signals downside bias for XLM
CoinGlass data shows XLM’s long-to-short ratio at 0.85 on Thursday, close to its lowest level in a month. A reading below one indicates a bearish skew in market positioning, with a greater share of traders betting on further price declines.
Stellar’s futures open interest fell to $95 million on Thursday, marking its lowest level since November 2024 and continuing a steady decline seen since the start of the year. The reduction in open interest signals diminishing trader participation and reinforces the broader bearish outlook for XLM.
Stellar Price Forecast: XLM deepens correction after slipping below key support
Stellar fell more than 13% last week, closing below the lower boundary of a falling wedge pattern on Saturday. Since then, XLM has repeatedly faced rejection near the broken trendline through Wednesday, extending losses by more than 5%. As of Thursday, the token is trading around $0.169.
If the corrective move continues, XLM could slide further toward its 2025 yearly low at $0.160, recorded on October 10.
Momentum indicators continue to point lower. The daily Relative Strength Index (RSI) stands at 26, signaling oversold conditions and strong bearish pressure. Meanwhile, the Moving Average Convergence Divergence (MACD) has remained in a bearish crossover since mid-January, with expanding red histogram bars below the zero line reinforcing the negative technical bias.
Alternatively, a recovery in XLM could see prices push higher toward the lower boundary of the trendline, near the $0.180 level.
Tech just suffered a selloff of a different kind. This was not about rates, recession fears, or a routine earnings disappointment. It was the market catching its own reflection in the AI mirror—and flinching.
When confidence cracks, the Nasdaq does not rotate. It drops the floor. The S&P followed along, dutifully diversified in theory, while tech still steers the wheel.
The trigger was AMD, but the message was broader. In a fully priced bull market, “good” results are not good enough when investors have already paid in advance for perfection. When expectations stretch into the stratosphere, even a strong quarter feels like a letdown. AMD was not punished for weakness—it was punished for failing to deliver magic commensurate with the valuation it carried.
What followed was less about fundamentals than positioning. This was the market unwinding a narrative that had become too tidy, too crowded, too self-assured. When everyone leans the same way, even a minor wobble turns into a shove.
And the shove traveled fast. Once the story lost its grip, selling turned indiscriminate. Yesterday’s AI champions were treated like stale trades. Hardware names sank alongside software darlings. Picks, shovels, and miners all landed in the same risk bucket as investors dumped exposure wholesale.
This was never just a chip story. The real fault line runs through software—and it is psychological. The market is now entertaining a new fear: not that AI lifts all boats, but that it punctures the hulls of those that assumed they were unsinkable.
Software cracked first because belief ran deepest there. It was the cleanest narrative in the market—AI as a quiet margin expander, a tailwind that boosted earnings without disrupting the underlying structure. That assumption is now being dismantled in real time.
The uncomfortable inversion is coming into focus. The companies that digitized the fastest may also be the most exposed. AI is not arriving as a polite consultant. It is entering as a tireless shadow workforce—one that never negotiates, never sleeps, and learns faster than corporate hierarchies can adapt. And it writes code, too.
That is why this moment feels like a break, not a revision. When markets stop debating how much something earns and start questioning why it exists, prices do not drift lower. They fracture.
You can see it in the tape. This is not a careful repricing—it is an exit rush. One day the debate is about margins; the next it is about whether the product becomes a feature inside a larger model.
Once that fear enters the room, it spreads quickly across anything tied to monetized knowledge work—data platforms, marketing software, legal tools, analytics, even media and advertising adjacencies. If AI does the work, who gets paid for it? That is the question markets are stress-testing in real time.
For years, software earned its margins by controlling workflow—owning the screen, the process, the friction. Humans did the thinking; software rented them the tools and charged a recurring toll. Predictable. Scalable. Defensible. That doctrine is now under review.
Bitcoin and gold sliding alongside tech is telling. When risk sentiment turns, speculative layers lose sponsorship first. It is not ideology—it is mechanics. When leverage gets pulled back, froth goes first.
This does not mean tech is finished. It means tech is being tested.
Every cycle follows the same arc: markets fall in love with innovation, price it as destiny, then recoil when destiny arrives with disruption and bills. AI is no longer just a growth story—it is a competitive weapon. That creates winners and losers, not a rising tide. The trade is shifting from owning the theme to owning the survivors.
This is what a regime change looks like within a sector. Euphoria gives way to scrutiny. Momentum yields to forensic analysis. Markets stop paying for possibility and start paying for proof.
Ironically, the most technologically advanced firms often feel the shock first—they sit closest to the blast radius. If your business automates knowledge work and a universal automation engine shows up, you do not get to pretend the rules stayed the same.
Panic, of course, is rarely precise. Markets swing the hammer before identifying the nail. These moments tend to overshoot because fear moves faster than analysis.
This looks less like the end of AI and more like a narrative reckoning. The market is re-evaluating who captures value, who loses the toll booth, and who gets displaced.
AI is not killing tech. It is forcing tech to prove it has a moat—not just a story.
When markets stop buying dreams, they start auditing business models.
Bitcoin fell to a 15-month low on Wednesday, sliding toward the $72,000 level amid a broad-based selloff across global financial markets.
The world’s largest cryptocurrency dropped as much as 5.4% to $72,047, its weakest level since Nov. 6, 2024—the day after Donald Trump’s U.S. presidential election victory. Bitcoin has now shed more than 40% from its record high reached in October 2025.
While earlier declines this week were largely driven by crypto-specific liquidations, Wednesday’s losses appeared to be part of a wider risk-off move. Global markets saw coordinated selling pressure, with the Nasdaq 100 falling more than 2% as software stocks, semiconductor names, and other interest rate–sensitive sectors came under pressure.
Bitcoin on Tuesday wiped out all of the gains it had made since President Donald Trump’s election victory in early November 2024. Selling pressure continued into Wednesday, briefly dragging the world’s largest cryptocurrency below the $72,000 level.
The digital asset has now plunged roughly 42% from its record high above $126,000 reached last October, firmly placing it in bear-market territory.
Bitcoin surged through 2025 on expectations of a more crypto-friendly regulatory environment under the Trump administration, strong inflows into spot exchange-traded funds, and growing institutional adoption. Since peaking, however, prices have fallen sharply, with losses accelerating in 2026.
Citi Research analyst Alex Saunders said downside sensitivity to equity markets, heightened geopolitical risks, and long-position liquidations have weighed heavily on bitcoin and the broader crypto market.
Saunders also noted a clear slowdown in inflows to U.S. spot bitcoin ETFs since Oct. 10 last year, which he views as a key source of incremental demand. The drop in new money has coincided with increased caution among long-term holders, who have grown more concerned about cyclical weakness in bitcoin.
Nearing critical levels
Bitcoin slid as much as 5% on Wednesday to an intraday low of $71,913.4, marking its weakest level since early November 2024.
Citi Research analyst Alex Saunders said bitcoin is now nearing critical price thresholds. He noted that prices have fallen below Citi’s estimated average U.S. spot ETF entry level of $81,600 and are approaching the roughly $70,000 level that prevailed ahead of the U.S. presidential election.
Saunders pointed to U.S. legislation passed by the House in July 2025—currently stalled in the Senate—as a potential catalyst for renewed investor interest. He said there has been some progress early this year, with the Senate Finance Committee releasing a draft bill intended to be reconciled with the House-approved CLARITY Act, although the proposal has yet to gain broad support and a committee vote has been delayed. The Senate Agriculture Committee has also advanced its own version of the legislation.
According to Saunders, positive developments on the regulatory front could provide a meaningful boost to market sentiment and capital inflows, citing past examples such as stronger ETF demand following the U.S. election and the passage of the GENIUS Act in July 2025.
No signs of structural stress in crypto markets
Analysts say bitcoin’s latest selloff does not signal deeper structural problems, but rather reflects the normal ebb and flow of bull and bear cycles.
“Recent price movements in bitcoin don’t suggest that anything has broken in the crypto market—they simply mirror the current stage of the broader macroeconomic cycle,” said Gil Rosen, co-founder of the Blockchain Builders fund, in comments to Investing.com. He noted that earlier gains had overshot reality, with markets pricing in an unrealistically smooth rally. The subsequent decline, Rosen added, was not driven by crypto-specific factors, but by external pressures including geopolitics, tariffs, and policy uncertainty. As institutional investors now play a larger role, bitcoin increasingly trades like a risk asset, making it more vulnerable when macro conditions deteriorate.
Nicholas Motz, CIO of Soil.co and CEO of ORQO.digital, echoed this view, arguing that the sharp unwinding of precious metals positions late last week triggered a broader risk-off move across asset classes.
“When investors face pressure in traditional safe havens, they often sell their most liquid and profitable holdings—such as bitcoin—to offset losses elsewhere,” Motz said. He characterized the recent decline as a forced deleveraging episode rather than a fundamental change in long-term crypto adoption.
Nasdaq has put forward a proposal to accelerate the inclusion of newly listed large companies into its indexes, aiming to reduce the lengthy delays that have often kept major IPOs and exchange transfers out of benchmark indexes for months.
The move comes as 2026 is shaping up to be a particularly active year for high-profile listings, with potential IPOs from companies such as Elon Musk’s SpaceX and artificial intelligence startup Anthropic. According to a source familiar with the discussions, advisers to SpaceX—following its recent acquisition of xAI—have contacted major index providers, including Nasdaq, to explore earlier-than-usual index entry. SpaceX did not immediately respond to a request for comment, and Nasdaq declined to comment.
Under the proposed “Fast Entry” rule, a newly listed Nasdaq company would qualify for expedited inclusion if its market capitalization ranks within the top 40 of existing index constituents. Eligible companies would receive at least five trading days’ notice and be added to the index after 15 trading sessions.
The proposal would waive the usual seasoning and liquidity requirements. Rather than replacing an existing constituent, the new entrant would temporarily expand the index’s size until the next annual reconstitution, consistent with Nasdaq’s approach to handling spin-offs.
Michael Ashley Schulman, partner and chief investment officer at Running Point Capital Advisors, said faster inclusion would enhance Nasdaq’s appeal for large issuers by improving liquidity and narrowing bid-ask spreads through greater passive fund ownership.
The lack of a fast-track mechanism has frequently created a gap between index composition and broader market realities, particularly given the scale and market influence of newly listed giants. Investors also expect major additions to be reflected promptly in the index, something the current framework often fails to deliver.
The proposed rule could prove especially consequential in 2026, as artificial intelligence–driven technology leaders may seek valuations in the hundreds of billions of dollars. Nasdaq remains the preferred exchange for U.S. technology heavyweights, including trillion-dollar companies such as Alphabet and Nvidia.
The Nasdaq 100 index, which includes the exchange’s largest listed firms, is closely watched by investors and analysts and is widely viewed as a key gauge of the health of technology and growth-focused sectors.
“As this proposal shows, Nasdaq is signaling that no company is too large and no system is too established to be improved,” Schulman said.
Gold prices gave up early gains and declined during Asian trading on Thursday, pressured by a firmer U.S. dollar as investors positioned ahead of major central bank meetings and key U.S. labor market data. Reduced safe-haven demand also weighed on bullion after the U.S. and Iran confirmed plans to hold talks on Friday, easing fears of an imminent military escalation in the Middle East.
Spot gold slid 1.1% to $4,912.26 an ounce by 21:17 ET (02:17 GMT), while April gold futures fell 0.4% to $4,929.25 an ounce. Prices had climbed as high as $5,092.31 an ounce on Wednesday before surrendering most of those gains and slipping back below the $5,000 level by the session’s close.
The pullback came as diplomatic developments between Washington and Tehran helped calm geopolitical concerns. At the same time, a stronger dollar weighed on precious metals, with traders favoring the greenback ahead of interest rate decisions from the Bank of England and the European Central Bank, both scheduled for Thursday.
Additional support for the dollar came from anticipation of U.S. nonfarm payrolls data due on Friday, which could influence expectations for the Federal Reserve’s interest rate path. The greenback also extended gains from last week following President Donald Trump’s nomination of Kevin Warsh as the next Fed chair. Warsh is widely seen as a less dovish candidate, potentially signaling a tighter monetary stance even as rates decline.
Other precious metals also retreated after a brief rebound earlier in the week. Spot silver plunged 6.9% to $82.3130 an ounce after rallying nearly 6% in the previous session. While silver continues to benefit from its dual role as an industrial and precious metal and has significantly outperformed in recent months, it has faced sharp losses over the past week amid profit-taking and dollar strength.
Spot platinum fell 3% to $2,167.59 an ounce, while benchmark copper futures on the London Metal Exchange slipped 0.6% to $12,986 per tonne.
The Chinese yuan has recently attracted strong demand, and Bank of America Securities believes this momentum could become a key driver of foreign exchange markets in both the near and longer term. On Tuesday, the People’s Bank of China set the yuan’s daily midpoint at 6.9533 per U.S. dollar—75 pips stronger than the prior fix—marking its firmest level in nearly 33 months and breaking below the 6.96 threshold. BofA analysts cited solid export performance and firmer policy guidance as reasons for upgrading their USD/CNY forecasts to 6.7 for the end of Q3 and Q4, from 6.8.
According to the bank, the yuan’s strength may have broader implications for global FX markets, as signs emerge that appreciation is spreading across trade-weighted measures, including the CFETS basket, and increasingly influencing emerging-market currencies. While correlation does not prove causation, BofA noted that the alignment between bilateral and trade-weighted CNY gains is becoming difficult to ignore. A softer U.S. dollar is further reinforcing EM currency strength alongside the yuan.
High U.S. tariffs have encouraged China to redirect exports from the U.S. toward Europe, a shift reflected in the European Union’s expanding trade deficit with China, now nearing levels last seen during the Covid period. Although part of this imbalance stems from a weaker yuan versus the euro, unlike during the pandemic, the widening deficit has not led to euro weakness. Instead, EUR/CNY has climbed to a ten-year high, intensifying pressure on European exporters and renewing calls for yuan appreciation. BofA expects Chinese export momentum into Europe to continue in the short term, though heightened EU scrutiny and anti-dumping measures could pose challenges over the medium term, potentially placing downward pressure on EUR/CNY.
The case for yuan appreciation is gaining traction, reinforced most recently by comments from President Xi emphasizing the goal of building a “powerful currency” that is widely used in global trade, investment, and foreign exchange markets, and that ultimately achieves reserve-currency status. This builds on Xi’s 2020 remarks outlining China’s ambition to reach high-income status by 2025 and significantly expand economic output by 2035. However, BofA cautioned that aggressive currency appreciation could lead to overvaluation and pose risks to financial stability.
In this context, the outcome of U.S.–China competition in artificial intelligence will be critical for productivity growth and the long-term sustainability of relative currency valuations. Given the continued dominance of the U.S. dollar and the U.S.-centered global financial system, BofA expects USD leadership to persist over the next decade. While full internationalization of the renminbi appears unlikely, a more realistic approach may involve expanding CNY usage across the Global South and Asia, potentially reducing the need for a sharply stronger yuan.
The U.S. dollar held steady on Wednesday after a sharp rebound from near four-year lows, while the euro weakened following the release of key regional inflation data.
By 11:54 ET (16:54 GMT), the Dollar Index was up 0.3% at 97.69 and has gained more than 1% since Kevin Warsh was nominated as the next Federal Reserve chair.
The dollar remained resilient despite softer labor market data.
The dollar got a lift late last week after Kevin Warsh was nominated to succeed Federal Reserve Chair Jerome Powell, with markets viewing him as more hawkish and supportive of shrinking the Fed’s balance sheet.
Attention has now turned to Warsh’s Senate confirmation and the potential implications of his appointment for U.S. interest rates when he is set to take over from Powell in May.
A brief government shutdown had little impact on the greenback, as lawmakers approved additional funding this week, though it did delay the release of key employment data originally due on Friday.
Traders also shrugged off a soft ADP payrolls report for January released on Wednesday.
Eurozone consumer prices fall.
In Europe, the euro slipped slightly, with EUR/USD down 0.1% at 1.1802, despite the release of weaker-than-expected preliminary eurozone inflation data. Consumer prices eased to an annual rate of 1.7% last month, below the ECB’s 2% target and down from 2% in December.
The data did little to alter expectations that the European Central Bank will keep interest rates unchanged at 2% for a fifth consecutive meeting. Policymakers have recently expressed concern about the euro’s rapid rise against the dollar and its dampening effect on inflation. The euro touched a 4½-year high of 1.2084 last week.
According to Macquarie strategist Thierry Wizman, the euro is being pulled by opposing forces. Falling inflation could pave the way for policy easing in 2026, potentially weighing on the currency as euro area rates lag those elsewhere. However, this is being offset by improving growth prospects, supported by stronger survey data and a more favorable political backdrop, including eased budget tensions in France and renewed reform momentum in Germany. Wizman said stronger growth could ultimately provide greater support for the euro than lower rates would undermine it.
GBP/USD fell 0.3% to 1.3657, as the Bank of England was also expected to leave interest rates unchanged at its policy meeting on Thursday.
The yen remained under pressure.
In Asia, USD/JPY rose 0.5% to 156.55, leaving the pair near a two-week high.
The yen faced renewed pressure this week after comments from Prime Minister Sanae Takaichi cast doubt on whether Tokyo would step in to support the currency. Attention has shifted to a snap lower house election on February 8, with Takaichi’s party expected to secure a strong victory and strengthen her grip on parliament.
Elsewhere, USD/CNY edged up to 6.9415, hovering near its lowest level since mid-2023. AUD/USD slipped 0.4% to 0.6988 after rallying earlier in the week on a hawkish Reserve Bank of Australia meeting. The RBA raised interest rates by 25 basis points and lifted its growth and inflation forecasts for the year.
Elon Musk’s SpaceX is seeking early inclusion in major stock indexes ahead of a planned IPO later this year, aiming to boost liquidity and support its share price, the Wall Street Journal reported.
Advisers to the company have approached index providers such as Nasdaq to explore faster-than-usual entry into benchmark indexes, which typically require newly listed firms to wait several months. SpaceX is looking to bypass these rules as it prepares for what could be the largest U.S. IPO on record, targeting a valuation above $1 trillion, up from an estimated $800 billion previously.
Early index inclusion could attract inflows from index-tracking funds and ETFs, helping stabilize the stock in the volatile period following its debut.
Oil prices fell in Asian trading on Thursday as traders pared back risk premiums after the U.S. and Iran confirmed talks would take place on Friday.
Crude was also weighed down by a stronger U.S. dollar, which firmed ahead of key January nonfarm payrolls data due on Friday. Attention was additionally focused on major central bank meetings in Europe and the UK later on Thursday.
Prices reversed some of Wednesday’s strong gains as investors locked in profits, though oil remained on track for a weekly decline after earlier losses driven by a broader selloff in commodity markets.
Brent crude futures for April slipped 1.4% to $68.50 a barrel, while West Texas Intermediate futures fell 1.3% to $63.80 a barrel by 20:42 ET (01:42 GMT).
Earlier, oil had found support from data showing U.S. inventories declined more than expected last week, as extreme cold weather disrupted production across the country.
U.S.– Iran talks are set to be held in Oman on Friday.
U.S. and Iranian officials are due to meet in Oman on Friday, as confirmed by both sides this week, though disagreements persist over the scope of the talks.
Washington has repeatedly pushed for the discussions to include Iran’s missile program, while Tehran has said it is only willing to negotiate on its nuclear activities. These differences had earlier raised doubts about whether the meeting would go ahead, a factor that helped lift oil prices earlier in the week.
Markets have also priced in a higher risk premium for crude amid concerns that U.S. President Donald Trump could follow through on threats to launch new strikes against Iran.
A stronger dollar weighs on markets as investors await central bank meetings and upcoming payrolls data.
A firmer dollar added pressure to oil prices, as the greenback attracted strong demand this week.
Expectations around interest rate decisions from the Bank of England and the European Central Bank on Thursday prompted traders to move into the dollar, while attention also remained on upcoming U.S. nonfarm payrolls data.
The dollar rebounded sharply from near four-year lows after President Donald Trump nominated Kevin Warsh as the next Federal Reserve chair, a choice seen as less dovish by markets.
Investors are now focused on January nonfarm payrolls data due on Friday, which is expected to provide clearer signals on the future path of U.S. interest rates.
U.S. stock index futures ticked up slightly on Wednesday night after a weaker close on Wall Street, as technology stocks remained under pressure amid concerns over AI-driven disruption, while investors assessed Alphabet’s earnings report and new labor market data. S&P 500 futures rose 0.3% to 6,923.0, Nasdaq 100 futures advanced 0.4% to 25,088.75, and Dow Jones futures were mostly unchanged at 49,589.0.
Technology stocks extended their sell-off, while investors turned their attention to Alphabet’s earnings report.
In regular trading, the S&P 500 and the Nasdaq Composite fell 0.5% and 1.5%, respectively, as renewed selling pressure hit heavyweight technology and AI-related stocks. In contrast, the Dow Jones Industrial Average rose about 0.5% as investors shifted toward defensive and value names.
Technology and AI shares led the decline, extending a sector-wide selloff that has persisted into early February. Software and services stocks slid amid growing concerns that rapid advances in AI could disrupt traditional business models and squeeze margins for established companies.
Advanced Micro Devices was a key drag on market sentiment, with its shares plunging around 17% after the company reported earnings and issued guidance that failed to meet lofty market expectations. Although AMD pointed to strong AI-driven demand, investors focused on pricing pressures and intensifying competition in data centers, resulting in the stock’s sharpest one-day drop in years.
Focus also turned to Alphabet’s earnings after the close. The Google parent posted solid advertising revenue and reaffirmed plans for significant investment in AI infrastructure, but caution lingered over the near-term impact on profitability. Alphabet shares fell more than 1% in extended trading.
Meanwhile, Qualcomm shares slid nearly 10% after hours after the company forecast second-quarter revenue and profit below Wall Street estimates, citing a global memory chip shortage expected to weigh on smartphone sales and broader device demand.
U.S. private-sector payrolls rose by less than expected in January, signaling some cooling in the labor market.
Broader market sentiment was also influenced by economic data. Figures released on Wednesday showed private-sector employment increased by just 22,000 jobs last month, well short of the 50,000 gain expected, following a downwardly revised rise of 37,000 in December.
A brief government shutdown led to the postponement of the closely watched monthly jobs report, which had been scheduled for release on Friday.
Investors are now turning their attention to weekly jobless claims data due on Thursday, which should offer a near-term snapshot of labor market conditions ahead of the delayed nonfarm payrolls report.
Silver prices fell sharply during Asian trading on Thursday, dragging the broader precious metals complex lower as renewed selling pressure erased most of this week’s brief rebound.
Spot silver plunged as much as 16.7% to $73.5565 an ounce, moving back toward the lows seen after last week’s selloff, while March silver futures slid more than 10% to $73.383 per ounce. The sudden drop unfolded during the Asian session and coincided with a modest rise in the U.S. dollar.
According to Chris Weston, head of research at Pepperstone, the selloff originated in China, beginning with a decline in Shanghai silver futures before spreading to CME futures and spot markets.
Precious metals have been under pressure from a stronger dollar over the past week, as the greenback rebounded from near four-year lows after markets interpreted President Donald Trump’s nominee for the next Federal Reserve Chair, Kevin Warsh, as less dovish than expected. This sentiment has continued to weigh on metal prices.
Meanwhile, traders remained broadly positioned in favor of the dollar ahead of key European central bank meetings on Thursday and the release of U.S. nonfarm payrolls data on Friday.
On December 7, 2025, we advised maintaining a market-weight stance rather than an overweight position in the S&P 500’s Information Technology and Communication Services sectors. Since then, their combined share of the index’s market capitalization has fallen from a record 46.7% on November 5, 2025, to 43.9% as of Monday (see chart). This decline has occurred even as their combined contribution to S&P 500 earnings continued to climb, reaching a new high of 39.8% by Monday.
Despite strong growth in the two sectors’ combined forward earnings, their aggregate forward P/E multiple has compressed from 28.9 on November 5, 2025, to 24.3 currently (see chart).
On December 7 last year, we argued that AI was intensifying competition among the Magnificent Seven, compelling them to sharply ramp up investment in AI infrastructure. On that basis, we recommended an underweight position. We expect the primary beneficiaries of this dynamic to be the broader S&P 500—often referred to as the “Impressive 493”—which are leveraging AI tools to boost productivity rather than competing on infrastructure scale.
Technology has always been a highly competitive industry, and AI is intensifying that dynamic even further. In my 2018 book Predicting the Markets, I described the tech sector as a textbook case of “creative destruction,” where new innovations relentlessly displace older technologies.
More recently, software stocks have come under pressure as AI tools become increasingly proficient at writing code (see charts). While forward earnings for the sector have climbed to record levels, investors have compressed valuation multiples in response to the growing competitive threat posed by AI.
On Tuesday, software stocks were hit particularly hard after Anthropic unveiled new tools for its Cowork product. While it remains too early to assess their practical impact, investors responded by marking down valuation multiples across the software sector.
By contrast, semiconductor stocks have proven relatively resilient, even as the industry’s forward P/E multiple has declined amid a sharp surge in forward earnings (see chart). Competitive pressures are intensifying, particularly among chips designed to rival Nvidia’s (NASDAQ: NVDA) GPUs. At the same time, tight memory supply has driven prices sharply higher, though history suggests that once capacity expands to meet demand, those prices are likely to retreat.
Shares of semiconductor equipment makers have continued to climb, alongside rising earnings and expanding valuation multiples (see chart). This strength reflects the industry’s relative insulation from competitive pressures, as these companies benefit whenever demand is strong for equipment that enables chipmakers to expand production capacity.
Stocks came under heavy pressure, even as the S&P 500 ended the session with a relatively modest 85-basis-point decline. Losses were concentrated in technology and software, with the Nasdaq 100 sliding more than 1.5% and the XLK technology ETF falling over 2%. The selloff in software has been particularly severe, with several names now trading below their 2022 lows. Adobe, for instance, closed at its weakest level since October 2019.
In some ways, the current environment echoes the shift from 2021 into 2022. The crucial difference is that the Federal Reserve is now in an easing cycle, whereas policy was tightening back then. Oil prices were also racing toward $100 at the time, while this week they have struggled to stay above $60. Even so, the pattern is familiar: the Software ETF (IGV) peaked well ahead of the S&P 500 and helped pull the broader market lower, a dynamic that has also played out across several other market segments.
Pressure has also resurfaced in private equity stocks, with many now trading below their November lows.
Meanwhile, consumer staples—tracked by XLP—are surging to record highs in an unusually sharp move, reinforcing the view that markets are undergoing a broader re-rating of risk. This shift may reflect growing expectations of multiple compression, driven either by concerns that a new Fed chair could be less supportive of markets and liquidity, or by an increasing tendency among investors to separate winners from losers in the AI race.
I see this mainly as a re-pricing of risk and the early phase of multiple compression, a view that is reinforced by Microsoft’s (NASDAQ: MSFT) P/E ratio.
The brief sense of relief following the easing selloff in metals quickly faded after news emerged that Anthropic—an AI startup backed by Amazon and Google—had launched a new AI tool capable of performing legal and research tasks traditionally handled via paid databases. The announcement rattled markets, sparking fears that AI-driven disruption is accelerating and threatening the core business models of software firms that provide data analytics and decision-support tools to law firms, banks, and corporations.
The result was a renewed bout of panic selling, particularly across software stocks. In Europe, RELX and London Stock Exchange Group plunged 14% and 12% respectively, while Thomson Reuters dropped 15%. Experian, Pearson, and Sage were also caught in the downdraft. In the US, shares of FactSet, Salesforce, and Adobe fell sharply, with Adobe sliding to its lowest level in nearly six years as concerns mounted that AI competition could severely undermine parts of its core business. Even tech heavyweights were not spared: Microsoft declined 2.87% and is now roughly 25% below its November peak.
Broader technology markets also weakened. VanEck’s Semiconductor ETF fell 2.5%, while Google—despite being one of the leading AI beneficiaries—slipped 1.22% after recently hitting a record high. The selloff spilled into Asia as well, with Tencent down around 3%. South Korea’s Kospi, however, largely avoided the turmoil, supported by continued strength in Samsung Electronics and SK Hynix amid tight memory supply and strong pricing power.
On the earnings front, AMD reported a solid beat, posting revenue above $10 billion and adjusted EPS of $1.53, both exceeding expectations. Growth was driven by robust demand for data-center and AI products, alongside solid performance in PCs and gaming. Despite impressive figures—including 39% growth in data-center revenue and 34% growth in PCs—and an upbeat message from CEO Lisa Su, the company’s outlook failed to meet elevated market expectations. AMD shares fell roughly 8% in after-hours trading.
Nasdaq futures are modestly lower at the time of writing, suggesting no immediate intensification of the software-led selloff. Still, recent earnings reactions highlight a broader issue: even companies delivering strong results are being punished, as investors demand ever-higher performance to justify stretched valuations.
Attention now turns to upcoming earnings from Google and Qualcomm later today, with Amazon reporting after Thursday’s close. By week’s end, markets may have a clearer picture of where the AI trade is headed. So far, enthusiasm has been muted—Meta, for instance, failed to sustain its post-earnings rally despite AI-driven revenue growth.
It increasingly appears that the AI rally is being unwound, largely irrespective of earnings strength.
Elsewhere, geopolitical tensions between the US and Iran escalated after reports that the US Navy shot down an Iranian drone approaching a US aircraft carrier in the Arabian Sea. That development pushed US crude prices up about 2.4%, with prices now consolidating just below $64 per barrel. While geopolitically driven spikes can offer short-term trading opportunities, risks remain skewed to the upside given the fragile situation.
Zooming out, gold has climbed back above $5,000 per ounce. In the past, this might have signaled a classic flight to safety amid equity volatility and geopolitical stress. Today, however, it is less clear whether this reflects genuine risk aversion or a rapid rotation from one crowded trade—AI—into another—metals.
Safe-haven options appear increasingly constrained. Gold remains volatile, US 10-year yields are elevated amid debt concerns and potential further Fed balance-sheet tightening, and the Japanese yen continues to struggle. USDJPY is testing its 50-day moving average near 156.30 and could push higher ahead of the weekend’s snap election. That leaves the Swiss franc, with USDCHF encountering resistance near 0.78. Meanwhile, EURUSD is gradually recovering after holding support near 1.1780, while sterling is consolidating above 1.37.
Both moves are largely driven by dollar dynamics. The dollar index has come under renewed pressure ahead of US labor data, though the Bureau of Labor Statistics has announced it will not release payroll figures this Friday due to a partial government shutdown. As a result, today’s ADP report takes on added significance and is expected to show roughly 46,000 private-sector job gains—a weak figure that would reinforce the view that US economic strength remains narrowly concentrated in AI-related investment rather than broad-based growth. This two-speed economy complicates the Fed’s policy outlook.
Soft labor data would likely support a more dovish Federal Reserve stance, which—absent policy shifts from the ECB or the Bank of England—could further bolster the euro and sterling against the dollar. I continue to expect EURUSD to move back toward, and ultimately above, the 1.20 level.
Zurich Insurance Group AG (SIX: ZURN) and Beazley PLC (LON: BEZG) have agreed in principle on the main financial terms of a potential all-cash offer, valuing the UK-based insurer at around £8 billion. Under the proposed transaction, Beazley shareholders would receive up to 1,335 pence per share, consisting of 1,310 pence in cash plus allowable dividends of up to 25 pence for the year ending December 31, 2025.
The indicative offer implies a premium of almost 60% to Beazley’s closing price of 820 pence on January 16, the final trading day before the offer period commenced, and represents a 34.6% uplift to the company’s record high of 973 pence reached on June 6, 2025.
Beazley’s board said it would be “minded to recommend” the proposal to shareholders should a firm offer be made on the outlined financial terms, subject to agreement on remaining conditions and the execution of definitive documentation.
The proposed deal would bring together two complementary operations, forming a leading global specialty insurance group with roughly $15 billion in gross written premiums, supported by Beazley’s strong position at Lloyd’s of London.
Zurich is required to announce a firm intention to proceed with an offer by February 16, or confirm that it does not plan to make a bid. The Swiss insurer currently owns a 1.479% stake in Beazley, equivalent to 8,866,051 ordinary shares.
Morgan Stanley published a new analysis of Japan’s tire industry, reaffirming Overweight (OW) ratings on two major companies with solid growth prospects despite differing market pressures. The report highlights firms well positioned to benefit from opportunities in North America while navigating sector-specific challenges.
1. Toyo Tire — Morgan Stanley reiterates its Overweight rating on Toyo, pointing to growing confidence in the company’s growth strategy and shareholder return outlook ahead of its Medium-Term Plan announcement on March 4. Analysts see additional upside as investors continue to factor in stronger demand for WLTR (Wide Light Truck Radial) tires in North America, where Toyo holds a well-established market position.
2. Bridgestone — Bridgestone also retains an Overweight rating, supported by initiatives to reinvigorate the Firestone brand in the North American market. Morgan Stanley highlights encouraging expectations from the company’s restructuring efforts, while cautioning that soft OE (Original Equipment) demand for TBR (Truck and Bus Radial) tires in North and South America presents a downside risk. Nonetheless, replacement demand in these regions remains resilient.
Bitcoin hovered just above 15-month lows on Wednesday after a sharp sell-off drove the world’s largest cryptocurrency down toward the $73,000 level amid a wave of liquidations and heightened risk aversion. The token was last trading 2.8% lower at $76,509.1 as of 01:56 ET (06:56 GMT), having earlier touched $73,004.3—its weakest level since November 2024.
Following the weekend’s slump, Bitcoin fell nearly 12% last week, building on a roughly 10% decline in the prior week. The latest drop marks its lowest point since Donald Trump’s U.S. election victory, wiping out gains that had previously been supported by optimism around potential regulatory easing for the cryptocurrency sector.
Bitcoin sinks to a 15-month low as mass liquidations accelerate
The downturn was accompanied by widespread liquidations of leveraged long positions. According to data from crypto analytics firm CoinGlass, nearly $740 million in bullish bets were erased over the past 24 hours, as falling prices triggered margin calls and forced traders to close positions.
Bitcoin’s latest weakness represents a sharp reversal from the strong rally seen late last year, when prices surged in the wake of Donald Trump’s election victory. At that time, investors poured into cryptocurrencies on expectations that a new U.S. administration would adopt a more supportive regulatory approach to digital assets. Additional tailwinds came from Federal Reserve rate cuts starting in December 2024, which helped fuel demand for higher-risk assets.
Gold and other traditional safe-haven assets rebounded on Wednesday as geopolitical tensions between the United States and Iran intensified.
At the same time, cryptocurrency markets remain under pressure amid uncertainty surrounding U.S. monetary policy following President Trump’s nomination of former Federal Reserve Governor Kevin Warsh as the next Fed chair. Warsh is widely regarded as a policy hawk, raising concerns over tighter liquidity conditions.
Most altcoins remained under pressure on Thursday, posting steeper losses than Bitcoin. Ethereum, the world’s second-largest cryptocurrency, slipped 2.3% to $2,268.92, while XRP, ranked third, edged 1.1% lower to $1.59.
Solana dropped 6%, while Cardano also moved lower and Polygon declined 3.5%. Among meme tokens, Dogecoin was marginally weaker, down 0.2%.
The mainstream narrative claims that a new Fed chair will safeguard the central bank’s independence from U.S. government influence—and that this alone justifies a $1,200/oz drop in gold and a $50 collapse in silver.
Put simply, that narrative is complete nonsense.
Fiat currency is best thought of as meme—or even junk—money, and despite its obvious flaws, it can still enjoy periodic rallies against what many see as the ultimate form of money: gold. These countertrend moves typically emerge during bouts of speculative excess, much like the frothy conditions that have dominated markets over the past couple of months.
From a fundamental standpoint, the gold bull market remains fully intact. Billions of gold-focused savers across China and India—along with a smaller group of informed Western investors—do not rely on central banks for validation. Their priority is building long-term wealth in gold, not accumulating ever more fiat currency and debt.
In the context of this broader bull cycle, it makes little difference who occupies the Fed chair. What matters is whether gold is attractively priced. When it is, prudent savers see it as an opportunity to accumulate more, regardless of short-term fiat-driven narratives.
The long-awaited “exciting buy zone” has finally come into play. Gold investors were encouraged to prepare for a meaningful dip into the $4,400 area, and that discounted opportunity has now materialized.
Sustainable wealth building is not about predicting prices, but about preparing for unexpected moves. This pullback unfolded over just a few days, leaving unprepared investors confused and still focused on guessing what happens next.
The key development now is that the $5,600 region has emerged as a major accumulation zone on any future pullback. Gold investors should already be positioning themselves to take advantage of that opportunity if and when it presents itself.
As for silver, the recent price sell-off was “super-sized,” driven by large and heavily leveraged bets against fiat currencies. That decline ultimately found support at the $70 buy zone, aligning perfectly with gold’s move into the $4,400 area.
Gold remains the undisputed leader of the precious metals complex. If silver investors and mining-stock enthusiasts take their cues from gold bullion, they position themselves to build substantial and durable wealth. The most likely near-term path for silver is a broad trading range between $70 and $120, followed by a powerful upside breakout that could propel prices toward the next target zone of $170–$200.
Over the longer term, silver has the potential to trade well above $1,000, largely because governments worldwide—both in the East and the West—continue to cling to fiat currencies and debt rather than returning to sound money anchored in gold.
A new 40-year inflation cycle began in 2020 and is unlikely to end until U.S. interest rates reach record highs. Unlike the cycle’s conclusion in 1980, however, elevated rates this time are unlikely to curb inflation, as it is being driven by ongoing government policies rather than purely monetary conditions.
Another perspective on U.S. rates: the incoming Fed chair is more likely to lean toward fiscal restraint on a debt-addicted U.S. government than to dispense easy-money policies of QE and rate cuts. Such a stance would have implications for long-term sovereign yields worldwide, and global money managers are likely to continue shifting capital into gold as a strategic response.
As interest rates continue their relentless climb in the years ahead, governments will inevitably confront their “Queen Gold maker.” They will be forced to begin replacing fragile fiat currencies with gold—or face effective financial ruin.
As for robots, they will simply become another cost burden for citizens already trapped in stagflation. As automation expands rapidly and robot populations eventually outnumber humans, workers will be left competing for a shrinking pool of jobs. Confronted with government-driven stagflation and lacking the protection of gold savings, many will endure severe financial stress—conditions that would be further worsened by a stock market crash.
As for the miners, they too presented exceptional buying opportunities when gold dipped to $4,400. The CDNX is now starting to emerge from a decade-long base, with price action that closely resembles gold’s breakout above $2,000. The initial rally may appear deceptive, but it is genuine—because this type of breakout unfolds as a process rather than a single, short-lived move. Notably, trading volumes across CDNX-listed stocks have surged, reinforcing the strength of the move.
While pockets of speculative excess briefly appeared in gold and silver bullion, such froth has been absent in the mining sector. Several silver explorers nearing production are projecting all-in sustaining costs well below $20, while gold explorers with large-scale projects are reporting AISC figures under $2,000. The conclusion is clear: junior gold and silver miners may represent the most undervalued segment in market history.
And what about the senior miners? The GDX versus gold chart is striking. Since the 2015 low—when the head of a massive inverse head-and-shoulders pattern began to form—I’ve been guiding investors through this setup. That structure points not merely to years, but potentially decades of strong performance for gold equities. In alignment with the CDNX-to-fiat picture, the breakout process is now underway.
The GDX daily chart delivers a real “wow factor.” The latest five-wave advance was remarkable—and signs suggest a new leg higher may already be unfolding. Notably, GDX’s recent pullback held well above its October highs, even as gold retraced back to that level. That kind of relative strength is a powerful signal that further upside is likely.
Even if gold consolidates between $5,600 and $4,400, and silver oscillates between $120 and $70, GDX and many of its underlying stocks could still push on to new highs. With 2026 marking the Chinese Year of the Fire Horse—symbolizing bold action and the fight for freedom—the question arises: are gold and silver equities poised for their own moment of liberation, breaking out to extraordinary new levels? The evidence suggests they are.