Inflation came in cooler than anticipated in January, though markets still largely expect the Federal Reserve to hold its benchmark rate steady until June. However, the bond market appears ready to test that timeline, increasingly factoring in the possibility of a rate cut arriving sooner.
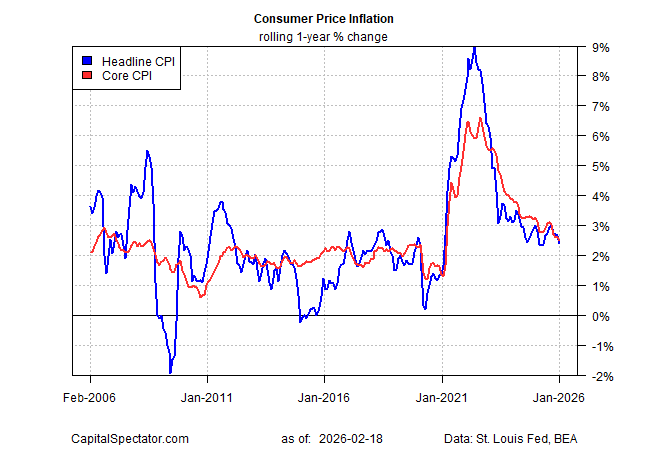
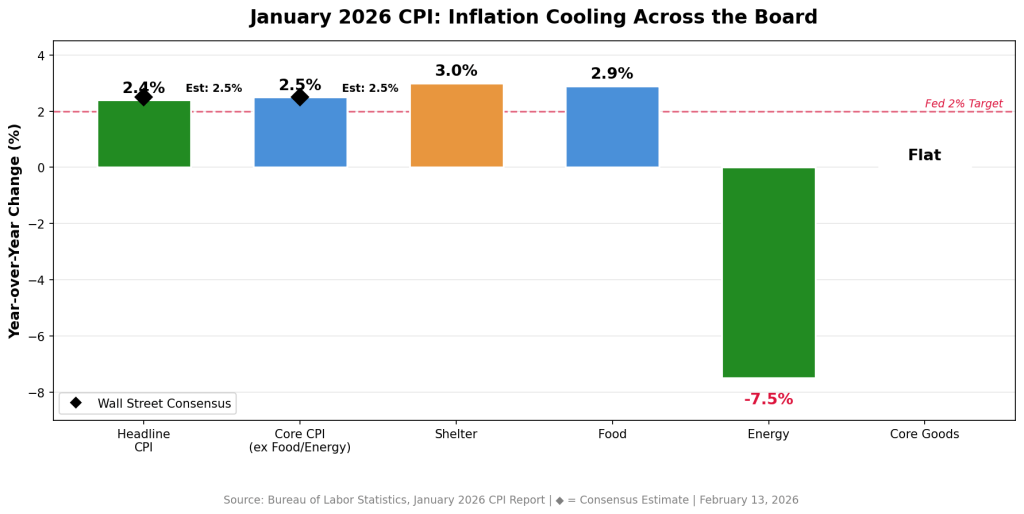
According to government data released Friday, the Consumer Price Index (CPI) rose 2.4% year over year in January, down from 2.7% in December and marking the lowest reading in eight months. Core CPI—which excludes volatile food and energy prices and is considered a clearer gauge of underlying inflation—also eased to 2.5% annually, its slowest pace since 2021.
While the slowdown in headline inflation is a welcome development, a deeper dive into the data suggests it may be premature to relax concerns about where prices are headed next. Persistent increases in tariff-sensitive goods remain one pressure point. Food prices are another, climbing 2.9% year over year—elevated by historical standards.
Energy costs rose even more sharply, and both homeowners’ and renters’ insurance premiums continued to increase. Moreover, inflation is still running above the Federal Reserve’s 2% target, reinforcing the likelihood that policymakers will proceed carefully.
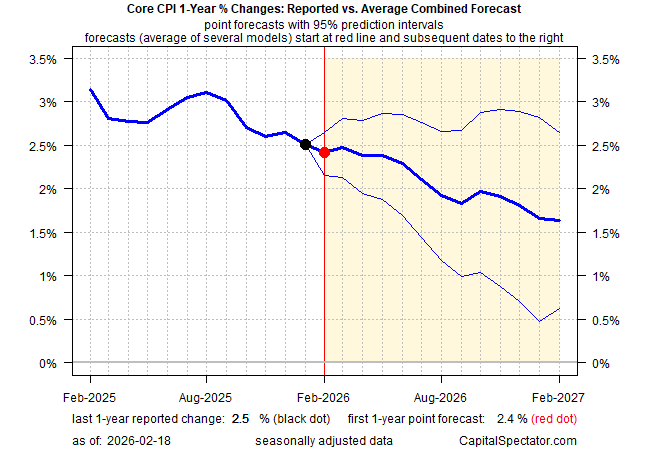
Although it’s too soon to claim inflation has been fully tamed, the broader trend of moderating price growth strengthens the argument that the worst may be behind us. The Capital Spectator’s ensemble forecast has long projected continued disinflation in core CPI, a view that has so far aligned reasonably well with actual data. The model still anticipates further easing, with core CPI’s 12-month rate expected to edge down to around 2.4% in the upcoming February report.
Fed funds futures continue to indicate that the first rate cut won’t arrive until the June meeting. In contrast, the Treasury market appears to be probing the possibility of an earlier move. The policy-sensitive 2-year Treasury yield has fallen to about 3.45%—near its lowest level since 2022—and now sits below the Federal Reserve’s current target range of 3.50% to 3.75%, signaling that bond investors may be anticipating a faster shift in policy.
In short, Treasury market sentiment is tilting toward the idea that a rate cut could come sooner than previously anticipated. Other market-based indicators are reinforcing that view by assigning higher odds to continued disinflation.
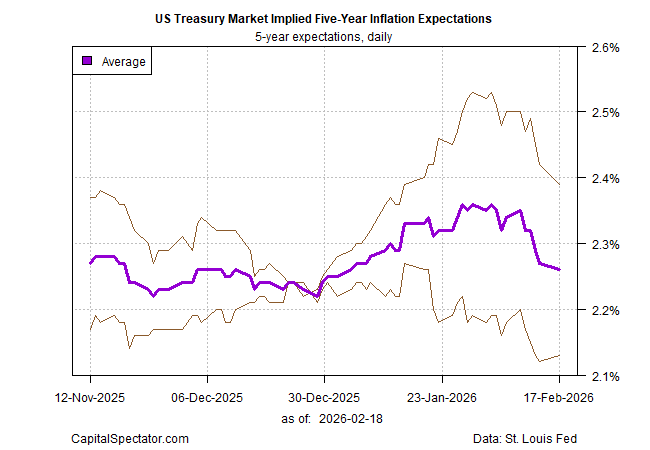
The average of two Treasury-derived inflation gauges now projects five-year inflation in the low 2% range—the mildest reading in a month and not far from the Federal Reserve’s 2% objective. The surge in inflation expectations seen in January has since unwound, signaling that investors have grown less worried about upside inflation risks in recent weeks.
Markets are not infallible, but it would likely require a meaningful upside surprise in the economic data—pointing to renewed inflationary pressure—to overturn the prevailing disinflation narrative. For now, investors show little appetite for betting on a reflationary turn.
The inflation print investors had been bracing for came in cooler than expected.
Friday’s January CPI showed headline inflation at 2.4%—below the 2.5% consensus forecast and the lowest annual reading since May 2025. Core CPI, which excludes food and energy, eased to 2.5%, marking its softest level since April 2021. On a monthly basis, prices rose just 0.2%, the smallest increase since July.
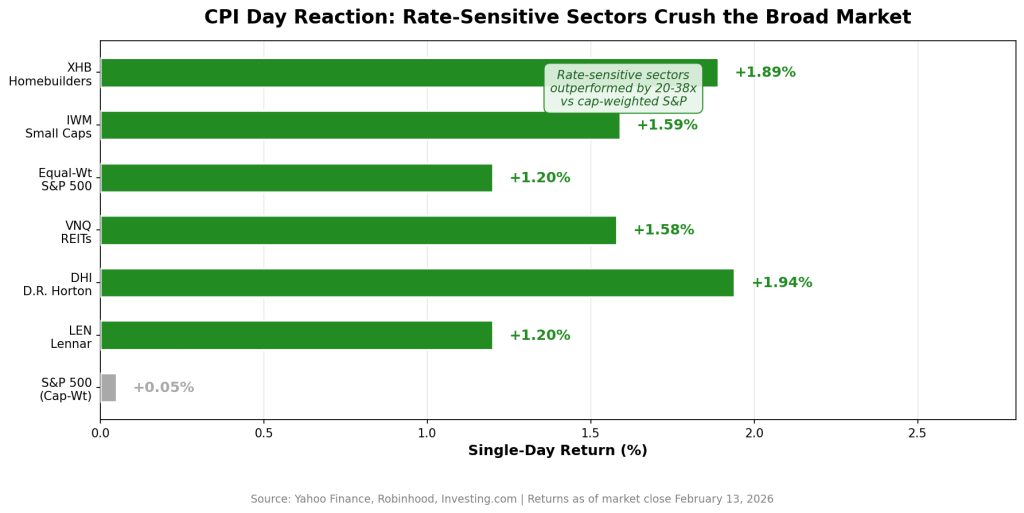
Markets reacted swiftly. Homebuilder stocks rallied sharply, small caps climbed 1.2%, and the 10-year Treasury yield slid to its lowest point since early December.
My takeaway: the market may have just received the confirmation it was waiting for. And the most compelling opportunities from here likely aren’t the mega-cap tech leaders that have dominated performance, but rather rate-sensitive sectors that were punished under the “higher for longer” narrative and are now repricing for a potentially different 2026 backdrop.
What the CPI Report Really Signals
Shelter—by far the largest CPI component and the category that has stubbornly kept headline inflation elevated—rose only 0.2% in January, bringing the annual rate down to 3%. That’s a notable slowdown and perhaps the clearest indication yet that the housing inflation lag is beginning to unwind.
Energy prices declined 1.5%, with gasoline tumbling 3.2% during the month. Food inflation held at 2.9% year over year—still somewhat elevated, but not alarming. Importantly, core goods prices were flat, helping to counter concerns that renewed tariffs would reignite goods inflation.
“Headline CPI inflation was a touch softer than expected in January, delivering a welcome surprise to the downside at the beginning of the year,” said Bernard Yaros, lead economist at Oxford Economics. He added that tariff-related price pressures “are largely behind us.”
Lindsay Rosner of Goldman Sachs Asset Management was even more direct: “Trust the groundhog. The Fed’s path to normalization cuts appears clearer now.”
The timing is critical. A stronger-than-expected January jobs report—130,000 payrolls versus forecasts of 55,000—had pushed expectations for rate cuts further out, likely into the summer. This softer CPI reading shifts that outlook. Economists surveyed by Bloomberg now anticipate as much as 100 basis points of easing this year, with the first cut potentially arriving in June—or even March if disinflation continues.
Why Rate-Sensitive Stocks Stand Out
One key dynamic investors often overlook is that by the time the Federal Reserve actually begins cutting rates, much of the upside in rate-sensitive sectors has already played out. Markets tend to price in policy shifts well in advance.
Friday’s CPI data appeared to give institutional investors the confidence to begin reallocating toward sectors poised to benefit from lower yields. The equal-weight version of the S&P 500 and the Russell 2000 both climbed 1.2%, notably outperforming the traditional cap-weighted S&P 500, which was little changed.
That divergence is often viewed as a textbook signal of sector rotation—away from mega-cap dominance and toward more rate-sensitive, economically cyclical areas of the market.
Capital is rotating down the market-cap ladder and into economically sensitive groups. Three segments stand out most clearly: homebuilders, REITs, and small caps.
How to Position
D.R. Horton (DHI)
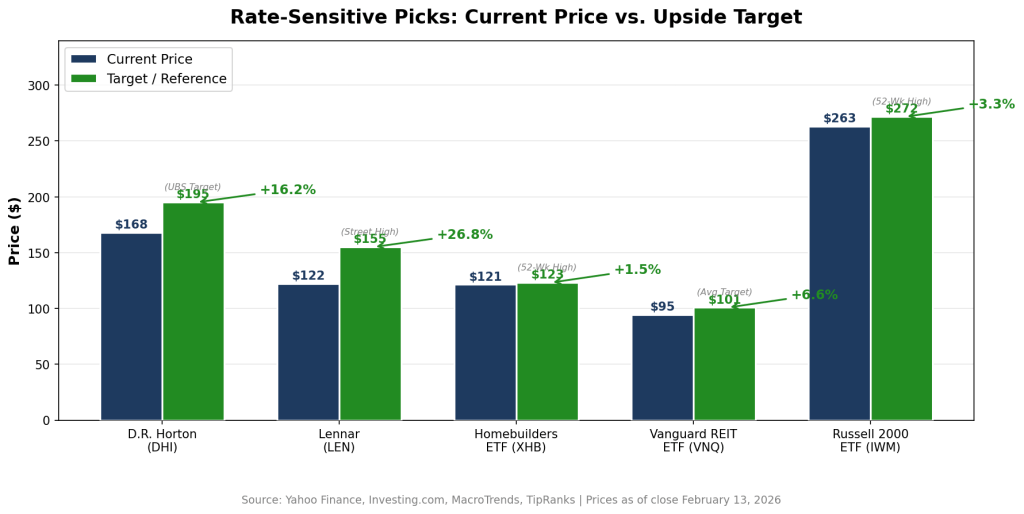
Closing Friday at $167.78, DHI is arguably the purest expression of the housing-affordability theme. The largest U.S. homebuilder by volume posted solid fiscal Q1 results in January, with revenue of $6.89 billion (ahead of $6.59 billion estimates) and EPS of $2.03 (vs. $1.93 expected).
At roughly 15.3x trailing earnings, the stock trades at a notable discount to the broader market. Beyond the rate backdrop, there’s also a policy angle: the Trump administration’s reported “Trump Homes” initiative has involved direct engagement with builders around affordability measures—potentially creating a dual tailwind of lower mortgage rates and regulatory support.
The median analyst price target is $170, with UBS as high as $195—suggesting upside potential of roughly 16%.
Lennar (LEN)
Trading at $122.28, Lennar offers a slightly different profile as the second-largest U.S. builder. Its “land-light” model—optioning land instead of holding it outright—reduces balance-sheet risk and positions it well for a rate-cutting cycle.
The stock has rebounded about 40% from its April 2025 lows but remains below its 2024 peak. With fiscal Q1 earnings due in late March, improving mortgage application trends could serve as a near-term catalyst if rates continue to ease.
SPDR S&P Homebuilders ETF (XHB)
At $121.36, XHB is up nearly 18% year-to-date and recently marked a fresh 52-week high of $123.13. As an equal-weighted ETF, it offers diversified exposure across the housing ecosystem—not just large builders, but also building products manufacturers, home improvement retailers, and construction suppliers.
For investors who prefer sector exposure over single-stock risk, XHB provides a balanced approach.
Vanguard Real Estate ETF (VNQ)
Trading near $94.59—close to its 52-week high—VNQ provides broad exposure to the REIT space, one of the most rate-sensitive areas of the market. The ETF holds over 150 REITs across healthcare, industrial, data center, and retail subsectors.
Its largest holdings include Welltower, Prologis, and American Tower.
With an average analyst target near $100.81, implied upside sits around 8%, in addition to a dividend yield of roughly 3.6%. After significant underperformance during the rate-hiking cycle, REITs are positioned to benefit mechanically as yields decline.
iShares Russell 2000 ETF (IWM)
At approximately $263, IWM tracks small-cap equities—arguably the most interest-rate-sensitive segment of the equity market. Smaller firms tend to carry more floating-rate debt and are disproportionately affected by elevated borrowing costs. That dynamic can reverse sharply when policy eases.
IWM surged 1.6% on Friday’s CPI release alone. With its 52-week high of $271.60 within reach, sustained rate declines could drive a prolonged catch-up rally in small caps.
The Big Picture
If inflation continues to moderate and rate-cut expectations firm, the leadership baton may continue shifting away from mega-cap growth and toward housing, real estate, and smaller domestically oriented companies. Markets typically front-run the policy cycle—and this rotation suggests that repositioning may already be underway.
The Bear Case (and Why It May Be Overstated)
There are valid reasons for caution. Fox Business pointed out that January’s CPI could carry a downward bias tied to last fall’s government shutdown. During that period, the Bureau of Labor Statistics missed portions of October data collection and relied on a “carry-forward” methodology that may influence inflation readings into spring 2026. In short, the 2.4% headline figure could be somewhat understated.
There’s also the Federal Reserve itself. Policymakers are not signaling urgency. Oxford Economics continues to project cuts in June and December rather than March. Meanwhile, although the labor market is cooling—annual benchmark revisions show 2025 job growth was the weakest since 2003 outside recessionary periods—it is far from collapsing. Jerome Powell has consistently emphasized the need for a sustained disinflation trend, not a single favorable report.
The Counterargument
Even if the Fed waits until June, markets won’t. Yields have already declined meaningfully. Mortgage rates are edging lower. And sectors that trade on rate expectations—rather than the actual fed funds rate—are beginning to reprice now. By the time the first official cut arrives, much of the move in rate-sensitive equities could already be behind us.
What to Watch
Three near-term catalysts will likely shape the next phase:
Fed Minutes (Feb. 18): The release of the latest policy meeting minutes could shift expectations quickly. Any dovish commentary on inflation progress or labor-market softness may pull forward rate-cut pricing.
Walmart Q4 Earnings (Feb. 19): As the largest U.S. retailer—now with a market cap above $1 trillion and up 13% year-to-date—Walmart’s guidance will offer real-time insight into consumer spending trends. If easing inflation is translating into stronger purchasing power, that reinforces the soft-landing narrative.
PCE Price Index (Later This Month): The Fed’s preferred inflation gauge will be pivotal. Confirmation of CPI’s cooling trend would likely solidify expectations for a June cut and intensify debate around a possible March move—potentially fueling the next leg higher in rate-sensitive stocks.
Bottom Line
The inflation backdrop has shifted in a way that favors investors. The opportunity isn’t complex—but it does require stepping away from the mega-cap tech trade that has dominated for the past two years and leaning into sectors positioned to benefit most from falling yields.
MUFG Senior Currency Analyst Lloyd Chan observes that the US dollar remained resilient after stronger-than-expected nonfarm payrolls, though it struggled to build lasting upward momentum as markets question how much further interest rates can shift in a hawkish direction. He points to the January US CPI release as the next major catalyst, noting that only an upside inflation surprise is likely to spark renewed hawkish repricing and support further dollar strength.
CPI surprise seen as key for further gains
Chan explains that while solid payroll data has eased immediate concerns about a sharp slowdown in the labour market, it has not significantly altered the broader macroeconomic outlook. The dollar held steady in the aftermath of the jobs report but failed to generate sustained gains, highlighting investor skepticism over the scope for additional hawkish rate adjustments.
Attention now turns firmly to the upcoming US CPI data, expected to be the primary driver for both rates and currency markets. MUFG’s US strategist forecasts January core CPI to rise 0.25% month-on-month and 2.6% year-on-year, with base effects boosting the annual figure. In contrast, Bloomberg consensus anticipates 2.5% year-on-year for both headline and core inflation.
From a market standpoint, inflation would likely need to exceed expectations to prompt a fresh hawkish repricing of the Federal Reserve’s rate trajectory. If the data meets or falls short of forecasts, markets are likely to stick with expectations of roughly two rate cuts this year, limiting further upside for the dollar.
Most Asian currencies strengthened on Tuesday, following an overnight pullback in the dollar as its recent rebound lost momentum ahead of a batch of key U.S. economic data due this week. The Japanese yen edged higher, extending prior gains as fresh government warnings on possible market intervention supported the currency, offsetting concerns about heavier fiscal spending under Prime Minister Sanae Takaichi after her landslide election win. Regional FX benefited from the softer dollar, though advances were capped by investor caution ahead of upcoming U.S. data releases.
Dollar steadies after overnight drop, with payrolls and CPI in focus.
The dollar index was little changed in Asian trade after sliding about 0.7% overnight, leaving the greenback hovering near a late-January, almost four-year low. BofA said the absence of fresh catalysts points to choppy, two-way dollar trading with a mild bearish bias ahead of key U.S. data. Markets are now focused on December retail sales due Tuesday, followed by January nonfarm payrolls on Wednesday and CPI inflation on Friday.
The data will be closely scrutinized for signals on interest rates, as markets remain on edge over U.S. monetary policy following President Donald Trump’s nomination of Kevin Warsh to succeed Jerome Powell as Fed chair. Warsh is seen as a less dovish choice, a perception that has already fueled a sharp dollar rebound and weighed on Asian currencies.
Asian currencies firm, with the yen holding on to post-election gains.
Asian currencies broadly strengthened on Tuesday, led by the Japanese yen, with USD/JPY down 0.3%. The yen extended gains for a second session after renewed government warnings on possible currency intervention, helping it shrug off lingering concerns over Japan’s heavy debt burden despite Prime Minister Sanae Takaichi’s landslide victory. Her ruling coalition’s supermajority gives room for expansive fiscal and budget reforms, including higher spending and tax incentives.
Elsewhere, the Chinese yuan rose, with USD/CNY down 0.2% to its strongest level in over 2½ years, supported by firm midpoint settings from Beijing ahead of upcoming CPI data. The Australian dollar slipped 0.1%, paring gains after hawkish RBA comments, while BofA warned the Aussie’s rally may be overextended. The Singapore dollar was flat despite stronger-than-expected Q4 GDP, while the South Korean won and Indian rupee edged higher, though the rupee remained above 90 per dollar.
Last week, we kicked off a broad review of the key macro forces shaping the stock market, focusing on the health of the economy and earnings expectations. The takeaway was clear: the economy appears to be in solid shape, and consensus forecasts for earnings growth this year are not just positive, but notably strong.
Admittedly, there has been no shortage of headlines and market volatility since then. It would be reasonable to dive into geopolitical developments, market breadth, or the current state of the AI trade. However, at least for now, none of these factors have altered the market’s primary trend. With that in mind, it makes sense to continue our top-down assessment of the major macro drivers.
Having already examined the economy and earnings, the remaining areas to address are inflation, Federal Reserve policy and interest rates, and market valuations. Let’s turn to those next.
What Is Inflation?
The Federal Reserve defines inflation as a sustained rise in the prices of goods and services over time, reflecting a general increase in the overall price level across the economy. Similarly, Investopedia and standard economics textbooks describe inflation as a gradual erosion of purchasing power, manifested through a broad-based increase in the prices of goods and services over time. The International Monetary Fund frames inflation as the pace at which prices rise over a given period, indicating how much more costly a representative basket of goods and services has become.
Or, as I was taught in my very first economics class many years ago, inflation can be summed up as “too much money chasing too few goods.”
In Focus
There is little doubt that inflation has dominated the attention of the Federal Reserve, policymakers, consumers, and financial markets for several years. Unless one has been completely disconnected from events, it is well known that inflation surged in the aftermath of the COVID crisis, driven by trillions of dollars in government stimulus flowing into household bank accounts and severe disruptions across global supply chains.
This surge fueled fears that the United States was heading back toward the inflationary turmoil of the 1970s—a period the Fed ultimately subdued, but only at significant cost to the economy. With the Consumer Price Index approaching double-digit territory in early 2022, such concerns were understandable.
As the pandemic faded and supply chains normalized, inflationary pressures also began to ease. By early 2024, CPI readings had fallen back near pre-pandemic levels, when face coverings were not yet a cultural norm. The key question now is whether the inflation spike has been fully brought under control.
While corporate pricing strategies and consumer behavior—both central drivers of inflation—are inherently difficult to forecast, it remains possible to analyze the components of the CPI and examine the historical forces that have shaped inflation trends.
A Framework for Understanding Inflation
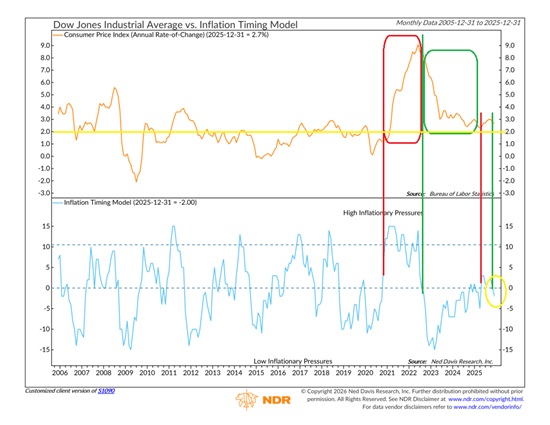
Unsurprisingly, the team at Ned Davis Research Group has already taken this step. In short, there is indeed a model that addresses this—shown below.
The upper chart shows the Consumer Price Index, which represents the inflation rate, while the lower chart displays NDR’s Inflation Timing Model. Reading the model is fairly intuitive. When the blue line rises above zero, it signals that inflation pressures are likely increasing. Historically, readings above 10 have coincided with periods when inflation was significantly above normal levels.
The red box highlights the CPI period from late 2020 through early 2022. During that phase, the model effectively flagged the acceleration in inflation and warned that conditions were set to deteriorate. The model also performed well in the opposite direction in the fall of 2022. While widespread concern about inflation persisted, the model correctly indicated that inflation was poised to ease—and it did.
That downtrend continued until late 2024 or early 2025, when the model briefly suggested inflation was no longer moving in the right direction. However, the signal proved temporary, as the model dropped back below the zero line by the end of 2025. Encouragingly, recent data has validated the model’s current reading, with price pressures generally moderating and the inflation rate falling back below 3%.
Is 3% Becoming the New Inflation Norm?
Inflation skeptics are quick to push back against my relatively calm view, pointing out that inflation remains well above the Federal Reserve’s stated 2% target. From that perspective, they argue the Fed is unlikely to turn accommodative anytime soon. While this logic is understandable, it overlooks two important points: first, the Fed operates under a dual mandate, and second, its preferred inflation gauge—core PCE—differs from the inflation measures most often highlighted in the media.
Crucially, inflation is not the Fed’s sole concern. Maintaining a healthy labor market is equally central to its mission. As a result, the Federal Open Market Committee must carefully balance inflation pressures against broader economic conditions.
This helps explain why the Fed has been cutting interest rates even as inflation remains above target. The labor market has shown signs of weakening, prompting policymakers to act. Equity bulls have welcomed these moves, mindful of the long-standing adage that it rarely pays to fight the Fed. With rates coming down, investors have largely aligned with the bullish camp.
That said, it’s important to recognize that the Fed is not engaged in an aggressive stimulus campaign. Chair Jerome Powell and his colleagues are not attempting to jump-start the economy. Instead, they are seeking to bring interest rates back toward a more neutral, “normal” level—one that balances inflation with labor market stability.
In this context, the prevailing view is that the Fed is willing to tolerate inflation running somewhat above its 2% target while it works to shore up employment conditions. From that standpoint, an inflation rate around 3% may be acceptable—for the time being.
In Summary
The encouraging takeaway is that history suggests a modest amount of inflation can actually be beneficial—supporting stock prices, home values, and corporate earnings. From that perspective, inflation does not appear to be a headwind for equities at present. While this may not be a classic “don’t fight the Fed” environment, the central bank is also not acting as an adversary. As a result, my view is that investors can remain on the bullish path—for now.
Australian CPI inflation slowed more than expected in November as electricity prices eased, though core inflation remained sticky and above the Reserve Bank of Australia’s target band. Data from the Australian Bureau of Statistics released Wednesday showed annual CPI rising 3.4%, below forecasts of 3.6% and down from 3.8% in October.
The slowdown in inflation was mainly driven by electricity prices rising at a softer pace than in the previous month, while housing, food, and transport costs continued to climb. Core inflation remained persistent, with the trimmed mean CPI at 3.2% in November, easing slightly from 3.3% in October but still above the RBA’s 2%–3% target range. Goods inflation cooled to 3.3% from 3.8%, largely due to slower electricity price growth, while services inflation also eased to 3.6% from 3.9%, mainly reflecting seasonal factors. The ABS said Black Friday had minimal impact on prices. Although headline CPI softened, it remains uncertain whether the decline is enough to shift the RBA’s hawkish outlook, as the central bank paused its rate-cut cycle in late 2025 and signaled rates will stay unchanged amid stubborn inflation.
ANZ analysts said the November CPI figures suggest the RBA is likely to keep rates unchanged in February, while potentially debating a rate hike later in the year. They added that inflation pressures are expected to ease as 2026 progresses, with the cash rate forecast to remain at 3.60% over their outlook period. Meanwhile, Australian inflation unexpectedly accelerated in late 2025, driven by higher housing and food costs, while the gradual removal of Canberra’s electricity subsidies also pushed prices higher.