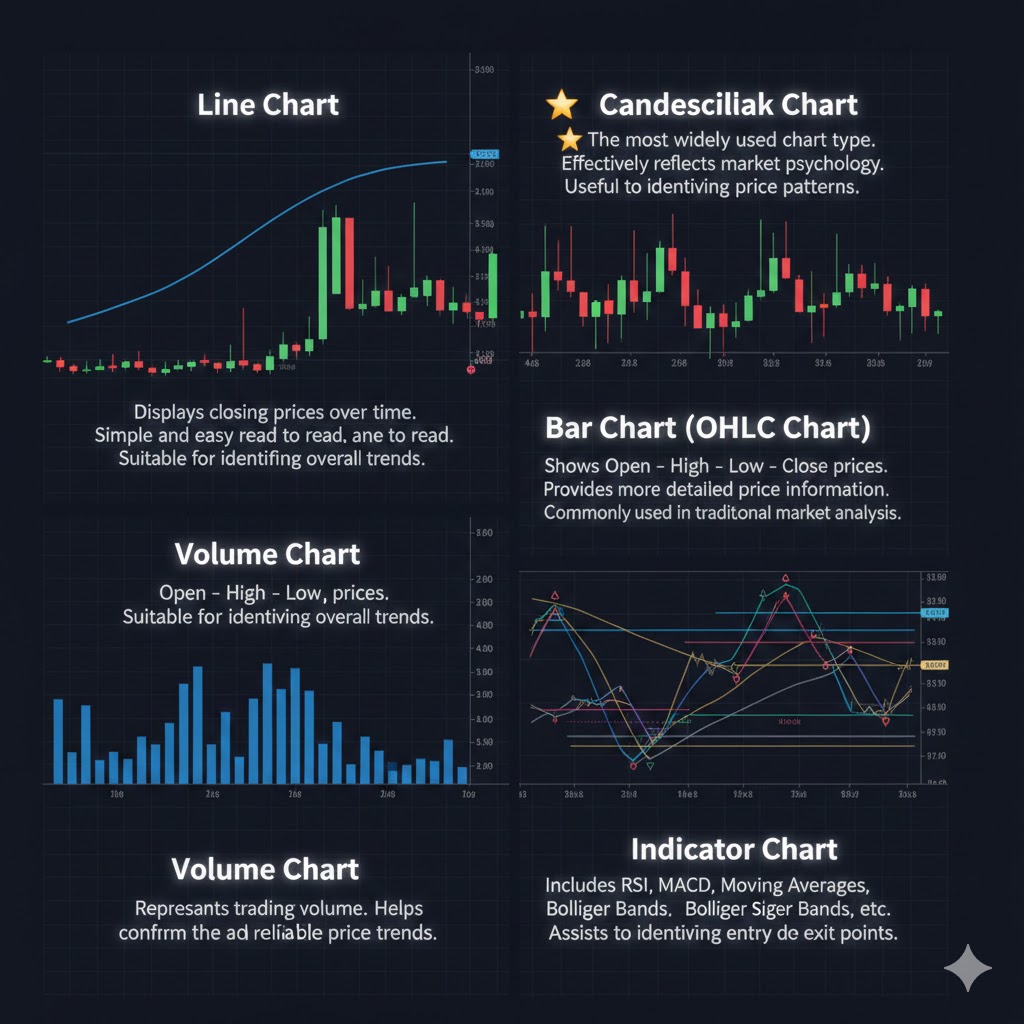
Financial charts are visual tools used to represent price movements, trading volume, and market trends over time. They are a fundamental component of Technical Analysis.
Markets where financial charts are applied
- 📈 Stock Market
- 💱 Forex
- 🪙 Cryptocurrency
- 🛢️ Commodities
- 📉 Derivatives (Futures, Options, CFD)
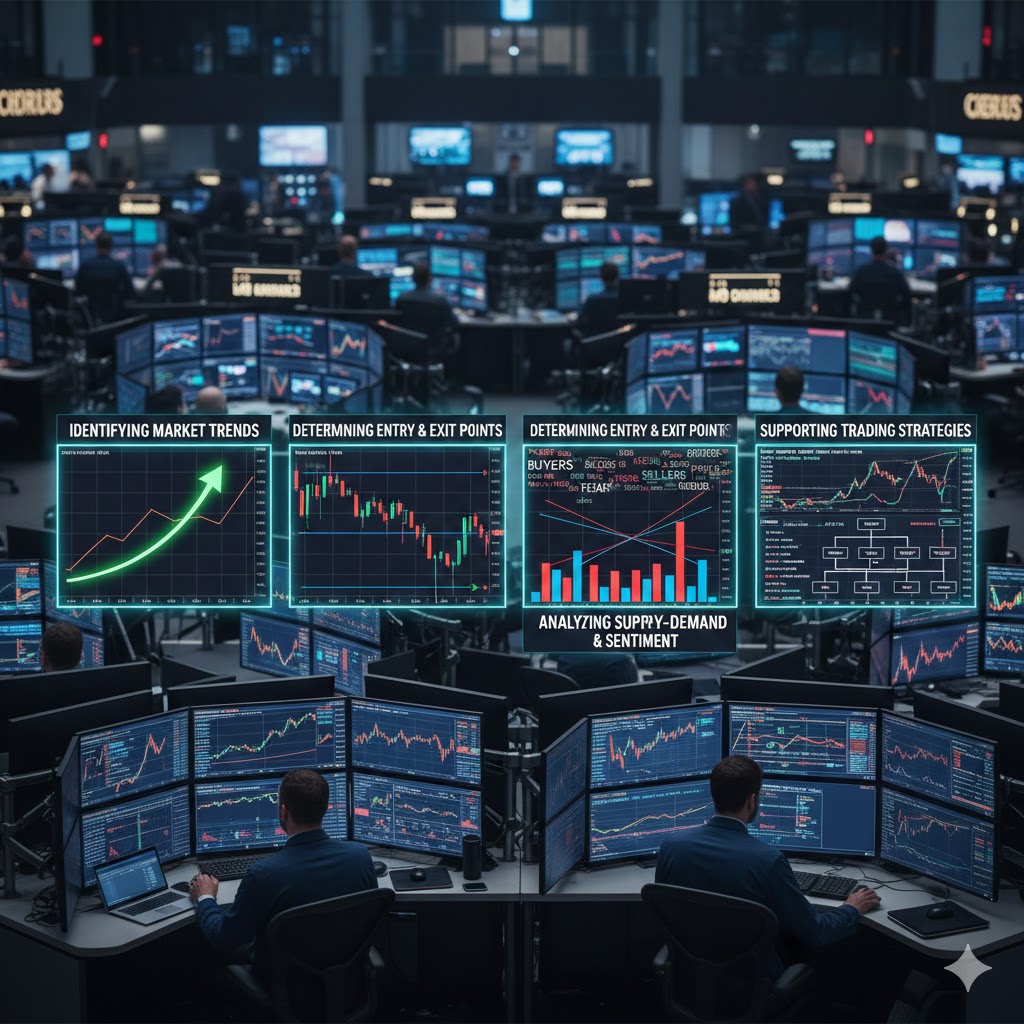
Purposes of using financial charts