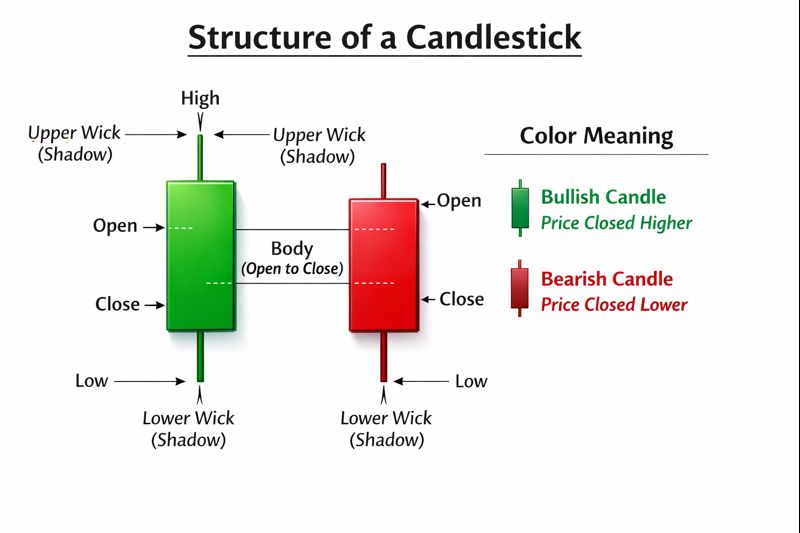
Japanese Candlesticks are a type of price chart used in financial markets to show how an asset’s price moves over a specific period of time. They are one of the most popular tools in technical analysis because they visually display market psychology—who is in control: buyers or sellers.
Origin
Japanese candlesticks were developed in Japan in the 18th century, originally used by rice traders. They were later introduced to Western markets by Steve Nison in the 1990s.
Why Candlesticks Are Powerful
- Easy to read and interpret
- Show market sentiment instantly
- Help identify trend reversals and continuations
- Work across all markets and timeframes
Used in
📈 Stocks
💱 Forex
🪙 Crypto
🛢️ Commodities
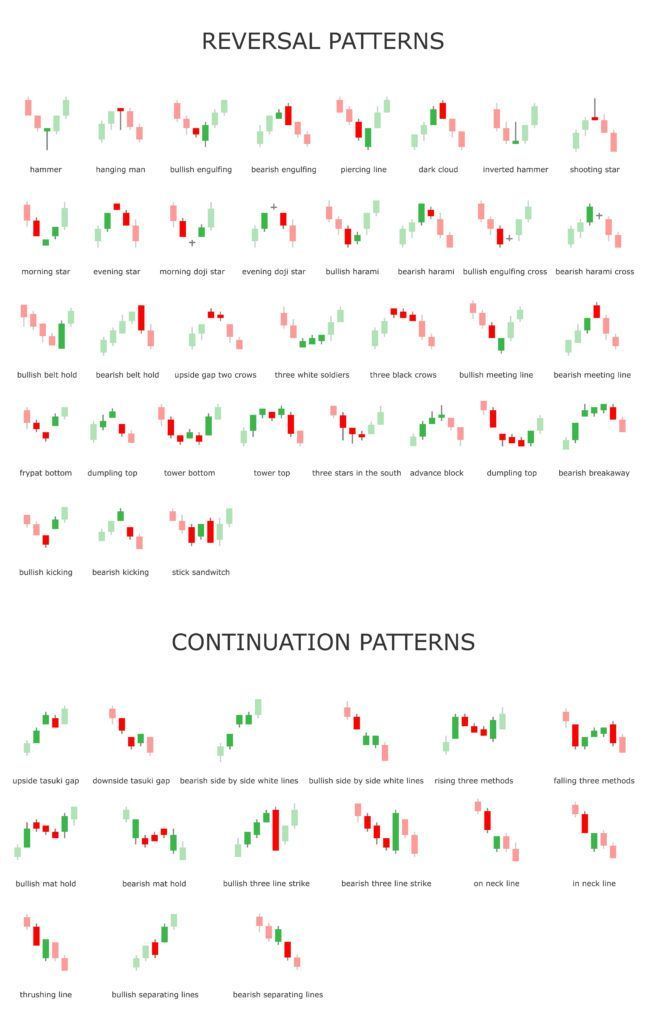
Common Candlestick Patterns
Best Practice
Candlestick patterns are most effective when combined with:
- Trend analysis
- Support & resistance
- Volume
- Indicators (RSI, MACD, Moving Averages)
Simple Definition
Japanese candlesticks are a visual price charting method that shows market psychology through price action.
