Fibonacci Retracement is a technical analysis tool used in financial markets to identify potential support and resistance levels during a price pullback within a trend.
It is based on Fibonacci ratios, which come from the Fibonacci number sequence.
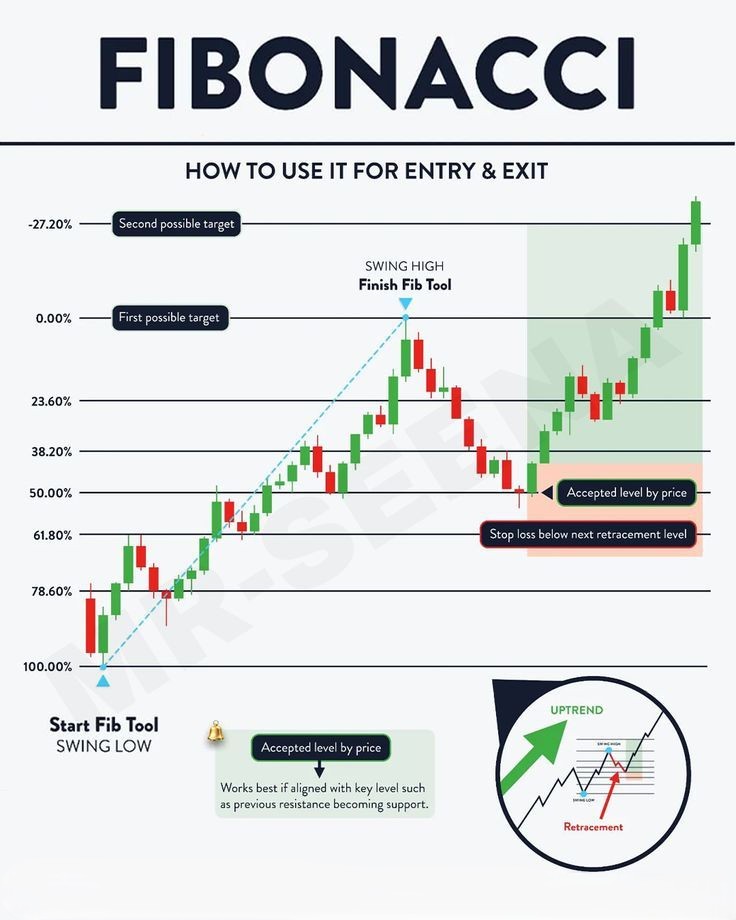
Key Fibonacci Retracement Levels
The most commonly used levels are:
- 23.6%
- 38.2%
- 50% (not a true Fibonacci ratio, but widely used)
- 61.8% ⭐ (Golden Ratio)
- 78.6%
These levels indicate how much of a previous price move has been retraced.
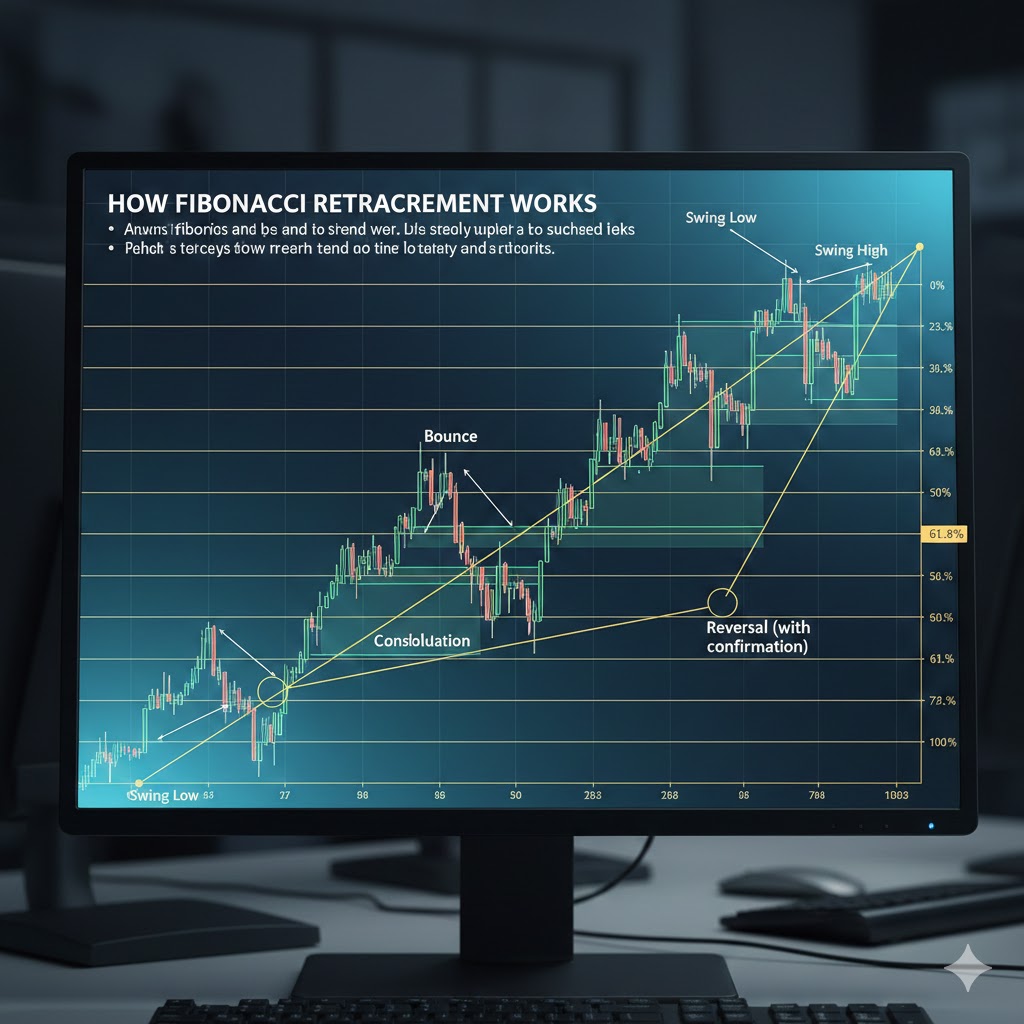
How Fibonacci Retracement Works
- Identify a clear trend
- Uptrend → draw from swing low to swing high
- Downtrend → draw from swing high to swing low
- The tool plots horizontal lines at Fibonacci levels
- Price often reacts at these levels:
- Bounce
- Consolidation
- Reversal (with confirmation)
Why Traders Use Fibonacci Retracement
- To find entry points
- To identify support & resistance
- To set stop-loss and take-profit levels
- To trade pullbacks instead of chasing price
Important Notes
- Fibonacci works best when combined with:
- Trendlines
- Support & resistance
- Candlestick patterns
- RSI / MACD
- It does not guarantee reversals
- Confirmation is essential
Summary
Fibonacci Retracement helps traders identify where price may pause or reverse during a correction within a trend.
