Elliott Wave Theory is a form of technical analysis that explains market price movements as repeating wave patterns driven by investor psychology—the natural cycle of optimism and pessimism in financial markets.
It was developed in the 1930s by Ralph Nelson Elliott.
Core Idea
Markets move in predictable cycles. These cycles appear as waves that repeat across different timeframes (minutes, hours, days, years).
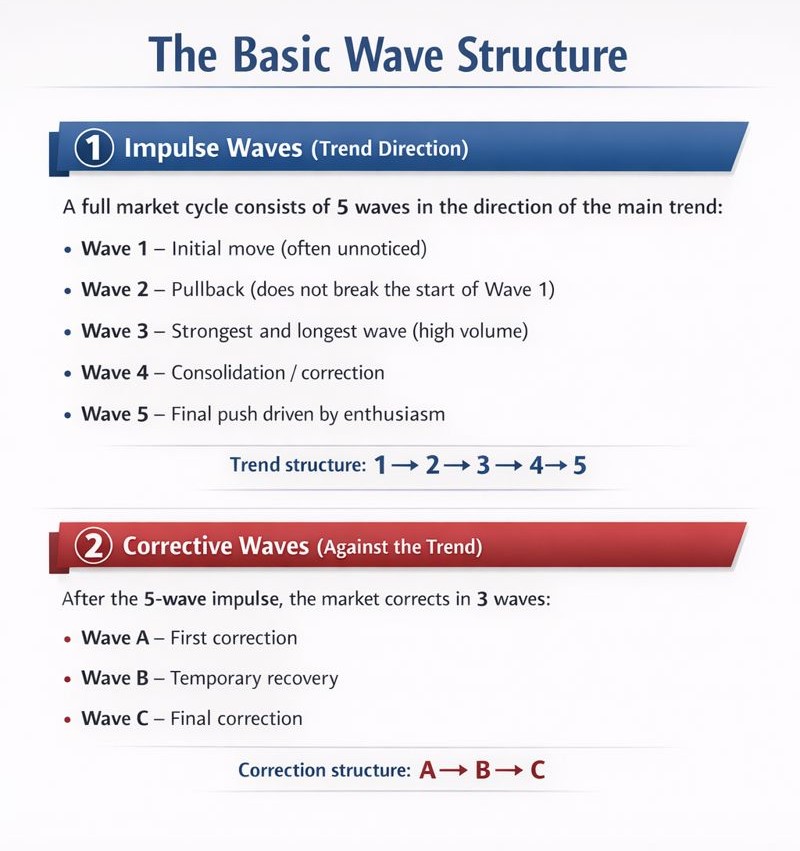
Key Rules of Elliott Wave
These rules must never be violated:
- Wave 2 cannot retrace more than 100% of Wave 1
- Wave 3 is never the shortest among Waves 1, 3, and 5
- Wave 4 cannot overlap the price territory of Wave 1 (in most markets)
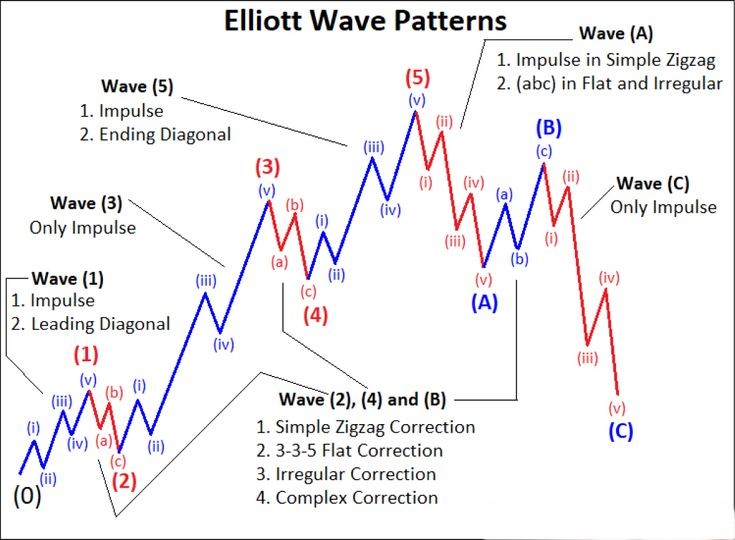
Fractals & Timeframes
Elliott Waves are fractal:
- A wave on a daily chart contains smaller waves on an hourly chart
- The same structure appears on any timeframe
Common Tools Used with Elliott Wave
- Fibonacci retracements & extensions
- Trendlines
- Momentum indicators (RSI, MACD)
- Volume analysis
Where Elliott Wave Theory Is Used
It is commonly applied in:
- 📈 Stock markets
- 💱 Forex
- 🪙 Crypto
- 🛢️ Commodities
- 📉 Futures & CFDs
Especially popular for swing trading and trend forecasting.
In Simple Terms
Elliott Wave Theory says that markets move in waves because people think and act in patterns.
