Continuation Patterns are technical chart patterns that signal a temporary pause or consolidation in the market before the price continues in the same direction as the existing trend.
The trend takes a break — then continues.
Why Continuation Patterns Matter
Traders use them to:
- Identify trend-following entry points
- Add positions during pullbacks or consolidation
- Set clear breakout levels
- Manage risk more effectively
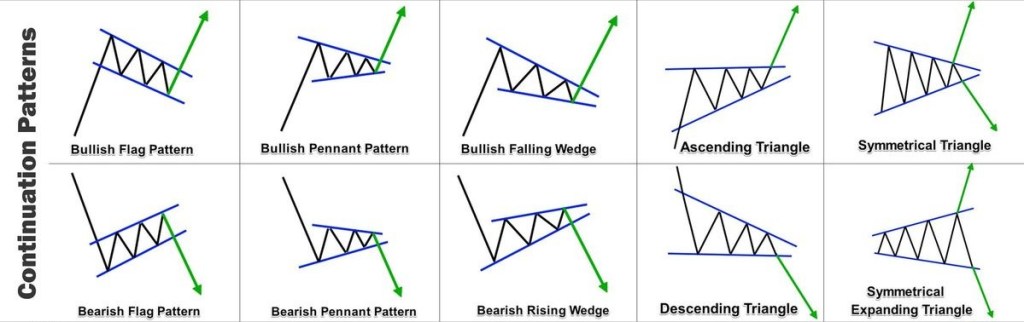
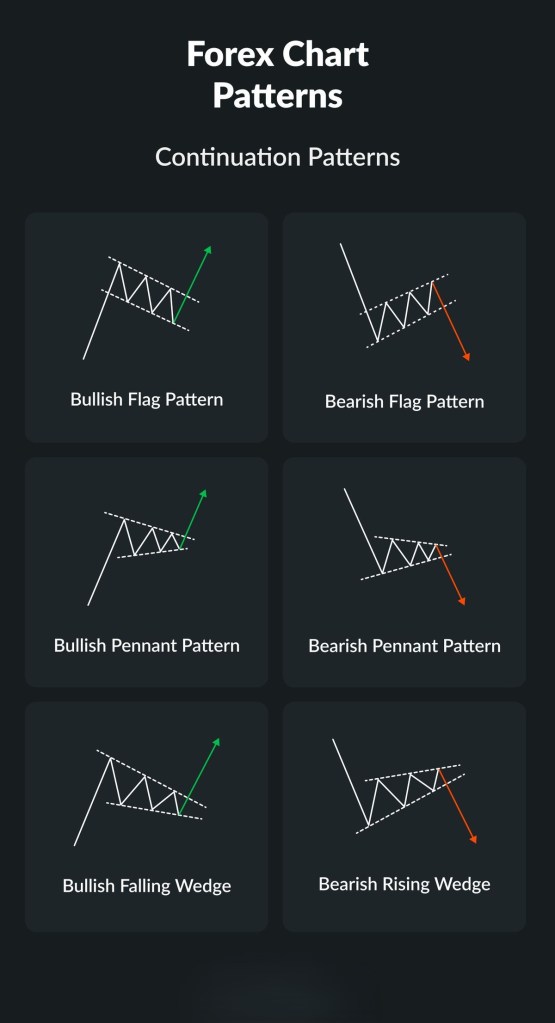
Common Types of Continuation Patterns
1️⃣ Flags
- Short-term consolidation after a strong move
- Slopes against the main trend
- Indicates strong momentum continuation
📌 Bull Flag / Bear Flag
2️⃣ Pennants
- Small symmetrical triangle after a sharp move
- Decreasing volume during consolidation
- Breakout usually follows the prior trend
3️⃣ Triangles
- Ascending Triangle → bullish continuation
- Descending Triangle → bearish continuation
- Symmetrical Triangle → continuation or breakout (needs confirmation)
4️⃣ Rectangles (Trading Range)
- Price moves between horizontal support and resistance
- Breakout direction usually follows the previous trend
5️⃣ Wedges (in some cases)
Falling wedge → bullish continuation
(context is very important)
Rising wedge → bearish continuation
Key Characteristics
✔ Occur mid-trend
✔ Volume often declines during consolidation
✔ Breakout volume typically expands
✔ Best used with trend confirmation tools
Continuation vs Reversal Patterns
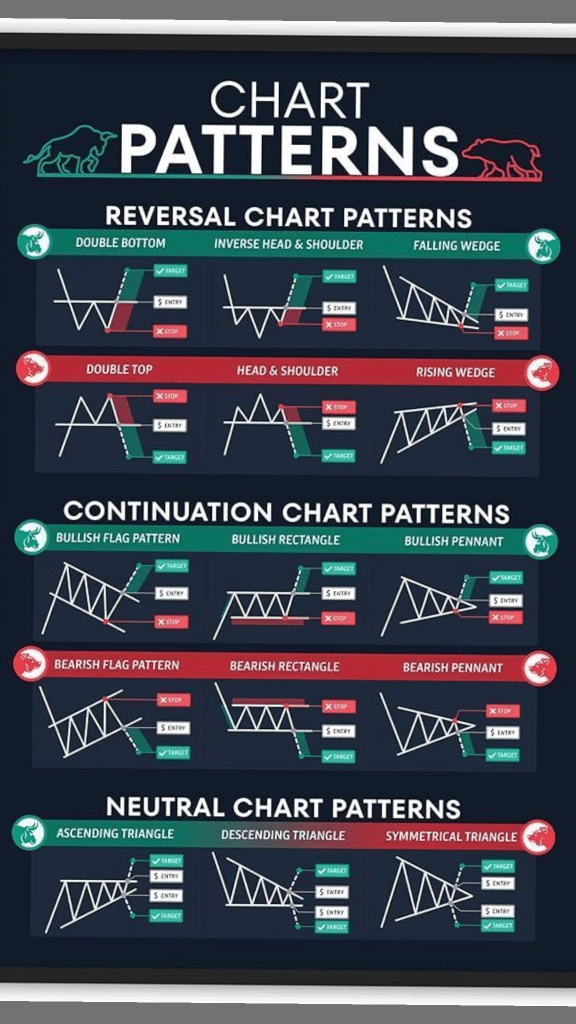
Best Confirmation Tools
- Trendlines
- Support & Resistance
- Volume
- Moving Averages
- Fibonacci levels
Key Takeaway
Continuation patterns help traders stay with the trend rather than fight it.
They work best when aligned with strong trend structure and volume confirmation.
