The cryptocurrency market has reinforced its consolidation bias toward the end of the year, with total market capitalization fluctuating within a narrow 10% range over the past month. Bitcoin remains the anchor of this sideways movement, recording a modest 2% gain during the same period.
Ethereum, while up nearly 6% over the last 30 days, continues to trade within a descending channel, suggesting that upside momentum remains constrained.
Among major altcoins, XRP and Dogecoin (DOGE) have slid toward critical support zones amid subdued trading volumes. Both assets have posted 7–8% monthly losses, highlighting persistent bearish pressure across the broader altcoin market.
Ethereum Retests Key Support Area, Eyeing Potential Trend Reversal
On the Ethereum front, the broader technical outlook remains shaped by a descending price structure. Following the bullish channel established during the summer months, renewed selling pressure from higher levels has driven ETH into a well-defined falling channel.
In recent sessions, price action has attempted to push toward the upper boundary of this channel, but these upside moves have consistently failed to secure sustained closes above short-term moving averages (EMA 8 and EMA 21). As a result, while the current structure may still allow for a short-term corrective rebound, a decisive breakout—backed by stronger volume and fundamental catalysts—would be required to confirm a meaningful trend reversal.
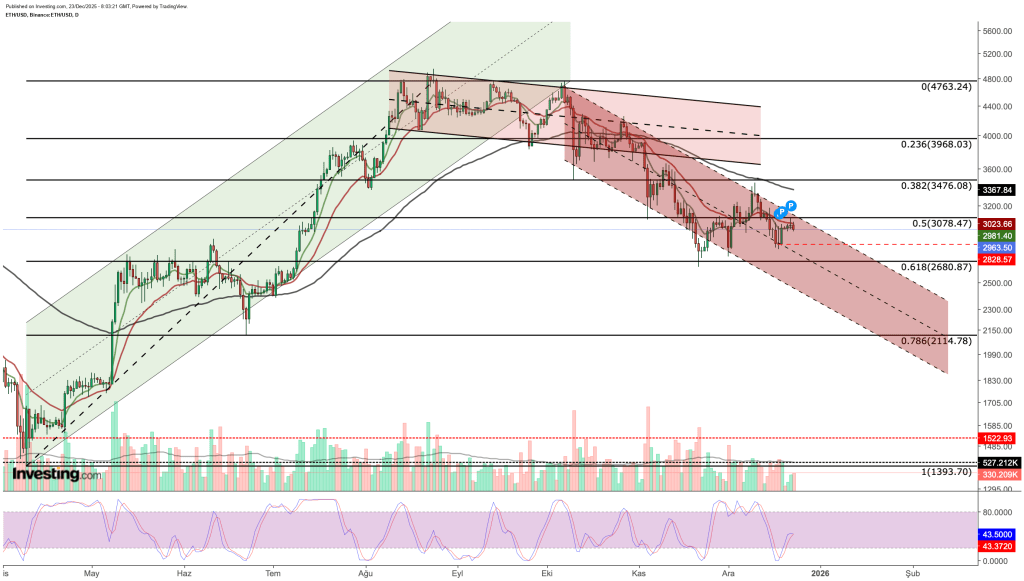
Fibonacci retracement levels provide additional clarity within this technical framework. The $3,080 area, which aligns with the 50% Fibonacci retracement, represents a key inflection zone, as it coincides with both a horizontal resistance level and the upper boundary of the descending channel.
Further upside, the $3,370–3,480 region—where the three-month EMA converges with the 38.2% Fibonacci level—stands out as the second major resistance zone that would need to be reclaimed to validate a broader trend reversal. From a momentum perspective, the Stochastic RSI has begun to turn higher, although it continues to display fragility near resistance, suggesting that bullish momentum remains tentative.
Key Levels (Daily Chart)
Resistance
- $3,080 – Fib 0.50 / upper channel boundary
- $3,370–3,480 – EMA confluence / Fib 0.382
- $3,968 – Fib 0.236
Support
- $2,680 – Channel midline / Fib 0.618
- $2,115 – Fib 0.786 / lower channel area
Technical Outlook
Based on the current support–resistance structure, a daily close above $3,080 could open the door for a renewed momentum push toward the $4,000 psychological level, contingent on the strength and follow-through of the breakout.
Conversely, another rejection from the upper band of the falling channel would likely shift focus back to the $2,680 support zone. Should bearish pressure intensify, a deeper pullback toward the $2,100 area, aligned with the lower boundary of the channel, cannot be ruled out.
DOGE Seeks Bounce at $0.11 Following Key Trend Breakout
On the weekly chart, DOGE broke below its long-standing rising trendline support in November, marking a clear shift toward a bearish technical structure. This breakdown led the price to fill the gap created during the sharp sell-off in early October, signaling sustained downward momentum and increased selling pressure.
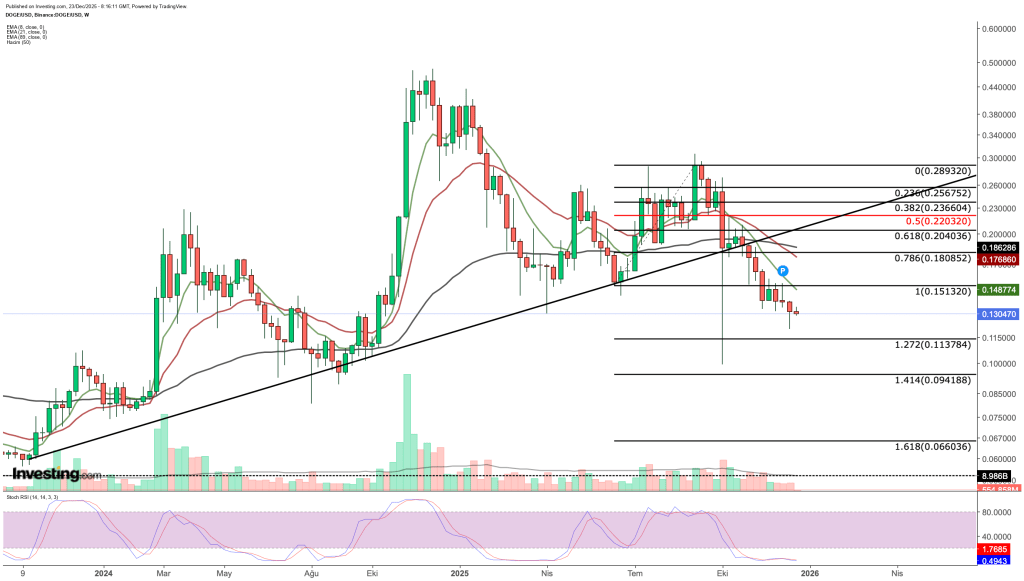
The Stochastic RSI has been signaling extended oversold conditions as DOGE continues its downtrend toward the critical $0.11 support area (aligned with the Fibonacci 1.272 level). This convergence of oversold momentum and proximity to a key support increases the likelihood of a short- to medium-term price reaction.
If DOGE successfully holds support around $0.11, it could initiate a recovery attempt toward the $0.15 resistance level. A sustained break above $0.15 would likely pave the way for renewed bullish momentum targeting the $0.18–$0.20 zone.
On the other hand, a decisive break below $0.11 could intensify bearish pressure, shifting focus to support levels below $0.10 over the medium term. Therefore, weekly closes above approximately $0.1137 have become critical for any meaningful trend reversal in DOGE.
XRP Battles to Hold Crucial Weekly Support Amid Bearish Pressure
The weekly outlook for XRP remains bearish as the price stays below the descending trendline and continues to trade under the 8- and 21-week EMAs. Currently, XRP is testing a crucial support zone that has held firm throughout the year.
The $1.95 area emerges as a key support level, aligning closely with both the 50% Fibonacci retracement and the 89-week EMA, supported by recent price rebounds.
If XRP fails to hold this support, which has been defended by weekly closes so far, the likelihood of a further decline toward the 61.8% Fibonacci support near $1.60 increases significantly.
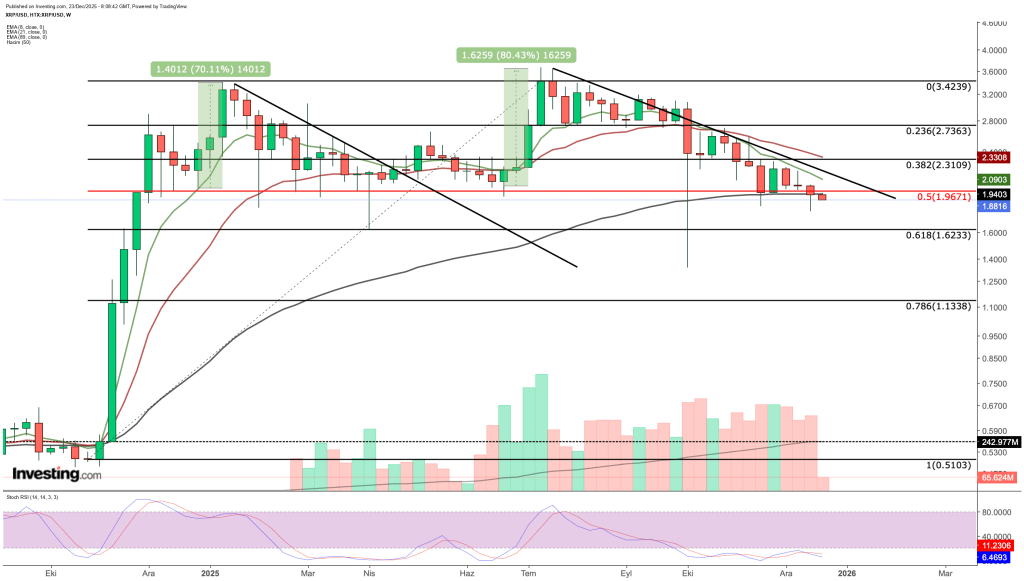
On the other hand, a weekly close above $1.95 could trigger renewed buying interest. This reactionary buying may help XRP regain momentum, potentially driving the price toward the $2.30 resistance level, and if sustained, pushing further up to the $2.70 zone in the near term.
Sources: Investing
